 filings.tools
Airbnb 10-K 2023-12-31
Filed 2024-02-16. 24 sections, 654K characters. Original on sec.gov · Markdown · JSON
Cover and table of contents
UNITED STATES
SECURITIES AND EXCHANGE COMMISSION
WASHINGTON, D.C. 20549
FORM 10-K
(Mark One)
| ☒ | ANNUAL REPORT PURSUANT TO SECTION 13 OR 15(d) OF THE SECURITIES EXCHANGE ACT OF 1934 |
For the fiscal year ended December 31, 2023
OR
| ☐ | TRANSITION REPORT PURSUANT TO SECTION 13 OR 15(d) OF THE SECURITIES EXCHANGE ACT OF 1934 | ||||
| For the transition period from_____ to _____ |
Commission File Number: 001-39778

Airbnb, Inc.
(Exact Name of Registrant as Specified in Its Charter)
| Delaware | 26-3051428 | |||||||
| (State or Other Jurisdiction of Incorporation or Organization) | (I.R.S. Employer Identification No.) |
888 Brannan Street
San Francisco, California 94103
(Address of Principal Executive Offices)(Zip Code)
(415) 510-4027
(Registrant’s Telephone Number, Including Area Code)
| Securities registered pursuant to Section 12(b) of the Act: | ||||||||
| Title of Each Class | Trading Symbol(s) | Name of Each Exchange on Which Registered | ||||||
| Class A common stock, par value $0.0001 per share | ABNB | The Nasdaq Stock Market |
Securities registered pursuant to Section 12(g) of the Act:
None
Indicate by check mark if the registrant is a well-known seasoned issuer, as defined in Rule 405 of the Securities Act. Yes ☒ No ☐
Indicate by check mark if the registrant is not required to file reports pursuant to Section 13 or Section 15(d) of the Exchange Act. Yes ☐ No ☒
Indicate by check mark whether the registrant (1) has filed all reports required to be filed by Section 13 or 15(d) of the Securities Exchange Act of 1934 during the preceding 12 months (or for such shorter period that the registrant was required to file such reports), and (2) has been subject to such filing requirements for the past 90 days. Yes ☒ No ☐
Indicate by check mark whether the registrant has submitted electronically every Interactive Data File required to be submitted pursuant to Rule 405 of Regulation S-T (§ 232.405 of this chapter) during the preceding 12 months (or for such shorter period that the registrant was required to submit such files). Yes ☒ No ☐
Indicate by check mark whether the registrant is a large accelerated filer, an accelerated filer, a non-accelerated filer, a smaller reporting company, or an emerging growth company. See the definitions of “large accelerated filer,” “accelerated filer,” “smaller reporting company” and “emerging growth company” in Rule 12b-2 of the Exchange Act.
| Large accelerated filer | ☒ | Accelerated filer | ☐ | |||||||||||
| Non-accelerated filer | ☐ | Smaller reporting company | ☐ | |||||||||||
| Emerging growth company | ☐ |
If an emerging growth company, indicate by check mark if the registrant has elected not to use the extended transition period for complying with any new or revised financial accounting standards provided pursuant to Section 13(a) of the Exchange Act. ☐
Indicate by check mark whether the registrant has filed a report on and attestation to its management’s assessment of the effectiveness of its internal control over financial reporting under Section 404(b) of the Sarbanes-Oxley Act (15 U.S.C. 7262(b)) by the registered public accounting firm that prepared or issued its audit report. ☒
If securities are registered pursuant to Section 12(b) of the Act, indicate by check mark whether the financial statements of the registrant included in the filing reflect the correction of an error to previously issued financial statements. ☐
Indicate by check mark whether any of those error corrections are restatements that required a recovery analysis of incentive-based compensation received by any of the registrant’s executive officers during the relevant recovery period pursuant to §240.10D-1(b). ☐
Indicate by check mark whether the registrant is a shell company (as defined in Rule 12b-2 of the Exchange Act). Yes ☐ No ☒
As of June 30, 2023, the aggregate market value of the Class A common stock held by non-affiliates of the registrant was approximately $52.8 billion based upon the closing price reported for such date on the NASDAQ Global Select Market.
As of February 2, 2024, 438,087,239 shares of the registrant's Class A common stock were outstanding 199,777,430 shares of the registrant's Class B common stock were outstanding, no shares of the registrant’s Class C common stock were outstanding, and 9,200,000 shares of the registrant’s Class H common stock were outstanding.
DOCUMENTS INCORPORATED BY REFERENCE
The information required by Part III of this Annual Report on Form 10-K, to the extent not set forth herein, is incorporated herein by reference from the registrant’s definitive proxy statement relating to the Annual Meeting of Shareholders to be held in 2024, which definitive proxy statement shall be filed with the Securities and Exchange Commission within 120 days after the end of the fiscal year to which this Annual Report on Form 10-K relates.
AIRBNB, INC.
TABLE OF CONTENTS
Special Note Regarding Forward-Looking Statements
This Annual Report on Form 10-K contains forward-looking statements, within the meaning of the Private Securities Litigation Reform Act of 1995, about us and our industry that involve substantial risks and uncertainties. All statements other than statements of historical facts contained in this Annual Report on Form 10-K, including statements regarding our strategy, future financial condition, future operations, projected costs, prospects, plans, objectives of management, and expected market growth, are forward-looking statements. In some cases, you can identify forward-looking statements because they contain words such as “may,” “will,” “shall,” “should,” “expects,” “plans,” “anticipates,” “could,” “intends,” “target,” “projects,” “contemplates,” “believes,” “estimates,” “predicts,” “potential,” “goal,” “objective,” “seeks,” or “continue” or the negative of these words or other similar terms or expressions that concern our expectations, strategy, plans, or intentions. Forward-looking statements contained in this Annual Report on Form 10-K include, but are not limited to, statements about:
-
the effects of macroeconomic conditions, including inflation, slower growth or recession, higher interest rates, high unemployment, and foreign currency fluctuations, on the demand for travel or similar experiences;
-
the effects of fluctuations in demand for Host homes, including lower demand in certain areas or as a result of oversupply in others;
-
the effects of supply constraints on availability of Host homes;
-
our ability to attract and retain Hosts and guests;
-
our ability to effectively manage our exposure to fluctuations in foreign currency exchange rates;
-
the impact of the ongoing armed conflicts around the world on our business;
-
our expectations regarding our financial performance, including our revenue, costs, Adjusted Earnings Before Interest, Taxes, Depreciation, and Amortization, and Free Cash Flow;
-
our expectations regarding future operating performance, including Nights and Experiences Booked, Gross Booking Value (“GBV”), Average Daily Rate, and GBV per Night and Experience Booked;
-
our ability to compete in our industry;
-
our expectations regarding the resilience of our model, including in areas such as domestic travel, short-distance travel, travel outside of top cities, and long-term stays;
-
our ability to stay in compliance with laws and regulations that currently apply or may become applicable to our business, both in the United States and internationally, and our expectations regarding various laws and restrictions that relate to our business;
-
seasonality, including the return of pre-COVID-19 pandemic patterns of seasonality, and the effects of seasonal trends on our results of operations;
-
our expectations regarding the impact of our marketing strategy, and our ability to continue to attract guests and Hosts to our platform through direct and unpaid channels;
-
anticipated trends, developments, and challenges in our industry, business, and the highly competitive markets in which we operate;
-
our ability to anticipate market needs or develop new or enhanced offerings and services to meet those needs;
-
our ability to manage expansion into international markets and new businesses;
-
laws, regulations, and rules that affect the short-term rental, long-term rental, and home sharing business that have limited and may continue to limit the ability or willingness of Hosts to share their spaces over our platform and expose our Hosts or us to significant fees or penalties;
-
the lingering effects of the COVID-19 pandemic, as well as other highly infectious diseases such as influenza or respiratory syncytial virus, on our business, the travel industry, travel trends, and the global economy generally;
-
the impact on our income as a result of the release of valuation allowances on deferred tax assets;
-
our expectations regarding lodging tax obligations and other non-income tax matters;
-
our expectations regarding our income tax liabilities, including anticipated increases in foreign taxes, valuation allowances, and the adequacy of our reserves;
-
our ability to effectively manage our growth and expand our infrastructure and our ability to maintain our corporate culture and our employee initiatives;
-
the safety, affordability, and convenience of our platform and our offerings;
-
our ability to successfully defend litigation brought against us;
-
the sufficiency of our cash, cash equivalents, and investments to meet our liquidity needs;
-
our ability to maintain, protect, and enhance our intellectual property;
-
our ability to make required payments under our credit agreement and to comply with the various requirements of our indebtedness;
-
human capital management, including our Live and Work Anywhere policy and diversity and belonging initiatives and commitments;
-
environmental, social, and governance (“ESG”) matters, including potential impacts of environmental risks, including climate change, on our business, and our net-zero emissions and climate-related initiatives and commitments; and
-
our plan to make distributions to our Host Endowment Fund.
We caution you that the foregoing list does not contain all of the forward-looking statements made in this Annual Report on Form 10-K. You should not rely upon forward-looking statements as predictions of future events. We have based the forward-looking statements contained in this Annual Report on Form 10-K primarily on our current expectations, estimates, forecasts, and projections about future events and trends that we believe may affect our business, results of operations, financial condition, and prospects. Although we believe that we have a reasonable basis for each forward-looking statement contained in this Annual Report on Form 10-K, we cannot guarantee that the future results, levels of activity, performance, or events and circumstances reflected in the forward-looking statements will be achieved or occur at all. The outcome of the events described in these forward-looking statements is subject to risks, uncertainties, and other factors described in the section titled “Item 1A. Risk Factors” in Part I and elsewhere in this Annual Report on Form 10-K. Moreover, we operate in a highly competitive and rapidly changing environment. New risks and uncertainties emerge from time to time, and it is not possible for us to predict all risks and uncertainties that could have an impact on the forward-looking statements contained in this Annual Report on Form 10-K. The results, events, and circumstances reflected in the forward-looking statements may not be achieved or occur, and actual results, events, or circumstances could differ materially from those described in the forward-looking statements.
The forward-looking statements made in this Annual Report on Form 10-K relate only to events as of the date on which the statements are made available. We undertake no obligation to update any forward-looking statements made in this Annual Report on Form 10-K to reflect events or circumstances after the date of this Annual Report on Form 10-K or to reflect new information or the occurrence of unanticipated events, except as required by law. We may not actually achieve the plans, intentions, or expectations disclosed in our forward-looking statements, and you should not place undue reliance on our forward-looking statements. Our forward-looking statements do not reflect the potential impact of any future acquisitions, mergers, dispositions, joint ventures, or investments we may make.
We include certain voluntary ESG disclosures on our website and herein. Any references to “materiality” in the context of such ESG disclosures and any related assessment of ESG “materiality” may differ from the definition of “materiality” under the federal securities laws for SEC reporting purposes. Furthermore, much of this information is subject to assumptions, estimates or third-party information that is still evolving and subject to change, including the standards and expectations regarding greenhouse gas (“GHG”) accounting and the processes for classifying, measuring, and counting GHG emissions and GHG emission reductions, which are evolving. Similarly, we cannot guarantee strict adherence to standard recommendations, and our disclosures based on any standards may change due to revisions in framework or legal requirements, availability of information, changes in our business or applicable government policies, or other factors, some of which may be beyond our control. Finally, any website or document references included herein are for convenience only and, unless indicated otherwise, are explicitly not incorporated by reference.
In addition, statements that “we believe” and similar statements reflect our beliefs and opinions on the relevant subject. These statements are based upon information available to us as of the date of this Annual Report on Form 10-K, and while we believe such information forms a reasonable basis for such statements, such information may be limited or incomplete, and our statements should not be read to indicate that we have conducted an exhaustive inquiry into, or review of, all potentially available relevant information. These statements are inherently uncertain, and you are cautioned not to unduly rely upon these statements.
You should read this Annual Report on Form 10-K and the documents that we reference in this Annual Report on Form 10-K and have filed as exhibits to this Annual Report on Form 10-K, completely and with the understanding that our actual future results may be materially different from what we expect. We qualify all of the forward-looking statements in this Annual Report on Form 10-K by these cautionary statements.
Risk Factors Summary
The following is a summary of the principal risks that could materially adversely affect our business, results of operations, and financial condition, all of which are more fully described in Part 1 in the section titled “Item 1A. Risk Factors” in this Annual Report on Form 10-K. This summary should be read in conjunction with the “Item 1A. Risk Factors” section and should not be relied upon as an exhaustive summary of the material risks facing our business.
-
Our revenue growth rate has slowed over time, and we expect it to continue to slow in the future.
-
If we fail to retain existing Hosts or add new Hosts, or if Hosts fail to provide high-quality stays and experiences, our business, results of operations, and financial condition would be materially adversely affected.
-
If we fail to retain existing guests or add new guests, our business, results of operations, and financial condition would be materially adversely affected.
-
If our new offerings and initiatives are unsuccessful, we may fail to grow, and our business, results of operations, and financial condition would be materially adversely affected.
-
Any decline or disruption in the travel and hospitality industries or economic downturn could materially adversely affect our business, results of operations, and financial condition.
-
The business and industry in which we participate are highly competitive, and we may be unable to compete successfully with our current or future competitors.
-
We are subject to a wide variety of laws, regulations, and rules applicable to short-term rental and home sharing businesses, or that govern our business practices.
-
If we are unable to successfully expand our global network or manage the risks presented by our business model internationally, our business, results of operations, and financial condition would be materially adversely affected.
-
Changes in tax laws or tax rulings could materially affect our results of operations and financial condition.
-
We may have exposure to greater than anticipated income tax liabilities.
-
Uncertainty in the application of taxes to our Hosts, guests, or platform could increase our tax liabilities and may discourage Hosts and guests from conducting business on our platform.
-
Our ability to use our net operating loss carryforwards and certain other tax attributes may be limited.
-
Our use of artificial intelligence, machine learning, and automated decision making gives rise to legal, business, and operational risks.
-
We may experience significant fluctuations in our results of operations, which make it difficult to forecast our future results.
-
We could face liability for information or content on or accessible through our platform.
-
Maintaining and enhancing our brand and reputation is critical to our growth, and negative publicity could damage our brand.
-
Our share price has been, and may continue to be, volatile, and the value of our Class A common stock may decline.
-
The multi-series structure of our common stock has the effect of concentrating voting control with certain holders of our common stock, including our directors, executive officers, and 5% stockholders and their respective affiliates.
PART I
Item 1. Business
Overview
We are a community based on connection and belonging—a community that was born in 2007 when two Hosts welcomed three guests to their San Francisco home, and has since grown to over 5 million Hosts who have welcomed over 1.5 billion guest arrivals in almost every country and region across the globe. Every day, Hosts offer unique stays and experiences that make it possible for guests to connect with communities in a more authentic way.
Airbnb has five stakeholders and is designed with all of them in mind. Along with employees and shareholders, we serve Hosts, guests, and the communities in which they live. We intend to make long-term decisions considering all of our stakeholders because their collective success is key for our business to thrive.
A Resilient Model
We believe we are well positioned for the road ahead due to our adaptability and relentless innovation. Our business model is adaptable. We have nearly every type of space in nearly every location, so however travel changes, we are able to adapt. Regardless of the economic environment, our guests come to Airbnb because they can find great value, and our Hosts can earn income. We’ve relentlessly innovated while also staying focused and disciplined.
Our Long-Term Growth Strategy
Our strategy is to continue to invest in our key strengths:
-
Make hosting mainstream. We’re focused on making hosting just as popular as traveling on Airbnb. We will continue to invest in growing the size and quality of our Host community. We plan to attract more Hosts globally by expanding use cases and supporting all different types of Hosts, including those who host occasionally. We will also continue to increase the support that we provide to our Hosts to deliver high-quality stays and experiences for guests. We’ll continue to raise awareness around hosting, make it easier to get started, and improve the overall experience for Hosts.
-
Grow and engage our guest community. We intend to continue to attract new guests to Airbnb and will continue to focus on engaging our existing guests to return to book and to use Airbnb with more frequency. With new behaviors developed during the COVID-19 pandemic, we believe the ways that people approach work, living, and travel have fundamentally changed. We believe there will be further opportunities to enhance our offerings based on these new behaviors and attract more guests to our platform.
-
Perfect the core service. Our innovations are focused on improving our Host and guest experiences, making Airbnb more accessible and appealing for new Hosts and guests and driving increased engagement and loyalty with our existing community. Two years ago, we started doing twice-a-year product releases to address feedback from our existing community. Since then, we’ve launched more than 430 new features and upgrades to our core service. In the past year alone, this included improved customer service, total price display, and new tools to help Hosts set more competitive prices. We intend to continue to invest in our brand to educate new Hosts and guests on the benefits of Airbnb and the uniqueness of our offerings. We will continue to leverage our brand through a cohesive and integrated marketing strategy through our two annual product launches.
-
Expand our global network. We’ve made significant progress over the past three years to build a strong and profitable business. In addition to laying the foundation for differentiated offerings for our Hosts and guests, we’ve been focused on international expansion. We are investing in under-penetrated international markets and have seen strong results. We plan to continue to expand our global network and partner with communities to update laws and regulations for short-term rentals to allow more Hosts to join our platform.
Our Platform
Our Platform for Hosts
We built our platform to seamlessly onboard new Hosts, especially those who previously had not considered hosting. We partner with Hosts throughout the process of setting up their listing and provide them with a robust suite of tools to successfully manage their listings, including scheduling, merchandising, integrated payments, community support, Host protections, pricing guidance, and feedback from reviews. During 2023, we launched new pricing tools to help Hosts set competitive prices, easily add weekly and monthly discounts, and compare their listing to similar ones in their area.
We count the number of Hosts on our platform based on the number of users with available listings, defined as accommodations and experiences that are viewable on our platform (excluding HotelTonight), as of a certain date. We consider a listing of a home or an experience to be an "active listing" if it is viewable on Airbnb and has been previously booked at least once on Airbnb (excluding HotelTonight).
Our Platform for Guests
Our website and mobile apps provide our guests with an engaging way to explore a wide variety of unique homes and experiences and an easy way to book them. To better meet the needs of our guests, we have launched a series of new features and upgrades through our biannual product releases to help guests find affordable, high quality and reliable stays across the platform.
Our System of Trust
The system for trust that we have designed includes the following components: Host and guest reviews, account protection, risk scoring, secure payments, a nondiscrimination policy, watchlist and background checks in certain jurisdictions, cleanliness, fraud and scam prevention, insurance and similar protections, booking restrictions, an urgent safety line, a 24/7 neighborhood support line, and a guest refund policy.
We offer top-to-bottom protection for our Hosts through AirCover for Hosts. AirCover for Hosts includes, among other features, guest property damage protection of up to $3 million per stay, liability coverage to Hosts of up to $1 million per occurrence in the event of third-party claims of personal injury or property damage, deep cleaning protection, and pet damage protection.
We also offer AirCover for guests, which provides support for serious issues with a booking or during a stay, including Host cancellations, inability to check-in, inaccurate listings, and a 24-hour safety support line.
We have new initiatives under development and will continue to create additional features to strengthen the trust and safety on our platform.
Our Technology
Our technology platform powers our two-sided marketplace and enables our global network of Hosts and guests. As of December 31, 2023, we had more than 2,000 engineers within our product development organization. Given the nature of the business, our technology platform has broad and complex requirements:
-
Support of global payments. It supports global payment capabilities and sophisticated anti-fraud and anti-money-laundering measures.
-
Delivery of global community support. It provides multilingual, real-time community safety and support, and city-specific regulatory support.
-
Delivery of deep business insights. It delivers deep business intelligence insights to manage our marketplace, including pricing insights and occupancy optimization for our Hosts.
-
Incorporation of artificial intelligence (“AI”)/machine learning. It incorporates sophisticated AI to power key areas, from fraud detection, to personalized listing matching and enabling customized and real-time community support.
-
Operation of a microservices architecture. We operate a microservices architecture and are evolving our foundational components to enable us to move rapidly in response to evolving customer needs without sacrificing correctness or stability.
As we continue to evolve our foundational technology, we are focused on the following broad capabilities:
-
Data management systems that continue to support user privacy, analytics, machine learning/AI, and business insights.
-
Service reliability leading to best-in-class performance centered on availability, latency, disaster recovery and business continuity, security, testability, observability, operability, and agility.
-
Cloud support focusing on robust capabilities for granular attribution and usage patterns to realize efficiency gains.
These continued technological investments aim to ensure we have a robust platform that allows us to more quickly adapt to the needs of our Hosts and guests around the world and increase the productivity of our product development organization.
Our Marketing
Our marketing strategy includes brand marketing, communications, and performance marketing. Brand marketing increases awareness among potential Hosts and guests, helping them understand the benefits of hosting and booking stays and experiences, and what makes these stays and experiences distinctly Airbnb. Our global communications team works across press, policy, and influencers to share timely and important news about Airbnb. They also oversee the execution of a global consumer, product, corporate, and policy-communications plan that supports our brand strategy and generates considerable press and social media coverage. While performance marketing drives additional traffic from high-intent prospective guests, the strength of the Airbnb brand and our communications strategy allows us to be less reliant on performance marketing.
Human Capital
We consider the management of our global talent to be essential to the ongoing success of our business. As of December 31, 2023, we had 6,907 employees.
As of December 31, 2023, we relied on a global network of approximately 11,000 third-party contingent workers to handle the vast majority of our community support contacts. Our internal community support employees are comprised of operations teams who handle complex and sensitive issues, and enablement teams who support all community-facing teams, including our partners.
Attracting, recruiting, developing, and retaining diverse talent enables us to provide our Hosts and guests with innovative products and services as well as serve our other stakeholders. As of December 31, 2023, 49% of our global employees identify in the gender binary as women and 16% of our U.S.-based employees identify as under-represented minorities. Through our hiring process, we commit to encouraging diversity and eliminating bias, and we publish the changing demographic makeup of our workforce to hold ourselves accountable. We are also focused on supporting our employees across the employee lifecycle from recruitment to onboarding to ongoing development.
Our Live and Work Anywhere policy allows for the vast majority of our employees to work remotely on a permanent basis. We believe that expanding our talent pool beyond the commuting radius near our offices will allow us to attract the best and most diverse employees over time. We aim to create a highly coordinated working culture, and as such, will continue to promote ways to keep employees highly engaged and connected by aligning employees’ work through our roadmap, as well as curating employee collaboration sessions either in the office or at off-site locations.
Climate Change
In 2021, we committed to a goal to operate as a net zero company for our global corporate operations by 2030, reducing greenhouse gas emissions associated with our corporate operations across Scope 1 (direct emissions from stationary combustion and refrigerants), Scope 2 (indirect emissions from purchased electricity, diesel generators and district heat), and the following Scope 3 categories defined by the Greenhouse Gas Protocol: purchased goods and services, capital goods, fuel- and energy-related activities (not included in Scope 1 or Scope 2), waste generated in operations, business travel, employee commuting, and upstream leased assets. To meet our goals, we are implementing a broad range of initiatives designed to help decarbonize our business and make our corporate operations more sustainable.
We also purchase, and plan to continue purchasing, carbon credits to fully achieve our emissions goals in the long-term. Our aim is to procure such credits from high integrity projects, with a focus on nature-based solutions where feasible.
Regulations
We are subject to laws, regulations, and rules that affect the short-term rental and home sharing business at city, state, country, and regional levels. While a number of cities and countries have implemented legislation to address short-term rentals, there are many others that are not yet explicitly addressing or enforcing short-term rental laws, and could follow suit and enact regulations. We seek to work with governments to establish clear, fair, and workable home sharing rules to create clarity for our Hosts.
No single city represented more than 2% of our revenue before adjustments for incentives and refunds during the year ended December 31, 2023 or approximately 1% of our active listings as of December 31, 2023. Incentives include our referral programs and marketing promotions to encourage the use of our platform and attract new Hosts and guests, while our refunds to Hosts and guests are part of our support activities. We do not believe that the current regulations in our top 10 cities, in the aggregate, have had or are expected to have a material adverse impact on our results of operations and financial condition. We will continue to collaborate with policymakers to implement sensible legislation around the world.
In addition to laws, regulations, and rules directly applicable to the short-term rental and home sharing business, we are subject to a wide variety of laws, regulations and rules governing our business practices. These include those related to the Internet, e-commerce, and electronic devices, and involving taxation, privacy, data privacy, data security, pricing, content, advertising, discrimination, consumer protection, protection of minors, copyrights, distribution, messaging, mobile communications, use of AI and automated decision making, electronic device certification, electronic waste, electronic contracts, communications, Internet access, competition, and unfair commercial practices. We are also subject to laws, regulations, and rules governing the provision of online payment services, the design and operation of our platform, and the operations, characteristics, and quality of our platform and services. Additionally, we are subject to a variety of taxes and tax collection obligations in the United States (federal, state, and local) and numerous foreign jurisdictions.
Our payments platform is subject to various laws, rules, regulations, policies, legal interpretations, and regulatory guidance, including those governing cross-border and domestic money transmission and funds transfers, stored value and prepaid access, foreign exchange, data privacy, data security, and cybersecurity, banking secrecy, payment services (including payment processing and settlement services), consumer protection, economic and trade sanctions, anti-corruption and anti-bribery, and anti-money laundering and counter-terrorist financing.
Our business collects, processes, and uses the personal data of individuals across the globe. As a result, compliance with laws on data privacy and data security regulating the collection, storage, handling, use, disclosure, transfer, security, and other processing of personal data is core to our strategy and integral to the creation of trust in our platform. We take a variety of technical and organizational security measures and other procedures and protocols designed to protect data, including data pertaining to Hosts, guests, employees, and others.
Legal requirements relating to the collection, storage, handling, use, disclosure, transfer, security and other processing of personal data continue to evolve, and regulatory scrutiny in this area is increasing around the world. This increases the complexity of compliance requirements, may limit offerings, and result in additional expenses while also diverting attention and resources from other projects. Regulators around the world continue to propose more stringent data privacy and data security laws, and these laws are rapidly increasing in number, complexity, enforcement, fines, and penalties. Data privacy and data security laws and their interpretations continue to develop and may be inconsistent from jurisdiction to jurisdiction.
As we continue to expand the reach of our brand into additional markets, we will be increasingly subject to additional laws, regulations, and rules.
For additional information regarding these and other laws, regulations, and rules that affect us and our business, see Note 13, Commitments and Contingencies – Legal and Regulatory Matters – Regulatory Matters, to our consolidated financial statements included in Item 8 of Part I of this Annual Report on Form 10-K and Item 1A. Risk Factors of Part I of this Annual Report on Form 10-K.
Seasonality
Our business is seasonal, reflecting typical travel behavior patterns over the course of the calendar year. In a typical year, the first, second, and third quarters have higher Nights and Experiences Booked than the fourth quarter, as guests plan for travel during the peak travel season, which is in the third quarter for North America and Europe, the Middle East, and Africa (“EMEA”). Our key business metrics, including Gross Booking Value (“GBV”) and Adjusted Earnings Before Interest, Taxes, Depreciation, and Amortization (“EBITDA”), can also be impacted by the timing of holidays and other events. We experience seasonality in our GBV that is generally consistent with the seasonality of Nights and Experiences Booked. Revenue and Adjusted EBITDA have historically been, and are expected to continue to be, highest in the third quarter when we have the most check-ins, which is the point at which we recognize revenue. Seasonal trends in our GBV impact Free Cash Flow for any given quarter. A significant portion of our costs are relatively fixed across quarters or vary in line with the volume of transactions, and we historically achieve our highest GBV in the first and second quarters of the year with comparatively lower check-ins. As a result, increases in unearned fees typically make our Free Cash Flow and Free Cash Flow as a percentage of revenue the highest in the first two quarters of the year. We typically see a slight decline in GBV and a peak in check-ins in the third quarter, which results in a decrease in unearned fees, a lower sequential decrease in Free Cash Flow, and a greater decline in GBV in the fourth quarter, where Free Cash Flow is typically lower. As our business and travel continues to recover following the COVID-19 pandemic, other seasonal trends may develop, or these existing seasonal trends may become more extreme. See the section titled “Management’s Discussion and Analysis of Financial Condition and Results of Operations — Key Business Metrics and Non-GAAP Financial Measures” included in Item 7 of Part II of this Annual Report on Form 10-K for definitions of our key business metrics.
Competition
We operate in a highly competitive environment. As we seek to expand our community globally, we face competition in attracting Hosts and guests.
Competition for Hosts
We compete to attract and retain Hosts to and on our platform to list their homes and experiences, as Hosts have a range of options for doing so. We compete for Hosts based on many factors including the volume of bookings generated by guests, ease of use of our platform, the service fees we charge, Host protections, such as those included in AirCover for Hosts, and our brand.
Competition for Guests
We compete to attract and retain guests to and on our platform, as guests have a range of options to find and book accommodations and experiences. We compete for guests based on many factors, including unique inventory and availability of listings, the value and all-in cost of Host offerings on our platform relative to other options, our brand, ease of use of our platform, the trust and safety of our platform, and community support.
Our competitors include:
-
Online travel agencies (“OTAs”), such as Booking Holdings (including the brands Booking.com, KAYAK, Priceline.com, and Agoda.com), Expedia Group (including the brands Expedia, Vrbo, HomeAway, Hotels.com, Orbitz, and Travelocity), Trip.com Group (including the brands Ctrip.com, Trip.com, Qunar, Tongcheng-eLong, and SkyScanner), Hopper, Fliggy (a subsidiary of Alibaba), Despegar, MakeMyTrip, and other regional OTAs;
-
Internet search engines, such as Google, including its travel search products, Baidu, and other regional search engines;
-
Listing and meta search websites, such as TripAdvisor, Trivago, Mafengwo, AllTheRooms.com, Hometogo, Holidu, and Craigslist;
-
Hotel chains, such as Marriott, Hilton, Accor, Wyndham, InterContinental, OYO, and Huazhu, as well as boutique hotel chains and independent hotels;
-
Property management companies, such as Vacasa, Sonder, Inspirato, Evolve, Awaze, and other regional property management companies; and
-
Online platforms offering experiences, such as Viator, GetYourGuide, Klook, Traveloka, TUI Musement, and KKDay.
Our Intellectual Property
Our intellectual property is an important component of our business. To establish and protect our proprietary rights, we rely on a combination of patents, trademarks, copyrights, domain names, social media handles, know-how, license agreements, confidentiality procedures, non-disclosure agreements with third parties, employee disclosure and invention assignment agreements, and other intellectual property and contractual rights.
We have a substantial patent portfolio, consisting of issued patents and pending patent applications (“patent assets”) from the United States and multiple foreign jurisdictions. The portfolio includes both organically grown and acquired patent assets. We own a trademark portfolio with protections in 170 countries in which we currently operate for our primary brands — AIRBNB and our Bélo logo. Additionally, we own trademark protections around the world for other brands or protectable brand elements important to our business, including but
not limited to Rausch, our primary corporate color, localizations, translations, and transliterations of our primary brands, and brands associated with businesses we have acquired. We have registered domain names that we use in or relate to our business, such as the airbnb.com domain name and country code top level domain name equivalents.
Available Information
Our website address is www.airbnb.com. Information contained on, or that can be accessed through, our website does not constitute part of this Annual Report on Form 10-K. The U.S. Securities and Exchange Commission (“SEC”) maintains an Internet site that contains reports, proxy and information statements, and other information regarding issuers that file electronically with the SEC at www.sec.gov. Our Annual Reports on Form 10-K, Quarterly Reports on Form 10-Q, Current Reports on Form 8-K and amendments to reports filed or furnished pursuant to Sections 13(a) and 15(d) of the Securities Exchange Act of 1934, as amended, (the “Exchange Act”) are also available free of charge on our investor relations website (investors.airbnb.com) as soon as reasonably practicable after we electronically file such material with, or furnish it to, the SEC.
We webcast our quarterly results calls and certain events we participate in or host with members of the investment community on our investor relations website. Additionally, we provide notifications of news or announcements regarding our financial performance, including SEC filings, investor events, and press and earnings releases, as part of our investor relations website. The contents of these websites are not intended to be incorporated by reference into this Annual Report on Form 10-K or in any other report or document we file.
Item 1A. Risk Factors
Our business, operations, and financial results are subject to various risks and uncertainties, including those described below, that could materially adversely affect our business, results of operations, financial condition, and the trading price of our Class A common stock. The following material factors, among others, could cause our actual results to differ materially from historical results and those expressed in forward-looking statements made by us or on our behalf in filings with the SEC, press releases, communications with investors, and oral statements.
Risks Related to Our Business
Our revenue growth rate has slowed over time, and we expect it to continue to slow in the future.
We have experienced significant revenue growth in the past; however, our revenue growth rate has slowed over time and there is no assurance that historic growth rates will return. Our future revenue growth depends on the growth of supply and demand for listings on our platform, and our business is affected by general economic and business conditions worldwide as well as trends in the global travel and hospitality industries and the short and long-term accommodation regulatory landscape. In addition, we believe that our revenue growth depends upon a number of factors, including:
-
global macroeconomic conditions, including inflation and rising interest rates and recessionary concerns;
-
our ability to retain and grow the number of guests and Nights and Experiences Booked;
-
our ability to retain and grow the number of Hosts and the number of available listings on our platform;
-
events beyond our control such as pandemics and other health concerns, restrictions on travel and immigration, political, social or economic instability, including international disputes, war, or terrorism, trade disputes, economic downturns, and the impact of climate change on travel including the availability of preferred destinations and the increase in the frequency and severity of weather-related events, including fires, floods, droughts, extreme temperatures and ambient temperature increases, severe weather, and other natural disasters, and the impact of other climate change on seasonal destinations;
-
competition;
-
the legal and regulatory landscape and changes in the application of existing laws and regulations or adoption of new laws and regulations that impact our business, Hosts, and/or guests, including changes in short-term occupancy, tax laws, and real estate broker laws;
-
the attractiveness of home sharing to prospective Hosts and guests;
-
the level of consumer awareness and perception of our brand;
-
our ability to build and strengthen trust and safety on our platform and among members of our community;
-
the level of spending on brand and performance marketing to attract Hosts and guests to our platform;
-
our ability to grow new offerings and to deepen our presence in certain geographies;
-
timing, effectiveness, and costs of expansion and upgrades to our platform and infrastructure; and
-
other risks described elsewhere in this Annual Report on Form 10-K.
A softening of demand, whether caused by events outside of our control, challenging macroeconomic and political conditions, changes in Host and guest preferences, public health crises such as pandemics, and any of the other factors described above, in this Annual Report on Form 10-K, or otherwise, may result in decreased revenue and our business, results of operations, and financial condition would be materially adversely affected.
If we fail to retain existing Hosts or add new Hosts, or if Hosts fail to provide high-quality stays and experiences, our business, results of operations, and financial condition would be materially adversely affected.
Our business depends on Hosts maintaining their listings on our platform and engaging in practices that encourage guests to book those listings, including increasing the number of nights and experiences that are available to book, providing timely responses to inquiries from guests, offering a variety of desirable and differentiated listings at competitive prices that meet the expectations of guests, and offering exceptional hospitality, services, and experiences to guests. These practices are outside of our direct control. If Hosts do not establish or maintain a sufficient number of listings and availability for listings, the number of Nights and Experiences Booked declines for a particular period, or the price charged by Hosts declines, our revenue would decline and our business, results of operations, and financial condition would be materially adversely affected.
Hosts manage and control their spaces and experiences and typically market them on our platform with no obligation to make them available to guests for specified dates and with no obligation to accept bookings from prospective guests. We have had many Hosts list their properties on our platform in one period and cease to offer these properties in subsequent periods for a variety of reasons. While we plan to continue to invest in our Host community and in tools to assist Hosts, these investments may not be successful in growing our Hosts and listings on our platform. In addition, Hosts may not establish or maintain listings if we cannot attract prospective guests to our platform and generate bookings from a large number of guests. If we are unable to retain existing Hosts or add new Hosts, or if Hosts elect to market their listings exclusively with a competitor or cross-list with a competitor, we may be unable to offer a sufficient supply and variety of properties or experiences to attract guests to use our platform. In particular, it is critical that we continue to attract and retain individual Hosts who list their spaces, including private rooms, primary homes, or vacation homes, on Airbnb. We attract individual Hosts predominantly through organic channels such as word of mouth and our strong brand recognition. If we are unable to attract and retain individual Hosts in a cost-effective manner, or at all, our business, results of operations, and financial condition would be materially adversely affected.
Professional Hosts, including property management companies, serviced apartment providers, and boutique hotels, expand the types of listings available to our guests. These professional Hosts often list on our platform as well as on the platforms of our competitors. We do not control whether professional Hosts provide us with a sizable allocation of rooms and competitive pricing relative to the same properties
listed with other services. If we are not able to effectively deploy professional tools, application programming interfaces, and payment processes, work with third-party channel managers, and develop effective sales and account management teams that address the needs of these professional Hosts, we may not be able to attract and retain professional Hosts. If our fee structure and payment terms are not as competitive as those of our competitors, these professional Hosts may choose to provide less inventory and availability with us. Historically, we have seen an increase in the number of, and revenue from, professional Hosts on our platform. The uniqueness of listings on our platform will be negatively impacted if the number of individual Hosts does not grow at the same rate.
In addition, the number of listings on Airbnb may decline as a result of a number of other factors affecting Hosts, including: any pandemic; enforcement or threatened enforcement of laws and regulations, including short-term occupancy and tax laws; private groups, such as homeowners, landlords, and condominium and neighborhood associations, adopting and enforcing contracts that prohibit or restrict home sharing; leases, mortgages, and other agreements, or regulations that purport to ban or otherwise restrict home sharing; Hosts opting for l
Showing the first 8K of 319K characters. Open the full section
Item 1B. Unresolved Staff Comments
None.
Item 1C. Cybersecurity
Cybersecurity Risk Management and Strategy
We have developed and implemented a cybersecurity risk management program intended to protect the confidentiality, integrity, and availability of our critical systems and information, including information pertaining to Hosts, guests, employees, and other users. Our cybersecurity risk management program includes a cybersecurity incident response plan (“Incident Response Plan”).
Our cybersecurity risk management program is integrated into our overall enterprise risk management program and, while distinct in certain aspects described below, the program shares common methodologies, reporting channels and governance processes that apply across the enterprise risk management program to other legal, compliance, strategic, operational, and financial risk areas.
Our cybersecurity risk management program includes:
-
risk assessments designed to help identify material cybersecurity risks to our critical systems, information, products, services, and our broader enterprise IT environment;
-
an information security team who, in collaboration with the broader technology organization, manages and maintains our (1) cybersecurity risk assessment processes including our Incident Response Plan, (2) security controls, and (3) response to cybersecurity incidents;
-
the use of external service providers, where appropriate, to assess, test or otherwise assist with aspects of our security controls;
-
cybersecurity awareness training of our employees, incident response personnel, and senior management;
-
an Incident Response Plan that includes procedures for recognizing and responding to cybersecurity incidents; and
-
a third-party risk management process for service providers, suppliers, and vendors who have access to our critical systems and information.
We have not identified risks from known cybersecurity threats, including as a result of any prior cybersecurity incidents, that have materially affected or are reasonably likely to materially affect us, including our operations, business strategy, results of operations, or financial condition.
Cybersecurity Governance
Our board of directors considers cybersecurity risk as part of its risk oversight function and has delegated to the Audit Risk and Compliance Committee (the “Audit Committee”) oversight of cybersecurity, privacy and other information technology risks. The Audit Committee has responsibility for oversight of management’s implementation of our cybersecurity risk management program.
The Audit Committee receives regular reports and briefings from management on our cybersecurity risks and cybersecurity risk management program updates. In addition, management updates the Audit Committee, as necessary, regarding any material cybersecurity incidents, as well as any incidents with lesser impact potential.
Our management team, including our Chief Legal Officer, our Chief Security Officer and our Chief Technology Officer, is responsible for assessing and managing our material risks from cybersecurity threats. The team has primary responsibility for our overall cybersecurity risk management program and supervises both our internal information security team and our retained external cybersecurity consultants. Our management team has over 20 years of cybersecurity technology leadership experience.
Our management team supervises our information security team’s efforts to prevent, detect, mitigate, and remediate cybersecurity risks and incidents through various means, which may include briefings from internal security personnel; threat intelligence and other information obtained from governmental, public or private sources, or external consultants engaged by us; and alerts and reports produced by security tools deployed in the IT environment.
Item 2. Properties
We are headquartered in San Francisco, California, where we have lease commitments for approximately 828,000 square feet, including approximately 533,000 square feet offered for sublease, across multiple buildings.
As of December 31, 2023, we leased office facilities totaling approximately 1.4 million square feet in multiple locations in the United States and internationally. In 2022, as a result of the COVID-19 pandemic’s impact on the working environment, we announced our Live and Work Anywhere policy. This policy allows for the vast majority of our employees to work remotely on a permanent basis. Where we ceased using office space, we have either terminated, subleased, or offered for sublease. See Note 18, Restructuring, to our consolidated financial statements included in Item 8 of this Annual Report on Form 10-K. We believe our facilities are adequate and suitable for our current needs.
Item 3. Legal Proceedings
We are currently involved in, and may in the future be involved in, legal proceedings, claims, and government investigations in the ordinary course of business. These include proceedings, claims, and investigations relating to, among other things, regulatory matters, commercial matters, intellectual property, competition, tax, employment, pricing, discrimination, consumer rights, personal injury, and property rights. See Note 13, Commitments and Contingencies – Legal and Regulatory Matters, to our consolidated financial statements included in Item 8 of this Annual Report on Form 10-K.
Depending on the nature of the proceeding, claim, or investigation, we may be subject to monetary damage awards, fines, penalties, or injunctive orders. Furthermore, the outcome of these matters could materially adversely affect our business, results of operations, and financial condition. The outcomes of legal proceedings, claims, and government investigations are inherently unpredictable and subject to significant judgment to determine the likelihood and amount of loss related to such matters. While it is not possible to determine the outcomes, we believe based on our current knowledge that the resolution of all such pending matters will not, either individually or in the aggregate, have a material adverse effect on our business, results of operations, cash flows, or financial condition.
Item 4. Mine Safety Disclosures
Item 5. Market for Registrant’s Common Equity, Related Stockholder Matters and Issuer Purchases of Equity Securities
Market Information for Class A Common Stock
Our Class A common stock has been listed on the Nasdaq Global Select Market under the symbol “ABNB” since December 10, 2020. Prior to that date, there was no public trading market for our Class A common stock. Our Class B, Class C, and Class H common stock are neither listed nor publicly traded.
Holders of our Common Stock
Holders of our common stock as of February 2, 2024, were as follows:
-
Class A common stock: 998 stockholders of record. This number does not include stockholders for whom shares were held in “nominee” or “street name.”
-
Class B common stock: 82 stockholders of record.
-
Class C common stock: There were no shares outstanding.
-
Class H common stock: All outstanding shares were held by our wholly-owned Host Endowment Fund subsidiary.
Dividend Policy
We intend to retain any future earnings and do not anticipate declaring or paying any cash dividends in the foreseeable future. We may enter into credit agreements or other borrowing arrangements in the future that may restrict our ability to declare or pay cash dividends or make distributions. Any future determination to declare cash dividends will be made at the discretion of our board of directors, subject to applicable laws and will depend on a number of factors, including our financial condition, results of operations, capital requirements, contractual restrictions, general business conditions, and other factors our board of directors may deem relevant.
Unregistered Sales of Equity Securities
On November 14, 2023, we completed our acquisition of a company pursuant to which we issued an aggregate of 877,062 shares of our Class A common stock as part of the consideration for the acquisition. The issuance of the shares in connection with the acquisition was exempt from registration under the Securities Act by reason of Section 4(a)(2) of the Securities Act.
Issuer Purchases of Equity Securities
The following table sets forth information relating to repurchases of our equity securities during the three months ended December 31, 2023 (in millions, except average price paid per share amounts):
| Period | Total Number of Shares Purchased | Average Price Paid per Share (1) | Total Number of Shares Purchased as Part of Publicly Announced Plans or Programs | Approximate Dollar Value of Shares That May Yet be Purchased Under the Plans or Programs (2) | ||||||||||
| October 1 - 31 | — | $ | — | — | $ | 1,500 | ||||||||
| November 1 - 30 | 3.3 | $ | 124.57 | 3.3 | $ | 1,091 | ||||||||
| December 1 - 31 | 2.5 | $ | 137.05 | 2.5 | $ | 750 | ||||||||
| Total | 5.8 | $ | 129.94 | 5.8 |
(1)Includes broker commissions.
(2)On May 9, 2023, we announced that our board of directors approved a share repurchase program (the “2023 Share Repurchase Program”) with authorization to purchase up to $2.5 billion of our Class A common stock at management’s discretion. The 2023 Share Repurchase Program does not have an expiration date, does not obligate us to repurchase any specific number of shares, and may be modified, suspended or terminated at any time at our discretion.
Performance Graph
The following performance graph and related information shall not be deemed “soliciting material” or to be “filed” with the SEC for purposes of Section 18 of the Exchange Act or incorporated by reference into any filing of Airbnb, Inc. under the Securities Act or the Exchange Act.
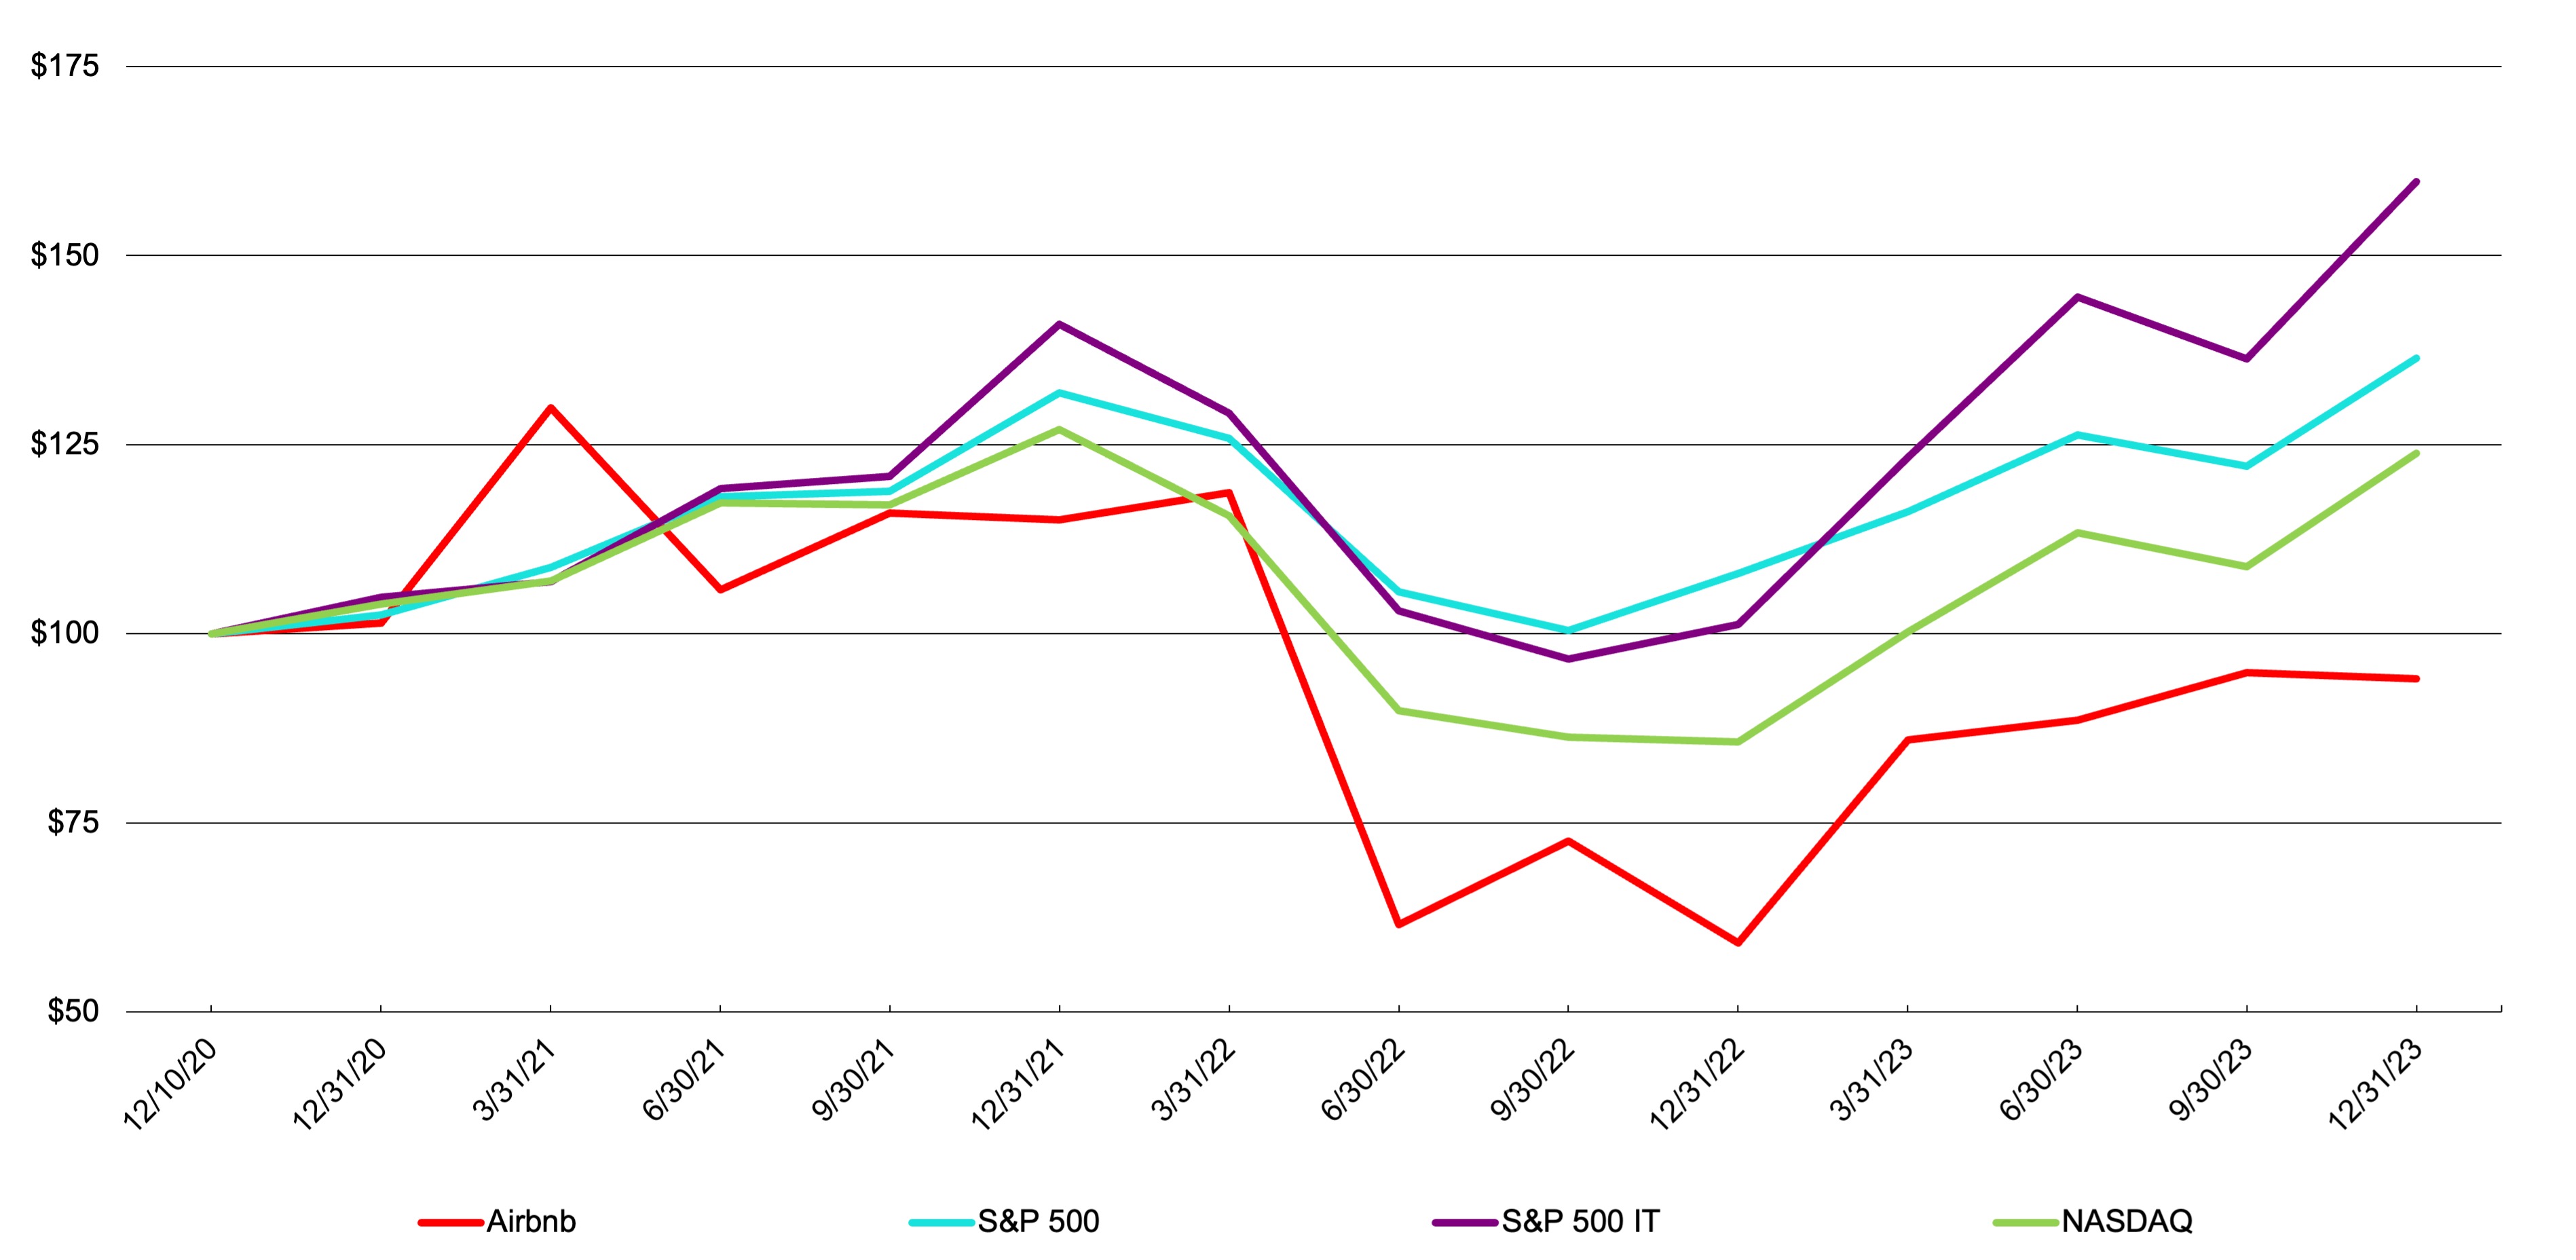
The graph below compares the cumulative total stockholder return on our Class A common stock with the cumulative total return on the S&P 500 Index (“S&P 500”), the S&P 500 Information Technology Index (“S&P 500 IT”), and the Nasdaq Composite Index (“NASDAQ”). The graph assumes $100 was invested at the market close on December 10, 2020, which was the first day our Class A common stock began trading. Data for the S&P 500, S&P 500 IT, and NASDAQ assume reinvestment of dividends. The graph uses the closing market price on
December 10, 2020 of $144.71 per share as the initial value of our Class A common stock. The comparisons in the graph below are based upon historical data and are not indicative of, nor intended to forecast, future performance of our Class A common stock.
Item 6. [Reserved]
Item 7. Management’s Discussion and Analysis of Financial Condition and Results of Operations
You should read the following discussion and analysis of our financial condition and results of operations together with our consolidated financial statements and related notes included in Item 8 of this Annual Report on Form 10-K. This discussion contains forward-looking statements based upon current expectations that involve risks and uncertainties. Our actual results may differ materially from those anticipated in these forward-looking statements as a result of various factors, including those set forth under the section titled “Risk Factors” or in other parts of this Annual Report on Form 10-K. Our historical results are not necessarily indicative of the results that may be expected for any period in the future. Except as otherwise noted, all references to 2023 refer to the year ended December 31, 2023, references to 2022 refer to the year ended December 31, 2022, and references to 2021 refer to the year ended December 31, 2021.
This section of this Annual Report on Form 10-K generally discusses 2023 and 2022 items and year-to-year comparisons between 2023 and 2022. Discussions of 2021 items and year-to-year comparisons between 2022 and 2021 are not included in this Form 10-K, and can be found in “Management’s Discussion and Analysis of Financial Condition and Results of Operations” in Item 7 of Part II of our Annual Report on Form 10-K for the year ended December 31, 2022, filed on February 17, 2023.
Overview
We are a community based on connection and belonging—a community that was born in 2007 when two Hosts welcomed three guests to their San Francisco home, and has since grown to over 5 million Hosts who have welcomed over 1.5 billion guest arrivals in almost every country and region across the globe. Every day, Hosts offer unique stays and experiences that make it possible for guests to connect with communities in a more authentic way.
We have five stakeholders and we have designed our Company with all of them in mind. Along with employees and shareholders, we serve Hosts, guests, and the communities in which they live. We intend to make long-term decisions considering all of our stakeholders because their collective success is key for our business to thrive.
2023 Financial Highlights
In 2023, revenue increased by 18% to $9.9 billion compared to 2022, primarily due to a 14% increase in Nights and Experiences Booked of 54.5 million combined with higher average daily rates driving a 16% increase in Gross Booking Value of $10.0 billion. The growth in revenue demonstrated continued strong travel demand. On a constant-currency basis, revenue increased 17% in 2023 compared to 2022.
Net income in 2023 increased by 153% to $4.8 billion, compared to the prior year, driven by our revenue growth, increased interest income, discipline in managing our cost structure, and the release of a portion of our valuation allowance on deferred tax assets of $2.9 billion (see Note 14, Income Taxes, to our consolidated financial statements included in Item 8 of this Annual Report on Form 10-K for further details). The increase in net income was partially offset by an increase in business and operational taxes of $991 million, the majority of which was non-recurring.
Adjusted EBITDA1 increased 26% to $3.7 billion in 2023 demonstrating the continued strength of our business, a modest increase in ADR, and discipline in managing our cost structure.
Our net cash provided by operating activities was $3.9 billion in 2023, compared to $3.4 billion, in the prior year. We generated Free Cash Flow1 of $3.8 billion for the year ended December 31, 2023, compared to $3.4 billion, in the prior year. The increase was primarily driven by growth in revenue, unearned fees and net income.
During 2023, we repurchased an aggregate of 17.9 million shares of Class A common stock for $2.3 billion, through two share repurchase programs. As of December 31, 2023, we had $750 million available to repurchase shares of Class A common stock under our share repurchase program.
Trends
The COVID-19 pandemic, and measures to contain the virus, including government travel restrictions and quarantine orders, had an unprecedented impact on the global travel industry and materially and adversely affected our business, results of operations, and financial condition. In May 2023, the World Health Organization formally declared an end to the COVID-19 global health emergency. While countries around the world are generally open for international travel, it remains difficult to predict with any certainty the impact any future new strains or variants of the virus may have on the travel industry and, in particular, our business.
More recently, inflation and other macroeconomic pressures in the United States and the global economy, such as rising interest rates, and foreign currency fluctuations, as well as evolving geopolitical conflicts, have contributed to an increasingly complex business environment. As a result, our future operational results may be subject to volatility. Additionally, further health-related events, political instability, geopolitical conflicts, acts of terrorism, significant fluctuations in currency values, sustained levels of increased inflation, sovereign debt issues, and natural disasters, are examples of other events that could have a negative impact on the travel industry in the future.
Despite these factors, we have witnessed a healthy recovery of travel demand, following the COVID-19 pandemic.
Key Business Metrics and Non-GAAP Financial Measures
We track the following key business metrics and financial measures to evaluate our operating performance, identify trends, formulate financial projections, and make strategic decisions. The financial measures are not calculated and presented in accordance with generally accepted accounting principles in the United States of America (“U.S. GAAP”) (“non-GAAP financial measures”). We believe that these key business metrics and non-GAAP financial measures provide useful information to investors and others in understanding and evaluating our results of operations in the same manner as our management team. We believe that non-GAAP financial information, when taken collectively, may be helpful to investors because it provides consistency and comparability with past financial performance, and assists in comparisons with other companies, some of which use similar non-GAAP financial information to supplement their U.S. GAAP results.
These key business metrics and non-GAAP financial measures are presented for supplemental informational purposes only, should not be considered a substitute for financial information presented in accordance with U.S. GAAP, and may be different from similarly titled metrics or measures presented by other companies. A reconciliation of each non-GAAP financial measure to the most directly comparable financial measure stated in accordance with U.S. GAAP is provided under the subsection titled “— Adjusted EBITDA” and “— Free Cash Flow” below. Investors are encouraged to review the related U.S. GAAP financial measures and the reconciliation of these non-GAAP financial measures to their most directly comparable U.S. GAAP financial measures.
Key Business Metrics
We review the following key business metrics to measure our performance, identify trends, formulate financial projections, and make strategic decisions. We are not aware of any uniform standards for calculating these key metrics, which may hinder comparability with other companies that may calculate similarly titled metrics in a different way.
The following table summarizes our key business metrics, for each period presented below (in millions):
| 2022 | 2023 | % Change | |||||||||
| Nights and Experiences Booked | 394 | 448 | 14 | % | |||||||
| Gross Booking Value | $ | 63,212 | $ | 73,252 | 16 | % |
Nights and Experiences Booked
Nights and Experiences Booked is a key measure of the scale of our platform, which in turn drives our financial performance. Nights and Experiences Booked on our platform in a period represents the sum of the total number of nights booked for stays and the total number of seats booked for experiences, net of cancellations and alterations that occurred in that period. For example, a booking made on February 15 would be reflected in Nights and Experiences Booked for our quarter ended March 31. If, in the example, the booking was canceled on May 15, Nights and Experiences Booked would be reduced by the cancellation for our quarter ended June 30. A night can include one or more guests and can be for a listing with one or more bedrooms. Nights and Experiences Booked grows as we attract new customers to our
1 A reconciliation of non-GAAP financial information to the most comparable U.S. GAAP financial measures is provided under the subsection titled “Key Business Metrics and Non-GAAP Financial Measures— Adjusted EBITDA” and “— Free Cash Flow” below.
platform and as repeat guests increase their activity on our platform. A seat is booked for each participant in an experience. Substantially all of the bookings on our platform to date have come from nights. We believe Nights and Experiences Booked is a key business metric to help investors and others understand and evaluate our results of operations in the same manner as our management team, as it represents a single unit of transaction on our platform.
In 2023, we had 448.2 million Nights and Experiences Booked, a 14% increase from 393.7 million in 2022. The increase in our Nights and Experiences Booked was driven by strong growth across all regions.
Gross Booking Value
GBV represents the dollar value of bookings on our platform in a period and is inclusive of Host earnings, service fees, cleaning fees, and taxes, net of cancellations and alterations that occurred during that period. The timing of recording GBV and any related cancellations is similar to that described in the subsection titled “— Key Business Metrics and Non-GAAP Financial Measures — Nights and Experiences Booked” above. Revenue from the booking is recognized upon check-in; accordingly, GBV is a leading indicator of revenue. The entire amount of a booking is reflected in GBV during the quarter in which booking occurs, whether the guest pays the entire amount of the booking upfront or elects to use our Pay Less Upfront program. Growth in GBV reflects our ability to attract and retain customers and reflects growth in Nights and Experiences Booked.
In 2023, our GBV was $73.3 billion, a 16% increase from $63.2 billion in 2022. The increase in our GBV was primarily due to an increase in Nights and Experiences Booked, combined with a modest increase in ADR. Similar to Nights and Experiences Booked, our GBV improvement was driven by growth in bookings in all regions.
Non-GAAP Financial Measures
Our non-GAAP financial measures include Adjusted EBITDA, Free Cash Flow, and revenue growth rates in constant currency, which are described below. A reconciliation of each non-GAAP financial measure to the most directly comparable financial measure stated in accordance with U.S. GAAP is provided below. Investors are encouraged to review the related U.S. GAAP financial measures and the reconciliation of these non-GAAP financial measures to their most directly comparable U.S. GAAP financial measures.
The following table summarizes our non-GAAP financial measures, along with the most directly comparable U.S. GAAP measure, for each period presented below (in millions):
| 2022 | 2023 | |||||||
| Net income | $ | 1,893 | $ | 4,792 | ||||
| Adjusted EBITDA | $ | 2,903 | $ | 3,653 | ||||
| Net cash provided by operating activities | $ | 3,430 | $ | 3,884 | ||||
| Free Cash Flow | $ | 3,405 | $ | 3,837 |
Adjusted EBITDA
We define Adjusted EBITDA as net income or loss adjusted for (i) provision for (benefit from) income taxes; (ii) other income (expense), net, interest expense, and interest income; (iii) depreciation and amortization; (iv) stock-based compensation expense; (v) acquisition-related impacts consisting of gains (losses) recognized on changes in the fair value of contingent consideration arrangements; (vi) net changes to the reserves for lodging taxes for which management believes it is probable that we may be held jointly liable with Hosts for collecting and remitting such taxes, and the applicability of withholding taxes on payments made to such Hosts; and (vii) restructuring charges. Adjusted EBITDA Margin is defined as Adjusted EBITDA divided by revenue.
The above items are excluded from our Adjusted EBITDA measure because these items are non-cash in nature, or because the amount and timing of payments of these items is unpredictable, not driven by core results of operations, and renders comparisons with prior periods and competitors less meaningful. We believe Adjusted EBITDA provides useful information to investors and others in understanding and evaluating our results of operations, as well as provides a useful measure for period-to-period comparisons of our business performance. Moreover, we have included Adjusted EBITDA in this Annual Report on Form 10-K because it is a key measurement used by our management internally to make operating decisions, including those related to operating expenses, evaluating performance, and performing strategic planning and annual budgeting.
Adjusted EBITDA has limitations as a financial measure, should be considered as supplemental in nature, and is not meant as a substitute for the related financial information prepared in accordance with U.S. GAAP. These limitations include the following:
-
Adjusted EBITDA does not reflect interest income, interest expense, and other income (expense), net, which include unrealized and realized gains and losses on foreign currency exchange, investments, and financial instruments;
-
Adjusted EBITDA excludes certain recurring, non-cash charges, such as depreciation of property and equipment and amortization of intangible assets, and although these are non-cash charges, the assets being depreciated and amortized may have to be replaced in the future, and Adjusted EBITDA does not reflect all cash requirements for such replacements or for new capital expenditure requirements;
-
Adjusted EBITDA excludes stock-based compensation expense, which has been, and will continue to be for the foreseeable future, a significant recurring expense in our business and an important part of our compensation strategy;
-
Adjusted EBITDA excludes acquisition-related impacts consisting of gains (losses) recognized on changes in the fair value of contingent consideration arrangements. The contingent consideration, which was in the form of equity, was valued as of the acquisition date and is marked-to-market at each reporting period based on factors including our stock price;
-
Adjusted EBITDA does not reflect net changes to reserves for lodging taxes for which management believes it is probable that we may be held jointly liable with Hosts for collecting and remitting such taxes and reserves, and the applicability of withholding taxes on payments made to such Hosts; and
-
Adjusted EBITDA does not reflect restructuring charges, which include impairment of operating lease right-of-use assets and leasehold improvements.
Because of these limitations, you should consider Adjusted EBITDA and Adjusted EBITDA Margin alongside other financial performance measures, including net income (loss) and our other U.S. GAAP results.
Adjusted EBITDA Reconciliation
The following is a reconciliation of Adjusted EBITDA to the most comparable U.S. GAAP measure, net income (in millions, except percentages):
| 2022 | 2023 | |||||||
| Revenue | $ | 8,399 | $ | 9,917 | ||||
| Net income | $ | 1,893 | $ | 4,792 | ||||
| Adjusted to exclude the following: | ||||||||
| Provision for (benefit from) income taxes | 96 | (2,690) | ||||||
| Other (income) expense, net | (25) | 54 | ||||||
| Interest expense | 24 | 83 | ||||||
| Interest income | (186) | (721) | ||||||
| Depreciation and amortization | 81 | 44 | ||||||
| Stock-based compensation expense | 930 | 1,120 | ||||||
| Acquisition-related impacts | (12) | (3) | ||||||
| Lodging tax reserves and reserves for Host withholding taxes | 13 | 974 | ||||||
| Restructuring charges | 89 | — | ||||||
| Adjusted EBITDA | $ | 2,903 | $ | 3,653 | ||||
| Adjusted EBITDA Margin | 35 | % | 37 | % |
The increases in Adjusted EBITDA and Adjusted EBITDA Margin for the year ended December 31, 2023, compared to the prior year, were primarily driven by the continued strength of our business, a modest increase in ADR, and discipline in managing our cost structure.
During 2023, we released $2.9 billion of our valuation allowance related to our U.S. deferred tax assets and is included in provision for (benefit from) income taxes (see Note 14, Income Taxes, to our consolidated financial statements included in Item 8 of Part II of this Annual Report on Form 10-K for further details).
Free Cash Flow
We define Free Cash Flow as net cash provided by operating activities less purchases of property and equipment. We believe that Free Cash Flow is a meaningful indicator of liquidity that provides information to our management and investors about the amount of cash generated from operations, after purchases of property and equipment, that can be used for strategic initiatives, including continuous investment in our business, growth through acquisitions, and strengthening our balance sheet. Our Free Cash Flow is impacted by the timing of GBV because we collect our service fees at the time of booking, which is generally before a stay or experience occurs. Funds held on behalf of our customers and amounts payable to our customers do not impact Free Cash Flow, except interest earned on these funds. Free Cash Flow has limitations as an analytical tool and should not be considered in isolation or as a substitute for analysis of our other U.S. GAAP financial measures, such as net cash provided by operating activities. Free Cash Flow does not reflect our ability to meet future contractual commitments and may be calculated differently by other companies in our industry, limiting its usefulness as a comparative measure. Free Cash Flow Margin is defined as Free Cash Flow divided by revenue.
Free Cash Flow Reconciliation
The following is a reconciliation of Free Cash Flow to the most comparable U.S. GAAP cash flow measure, net cash provided by operating activities (in millions, except percentages):
| 2022 | 2023 | |||||||
| Revenue | $ | 8,399 | $ | 9,917 | ||||
| Net cash provided by operating activities | $ | 3,430 | $ | 3,884 | ||||
| Purchases of property and equipment | (25) | (47) | ||||||
| Free Cash Flow | $ | 3,405 | $ | 3,837 | ||||
| Free Cash Flow Margin | 41 | % | 39 | % | ||||
| Other cash flow components: | ||||||||
| Net cash used in investing activities | $ | (28) | $ | (1,042) | ||||
| Net cash used in financing activities | $ | (689) | $ | (2,430) |
The increase in Free Cash Flow for the year ended December 31, 2023, compared to the prior year, was primarily driven by increased income from operations and interest income driven by increased interest rates on higher cash balances.
Constant Currency
In addition to revenue growth rates derived from revenue presented in accordance with U.S. GAAP, we disclose below the percentage change in our current period revenue from the corresponding prior period by comparing the change in revenue using constant currencies. We present constant currency revenue growth rate information to provide a framework for assessing how our underlying revenue performed excluding the effect of changes in exchange rates. We use the percentage change in constant currency revenues for financial and operational decision-making and as a means to evaluate period-to-period comparisons. We believe the presentation of revenue on a constant currency basis in addition to the U.S. GAAP presentation helps improve the ability to understand our performance because it excludes the effects of foreign currency volatility that are not indicative of our core operating results. We calculate the percentage change in constant currency by determining the change in the current period revenue over the prior comparable period where current period foreign currency revenue is translated using the exchange rates of the comparative period.
Geographic Mix
Our operations are global, and certain trends in our business, such as Nights and Experiences Booked, GBV, revenue, GBV per Night and Experience Booked, and Nights per Booking vary by geography. We measure Nights and Experiences Booked by region based on the location of the listing.
| 2022 | % of Total | 2023 | % of Total | ||||||||||||||
| (in millions, except percentages) | |||||||||||||||||
| Nights and Experiences Booked | |||||||||||||||||
| North America | 133 | 34 | % | 146 | 33 | % | |||||||||||
| EMEA | 168 | 43 | 187 | 42 | |||||||||||||
| Latin America | 53 | 13 | 64 | 14 | |||||||||||||
| Asia Pacific | 40 | 10 | 51 | 11 | |||||||||||||
| Total | 394 | 100 | % | 448 | 100 | % | |||||||||||
| Gross Booking Value | |||||||||||||||||
| North America | $ | 32,246 | 51 | % | $ | 34,941 | 48 | % | |||||||||
| EMEA | 21,486 | 34 | 26,241 | 36 | |||||||||||||
| Latin America | 4,838 | 8 | 6,054 | 8 | |||||||||||||
| Asia Pacific | 4,642 | 7 | 6,016 | 8 | |||||||||||||
| Total | $ | 63,212 | 100 | % | $ | 73,252 | 100 | % | |||||||||
| Revenue | |||||||||||||||||
| North America | $ | 4,210 | 50 | % | $ | 4,638 | 47 | % | |||||||||
| EMEA | 2,924 | 35 | 3,615 | 36 | |||||||||||||
| Latin America | 643 | 8 | 824 | 8 | |||||||||||||
| Asia Pacific | 622 | 7 | 840 | 9 | |||||||||||||
| Total | $ | 8,399 | 100 | % | $ | 9,917 | 100 | % |
We saw a 2% increase in GBV per Night and Experience Booked in 2023 compared to the prior year, primarily due to higher GBV per Night and Experience Booked in EMEA, which increased from $127.99 to $140.40.
Our total Company average nights per booking, excluding experiences, decreased 4% in 2023 compared to the prior year, primarily due to our geographic mix and changes in traveler behaviors. Specifically, average nights per booking in 2023 was 4.1 for North America, 3.9 for EMEA, 3.9 for Latin America, and 3.3 for Asia Pacific, with a total average of 3.9 nights. We expect that our blended global average nights per booking will continue to fluctuate based on our geographic mix and changes in traveler behaviors.
Results of Operations
The following table sets forth our results of operations for the periods presented (in millions, except percentages):
| 2022 | 2023 | |||||||||||||
| Amount | % of Revenue | Amount | % of Revenue | |||||||||||
| Revenue | $ | 8,399 | 100 | % | $ | 9,917 | 100 | % | ||||||
| Costs and expenses: | ||||||||||||||
| Cost of revenue | 1,499 | 18 | 1,703 | 17 | ||||||||||
| Operations and support(1) | 1,041 | 12 | 1,186 | 12 | ||||||||||
| Product development(1) | 1,502 | 18 | 1,722 | 17 | ||||||||||
| Sales and marketing(1) | 1,516 | 18 | 1,763 | 18 | ||||||||||
| General and administrative(1) | 950 | 11 | 2,025 | 20 | ||||||||||
| Restructuring charges | 89 | 1 | — | — | ||||||||||
| Total costs and expenses | 6,597 | 78 | 8,399 | 84 | ||||||||||
| Income from operations | 1,802 | 22 | 1,518 | 16 | ||||||||||
| Interest income | 186 | 2 | 721 | 7 | ||||||||||
| Interest expense | (24) | — | (83) | (1) | ||||||||||
| Other income (expense), net | 25 | — | (54) | (1) | ||||||||||
| Income before income taxes | 1,989 | 24 | 2,102 | 21 | ||||||||||
| Provision for (benefit from) income taxes | 96 | 1 | (2,690) | (27) | ||||||||||
| Net income | $ | 1,893 | 23 | % | $ | 4,792 | 48 | % |
(1)Includes stock-based compensation expense as follows (in millions):
| 2022 | 2023 | |||||||
| Operations and support | $ | 63 | $ | 68 | ||||
| Product development | 548 | 694 | ||||||
| Sales and marketing | 114 | 130 | ||||||
| General and administrative | 205 | 228 | ||||||
| Stock-based compensation expense | $ | 930 | $ | 1,120 |
Comparison of the Years Ended December 31, 2022 and 2023
Revenue
Our revenue consists of service fees, net of incentives and refunds, charged to our customers. For stays, service fees, which are charged to customers as a percentage of the value of the booking, excluding taxes, vary based on factors specific to the booking, such as booking value, the duration of the booking, geography, and Host type. For experiences, we only earn a Host fee. Substantially all of our revenue comes from stays booked on our platform. Incentives include our referral programs and marketing promotions to encourage the use of our platform and attract new customers, while our refunds to customers are part of our customer support activities. We experience a difference in timing between when a booking is made and when we recognize revenue, which occurs upon check-in. We record the service fees that we collect from customers prior to check-in on our balance sheet as unearned fees. Revenue is net of incentives and refunds provided to customers.
| (in millions, except percentages) | 2022 | 2023 | % Change | ||||||||
| Revenue | $ | 8,399 | $ | 9,917 | 18 | % |
Revenue increased $1.5 billion, or 18%, in 2023 compared to 2022, primarily due to a 14% increase in Nights and Experiences Booked combined with higher ADRs. On a constant-currency basis, revenue increased 17% compared to 2022, due to a weakened U.S. dollar against the Euro and British Pound.
Cost of Revenue
Cost of revenue includes payment processing costs, including merchant fees and chargebacks, costs associated with third-party data centers used to host our platform, and amortization of internally developed software and acquired technology. Because we act as the
merchant of record, we incur all payment processing costs associated with our bookings, and we have chargebacks, which arise from account takeovers and other fraudulent activities. Cost of revenue may vary as a percentage of revenue from year to year based on activity on our platform and may also vary from quarter to quarter as a percentage of revenue based on the seasonality of our business and the difference in the timing of when bookings are made and when we recognize revenue.
| (in millions, except percentages) | 2022 | 2023 | % Change | ||||||||
| Cost of revenue | $ | 1,499 | $ | 1,703 | 14 | % | |||||
| Percentage of revenue | 18 | % | 17 | % |
Cost of revenue increased $204 million, or 14%, in 2023 compared to 2022, primarily due to an increase in merchant fees and chargebacks of $163 million and $10 million, respectively, due to an increase in pay-in volumes, and an increase in cloud computing costs of $31 million due to increased server and data storage usage.
Operations and Support
Operations and support expense primarily consists of personnel-related expenses and third-party service provider fees associated with community support provided via phone, email, and chat to customers; customer relations costs, which include refunds and credits related to customer satisfaction and expenses associated with our Host protection programs; and allocated costs for facilities and information technology.
| (in millions, except percentages) | 2022 | 2023 | % Change | ||||||||
| Operations and support | $ | 1,041 | $ | 1,186 | 14 | % | |||||
| Percentage of revenue | 12 | % | 12 | % |
Operations and support expense increased $145 million, or 14%, in 2023 compared to 2022, primarily due to a $105 million increase in third-party community support personnel and customer relations costs, a $25 million increase in payroll-related expenses primarily due to growth in headcount and increased compensation costs, and a $16 million increase in insurance costs due to higher Host Liability Insurance premiums resulting from higher overall nights.
Product Development
Product development expense primarily consists of personnel-related expenses and third-party service provider fees incurred in connection with the development of our platform, and allocated costs for facilities and information technology.
| (in millions, except percentages) | 2022 | 2023 | % Change | ||||||||
| Product development | $ | 1,502 | $ | 1,722 | 15 | % | |||||
| Percentage of revenue | 18 | % | 17 | % |
Product development expense increased $220 million, or 15%, in 2023, compared to 2022, primarily due to a $217 million increase in payroll-related expenses due to growth in headcount and increased compensation costs.
Sales and Marketing
Sales and marketing expense primarily consists of brand and performance marketing, personnel-related expenses, including those related to our field operations, policy and communications, portions of referral incentives and coupons, and allocated costs for facilities and information technology.
| (in millions, except percentages) | 2022 | 2023 | % Change | ||||||||
| Brand and performance marketing | $ | 1,030 | $ | 1,208 | 17 | % | |||||
| Field operations and policy | 486 | 555 | 14 | % | |||||||
| Total sales and marketing | $ | 1,516 | $ | 1,763 | 16 | % | |||||
| Percentage of revenue | 18 | % | 18 | % |
Sales and marketing expense increased $247 million, or 16%, in 2023, compared to 2022, primarily due to a $177 million increase in marketing activities associated with our marketing campaigns and launches and our search engine marketing and advertising spend, and a $54 million increase in payroll-related expenses due to growth in headcount and increased compensation costs.
General and Administrative
General and administrative expense primarily consists of personnel-related expenses for management and administrative functions, including finance and accounting, legal, and human resources. General and administrative expense also includes certain professional services fees, general corporate and director and officer insurance, allocated costs for facilities and information technology, indirect taxes,
including lodging tax reserves for which we may be held jointly liable with Hosts for collecting and remitting such taxes, and bad debt expense.
| (in millions, except percentages) | 2022 | 2023 | % Change | ||||||||
| General and administrative | $ | 950 | $ | 2,025 | 113 | % | |||||
| Percentage of revenue | 11 | % | 20 | % |
General and administrative expense increased $1.1 billion, or 113%, in 2023, compared to 2022, primarily due to an increase of $991 million related to business and operational taxes, the majority of which is non-recurring, and a $93 million increase in payroll related expenses partially offset by a reduction in insurance expense of $18 million driven by reduced directors and officers insurance premiums.
Restructuring Charges
| (in millions, except percentages) | 2022 | 2023 | % Change | ||||||||
| Restructuring charges | $ | 89 | $ | — | (100) | % |
In the second quarter of 2022, we shifted to a remote work model, allowing our employees to work from anywhere in the country. The shift to a remote work model was in direct response to the change in how employees work due to the impact of COVID-19. As a result, we recorded restructuring charges of $89 million during 2022, which included $81 million relating to an impairment of both domestic and international operating lease right-of-use assets, and $8 million of related leasehold improvements. There were no restructuring charges in 2023.
Interest Income and Expense
Interest income consists primarily of interest earned on our cash, cash equivalents, marketable securities, and amounts held on behalf of customers. Interest expense consists primarily of interest associated with various indirect tax reserves, amortization of debt issuance and debt discount costs.
| (in millions, except percentages) | 2022 | 2023 | % Change | ||||||||
| Interest income | $ | 186 | $ | 721 | 288 | % | |||||
| Interest expense | $ | (24) | $ | (83) | 246 | % |
Interest income increased $535 million, or 288%, in 2023 compared to 2022, primarily due to higher cash and investment balances and higher interest rates. Our investment portfolio was largely invested in money market funds and short-term, high-quality bonds.
Interest expense increased $59 million or 246%, in 2023 compared to 2022, primarily due to non-recurring interest paid relating to withholding tax payments on behalf of Hosts.
Other Income (Expense), Net
Other income (expense), net consists primarily of realized and unrealized gains and losses on foreign currency transactions and balances, unrealized gains and losses on derivatives, the change in fair value of investments and financial instruments, including our share of income or loss from our equity method investments.
| (in millions, except percentages) | 2022 | 2023 | % Change | ||||||||
| Other income (expense), net | $ | 25 | $ | (54) | (316) | % |
Other income (expense), net decreased $79 million in 2023 compared to 2022, primarily due to foreign exchange losses.
Provision for Income Taxes
We are subject to income taxes in the United States and foreign jurisdictions in which we do business. Foreign jurisdictions have different statutory tax rates than those in the United States. Additionally, certain of our foreign earnings may also be taxable in the United States. Accordingly, our effective tax rate is subject to significant variation due to several factors, including variability in our pre-tax and taxable income and loss and the mix of jurisdictions to which they relate, intercompany transactions, changes in how we do business, acquisitions, investments, tax audit developments, changes in our deferred tax assets and liabilities and their valuation, foreign currency gains and losses, changes in statutes, regulations, case law, and administrative practices, principles, and interpretations related to tax, including changes to the global tax framework, competition, and other laws and accounting rules in various jurisdictions, and relative changes of expenses or losses for which tax benefits are not recognized. Additionally, our effective tax rate can vary based on the amount of pre-tax income or loss.
For example, the impact of discrete items and non-deductible expenses on our effective tax rate is greater when our pre-tax income is lower.
| (in millions, except percentages) | 2022 | 2023 | % Change | ||||||||
| Provision for (benefit from) income taxes | $ | 96 | $ | (2,690) | * | ||||||
| Effective tax rate | 5 | % | (128) | % |
- Not meaningful
The income tax benefit in 2023, was primarily due to the release of $2.9 billion of our valuation allowance related to our U.S. deferred tax assets (see Note 14, Income Taxes, to our consolidated financial statements included in Item 8 of this Annual Report on Form 10-K for further details).
Liquidity and Capital Resources
Sources and Conditions of Liquidity
As of December 31, 2023, our principal sources of liquidity were cash, cash equivalents and short-term investments totaling $10.1 billion. As of December 31, 2023, cash and cash equivalents totaled $6.9 billion, which included $1.9 billion held by our foreign subsidiaries. Cash and cash equivalents consist of checking and interest-bearing accounts and highly-liquid securities with an original maturity of 90 days or less. As of December 31, 2023, short-term investments totaled $3.2 billion. Short-term investments primarily consist of highly-liquid investment grade corporate debt securities, time deposits, commercial paper, certificates of deposit, U.S. government and government agency debt securities (“government bonds”), and mortgage-backed and asset-backed securities. These amounts do not include funds of $5.9 billion as of December 31, 2023, that we held for bookings in advance of guests completing check-ins that we record separately on our consolidated balance sheet in funds receivable and amounts held on behalf of customers with a corresponding liability in funds payable and amounts payable to customers.
Our cash and cash equivalents are generally held at large global systemically important banks (or G-SIBs), which are subject to high capital requirements and are required to regularly perform stringent stress tests related to their ability to absorb capital losses. Our cash, cash equivalents, and short-term investments held outside of the United States may be repatriated, subject to certain limitations, and would be available to be used to fund our domestic operations. However, repatriation of such funds may result in additional tax liabilities. We believe that our existing cash, cash equivalents, and short-term investments balances in the United States are sufficient to fund our working capital needs in the United States.
We have access to $1.0 billion of commitments and a $200 million sub-limit for the issuance of letters of credit under the 2022 Credit Facility. As of December 31, 2023, no amounts were drawn under the 2022 Credit Facility and outstanding letters of credit totaled $29 million. See Note 10, Debt, to our consolidated financial statements included in Item 8 of Part II of this Annual Report on Form 10-K for a description of the 2022 Credit Facility entered into on October 31, 2022.
Material Cash Requirements
As of December 31, 2023, we had outstanding $2.0 billion in aggregate principal amount of indebtedness of our 0% convertible senior notes due in 2026. On March 3, 2021, in connection with the pricing of the 2026 Notes, we entered into privately negotiated capped call transactions (the “Capped Calls”) with certain of the initial purchasers and other financial institutions (the "option counterparties") at a cost of approximately $100 million. The cap price of the Capped Calls was $360.80 per share of Class A common stock, which represented a premium of 100% over the last reported sale price of the Class A common stock of $180.40 per share on March 3, 2021, subject to certain customary adjustments under the terms of the Capped Call Transactions.
As of December 31, 2023, our total minimum lease payments were $313 million, of which $81 million is due in the succeeding 12 months. We have a commercial agreement with a data hosting services provider to spend or incur an aggregate of at least $842 million for vendor services through 2027. See Note 9, Leases, Note 10, Debt, and Note 13, Commitments and Contingencies, to our consolidated financial statements included in Item 8 of Part II of this Annual Report on Form 10-K for further information regarding these commitments.
During 2023, we repurchased an aggregate of 17.9 million shares of Class A common stock for $2.3 billion through two share repurchase programs. As of December 31, 2023, we had $750 million available to repurchase shares of Class A common stock under our share repurchase program. In February 2024, our board of directors approved an additional share repurchase program to purchase up to $6.0 billion of our Class A common stock.
Cash Flows
The following table summarizes our cash flows for the periods indicated (in millions):
| 2022 | 2023 | |||||||
| Net cash provided by operating activities | $ | 3,430 | $ | 3,884 | ||||
| Net cash used in investing activities | (28) | (1,042) | ||||||
| Net cash used in financing activities | (689) | (2,430) | ||||||
| Effect of exchange rate changes on cash, cash equivalents, and restricted cash | (337) | 152 | ||||||
| Net increase in cash, cash equivalents, and restricted cash | $ | 2,376 | $ | 564 |
Net Cash Provided by Operating Activities
Net cash provided by operating activities in 2023 was $3.9 billion, which was primarily due to income from operations of $1.5 billion and interest income of $721 million from our investment portfolio, adjusted for non-cash items including stock-based compensation expense of $1.1 billion.
Net cash provided by operating activities in 2022 was $3.4 billion, which was primarily due to income from operations of $1.8 billion, adjusted for non-cash items, primarily consisting of $930 million of stock-based compensation expense, impairment of long-lived assets of $91 million, and $62 million of foreign exchange losses due to the strengthening of the U.S. dollar against the Euro and British Pound.
Net Cash Used in Investing Activities
Net cash used in investing activities in 2023 was $1.0 billion, which was primarily due to purchases of short-term investments, partially offset by proceeds resulting from sales and maturities of short-term investments.
Net cash used in investing activities in 2022 was $28 million, which was primarily due to purchases of short-term investments and property and equipment of $4.1 billion and $25 million, respectively, partially offset by proceeds from sales and maturities of short-term investments of $4.1 billion.
Net Cash Used in Financing Activities
Net cash used in financing activities in 2023 was $2.4 billion, primarily due to share repurchases of $2.3 billion, and an increase in taxes paid related to net share settlement of equity awards of $1.2 billion, primarily driven from the taxes paid related to the cashless exercise of stock options, partially offset by the decrease in funds payable and amounts payable to customers of $936 million.
Net cash used in financing activities in 2022 was $689 million, primarily due to share repurchases of $1.5 billion under our share repurchase programs, and an increase in the taxes paid related to net share settlement of equity awards of $607 million, partially offset by an increase in funds payable and amounts payable to customers of $1.3 billion resulting from significantly higher bookings.
Effect of Exchange Rates
The effect of exchange rate changes on cash, cash equivalents, and restricted cash on our consolidated statements of cash flows relates to certain of our assets, principally cash balances held on behalf of customers, that are denominated in currencies other than the functional currency of certain of our subsidiaries. During 2022, we recorded a reduction of $337 million in cash, cash equivalents, and restricted cash, primarily due to the strengthening of the U.S. dollar. During 2023, we recorded an increase of $152 million in cash, cash equivalents, and restricted cash, primarily due to the weakening of the U.S. dollar. The impact of exchange rate changes on cash balances can serve as a natural hedge for the effect of exchange rates on our liabilities to our Hosts and guests.
We assess our liquidity in terms of our ability to generate cash to fund our short- and long-term cash requirements. As such, we believe that the cash flows generated from operating activities will meet our anticipated cash requirements in the short-term. In addition to normal working capital requirements, we anticipate that our short- and long-term cash requirements will include share repurchases, introduction of new products and offerings, timing and extent of spending to support our efforts to develop our platform, debt repayments, and expansion of sales and marketing activities. Our future capital requirements, however, will depend on many factors, including, but not limited to our growth, headcount, and ability to attract and retain customers on our platform. Additionally, we may in the future raise additional capital or incur additional indebtedness to continue to fund our strategic initiatives. On a long-term basis, we would rely on either our access to the capital markets or our credit facility for any long-term funding not provided by operating cash flows and cash on hand. In the event that additional financing is required from outside sources, we may seek to raise additional funds at any time through equity, equity-linked arrangements, and/or debt, which may not be available on favorable terms, or at all. If we are unable to raise additional capital when desired and at reasonable rates, our business, results of operations, and financial condition could be materially adversely affected. Our liquidity is subject to various risks including the risks identified in the section titled “Risk Factors” in Item IA of Part I of this Annual Report on Form 10-K and the market risks identified in the section titled "Quantitative and Qualitative Disclosures about Market Risk" in Item 7A of Part II of this Annual Report on Form 10-K.
Indemnification Agreements
In the ordinary course of business, we include limited indemnification provisions under certain agreements with parties with whom we have commercial relations of varying scope and terms. See Note 13, Commitments and Contingencies, to our consolidated financial statements included in Item 8 of Part II of this Annual Report on Form 10-K further information regarding our indemnification agreements.
Critical Accounting Estimates
Our consolidated financial statements are prepared in accordance with accounting principles generally accepted in the United States. The preparation of these consolidated financial statements requires us to make estimates and assumptions that affect the reported amounts of assets, liabilities, revenue, costs, and expenses, and related disclosures. On an ongoing basis, we evaluate our estimates and assumptions. Our actual results may differ from these estimates under different assumptions or conditions.
We believe that of our significant accounting policies, which are described in Note 2, Summary of Significant Accounting Policies, to our consolidated financial statements included in Item 8 of Part II of this Annual Report on Form 10-K, the following accounting policies involve a greater degree of judgment and complexity. Accordingly, these are the policies we believe are the most critical to aid in fully understanding and evaluating our consolidated financial condition, results of operations, and cash flows.
Lodging Tax Obligations
In jurisdictions where we do not collect and remit lodging taxes, the responsibility for collecting and remitting these taxes, if applicable, generally rests with Hosts. We estimate liabilities for a certain number of jurisdictions with respect to state, city, and local taxes related to lodging where we believe it is probable that Airbnb could be held jointly liable with Hosts for collecting and remitting such taxes and the related amounts can be reasonably estimated. Changes to these liabilities are recorded in general and administrative expense in our consolidated statements of operations.
Evaluating potential outcomes for lodging taxes is inherently uncertain and requires us to utilize various judgments, assumptions, and estimates in determining our reserves. A variety of factors could affect our potential obligation for collecting and remitting such taxes, which include, but are not limited to, whether we determine, or any tax authority asserts, that we have a responsibility to collect lodging and related taxes on either historic or future transactions; the introduction of new ordinances and taxes which subject our operations to such taxes; or the ultimate resolution of any historic claims that may be settled through negotiation. Accordingly, the ultimate resolution of lodging taxes may be greater or less than reserve amounts we have established. See Note 13, Commitments and Contingencies, to our consolidated financial statements included in Item 8 of Part II of this Annual Report on Form 10-K for additional information.
Income Taxes
We are subject to income taxes in the United States and foreign jurisdictions. We account for income taxes using the asset and liability method. We account for uncertainty in tax positions by recognizing a tax benefit from uncertain tax positions when it is more likely than not that the position will be sustained upon examination. Evaluating our uncertain tax positions, determining our provision for (benefit from) income taxes, and evaluating the impact of tax law changes, are inherently uncertain and require making judgments, assumptions, and estimates.
In determining the need for a valuation allowance, we weigh both positive and negative evidence in the various jurisdictions in which we operate related to the likelihood of realization of the deferred tax assets to determine, based on the weight of available evidence, whether it is more likely than not that some or all of the deferred tax assets will not be realized. As of December 31, 2023, based on all available positive and negative evidence, having demonstrated sustained profitability which is objective and verifiable, and taking into account anticipated future earnings, we have concluded that it is more likely than not that our U.S. federal and state deferred tax assets will be realizable, with the exception of California research and development credits, capital loss carryovers, and certain losses subject to the dual consolidated loss rules. We continue to maintain a valuation allowance against our California research and development credit deferred tax assets due to the uncertainty regarding realizability of these deferred tax assets as they have not met the “more likely than not” realization criteria, particularly as we expect research and development tax credit generation to exceed our ability to use the credits in future years. When a change in valuation allowance is recognized during an interim period, the change in valuation allowance resulting from current year income is included in the annual effective tax rate and the release of valuation allowance supported by projections of future taxable income is recorded as a discrete tax benefit in the interim period. We released $2.9 billion of our valuation allowance in 2023 and will continue to monitor the need for a valuation allowance against our deferred tax assets on a quarterly basis.
While we believe that we have adequately reserved for our uncertain tax positions, no assurance can be given that the final tax outcome of these matters will not be different. We adjust these reserves in light of changing facts and circumstances, such as the closing of a tax audit. To the extent that the final tax outcome of these matters is different than the amounts recorded, such differences will impact the provision for (benefit from) income taxes and the effective tax rate in the period in which such determination is made.
Recent Accounting Pronouncements
See Note 2, Summary of Significant Accounting Policies, to our consolidated financial statements included in Item 8 of Part II of this Annual Report on Form 10-K.
Item 7A. Quantitative and Qualitative Disclosures About Market Risk
Our substantial operations around the world expose us to various market risks. These risks primarily include foreign currency risk and investment risk.
Foreign Currency Exchange Risk
We offer the ability to transact on our platform in over 40 currencies, of which the most significant foreign currencies to our operations in 2023 were the Euro, British Pound, Canadian Dollar, Australian Dollar, Brazilian Real, and Mexican Peso. Our international revenue, as well as costs and expenses denominated in foreign currencies, expose us to the risk of fluctuations in foreign currency exchange rates against the U.S. dollar. Accordingly, we are subject to foreign currency risk, which may adversely impact our financial results.
We have foreign currency exchange risks related primarily to:
-
revenue and cost of revenue associated with bookings on our platform denominated in currencies other than the U.S. dollar;
-
balances held as funds receivable and amounts held on behalf of customers and funds payable and amounts payable to customers;
-
unbilled amounts for confirmed bookings under the terms of our Pay Less Upfront program; and
-
intercompany balances primarily related to our payment entities that process customer payments.
For revenue and cost of revenue associated with bookings on our platform outside of the United States, we generally receive net foreign currency amounts and therefore benefit from a weakening of the U.S. dollar and are adversely affected by a strengthening of the U.S. dollar. Movements in foreign exchange rates are recorded in other income (expense), net in our consolidated statements of operations. Furthermore, our platform generally enables guests to make payments in the currency of their choice to the extent that the currency is supported by Airbnb, which may not match the currency in which the Host elects to be paid. As a result, in those cases, we bear the currency risk of both the guest payment as well as the Host payment due to timing differences in such payments.
We enter into foreign currency derivative contracts to protect against foreign exchange risks. These hedges are primarily designed to manage foreign exchange risk associated with forecasted foreign denominated revenue, balances held as funds payable and amounts payable to customers, and unbilled amounts for confirmed bookings under the terms of our Pay Less Upfront program. These contracts reduce, but do not entirely eliminate, the impact of foreign currency exchange rate movements on our revenue, assets and liabilities. However, we may choose not to hedge certain exposures for a variety of reasons including accounting considerations or the prohibitive economic cost of hedging particular exposures.
We have experienced and will continue to experience fluctuations in foreign exchange gains and losses related to changes in exchange rates. If our foreign-currency denominated assets, liabilities, revenues or expenses increase, our results of operations may be more significantly impacted by fluctuations in the exchange rates of the currencies in which we do business.
If an adverse 10% foreign currency exchange rate change was applied to total net monetary assets and liabilities denominated in currencies other than the local currencies as of December 31, 2023, it would have resulted in a loss of approximately $20 million.
Investment and Interest Rate Risk
We are exposed to interest rate risk related primarily to our investment portfolio. Changes in interest rates affect the interest earned on our total cash, cash equivalents, available-for-sale short-term investments, and the fair value of those securities.
We had cash and cash equivalents of $6.9 billion and short-term investments of $3.2 billion as of December 31, 2023, which primarily consisted of corporate debt securities, commercial paper, certificates of deposit, U.S. government and government agency debt securities (“government bonds”), and mortgage-backed and asset-backed securities and time deposits. As of December 31, 2023, we had an additional $5.9 billion that we held for bookings in advance of guests completing check-ins, which we record separately on our consolidated balance sheets as funds receivable and amounts held on behalf of customers. The primary objective of our investment activities is to preserve capital and meet liquidity requirements without significantly increasing risk. We invest primarily in highly-liquid, investment grade debt securities, and we limit the amount of credit exposure to any one issuer. We do not enter into investments for trading or speculative purposes and have not used any derivative financial instruments to manage our interest rate risk exposure. Because our cash equivalents and short-term investments generally have short maturities, the fair value of our portfolio is relatively insensitive to interest rate fluctuations. Due to the short-term nature of our investments, we have not been exposed to, nor do we anticipate being exposed to, material risks due to changes in interest rates. A hypothetical 100 basis point increase in interest rates would have resulted in a decrease of $20 million to our investment portfolio as of December 31, 2023.
Item 8. Financial Statements and Supplementary Data
Index to Consolidated Financial Statements and Schedule
| Page | |||||
| Report of Independent Registered Public Accounting Firm (PCAOB ID 238) | 65 | ||||
| Consolidated Financial Statements | |||||
| Consolidated Balance Sheets | 67 | ||||
| Consolidated Statements of Operations | 68 | ||||
| Consolidated Statements of Comprehensive Income (Loss) | 69 | ||||
| Consolidated Statements of Stockholders’ Equity | 70 | ||||
| Consolidated Statements of Cash Flows | 71 | ||||
| Notes to Consolidated Financial Statements | 72 | ||||
| Financial Statement Schedule | |||||
| Schedule II—Valuation and Qualifying Accounts | 101 |
Report of Independent Registered Public Accounting Firm
To the Board of Directors and Stockholders of Airbnb, Inc.
Opinions on the Financial Statements and Internal Control over Financial Reporting
We have audited the accompanying consolidated balance sheets of Airbnb, Inc. and its subsidiaries (the “Company”) as of December 31, 2023 and 2022, and the related consolidated statements of operations, of comprehensive income (loss), of stockholders’ equity, and of cash flows for each of the three years in the period ended December 31, 2023, including the related notes and financial statement schedule listed in the accompanying index for each of the three years in the period ended December 31, 2023 (collectively referred to as the “consolidated financial statements”). We also have audited the Company's internal control over financial reporting as of December 31, 2023, based on criteria established in Internal Control - Integrated Framework (2013) issued by the Committee of Sponsoring Organizations of the Treadway Commission (COSO).
In our opinion, the consolidated financial statements referred to above present fairly, in all material respects, the financial position of the Company as of December 31, 2023 and 2022, and the results of its operations and its cash flows for each of the three years in the period ended December 31, 2023 in conformity with accounting principles generally accepted in the United States of America. Also in our opinion, the Company maintained, in all material respects, effective internal control over financial reporting as of December 31, 2023, based on criteria established in Internal Control - Integrated Framework (2013) issued by the COSO.
Basis for Opinions
The Company's management is responsible for these consolidated financial statements, for maintaining effective internal control over financial reporting, and for its assessment of the effectiveness of internal control over financial reporting, included in Management’s Report on Internal Control over Financial Reporting appearing under Item 9A. Our responsibility is to express opinions on the Company’s consolidated financial statements and on the Company's internal control over financial reporting based on our audits. We are a public accounting firm registered with the Public Company Accounting Oversight Board (United States) (PCAOB) and are required to be independent with respect to the Company in accordance with the U.S. federal securities laws and the applicable rules and regulations of the Securities and Exchange Commission and the PCAOB.
We conducted our audits in accordance with the standards of the PCAOB. Those standards require that we plan and perform the audits to obtain reasonable assurance about whether the consolidated financial statements are free of material misstatement, whether due to error or fraud, and whether effective internal control over financial reporting was maintained in all material respects.
Our audits of the consolidated financial statements included performing procedures to assess the risks of material misstatement of the consolidated financial statements, whether due to error or fraud, and performing procedures that respond to those risks. Such procedures included examining, on a test basis, evidence regarding the amounts and disclosures in the consolidated financial statements. Our audits also included evaluating the accounting principles used and significant estimates made by management, as well as evaluating the overall presentation of the consolidated financial statements. Our audit of internal control over financial reporting included obtaining an understanding of internal control over financial reporting, assessing the risk that a material weakness exists, and testing and evaluating the design and operating effectiveness of internal control based on the assessed risk. Our audits also included performing such other procedures as we considered necessary in the circumstances. We believe that our audits provide a reasonable basis for our opinions.
Definition and Limitations of Internal Control over Financial Reporting
A company’s internal control over financial reporting is a process designed to provide reasonable assurance regarding the reliability of financial reporting and the preparation of financial statements for external purposes in accordance with generally accepted accounting principles. A company’s internal control over financial reporting includes those policies and procedures that (i) pertain to the maintenance of records that, in reasonable detail, accurately and fairly reflect the transactions and dispositions of the assets of the company; (ii) provide reasonable assurance that transactions are recorded as necessary to permit preparation of financial statements in accordance with generally accepted accounting principles, and that receipts and expenditures of the company are being made only in accordance with authorizations of management and directors of the company; and (iii) provide reasonable assurance regarding prevention or timely detection of unauthorized acquisition, use, or disposition of the company’s assets that could have a material effect on the financial statements.
Because of its inherent limitations, internal control over financial reporting may not prevent or detect misstatements. Also, projections of any evaluation of effectiveness to future periods are subject to the risk that controls may become inadequate because of changes in conditions, or that the degree of compliance with the policies or procedures may deteriorate.
Critical Audit Matters
The critical audit matter communicated below is a matter arising from the current period audit of the consolidated financial statements that was communicated or required to be communicated to the audit committee and that (i) relates to accounts or disclosures that are material to the consolidated financial statements and (ii) involved our especially challenging, subjective, or complex judgments. The communication of critical audit matters does not alter in any way our opinion on the consolidated financial statements, taken as a whole, and we are not, by communicating the critical audit matter below, providing a separate opinion on the critical audit matter or on the accounts or disclosures to which it relates.
**[Table of Contents](#i992b3f2319b349
Showing the first 8K of 181K characters. Open the full section
Item 9. Changes in and Disagreements with Accountants on Accounting and Financial Disclosure
None.
Item 9A. Controls and Procedures
Evaluation of Disclosure Controls and Procedures
Our management, with the participation of our principal executive officer and principal financial officer, conducted an evaluation of the effectiveness of the design and operation of our disclosure controls and procedures, as defined in Rules 13a-15(e) and 15d-15(e) under the Exchange Act, as of the end of the period covered by this Annual Report on Form 10-K. Based on that evaluation, our principal executive officer and principal financial officer have concluded that our disclosure controls and procedures were effective as of December 31, 2023, the end of the period covered by this Annual Report on Form 10-K, to provide reasonable assurance that information required to be disclosed by us in reports that we file or submit under the Exchange Act is (i) recorded, processed, summarized and reported within the time periods specified in the SEC rules and forms and (ii) accumulated and communicated to our management, including our principal executive officer and principal financial officer, as appropriate to allow timely decisions regarding required disclosure.
Management’s Report on Internal Control over Financial Reporting
Our management is responsible for establishing and maintaining adequate internal control over financial reporting (as defined in Rules 13a-15(f) and 15d-15(f) under the Exchange Act). Internal control over financial reporting is a process designed to provide reasonable assurance regarding the reliability of our financial reporting and the preparation of consolidated financial statements for external purposes in accordance with generally accepted accounting principles.
Our management, under the supervision of our principal executive officer and principal financial officer, conducted an evaluation of the effectiveness of our internal control over financial reporting as of December 31, 2023 based on the framework in Internal Control-Integrated Framework (2013), issued by the Committee of Sponsoring Organizations of the Treadway Commission. Based on this evaluation, management, including our principal executive officer and principal financial officer, concluded that our internal control over financial reporting was effective as of December 31, 2023.
The effectiveness of our internal control over financial reporting as of December 31, 2023 has been audited by PricewaterhouseCoopers LLP, an independent registered public accounting firm, as stated in their report, which is included in Item 8 of this Annual Report on Form 10-K.
Changes in Internal Control Over Financial Reporting
There were no changes in our internal control over financial reporting, as defined in Rules 13a-15(f) and 15d-15(f) under the Exchange Act, during the quarter ended December 31, 2023 that materially affected, or are reasonably likely to materially affect, our internal control over financial reporting.
Limitations on Controls
Our disclosure controls and procedures and internal control over financial reporting are designed to provide reasonable assurance of achieving their desired objectives. Management does not expect, however, that our disclosure controls and procedures or our internal control over financial reporting will prevent or detect all error and fraud. Any control system, no matter how well designed and operated, is based upon certain assumptions and can provide only reasonable, not absolute, assurance that its objectives will be met. Further, no evaluation of controls can provide absolute assurance that misstatements due to error or fraud will not occur or that all control issues and instances of fraud, if any, within our Company have been detected.
Item 9B. Other Information
Director and Officer 10b5-1 Trading Plans (“10b5-1 Plans”)
The following table sets forth the material terms of 10b5-1 Plans intended to satisfy the affirmative defense conditions of Rule 10b5–1(c) that were adopted, terminated, or modified by our directors and officers during the three months ended December 31, 2023:
| Name and Title of Director or Officer | Action | Date | Expiration Date | Maximum Number of Shares to be Sold Under the Plan | ||||||||||
| Ari Balogh, Chief Technology Officer | Adopt | 11/29/2023 | 10/31/2024 | 525,688 |
There were no “non-Rule 10b5-1 trading arrangements,” as defined in Item 408(c) of Regulation S-K, adopted, terminated, or modified by our directors or officers during the three months ended December 31, 2023.
Item 9C. Disclosure Regarding Foreign Jurisdictions that Prevent Inspections
Not applicable.
PART III
Item 10. Directors, Executive Officers and Corporate Governance
The information required by this Item is incorporated by reference to the Company’s 2024 Proxy Statement (the “2024 Proxy Statement”) to be filed with the SEC within 120 days after December 31, 2023 in connection with the solicitation of proxies for the Company’s 2024 annual meeting of stockholders.
We have adopted a Code of Ethics that applies to our officers, directors and employees, which is available on our website (investors.airbnb.com) under “Governance.” The Code of Ethics is intended to qualify as a “code of ethics” within the meaning of Section 406 of the Sarbanes-Oxley Act of 2002, as amended, and Item 406 of Regulation S-K. In addition, we intend to promptly disclose on our website (investors.airbnb.com) (1) the nature of any amendment to our Code of Ethics that applies to our directors or our principal executive officer, principal financial officer, principal accounting officer or controller or persons performing similar functions and (2) the nature of any waiver, including an implicit waiver, from a provision of our Code of Ethics that is granted to a director or one of these specified officers, the name of such person who is granted the waiver and the date of the waiver.
Item 11. Executive Compensation
The information required by this Item is incorporated by reference to the 2024 Proxy Statement.
Item 12. Security Ownership of Certain Beneficial Owners and Management and Related Stockholder Matters
The information required by this Item is incorporated by reference to the 2024 Proxy Statement.
Item 13. Certain Relationships and Related Transactions, and Director Independence
The information required by this Item is incorporated by reference to the 2024 Proxy Statement.
Item 14. Principal Accountant Fees and Services
The information required by this Item is incorporated by reference to the 2024 Proxy Statement.
PART IV
Item 15. Exhibit and Financial Statement Schedules
(a) Documents filed as part of this Annual Report on Form 10-K:
(1) Consolidated Financial Statements
Our consolidated financial statements are listed in the “Index to Consolidated Financial Statements and Schedule” under Part II, Item 8 of this Annual Report on Form 10-K.
(2) Financial Statement Schedules
All financial statement schedules have been omitted because they are not applicable, not material or the required information is shown in Part II, Item 8 of this Annual Report on Form 10-K.
(3) Exhibits
The documents listed in the Exhibit Index of this Annual Report on Form 10-K are incorporated by reference or are filed with this Annual Report on Form 10-K, in each case as indicated herein (numbered in accordance with Item 601 of Regulation S-K).
Exhibit Index
Indicates management contract or compensatory plan.
- The certifications attached as Exhibit 32.1 that accompany this Annual Report on Form 10-K are deemed furnished and not filed with the Securities and Exchange Commission and are not to be incorporated by reference into any filing of Airbnb, Inc. under the Securities Act of 1933, as amended, or the Securities Exchange Act of 1934, as amended, whether made before or after the date of this Annual Report on Form 10-K, irrespective of any general incorporation language contained in such filing.
Item 16. Form 10-K Summary
None.
Signatures
Pursuant to the requirements of Section 13 or 15(d) of the Securities Exchange Act of 1934, as amended, the Registrant has duly caused this Annual Report on Form 10-K to be signed on its behalf by the undersigned, thereunto duly authorized.
| AIRBNB, INC. | ||||||||
| By: | /s/ Brian Chesky | |||||||
| Date: February 16, 2024 | Brian Chesky Chief Executive Officer |
Power of Attorney
KNOW ALL PERSONS BY THESE PRESENTS, that each person whose signature appears below constitutes and appoints Brian Chesky, David E. Stephenson, and Ronald A. Klain, and each one of them, as his or her true and lawful attorneys-in-fact and agents, with full power of substitution and resubstitution, for him or her and in their name, place and stead, in any and all capacities, to sign any amendments to this Annual Report on Form 10-K and to file the same, with exhibits thereto and other documents in connection therewith, with the Securities and Exchange Commission, hereby ratifying and confirming all that each of said attorneys-in-fact, or substitute or substitutes, may do or cause to be done by virtue hereof.
Pursuant to the requirements of the Securities Exchange Act of 1934, as amended, this report has been signed by the following persons on behalf of the registrant and in the capacities and on the dates indicated.
| Name and Signature | Title | Date | ||||||
| /s/ Brian Chesky | Chief Executive Officer and Director (Principal Executive Officer) | February 16, 2024 | ||||||
| Brian Chesky | ||||||||
| /s/ David E. Stephenson | Chief Financial Officer (Principal Financial Officer) | February 16, 2024 | ||||||
| David E. Stephenson | ||||||||
| /s/ David Bernstein | Chief Accounting Officer (Principal Accounting Officer) | February 16, 2024 | ||||||
| David Bernstein | ||||||||
| /s/ Angela Ahrendts | Director | February 16, 2024 | ||||||
| Angela Ahrendts | ||||||||
| /s/ Amrita Ahuja | Director | February 16, 2024 | ||||||
| Amrita Ahuja | ||||||||
| /s/ Nathan Blecharczyk | Director | February 16, 2024 | ||||||
| Nathan Blecharczyk | ||||||||
| /s/ Kenneth Chenault | Director | February 16, 2024 | ||||||
| Kenneth Chenault | ||||||||
| /s/ Joseph Gebbia | Director | February 16, 2024 | ||||||
| Joseph Gebbia | ||||||||
| /s/ Jeffrey Jordan | Director | February 16, 2024 | ||||||
| Jeffrey Jordan | ||||||||
| /s/ Alfred Lin | Director | February 16, 2024 | ||||||
| Alfred Lin | ||||||||
| /s/ James Manyika | Director | February 16, 2024 | ||||||
| James Manyika |