 filings.tools
Arch Capital Group 10-K 2019-12-31
Filed 2020-02-28. 18 sections, 1012K characters. Original on sec.gov · Markdown · JSON
Cover and table of contents
| UNITED STATES | ||
| SECURITIES AND EXCHANGE COMMISSION | ||
| Washington, D.C. 20549 |
FORM 10-K
| ☒ | ANNUAL REPORT PURSUANT TO SECTION 13 OR 15(d) OF THE SECURITIES EXCHANGE ACT OF 1934 | |
| OR | ||
| ☐ | TRANSITION REPORT PURSUANT TO SECTION 13 OR 15(d) OF THE SECURITIES EXCHANGE ACT OF 1934 |
| For the Fiscal Year Ended | December 31, 2019 | Commission File No. | 001-16209 |

ARCH CAPITAL GROUP LTD.
(Exact name of registrant as specified in its charter)
| Bermuda | 98-0374481 |
| (State or other jurisdiction of incorporation or organization) | (I.R.S. Employer Identification No.) |
| Waterloo House, Ground Floor | |||||
| 100 Pitts Bay Road, | Pembroke | HM 08, | Bermuda | (441) | 278-9250 |
| (Address of principal executive offices) | (Registrant’s telephone number, including area code) |
Securities registered pursuant to Section 12(b) of the Exchange Act:
| Title of each class | Trading Symbol (s) | Name of each exchange on which registered | |||
| Common Shares, $0.0011 par value per share | ACGL | NASDAQ | Stock Market | ||
| Depositary shares, each representing a 1/1,000th interest in a 5.25% Series E preferred share | ACGLP | NASDAQ | Stock Market | ||
| Depositary shares, each representing a 1/1,000th interest in a 5.45% Series F preferred share | ACGLO | NASDAQ | Stock Market |
Securities registered pursuant to Section 12(g) of the Exchange Act: None
Indicate by check mark if the registrant is a well-known seasoned issuer, as defined in Rule 405 of the Securities Act. Yes ☑ No ☐
Indicate by check mark if the registrant is not required to file reports pursuant to Section 13 or Section 15(d) of the Exchange Act.
Yes ☐ No ☑
Indicate by check mark whether the registrant (1) has filed all reports required to be filed by Section 13 or 15(d) of the Exchange Act during the preceding 12 months (or for such shorter period that the registrant was required to file such reports), and (2) has been subject to such filing requirements for the past 90 days. Yes ☑ No ☐
Indicate by check mark whether the registrant has submitted electronically every Interactive Data File required to be submitted pursuant to Rule 405 of Regulation S-T (§232.405 of this chapter) during the preceding 12 months (or for such shorter period that the registrant was required to submit such files). Yes ☑ No ☐
Indicate by check mark if disclosure of delinquent filers pursuant to Item 405 of Regulation S-K (§229.405 of this chapter) is not contained herein, and will not be contained, to the best of registrant’s knowledge, in definitive proxy or information statements incorporated by reference in Part III of this Form 10-K or any amendment to this Form 10-K. ☐
Indicate by check mark whether the registrant is a large accelerated filer, an accelerated filer, a non-accelerated filer, a smaller reporting company, or an emerging growth company. See the definitions of “large accelerated filer,” “accelerated filer,” “smaller reporting company,” and “emerging growth company” in Rule 12b-2 of the Exchange Act.
Large accelerated Filer ☑ Accelerated Filer ☐ Non-accelerated Filer ☐ Smaller reporting company ☐ Emerging Growth Company ☐
If an emerging growth company, indicate by check mark if the Registrant has elected not to use the extended transition period for complying with any new or revised financial accounting standards provided pursuant to Section 13(a) of the Exchange Act. o
Indicate by check mark whether the registrant is a shell company (as defined in Rule 12b-2 of the Exchange Act). Yes ☐ No ☑
The aggregate market value of the voting and non-voting common equity held by non-affiliates, computed by reference to the closing price as reported by the NASDAQ Stock Market as of the last business day of the Registrant’s most recently completed second fiscal quarter, was approximately $14.6 billion.
As of February 25, 2020, there were 406,658,701 of the registrant’s common shares outstanding.
| DOCUMENTS INCORPORATED BY REFERENCE |
Portions of Part III and Part IV incorporate by reference our definitive proxy statement for the 2020 annual meeting of shareholders to be filed with the Securities and Exchange Commission pursuant to Regulation 14A before May 1, 2020.
Cautionary Note Regarding Forward-Looking Statements
The Private Securities Litigation Reform Act of 1995 (“PSLRA”) provides a “safe harbor” for forward-looking statements. This report or any other written or oral statements made by or on behalf of us may include forward-looking statements, which reflect our current views with respect to future events and financial performance. All statements other than statements of historical fact included in or incorporated by reference in this report are forward-looking statements. Forward-looking statements, for purposes of the PSLRA or otherwise, can generally be identified by the use of forward-looking terminology such as “may,” “will,” “expect,” “intend,” “estimate,” “anticipate,” “believe” or “continue” and similar statements of a future or forward-looking nature or their negative or variations or similar terminology.
Forward-looking statements involve our current assessment of risks and uncertainties. Actual events and results may differ materially from those expressed or implied in these statements. Important factors that could cause actual events or results to differ materially from those indicated in such statements are discussed below, elsewhere in this report and in our periodic reports filed with the Securities and Exchange Commission (“SEC”), and include:
| • | our ability to successfully implement our business strategy during “soft” as well as “hard” markets; |
| • | acceptance of our business strategy, security and financial condition by rating agencies and regulators, as well as by brokers and our insureds and reinsureds; |
| • | the integration of any businesses we have acquired or may acquire into our existing operations; |
| • | our ability to maintain or improve our ratings, which may be affected by our ability to raise additional equity or debt financings, by ratings agencies’ existing or new policies and practices, as well as other factors described herein; |
| • | general economic and market conditions (including inflation, interest rates, unemployment, housing prices, foreign currency exchange rates, prevailing credit terms and the depth and duration of a recession) and conditions specific to the reinsurance and insurance markets (including the length and magnitude of the current “soft” market) in which we operate; |
| • | competition, including increased competition, on the basis of pricing, capacity (including alternative sources of capital), coverage terms, or other factors; |
| • | developments in the world’s financial and capital markets and our access to such markets; |
| • | our ability to successfully enhance, integrate and maintain operating procedures (including information technology) to effectively support our current and new business; |
| • | the loss of key personnel; |
| • | accuracy of those estimates and judgments utilized in the preparation of our financial statements, including those related to revenue recognition, insurance and other reserves, reinsurance recoverables, investment valuations, intangible assets, bad debts, income taxes, contingencies and litigation, and any determination to use the deposit method of accounting; |
| • | greater than expected loss ratios on business written by us and adverse development on claim and/or claim expense liabilities related to business written by our insurance and reinsurance subsidiaries; |
| • | severity and/or frequency of losses; |
| • | claims for natural or man-made catastrophic events or severe economic events in our insurance, reinsurance and mortgage businesses could cause large losses and substantial volatility in our results of operations; |
| • | the effect of climate change on our business; |
| • | the effect of contagious diseases (including coronavirus) on our business; |
| • | acts of terrorism, political unrest and other hostilities or other unforecasted and unpredictable events; |
| • | availability to us of reinsurance to manage our gross and net exposures and the cost of such reinsurance; |
| • | the failure of reinsurers, managing general agents, third party administrators or others to meet their obligations to us; |
| • | the timing of loss payments being faster or the receipt of reinsurance recoverables being slower than anticipated by us; |
| • | our investment performance, including legislative or regulatory developments that may adversely affect the fair value of our investments; |
| ARCH CAPITAL | 1 | 2019 FORM 10-K |
| • | changes in general economic conditions, including sovereign debt concerns or downgrades of U.S. securities by credit rating agencies, which could affect our business, financial condition and results of operations; |
| • | changes in the method for determining the London Inter-bank Offered Rate (“LIBOR”) and the potential replacement of LIBOR; |
| • | the volatility of our shareholders’ equity from foreign currency fluctuations, which could increase due to us not matching portions of our projected liabilities in foreign currencies with investments in the same currencies; |
| • | changes in accounting principles or policies or in our application of such accounting principles or policies; |
| • | changes in the political environment of certain countries in which we operate or underwrite business; |
| • | a disruption caused by cyber-attacks or other technology breaches or failures on us or our business partners and service providers, which could negatively impact our business and/or expose us to litigation; |
| • | statutory or regulatory developments, including as to tax matters and insurance and other regulatory matters such as the adoption of proposed legislation that would affect Bermuda-headquartered companies and/or Bermuda-based insurers or reinsurers and/or changes in regulations or tax laws applicable to us, our subsidiaries, brokers or customers, including the Tax Cuts and Jobs Act of 2017; and |
| • | the other matters set forth under Item 1A “Risk Factors,” Item 7 “Management’s Discussion and Analysis of Financial Condition and Results of Operations” and other sections of this Annual Report on Form 10-K, as well as the other factors set forth in Arch Capital Group Ltd.’s other documents on file with the SEC, and management’s response to any of the aforementioned factors. |
All subsequent written and oral forward-looking statements attributable to us or persons acting on our behalf are expressly qualified in their entirety by these cautionary statements. The foregoing review of important factors should not be construed as exhaustive and should be read in conjunction with other cautionary statements that are included herein or elsewhere. We undertake no obligation to publicly update or revise any forward-looking statement, whether as a result of new information, future events or otherwise.
| ARCH CAPITAL | 2 | 2019 FORM 10-K |
PART I
Item 1. BUSINESS
As used in this report, references to “we,” “us,” “our,” “Arch” or the “Company” refer to the consolidated operations of Arch Capital Group Ltd. (“Arch Capital”) and its subsidiaries. Tabular amounts are in U.S. Dollars in thousands, except share amounts, unless otherwise noted. We refer you to Item 1A “Risk Factors” for a discussion of risk factors relating to our business.
OUR COMPANY
General
Arch Capital, a Bermuda public limited liability company with $13.23 billion in capital at December 31, 2019, provides insurance, reinsurance and mortgage insurance on a worldwide basis through its wholly owned subsidiaries. While we are positioned to provide a full range of property, casualty and mortgage insurance and reinsurance lines, we focus on writing specialty lines of insurance and reinsurance. For 2019, we wrote $6.04 billion of net premiums and reported net income available to Arch common shareholders of $1.59 billion. Book value per share was $26.42 at December 31, 2019, compared to $21.52 per share at December 31, 2018.
Arch Capital’s registered office is located at Clarendon House, 2 Church Street, Hamilton HM 11, Bermuda (telephone number: (441) 295-1422), and its principal executive offices are located at Waterloo House, Ground Floor, 100 Pitts Bay Road, Pembroke HM 08, Bermuda (telephone number: (441) 278-9250). Arch Capital makes available free of charge through its website, located at www.archcapgroup.com, its annual reports on Form 10-K, quarterly reports on Form 10-Q, current reports on Form 8-K, and all amendments to those reports as soon as reasonably practicable after such material is electronically filed with, or furnished to, the SEC. The SEC maintains an Internet site that contains reports, proxy and information statements, and other information regarding issuers that file electronically with the SEC (such as Arch Capital) and the address of that site is www.sec.gov.
Our History
Arch Capital was formed in September 2000 and became the sole shareholder of Arch Capital Group (U.S.) Inc. (“Arch-U.S.”) pursuant to an internal reorganization transaction completed in November 2000. In October 2001, Arch Capital launched an underwriting initiative to meet current and future demand in the global insurance and reinsurance markets that included the recruitment of new management teams and an equity capital infusion of $763.2 million which created a strong
capital base that was unencumbered by significant pre-2002 risks. Since then, we have attracted a proven management team with extensive industry experience and enhanced our existing global underwriting platform for our insurance, reinsurance and mortgage insurance and reinsurance businesses as described below.
Our insurance underwriting platform initially consisted of Arch Insurance (Bermuda), a division of Arch Reinsurance Ltd. (“Arch Re Bermuda”), our Bermuda-based reinsurer and insurer, and our U.S.-licensed insurers, Arch Insurance Company (“Arch Insurance”), Arch Excess & Surplus Insurance Company (“Arch E&S”), Arch Specialty Insurance Company (“Arch Specialty”) and Arch Indemnity Insurance Company (“Arch Indemnity”).
We established Arch Insurance (UK) Limited (“Arch Insurance (U.K.)”), our United Kingdom-based subsidiary, in 2004, and we expanded our North American presence when Arch Insurance opened a branch office in Canada in 2005. In 2013, Arch Insurance Canada Ltd. (“Arch Insurance Canada”), a Canada domestic company, commenced operations and replaced the branch office. In 2009, we established a managing agent and syndicate 2012 (“Arch Syndicate 2012”) at Lloyd’s of London (“Lloyd’s”) and in 2018, we acquired McNeil & Company, Inc. (“McNeil”), a U.S. nationwide leader in specialized risk management and program administration.
We expanded our insurance platform in 2019 through two acquisitions. In January 2019 we acquired a book of U.K. commercial lines business from Ardonagh Group and are writing this business through Arch Insurance (U.K.) (“Arch U.K. Regional Division”). In November 2019, we completed the acquisition of Barbican Group Holdings Limited (“Barbican Holdings”), a Guernsey company, and its subsidiaries, including Barbican Managing Agency Limited (“BMAL”) and Lloyd’s Syndicate 1955 (“Barbican Syndicate 1955”). BMAL also provides Managing Agency services to Third Party Capital Syndicate 1856 (“Arcus”). Barbican Holdings also includes Castel Underwriting Agencies Limited (“Castel”) and other associated entities (collectively, “Barbican”). We also acquired U.K. commercial lines business from Ardonagh Group in January 2019, and this business is now written through Arch Insurance (U.K.) (“Arch U.K. Regional Division”). See “Operations—Insurance Operations” for further details on our insurance operations.
Our reinsurance underwriting platform initially consisted of Arch Re Bermuda and Arch Reinsurance Company (“Arch Re U.S.”), our U.S.-licensed reinsurer. Our reinsurance operations
| ARCH CAPITAL | 3 | 2019 FORM 10-K |
in Europe began in 2006 with the formation of a Swiss branch of Arch Re Bermuda, and the formation of a Danish underwriting agency in 2007. In addition to the U.S. reinsurance treaty activities of Arch Re U.S., we launched our property facultative reinsurance underwriting operations in 2007, which underwrite in the U.S., Canada and Europe. In 2008, we formed Arch Reinsurance Europe Designated Activity Company (“Arch Re Europe”), our Ireland-based reinsurance company, which replaced the Swiss branch. We launched treaty operations in Canada in 2011 and the following year we acquired the credit and surety reinsurance operations of Ariel Reinsurance Company Ltd. The acquisition of Barbican in November 2019 also contributed to our reinsurance operations. See “Operations—Reinsurance Operations” for further details on our reinsurance operations.
Our mortgage operations include U.S. and international mortgage insurance and reinsurance operations as well as participation in government sponsored enterprise (“GSE”) credit risk-sharing transactions. Formed in 2011, Arch Insurance (EU) Designated Activity Company (formerly, Arch Mortgage Insurance Designated Activity Company) (“Arch Insurance (EU)”), provides mortgage insurance products and services to the European market.
Our mortgage platform was built through the acquisition of CMG Mortgage Insurance Company in 2014 (subsequently renamed Arch Mortgage Insurance Company). We further expanded our U.S. operations in 2016 through the acquisition of United Guaranty Corporation (“UGC”) (including United Guaranty Residential Insurance Company), from American International Group, Inc. (“AIG”). We acquired AIG United Guaranty Insurance (Asia) Limited (renamed “Arch MI Asia Limited”) from AIG in 2017. In January 2019, Arch LMI Pty Ltd (“Arch LMI”) was authorized by the Australian Prudential Regulation Authority (“APRA”) to write lenders’ mortgage insurance on a direct basis in Australia.
Our U.S. primary mortgage operations provide mortgage insurance products and services to the U.S. market. These operations include providers that are also approved as eligible mortgage insurers by Federal National Mortgage Association (“Fannie Mae”) and Federal Home Loan Mortgage Corporation (“Freddie Mac”), each a GSE. The mortgage operations also include participation in GSE credit risk-sharing transactions and direct mortgage insurance to U.S. mortgage lenders with respect to mortgages that lenders intend to retain in portfolio or include in non-agency securitizations along with mortgage reinsurance on a global basis. See “Operations—Mortgage Operations” for further details on our mortgage operations.
It is our belief that our underwriting platform, our experienced management team and our strong capital base have enabled us to establish a strong presence in the markets we participate in.
In 2014 we acquired approximately 11% of Watford Holdings Ltd. Watford Holdings Ltd. i
Showing the first 8K of 156K characters. Open the full section
Item 1A. RISK FACTORS
Set forth below are risk factors relating to our business. These risks and uncertainties are not the only ones we face. There may be additional risks that we currently consider not to be material or of which we are not currently aware, and any of these risks could cause our actual results to differ materially from historical or anticipated results. You should carefully consider these risks along with the other information provided in this report, including our “Management’s Discussion and Analysis of Financial Condition and Results of Operations” and our accompanying consolidated financial statements, as well as the information under the heading “Cautionary Note Regarding Forward-Looking Statements” before investing in any of our securities. We may amend, supplement or add to the risk factors described below from time to time in future reports filed with the SEC.
Risks Relating to Our Industry
We operate in a highly competitive environment, and we may not be able to compete successfully in our industry.
The insurance and reinsurance industry is highly competitive. We compete on an international and regional basis with major U.S. and non-U.S. insurers and reinsurers, many of which have greater financial, marketing and management resources than we do. See “Competition” in Item 1 for details on our competitors in each of the major segments we operate in. There has been significant consolidation in the insurance and reinsurance sector in recent years and we may experience increased competition as a result of that consolidation, with consolidated entities having enhanced market power. These consolidated entities may use their enhanced market power and broader capital base to negotiate price reductions for products and services that compete with ours, and we may experience rate declines and possibly write less business. Any failure by us to effectively compete could adversely affect our financial condition and results of operations.
The insurance and reinsurance industry is highly cyclical, and we expect to continue to experience periods characterized by excess underwriting capacity and unfavorable premium rates.
Historically, insurers and reinsurers have experienced significant fluctuations in operating results due to competition, frequency of occurrence or severity of catastrophic events, levels of capacity, general economic conditions, changes in equity, debt and other investment markets, changes in legislation, case law and prevailing concepts of liability and other factors. In particular, demand for reinsurance is influenced significantly by the underwriting results of primary insurers and prevailing general economic conditions. The supply of insurance and reinsurance is related to prevailing prices and levels of surplus capacity that, in turn, may fluctuate in response to changes in rates of return being realized in the insurance and reinsurance industry on both underwriting and investment sides. As a result, the insurance and reinsurance business historically has been a cyclical industry characterized by periods of intense price competition due to excessive underwriting capacity as well as periods when shortages of capacity permitted favorable premium levels and changes in terms and conditions. The supply of insurance and reinsurance has increased over the past several years and may increase further, either as a result of capital provided by new entrants or by the commitment of additional capital by existing insurers or reinsurers. Continued increases in the supply of insurance and reinsurance may have consequences for us, including fewer contracts written, lower premium rates, increased expenses for customer acquisition and retention, and less favorable policy terms and conditions.
| ARCH CAPITAL | 29 | 2019 FORM 10-K |
Claims for catastrophic events could cause large losses and substantial volatility in our results of operations and could have a material adverse effect on our financial position and results of operations.
We have large aggregate exposures to natural and man-made catastrophic events. Catastrophes can be caused by various events, including hurricanes, floods, tsunamis, windstorms, earthquakes, hailstorms, tornadoes, explosions, severe winter weather, fires, droughts and other natural disasters. The frequency and severity of natural catastrophe activity, including hurricanes, tsunamis, tornadoes, floods and droughts, has also been greater in recent years. Catastrophes can also cause losses in non-property business such as workers’ compensation or general liability. In addition to the nature of the property business, we believe that economic and geographic trends affecting insured property, including inflation, property value appreciation and geographic concentration tend to generally increase the size of losses from catastrophic events over time. Actual losses from future catastrophic events may vary materially from estimates due to the inherent uncertainties in making such determinations resulting from several factors, including the potential inaccuracies and inadequacies in the data provided by clients, brokers and ceding companies, the modeling techniques and the application of such techniques, the contingent nature of business interruption exposures, the effects of any resultant demand surge on claims activity and attendant coverage issues.
In addition, over the past several years, changing weather patterns and climatic conditions, such as global warming, have added to the unpredictability and frequency of natural disasters in certain parts of the world and created additional uncertainty as to future trends and exposures. Although the loss experience of catastrophe insurers and reinsurers has historically been characterized as low frequency, there is a growing consensus today that climate change increases the frequency and severity of extreme weather events and, in recent years, the frequency of major catastrophes appears to have increased, and may continue to increase in the future.
Claims for catastrophic events, or an unusual frequency of smaller losses in a particular period, could expose us to large losses, cause substantial volatility in our results of operations and could have a material adverse effect on our ability to write new business if we are not able to adequately assess and reserve for the increased frequency and severity of catastrophes resulting from these environmental factors. Additionally, catastrophic events could result in increased credit exposure to reinsurers and other counterparties we transact business with, declines in the value of investments we hold and significant disruptions to our physical infrastructure, systems and operations.
Additionally, we cannot predict how legal, regulatory and/or social responses to concerns around global climate change may impact our business. We attempt to manage our exposure to such events through the use of underwriting controls, risk models, and the purchase of third-party reinsurance. Underwriting controls can include more restrictive underwriting criteria such as higher premiums and deductibles, or losses retained, and more specifically excluded policy risks. Our deductible in connection with a catastrophic event is determined by market capacity, pricing conditions and surplus preservation. There can be no assurance that our reinsurance coverage and other measures taken will be sufficient to mitigate losses resulting from one or more catastrophic events. As a result, the occurrence of one or more catastrophic events and the continuation and worsening of recent trends could have an adverse effect on our results of operations and financial condition.
Environmental, Social and Governance (ESG) and sustainability have become major topics that encompass a wide range of issues, such as climate change and other environmental risks. It is something that has come to the fo
Showing the first 8K of 125K characters. Open the full section
Item 1B. UNRESOLVED STAFF COMMENTS
None.
Item 2. PROPERTIES
We lease office space in Bermuda where our principal offices are located. Our insurance group leases space for offices in the U.S., Canada, Bermuda, Europe and Australia. Our reinsurance group leases space for offices in the U.S., Bermuda, Europe, Canada and Dubai. Our mortgage group leases space for offices in the U.S., Hong Kong and Australia. We believe that the above described office space is adequate for our needs. However, as we continue to develop our business, we may open additional office locations in 2020.
Item 3. LEGAL PROCEEDINGS
We, in common with the insurance industry in general, are subject to litigation and arbitration in the normal course of our business. As of December 31, 2019, we were not a party to any
litigation or arbitration which is expected by management to have a material adverse effect on our results of operations and financial condition and liquidity.
Item 4. MINE SAFETY DISCLOSURES
Not applicable.
| ARCH CAPITAL | 50 | 2019 FORM 10-K |
PART II
| ITEM 5. | MARKET FOR REGISTRANT’S COMMON EQUITY, RELATED STOCKHOLDER MATTERS AND ISSUER PURCHASES OF EQUITY SECURITIES |
HOLDERS
As of February 25, 2020, and based on information provided to us by our transfer agent and proxy solicitor, there were 784 holders of record of our common shares (NASDAQ: ACGL) and approximately 64,200 beneficial holders of our common shares.
ISSUER PURCHASES OF EQUITY SECURITIES
The following table summarizes our purchases of common shares for the 2019 fourth quarter:
| Issuer Purchases of Common Shares | |||||||||||||
| Period | Total Number of Shares Purchased (1) | Average Price Paid per Share | Total Number of Shares Purchased as Part of Publicly Announced Plans or Programs | Approximate Dollar Value of Shares that May Yet be Purchased Under the Plan or Programs (2) | |||||||||
| 10/1/2019-10/31/2019 | 15,288 | $ | 41.66 | — | $ | 160,867 | |||||||
| 11/1/2019-11/30/2019 | 28,671 | $ | 41.27 | — | $ | 1,000,000 | |||||||
| 12/1/2019-12/31/2019 | 11,361 | $ | 42.06 | — | $ | 1,000,000 | |||||||
| Total | 55,320 | $ | 41.54 | — | $ | 1,000,000 |
| (1) | Includes repurchases by Arch Capital of shares, from time to time, from employees in order to facilitate the payment of withholding taxes on restricted shares granted and the exercise of stock appreciation rights. We purchased these shares at their fair market value, as determined by reference to the closing price of our common shares on the day the restricted shares vested or the stock appreciation rights were exercised. |
| (2) | In November 2019, the Board of Arch Capital increased the share repurchase authorization to $1.0 billion, under which repurchases may be effected from time to time in open market or privately negotiated transactions through December 31, 2021. |
| ARCH CAPITAL | 51 | 2019 FORM 10-K |
PERFORMANCE GRAPH
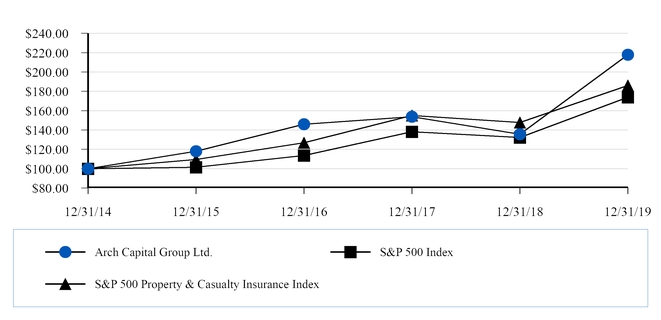
The following graph compares the cumulative total shareholder return on our common shares for each of the last five years through December 31, 2019 to the cumulative total return, assuming reinvestment of dividends, of (1) S&P 500 Composite Stock Index (“S&P 500 Index”) and (2) the S&P 500 Property & Casualty Insurance Index. The share price performance presented below is not necessarily indicative of future results.
CUMULATIVE TOTAL SHAREHOLDER RETURN (1)(2)(3)
| Base Period | |||||||||||||||||||
| Company Name/Index | 12/31/14 | 12/31/15 | 12/31/16 | 12/31/17 | 12/31/18 | 12/31/19 | |||||||||||||
| l | Arch Capital Group Ltd. | $100.00 | $118.02 | $146.01 | $153.59 | $135.63 | $217.72 | ||||||||||||
| n | S&P 500 Index | $100.00 | $101.38 | $113.51 | $138.29 | $132.23 | $173.86 | ||||||||||||
| p | S&P 500 Property & Casualty Insurance Index | $100.00 | $109.53 | $126.73 | $155.10 | $147.83 | $186.07 |
| (1) | Stock price appreciation plus dividends. |
| (2) | The above graph assumes that the value of the investment was $100 on December 31, 2014. |
| (3) | This graph is not “soliciting material,” is not deemed filed with the SEC and is not to be incorporated by reference in any filing by us under the Securities Act of 1933 or the Securities and Exchange Act of 1934, whether made before or after the date hereof and irrespective of any general incorporation language in any such filing. |
| ARCH CAPITAL | 52 | 2019 FORM 10-K |
Item 6. SELECTED FINANCIAL DATA
The following tables set forth summary historical consolidated financial and operating data (including the results of the ‘other’ segment) and should be read in conjunction with “Management’s Discussion and Analysis of Financial Condition and Results of Operations” and our financial statements and the related notes.
| (U.S. dollars in thousands except share data) | Year Ended December 31, | ||||||||||||||||||
| 2019 | 2018 | 2017 | 2016 | 2015 | |||||||||||||||
| Statement of Income Data: | |||||||||||||||||||
| Net premiums written | $ | 6,039,067 | $ | 5,346,747 | $ | 4,961,373 | $ | 4,031,391 | $ | 3,817,531 | |||||||||
| Net premiums earned | 5,786,498 | 5,231,975 | 4,844,532 | 3,884,822 | 3,733,905 | ||||||||||||||
| Net investment income | 627,738 | 563,633 | 470,872 | 366,742 | 348,090 | ||||||||||||||
| Equity in net income (loss) of investments accounted for using the equity method | 123,672 | 45,641 | 142,286 | 48,475 | 25,455 | ||||||||||||||
| Net realized gains (losses) | 366,363 | (405,344 | ) | 149,141 | 137,586 | (185,842 | ) | ||||||||||||
| Total revenues | 6,928,200 | 5,450,568 | 5,627,375 | 4,463,556 | 3,936,590 | ||||||||||||||
| Income before income taxes | 1,849,110 | 841,772 | 757,277 | 855,552 | 567,194 | ||||||||||||||
| Net income | $ | 1,693,300 | $ | 727,821 | $ | 629,709 | $ | 824,178 | $ | 526,582 | |||||||||
| Net (income) loss attributable to noncontrolling interests | (56,981 | ) | 30,150 | (10,431 | ) | (131,440 | ) | 11,156 | |||||||||||
| Net income available to Arch | 1,636,319 | 757,971 | 619,278 | 692,738 | 537,738 | ||||||||||||||
| Preferred dividends | (41,612 | ) | (41,645 | ) | (46,041 | ) | (28,070 | ) | (21,938 | ) | |||||||||
| Loss on redemption of preferred shares | — | (2,710 | ) | (6,735 | ) | — | — | ||||||||||||
| Net income available to Arch common shareholders | $ | 1,594,707 | $ | 713,616 | $ | 566,502 | $ | 664,668 | $ | 515,800 | |||||||||
| Diluted net income per share | $ | 3.87 | $ | 1.73 | $ | 1.36 | $ | 1.78 | $ | 1.36 | |||||||||
| Cash dividends per share | — | — | — | — | — | ||||||||||||||
| After-tax operating income available to Arch common shareholders (1) | $ | 1,162,639 | $ | 909,190 | $ | 447,155 | $ | 577,444 | $ | 565,199 | |||||||||
| After-tax operating income available to Arch common shareholders per share — diluted (1) | $ | 2.82 | $ | 2.20 | $ | 1.07 | $ | 1.54 | $ | 1.49 | |||||||||
| After-tax return on average common equity (2) | 16.5 | % | 8.4 | % | 7.2 | % | 10.9 | % | 8.9 | % | |||||||||
| After-tax operating return on average common equity (2) | 12.0 | % | 10.7 | % | 5.7 | % | 9.4 | % | 9.7 | % | |||||||||
| Weighted average common shares and common share equivalents outstanding — diluted (2) | 411,609,478 | 412,906,478 | 417,785,025 | 374,152,479 | 378,116,229 |
| (1) | After-tax operating income available to Arch common shareholders is defined as net income available to Arch common shareholders, excluding net realized gains or losses, net impairment losses included in earnings, equity in net income or loss of investments accounted for using the equity method, net foreign exchange gains or losses, transaction costs and other and loss on redemption of preferred shares, net of income taxes. The presentation of after-tax operating income available to Arch common shareholders is a “non-GAAP financial measure” as defined in Regulation G. See “Management’s Discussion and Analysis of Financial Condition and Results of Operations—Comment on Non-GAAP Financial Measures” for further details. |
| (2) | Equals after-tax operating income available to Arch common shareholders divided by the average of beginning and ending common shareholders’ equity for each period presented. For the 2016 period, the return on average common shareholders’ equity reflects the weighted impact of the $1.10 billion of convertible non-voting common equivalent preferred shares, which were issued on December 31, 2016 as part of the UGC acquisition. |
| ARCH CAPITAL | 53 | 2019 FORM 10-K |
| (U.S. dollars in thousands except share data) | December 31, | ||||||||||||||||||
| 2019 | 2018 | 2017 | 2016 | 2015 | |||||||||||||||
| Balance Sheet Data: | |||||||||||||||||||
| Total investable assets (1) | $ | 24,990,265 | $ | 22,324,524 | $ | 22,156,488 | $ | 20,493,952 | $ | 16,340,938 | |||||||||
| Premiums receivable | 1,778,717 | 1,299,150 | 1,135,249 | 1,072,435 | 983,443 | ||||||||||||||
| Reinsurance recoverables on unpaid and paid losses and loss adjustment expenses | 4,346,816 | 2,919,372 | 2,540,143 | 2,114,138 | 1,867,373 | ||||||||||||||
| Total assets | 37,885,361 | 32,218,329 | 32,051,658 | 29,372,109 | 23,138,931 | ||||||||||||||
| Reserves for losses and loss adjustment expenses: | |||||||||||||||||||
| Before unpaid losses and loss adjustment expenses recoverable | 13,891,842 | 11,853,297 | 11,383,792 | 10,200,960 | 9,125,250 | ||||||||||||||
| Net of unpaid losses and loss adjustment expenses recoverable | 9,809,192 | 9,039,006 | 8,918,882 | 8,117,385 | 7,296,413 | ||||||||||||||
| Unearned premiums: | |||||||||||||||||||
| Before ceded unearned premiums | 4,339,549 | 3,753,636 | 3,622,314 | 3,406,870 | 2,333,932 | ||||||||||||||
| Net of ceded unearned premiums | 3,104,866 | 2,778,167 | 2,695,703 | 2,547,303 | 1,906,323 | ||||||||||||||
| Senior notes | 1,871,626 | 1,733,528 | 1,732,884 | 1,732,258 | 791,306 | ||||||||||||||
| Revolving credit agreement borrowings | 484,287 | 455,682 | 816,132 | 756,650 | 530,434 | ||||||||||||||
| Total liabilities | 25,569,809 | 21,780,650 | 21,805,723 | 20,060,984 | 16,028,376 | ||||||||||||||
| Total shareholders’ equity | 12,260,148 | 10,231,387 | 10,040,013 | 9,105,572 | 6,905,373 | ||||||||||||||
| Total shareholders' equity available to Arch | 11,497,371 | 9,439,827 | 9,196,602 | 8,253,718 | 6,166,542 | ||||||||||||||
| Preferred shareholders' equity | 780,000 | 780,000 | 872,555 | 772,555 | 325,000 | ||||||||||||||
| Common shareholders' equity available to Arch | $ | 10,717,371 | $ | 8,659,827 | $ | 8,324,047 | $ | 7,481,163 | $ | 5,841,542 | |||||||||
| Common shares and common share equivalents outstanding, net of treasury shares (2) | 405,619,201 | 402,454,834 | 409,956,417 | 406,651,011 | 367,883,349 | ||||||||||||||
| Book value per share (2) (3) | $ | 26.42 | $ | 21.52 | $ | 20.30 | $ | 18.40 | $ | 15.88 |
| (1) | This table excludes the collateral received and reinvested and includes the securities pledged under securities lending agreements, at fair value. |
| (2) | Reflects the impact of outstanding convertible non-voting common equivalent preferred shares which were issued on December 31, 2016 as part of the UGC acquisition. |
| (3) | Excludes the effects of stock options and restricted stock and performance units. |
| ARCH CAPITAL | 54 | 2019 FORM 10-K |
Item 7. MANAGEMENT’S DISCUSSION AND ANALYSIS OF FINANCIAL CONDITION AND RESULTS OF OPERATIONS
The following is a discussion and analysis of the financial condition and results of operations for the year ended December 31, 2019 and 2018, including comparisons between 2019 and 2018. Comparisons between 2018 and 2017 have been omitted from this Form 10-K, but may be found in "Management's Discussion and Analysis of Financial Condition and Results of Operations" in Part II, Item 7 of the Company's Annual Report on Form 10-K year ended December 31, 2018 filed with the SEC. This discussion and analysis contains forward-looking statements which involve inherent risks and uncertainties. All statements other than statements of historical fact are forward-looking statements. These statements are based on our current assessment of risks and uncertainties. Actual results may differ materially from those expressed or implied in these statements and, therefore, undue reliance should not be placed on them. Important factors that could cause actual events or results to differ materially from those indicated in such statements are discussed in this report, including the sections entitled “Cautionary Note Regarding Forward-Looking Statements,” and “Risk Factors.”
This discussion and analysis should be read in conjunction with our audited consolidated financial statements and notes thereto presented under Item 8. Tabular amounts are in U.S. Dollars in thousands, except share amounts, unless otherwise noted.
GENERAL
Overview
Arch Capital Group Ltd. (“Arch Capital” and, together with its subsidiaries, “we” or “us”) is a Bermuda public limited liability company with approximately $13.23 billion in capital at December 31, 2019 and, through operations in Bermuda, the United States, Europe, Canada, Australia and Hong Kong, writes specialty lines of property and casualty insurance and reinsurance, as well as mortgage insurance and reinsurance, on a worldwide basis. It is our belief that our underwriting platform, our experienced management team and our strong capital base have enabled us to establish a strong presence in the insurance and reinsurance markets.
The worldwide property casualty insurance and reinsurance industry is highly competitive and has traditionally been subject to an underwriting cycle in which a hard market (high premium rates, restrictive underwriting standards, as well as terms and conditions, and underwriting gains) is eventually followed by a soft market (low premium rates, relaxed underwriting standards, as well as broader terms and conditions, and underwriting losses). Property casualty market conditions may affect, among other things, the demand for our products, our
ability to increase premium rates, the terms and conditions of the insurance policies we write, changes in the products offered by us or changes in our business strategy.
The financial results of the property casualty insurance and reinsurance industry are influenced by factors such as the frequency and/or severity of claims and losses, including natural disasters or other catastrophic events, variations in interest rates and financial markets, changes in the legal, regulatory and judicial environments, inflationary pressures and general economic conditions. These factors influence, among other things, the demand for insurance or reinsurance, the supply of which is generally related to the total capital of competitors in the market.
Mortgage insurance and reinsurance is subject to similar cycles to property casualty except that they have historically been more dependent on macroeconomic conditions.
Current Outlook
Our objective is to achieve an average operating return on average equity of 15% or greater over the insurance cycle, which we believe to be an attractive return to our common shareholders given the risks we assume. We continue to look for opportunities to find acceptable books of business to underwrite without sacrificing underwriting discipline and continue to write a portion of our overall book in catastrophe-exposed business which has the potential to increase the volatility of our operating results.
In 2019, property and casualty rates increased in many lines of business and we believe that insurance markets remain in a transitioning phase. Given the uncertainty of current claim trends, the industry needs further rate increases to provide insurers an adequate buffer and a positive risk-reward proposition. In this kind of environment, risk selection and active capital allocation remain critical to generating superior returns. Strengthening market conditions are evident to us from both the rise in our submission activity and our ability to achieve significant rate increases across numerous lines of business.
Reinsurance pricing tends to follow that of the primary insurance industry although catastrophe and large attritional losses, such as the Japanese typhoons this year, can disproportionately affect results and create opportunities in the reinsurance market. We believe that property facultative and marine businesses are examples of improving markets.
Our underwriting teams continue to execute a disciplined strategy by emphasizing small and medium-sized accounts over large accounts, shrinking premiums in more commoditized
| ARCH CAPITAL | 55 | 2019 FORM 10-K |
lines such as general liability and by utilizing reinsurance purchases to reduce volatility on large account, high capacity business. The spread between rate changes and loss trend continues to be a key variable in assessing expected returns and can be difficult to quantify precisely, particularly in specialty lines.
Our mortgage segment continues to experience generally favorable market conditions. Although pricing remains competitive in the U.S., borrower credit quality and the general economy remain strong. Our results continue to reflect our success in making high quality credit underwriting risk decisions and building customer relationships.
Arch remains committed to providing solutions across many offerings as the marketplace evolves, including new mortgage credit risk transfer programs initiated by government sponsored enterprises, or “GSEs,” in 2018. Such programs have begun generating business with banks developing new systems to handle the programs and momentum beginning to build. In addition, we completed multiple Bellemeade risk transfers to the capital markets throughout 2019, increasing our protection for mortgage tail risk.
FINANCIAL MEASURES
Management uses the following three key financial indicators in evaluating our performance and measuring the overall growth in value generated for Arch Capital’s common shareholders:
Book Value per Share
Book value per share represents total common shareholders’ equity available to Arch divided by the number of common shares and common share equivalents outstanding. Management uses growth in book value per share as a key measure of the value generated for our common shareholders each period and believes that book value per share is the key driver of Arch Capital’s share price over time. Book value per share is impacted by, among other factors, our underwriting results, investment returns and share repurchase activity, which has an accretive or dilutive impact on book value per share depending on the purchase price. Book value per share was $26.42 at December 31, 2019, a 22.8% increase from $21.52 at December 31, 2018. The growth in 2019 reflected strong mortgage insurance underwriting performance and investment returns.
Operating Return on Average Common Equity
Operating return on average common equity (“Operating ROAE”) represents annualized after-tax operating income available to Arch common shareholders divided by average common shareholders’ equity available to Arch during the period. After-tax operating income available to Arch common
shareholders, a “non-GAAP measure” as defined in the SEC rules, represents net income available to Arch common shareholders, ex
Showing the first 8K of 652K characters. Open the full section
Item 9. CHANGES IN AND DISAGREEMENTS WITH ACCOUNTANTS ON ACCOUNTING AND FINANCIAL DISCLOSURE
None.
Item 9A. CONTROLS AND PROCEDURES
Evaluation of Disclosure Controls and Procedures
In connection with the filing of this Form 10-K, our management, including the Chief Executive Officer and Chief Financial Officer, conducted an evaluation, as of December 31, 2019, for the purposes set forth in the applicable rules under the Securities and Exchange Act of 1934, as amended (the “Exchange Act”). Based on that evaluation, the Chief Executive Officer and Chief Financial Officer concluded that the disclosure controls and procedures are effective.
We continue to enhance our operating procedures and internal controls (including information technology initiatives and controls over financial reporting) to effectively support our business and our regulatory and reporting requirements. Our management does not expect that our disclosure controls or our internal controls will prevent all errors and all fraud. A control system, no matter how well conceived and operated, can provide only reasonable, not absolute, assurance that the objectives of the control system are met. Further, the design of a control system must reflect the fact that there are resource constraints, and the benefits of controls must be considered relative to their costs. As a result of the inherent limitations in all control systems, no evaluation of controls can provide absolute assurance that all control issues and instances of fraud, if any, within the company have been detected. These inherent limitations include the realities that judgments in decision making can be faulty, and that breakdowns can occur because of simple error or mistake. Additionally, controls can be circumvented by the individual acts of some persons or by collusion of two or more people.
The design of any system of controls also is based in part upon certain assumptions about the likelihood of future events, and there can be no assurance that any design will succeed in achieving its stated goals under all potential future conditions; over time, controls may become inadequate because of changes in conditions, or the degree of compliance with the policies or procedures may deteriorate. As a result of the inherent limitations in a cost-effective control system, misstatement due to error or fraud may occur and not be detected. Accordingly, our disclosure controls and procedures are designed to provide reasonable, not absolute, assurance that the disclosure controls and procedures are met.
Management’s Annual Report on Internal Control Over Financial Reporting
Our management is responsible for establishing and maintaining adequate internal control over financial reporting, as defined in Rules 13a-15(f) and 15d-15(f) under the Exchange Act. Our management assessed the effectiveness of our internal control over financial reporting as of December 31, 2019. In making this assessment, management used the criteria set forth by the Committee of Sponsoring Organizations (COSO) of the Treadway Commission in Internal Control-Integrated Framework (2013).
Based on our assessment, management determined that, as of December 31, 2019, our internal control over financial reporting was effective. The effectiveness of our internal control over financial reporting as of December 31, 2019 has been audited by PricewaterhouseCoopers LLP, an independent registered public accounting firm, as stated in their report included in Item 8.
Changes in Internal Control Over Financial Reporting
There have been no changes in internal control over financial reporting that occurred in connection with our evaluation required pursuant to Rules 13a-15 and 15d-15 under the Exchange Act during the fiscal quarter ended December 31, 2019 that have materially affected, or are reasonably likely to materially affect, internal control over financial reporting.
| ARCH CAPITAL | 171 | 2019 FORM 10-K |
Item 9B. OTHER INFORMATION
Disclosure of Certain Activities Under Section 13(r) of the Securities Exchange Act of 1934
Section 13(r) of the Securities Exchange Act of 1934, as amended, requires an issuer to disclose in its annual or quarterly reports whether it or an affiliate knowingly engaged in certain activities described in that section, including certain activities related to Iran during the period covered by the report.
Certain of our non-U.S. subsidiaries underwrite insurance and facultative reinsurance on a global basis to non-U.S. insureds and insurers, including for liability, marine, aviation and energy risks. Coverage provided to non-Iranian business may indirectly cover an exposure in Iran. For example, certain of our operations underwrite global marine hull and cargo policies that provide coverage for vessels navigating into and out of ports worldwide, including Iran. For the year ended December 31, 2019, there has been no material amount of premium allocated or apportioned to activities relating to Iran, and we are unable to attribute gross revenues or net profits from any
such policies because they insure multiple voyages and fleets containing multiple ships. Such non-U.S. subsidiaries will continue to provide such coverage only to the extent permitted by applicable law.
Subsequent Event
On February 25, 2020, the Company announced that it has entered into a share purchase agreement with Natixis to purchase a 29.5% stake in Coface, a France-based leader in the global trade credit insurance market. The transaction will be completed at a price of €10.70 per share (dividend until closing attached), corresponding to a transaction value of approximately €480 million based on the current number of shares. As part of the transaction, Natixis’ seven representatives on Coface’s board of directors will resign and be replaced by four Arch nominees. Among other things, this transaction remains subject to antitrust and regulatory approvals, including in particular, approval by the French prudential regulator, the Autorité de Controle Prudentiel et de Résolution.
PART III
Item 10. DIRECTORS, EXECUTIVE OFFICERS AND CORPORATE GOVERNANCE
The information required by this item is incorporated by reference from the information to be included in our definitive proxy statement (“Proxy Statement”) for our annual meeting of shareholders to be held in 2020, which we intend to file with the SEC pursuant to Regulation 14A before May 1, 2020. Copies of our code of ethics applicable to our chief executive officer, chief financial officer and principal accounting officer or controller are available free of charge to investors upon written request addressed to the attention of Arch Capital’s corporate secretary, Waterloo House, 100 Pitts Bay Road, Pembroke HM 08, Bermuda. In addition, our code of ethics and certain other basic corporate documents, including the charters of our audit committee, compensation committee and nominating committee are posted on our website.
If any substantive amendments are made to the code of ethics or if there is a grant of a waiver, including any implicit waiver, we will disclose the nature of such amendment or waiver on our website or in a report on Form 8-K, to the extent required by applicable law or the rules and regulations of any exchange applicable to us. Our website address is intended to be an inactive, textual reference only and none of the material on our website is incorporated by reference into this report.
| ARCH CAPITAL | 172 | 2019 FORM 10-K |
Item 11. EXECUTIVE COMPENSATION
The information required by this item is incorporated by reference from the information to be included in the Proxy Statement which we intend to file pursuant to Regulation 14A
with the SEC before May 1, 2020, which Proxy Statement is incorporated by reference.
Item 12. SECURITY OWNERSHIP OF CERTAIN BENEFICIAL OWNERS AND MANAGEMENT AND RELATED STOCKHOLDER MATTERS
Other than the information set forth below, the information required by this item is incorporated by reference from the information to be included in the Proxy Statement which we intend to file pursuant to Regulation 14A with the SEC before May 1, 2020, which Proxy Statement is incorporated by reference.
The following information is as of December 31, 2019:
| Column A | Column B | Column C | ||||||||
| Plan Category | Number of Securities to be Issued Upon Exercise of Outstanding Stock Options(1), Warrants and Rights | Weighted-Average Exercise Price of Outstanding Stock Options(1), Warrants and Rights ($) | Number of Securities Remaining Available for Future Issuance Under Equity Compensation Plans (Excluding Securities Reflected in Column A) | |||||||
| Equity compensation plans approved by security holders | 20,439,797 | $ | 20.94 | 28,927,609 | ||||||
| Equity compensation plans not approved by security holders | — | — | — | |||||||
| Total | 20,439,797 | $ | 20.94 | 28,927,609 | (2) |
| (1) | Includes all vested and unvested stock options outstanding of 18,853,018 and restricted stock and performance units outstanding of 1,586,779. The weighted average exercise price does not take into account restricted stock units. In addition, the weighted average remaining contractual life of the Company's outstanding exercisable stock options and SARs at December 31, 2019 was 5.0 years. |
| (2) | Includes 2,729,721 common shares remaining available for future issuance under our Employee Share Purchase Plan and 26,197,888 common shares remaining available for future issuance under our equity compensation plans. Shares available for future issuance under our equity compensation plans may be issued in the form of stock options, SARs, restricted shares, restricted share units payable in common shares or cash, share awards in lieu of cash awards, dividend equivalents, performance shares and performance units and other share-based awards. In addition, 7,608,674 common shares, or 26.3% of the 28,927,609 common shares remaining available for future issuance may be issued in connection with full value awards (i.e., awards other than stock options or SARs). |
| ARCH CAPITAL | 173 | 2019 FORM 10-K |
Item 13. CERTAIN RELATIONSHIPS AND RELATED TRANSACTIONS, AND DIRECTOR INDEPENDENCE
The information required by this item is incorporated by reference from the information to be included in the Proxy Statement which we intend to file pursuant to Regulation 14A
with the SEC before May 1, 2020, which Proxy Statement is incorporated by reference.
Item 14. PRINCIPAL ACCOUNTANT FEES AND SERVICES
The information required by this item is incorporated by reference from the information to be included in our Proxy Statement which we intend to file pursuant to Regulation 14A
with the SEC before May 1, 2020, which Proxy Statement is incorporated by reference.
PART IV
Item 15. EXHIBITS AND FINANCIAL STATEMENT SCHEDULES
(a) Financial Statements, Financial Statement Schedules and Exhibits.
| 1. | Financial Statements |
Included in Part II – see Item 8 of this report.
**2.**Financial Statement Schedules
| Page No. | |
| III. Supplementary Insurance Information | |
| For the years ended December 31, 2019, 2018 and 2017 | 180 |
| IV. Reinsurance | |
| For the years ended December 31, 2019, 2018 and 2017 | 181 |
| VI. Supplementary Information for Property and Casualty Insurance Underwriters | |
| For the years ended December 31, 2019, 2018 and 2017 | 182 |
Schedules other than those listed above are omitted for the reason that they are not applicable or the information is provided in Item 8 of this report.
| ARCH CAPITAL | 174 | 2019 FORM 10-K |
3. Exhibits
| ARCH CAPITAL | 175 | 2019 FORM 10-K |
| ARCH CAPITAL | 176 | 2019 FORM 10-K |
† Management contract or compensatory plan or arrangement.
| ARCH CAPITAL | 177 | 2019 FORM 10-K |
SIGNATURES
Pursuant to the requirements of Section 13 or 15(d) of the Securities Exchange Act of 1934, the Registrant has duly caused this report to be signed on its behalf by the undersigned, thereunto duly authorized.
| ARCH CAPITAL GROUP LTD. (Registrant) | |||
| By: | /s/ Marc Grandisson | ||
| Name: | Marc Grandisson | ||
| Title: | President and Chief Executive Officer (Principal Executive Officer) |
February 28, 2020
Pursuant to the requirements of the Securities Exchange Act of 1934, this report has been signed below by the following persons on behalf of the Registrant and in the capacities and on the dates indicated.
| Name | Title | Date |
| /s/ Marc Grandisson | ||
| Marc Grandisson | President and Chief Executive Officer (Principal Executive Officer) | February 28, 2020 |
| /s/ François Morin | ||
| François Morin | Executive Vice President and Chief Financial Officer (Principal Financial Officer and Principal Accounting Officer) | February 28, 2020 |
| * | ||
| John M. Pasquesi | Chairman of the Board | February 28, 2020 |
| * | ||
| John L. Bunce. Jr. | Director | February 28, 2020 |
| * | ||
| Eric W. Doppstadt | Director | February 28, 2020 |
| * | ||
| Laurie S. Goodman | Director | February 28, 2020 |
| ARCH CAPITAL | 178 | 2019 FORM 10-K |
| Name | Title | Date |
| * | ||
| Moira Kilcoyne | Director | February 28, 2020 |
| * | ||
| Louis J. Paglia | Director | February 28, 2020 |
| * | ||
| Brian S. Posner | Director | February 28, 2020 |
| * | ||
| Eugene S. Sunshine | Director | February 28, 2020 |
| * | ||
| John D. Vollaro | Director | February 28, 2020 |
| * | ||
| Thomas R. Watjen | Director | February 28, 2020 |
| * | By François Morin, as attorney-in-fact and agent, pursuant to a power of attorney, a copy of which has been filed with the Securities and Exchange Commission as Exhibit 24 to this report. |
| /s/ François Morin | |
| Name: | François Morin Attorney-in-Fact |
| ARCH CAPITAL | 179 | 2019 FORM 10-K |
SCHEDULE III
ARCH CAPITAL GROUP LTD. AND SUBSIDIARIES
SUPPLEMENTARY INSURANCE INFORMATION
(U.S. dollars in thousands)
| Deferred Acquisition Costs | Reserves for Losses and Loss Adjustment Expenses | Unearned Premiums | Net Premiums Earned | Net Investment Income (1) | Net Losses and Loss Adjustment Expenses Incurred | Amortization of Deferred Acquisition Costs | Other Operating Expenses (2) | Net Premiums Written | |||||||||||||||||
| December 31, 2019 | |||||||||||||||||||||||||
| Insurance | $188,684 | $7,900,328 | $1,991,496 | $2,397,080 | NM | $1,615,475 | $361,614 | $454,770 | $2,641,726 | ||||||||||||||||
| Reinsurance | 197,856 | 4,270,013 | 971,776 | 1,466,389 | NM | 1,011,329 | 239,032 | 141,484 | 1,602,723 | ||||||||||||||||
| Mortgage | 182,816 | 457,872 | 937,370 | 1,366,340 | NM | 53,513 | 134,319 | 153,092 | 1,261,756 | ||||||||||||||||
| Other | 64,044 | 1,263,629 | 438,907 | 556,689 | NM | 453,135 | 105,980 | 51,651 | 532,862 | ||||||||||||||||
| Total | $633,400 | $13,891,842 | $4,339,549 | $5,786,498 | NM | $3,133,452 | $840,945 | $800,997 | $6,039,067 | ||||||||||||||||
| December 31, 2018 | |||||||||||||||||||||||||
| Insurance | $152,360 | $7,093,018 | $1,549,183 | $2,205,661 | NM | $1,520,680 | $349,702 | $364,138 | $2,212,125 | ||||||||||||||||
| Reinsurance | 166,276 | 3,215,909 | 710,774 | 1,261,216 | NM | 846,882 | 211,280 | 133,350 | 1,372,572 | ||||||||||||||||
| Mortgage | 170,080 | 511,610 | 1,103,565 | 1,186,236 | NM | 81,289 | 118,595 | 142,432 | 1,157,875 | ||||||||||||||||
| Other | 80,858 | 1,032,760 | 390,114 | 578,862 | NM | 441,255 | 125,558 | 37,889 | 604,175 | ||||||||||||||||
| Total | $569,574 | $11,853,297 | $3,753,636 | $5,231,975 | NM | $2,890,106 | $805,135 | $677,809 | $5,346,747 | ||||||||||||||||
| December 31, 2017 | |||||||||||||||||||||||||
| Insurance | $159,224 | $6,952,676 | $1,451,390 | $2,113,018 | NM | $1,622,444 | $323,639 | $359,524 | $2,122,440 | ||||||||||||||||
| Reinsurance | 150,582 | 3,053,694 | 633,810 | 1,142,621 | NM | 773,923 | 221,250 | 146,663 | 1,174,474 | ||||||||||||||||
| Mortgage | 140,057 | 579,160 | 1,206,470 | 1,057,166 | NM | 134,677 | 100,598 | 146,336 | 1,111,342 | ||||||||||||||||
| Other | 85,961 | 798,262 | 330,644 | 531,727 | NM | 436,402 | 129,971 | 31,928 | 553,117 | ||||||||||||||||
| Total | $535,824 | $11,383,792 | $3,622,314 | $4,844,532 | NM | $2,967,446 | $775,458 | $684,451 | $4,961,373 |
| (1) | The Company does not manage its assets by segment and, accordingly, net investment income is not allocated to each underwriting segment. See note 4, “Segment Information,” to our consolidated financial statements in Item 8 for information related to the ‘other’ segment. |
| (2) | Certain other operating expenses relate to the Company’s corporate segment (non-underwriting). Such amounts are not reflected in the table above. See note 4, “Segment Information,” to our consolidated financial statements in Item 8 for information related to the corporate segment. |
| ARCH CAPITAL | 180 | 2019 FORM 10-K |
SCHEDULE IV
ARCH CAPITAL GROUP LTD. AND SUBSIDIARIES
REINSURANCE
(U.S. dollars in thousands)
| Gross Amount | Ceded to Other Companies (1) | Assumed From Other Companies (1) | Net Amount | Percentage of Amount Assumed to Net | ||||||||||||||
| Year Ended December 31, 2019 | ||||||||||||||||||
| Premiums Written: | ||||||||||||||||||
| Insurance | $ | 3,879,752 | $ | (1,266,267 | ) | $ | 28,241 | $ | 2,641,726 | 1.1 | % | |||||||
| Reinsurance | 238,229 | (720,500 | ) | 2,084,994 | 1,602,723 | 130.1 | % | |||||||||||
| Mortgage | 1,224,373 | (204,509 | ) | 241,892 | 1,261,756 | 19.2 | % | |||||||||||
| Other | 339,169 | (222,019 | ) | 415,712 | 532,862 | 78.0 | % | |||||||||||
| Total | $ | 5,681,523 | $ | (2,099,893 | ) | $ | 2,457,437 | $ | 6,039,067 | 40.7 | % | |||||||
| Year Ended December 31, 2018 | ||||||||||||||||||
| Premiums Written: | ||||||||||||||||||
| Insurance | $ | 3,232,234 | $ | (1,050,207 | ) | $ | 30,098 | $ | 2,212,125 | 1.4 | % | |||||||
| Reinsurance | 213,809 | (539,950 | ) | 1,698,713 | 1,372,572 | 123.8 | % | |||||||||||
| Mortgage | 1,139,099 | (202,833 | ) | 221,609 | 1,157,875 | 19.1 | % | |||||||||||
| Other | 253,760 | (130,840 | ) | 481,255 | 604,175 | 79.7 | % | |||||||||||
| Total | $ | 4,838,902 | $ | (1,614,257 | ) | $ | 2,122,102 | $ | 5,346,747 | 39.7 | % | |||||||
| Year Ended December 31, 2017 | ||||||||||||||||||
| Premiums Written: | ||||||||||||||||||
| Insurance | $ | 3,050,876 | $ | (958,646 | ) | $ | 30,210 | $ | 2,122,440 | 1.4 | % | |||||||
| Reinsurance | 152,404 | (465,925 | ) | 1,487,995 | 1,174,474 | 126.7 | % | |||||||||||
| Mortgage | 1,110,319 | (256,796 | ) | 257,819 | 1,111,342 | 23.2 | % | |||||||||||
| Other | 133,858 | (47,187 | ) | 466,446 | 553,117 | 84.3 | % | |||||||||||
| Total | $ | 4,447,457 | $ | (1,407,052 | ) | $ | 1,920,968 | $ | 4,961,373 | 38.7 | % |
| (1) | Certain amounts included in the gross premiums written of each segment are related to intersegment transactions and are included in the gross premiums written of each segment. Accordingly, the sum of gross premiums written for each segment does not agree to the total gross premiums written as shown in the table above due to the elimination of intersegment transactions in the total. |
| ARCH CAPITAL | 181 | 2019 FORM 10-K |
SCHEDULE VI
ARCH CAPITAL GROUP LTD. AND SUBSIDIARIES
SUPPLEMENTARY INFORMATION FOR PROPERTY AND CASUALTY INSURANCE UNDERWRITERS
(U.S. dollars in thousands)
| Column A | Column B | Column C | Column D | Column E | Column F | Column G | Column H | Column I | Column J | Column K | |||||||||||||||||||||||
| Affiliation with Registrant | Deferred Acquisition Costs | Reserves for Losses and Loss Adjustment Expenses | Discount, if any, deducted in Column C | Unearned Premiums | Net Premiums Earned | Net Investment Income | Net Losses and Loss Adjustment Expenses Incurred Related to | Amortization of Deferred Acquisition Costs | Net Paid Losses and Loss Adjustment Expenses | Net Premiums Written | |||||||||||||||||||||||
| (a) Current Year | (b) Prior Years | ||||||||||||||||||||||||||||||||
| Consolidated Subsidiaries | |||||||||||||||||||||||||||||||||
| 2019 | $ | 633,400 | $ | 13,891,842 | $ | 22,012 | $ | 4,339,549 | $ | 5,786,498 | $ | 627,738 | $ | 3,297,037 | $ | (163,585 | ) | $ | 840,945 | $ | 2,383,255 | $ | 6,039,067 | ||||||||||
| 2018 | 569,574 | 11,853,297 | 21,145 | 3,753,636 | 5,231,975 | 563,633 | 3,162,818 | (272,712 | ) | 805,135 | 2,206,164 | 5,346,747 | |||||||||||||||||||||
| 2017 | 535,824 | 11,383,792 | 20,016 | 3,622,314 | 4,844,532 | 470,872 | 3,205,428 | (237,982 | ) | 775,458 | 2,352,912 | 4,961,373 |
| ITEM 16. | FORM 10-K SUMMARY |
Not applicable.
| ARCH CAPITAL | 182 | 2019 FORM 10-K |