 filings.tools
Item 5. MARKET FOR REGISTRANT’S COMMON EQUITY, RELATED STOCKHOLDER MATTERS, AND ISSUER PURCHASES OF EQUITY SECURITIES
3K characters. Original on sec.gov · Markdown
Item 5. MARKET FOR REGISTRANT’S COMMON EQUITY, RELATED STOCKHOLDER MATTERS, AND ISSUER PURCHASES OF EQUITY SECURITIES
Common Stock Market
The Company’s common stock is listed and traded on the New York Stock Exchange under the trading symbol “ADM”.
The number of registered stockholders of the Company’s common stock at December 31, 2021, was 8,501.
Issuer Purchases of Equity Securities
| Period | Total Number of Shares Purchased (1) | Average Price Paid per Share | Total Number of Shares Purchased as Part of Publicly Announced Program (2) | Number of Shares Remaining to be Purchased Under the Program (2) | ||||||||||||||||||||||
| October 1, 2021 to October 31, 2021 | — | $ | — | — | 104,505,703 | |||||||||||||||||||||
| November 1, 2021 to November 30, 2021 | — | — | — | 104,505,703 | ||||||||||||||||||||||
| December 1, 2021 to December 31, 2021 | — | — | — | 104,505,703 | ||||||||||||||||||||||
| Total | — | $ | — | — | 104,505,703 |
(1) Total shares purchased represent those shares purchased in the open market as part of the Company’s publicly announced stock repurchase program described below, shares received as payment for the exercise price of stock option exercises, and shares received as payment for the withholding taxes on vested restricted stock awards. During the three-month period ended December 31, 2021, there were no shares purchased in the open market or shares received as payments for the exercise price of stock option exercises and withholding taxes on vested restricted stock awards.
(2) On November 5, 2014, the Company’s Board of Directors approved a stock repurchase program authorizing the Company to repurchase up to 100,000,000 shares of the Company’s common stock during the period commencing January 1, 2015 and ending December 31, 2019. On August 7, 2019, the Company’s Board of Directors approved the extension of the stock repurchase program through December 31, 2024 and the repurchase of up to an additional 100,000,000 shares under the extended program.
| Item 5. MARKET FOR REGISTRANT’S COMMON EQUITY, RELATED STOCKHOLDER MATTERS, AND ISSUER PURCHASES OF EQUITY SECURITIES (Continued) |
Performance Graph
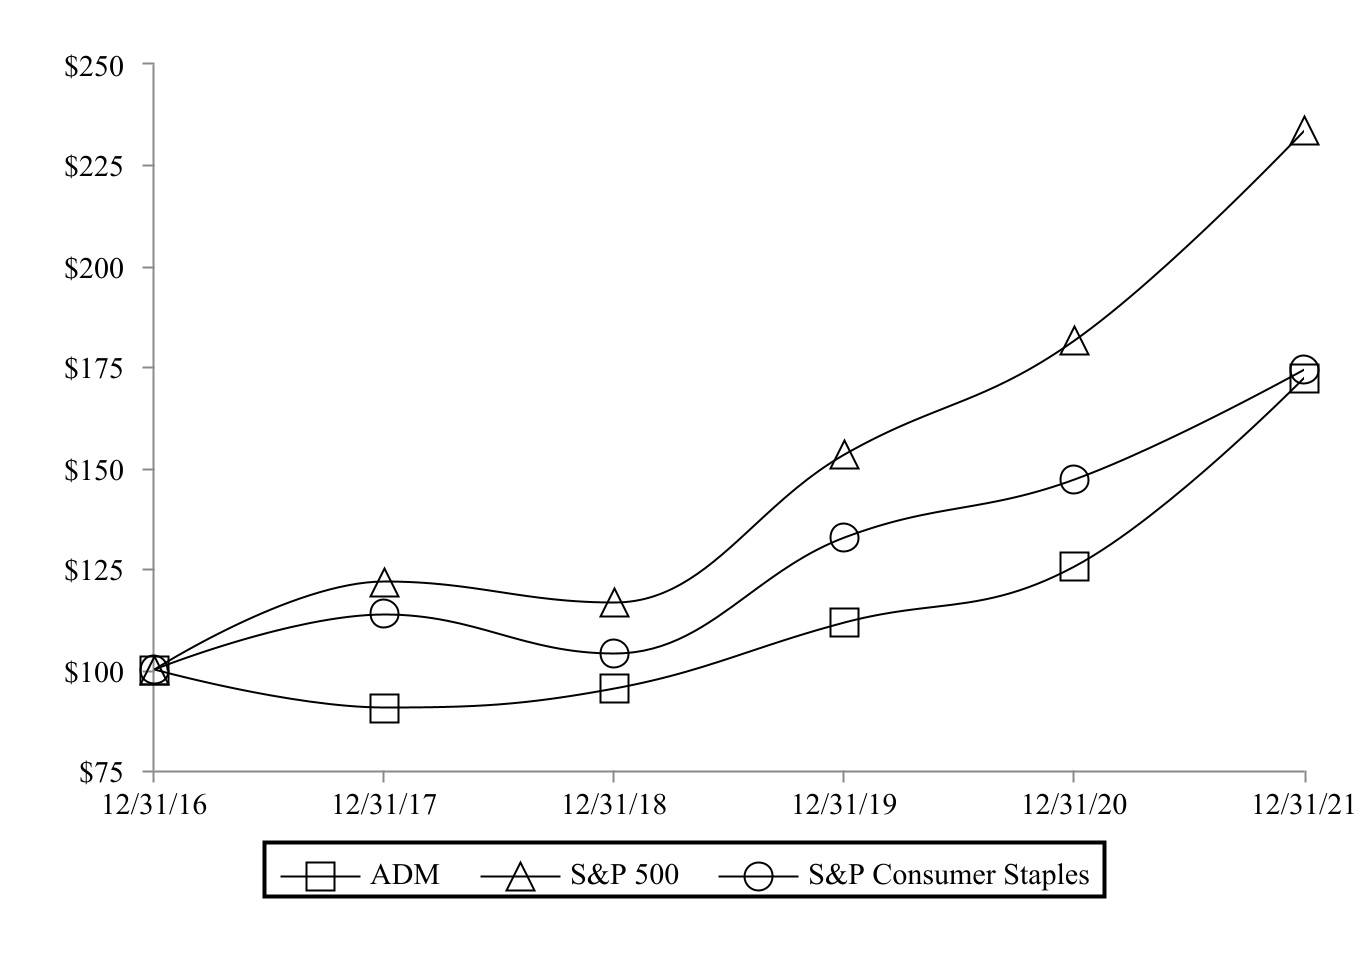
The graph below compares the Company’s common stock with those of the S&P 500 Index and the S&P Consumer Staples Index. The graph assumes an initial investment of $100 on December 31, 2016 and assumes all dividends have been reinvested through December 31, 2021.
COMPARISON OF 60 MONTH CUMULATIVE TOTAL RETURN
Among Archer Daniels Midland Company (ADM), the S&P 500 Index, and the S&P Consumer Staples Index
Index Data: Copyright Standard and Poor’s, Inc. Used with permission. All rights reserved.
Previous: Item 4. MINE SAFETY DISCLOSURES · Next: Item 6. [RESERVED]