 filings.tools
Item 7. MANAGEMENT’S DISCUSSION AND ANALYSIS OF FINANCIAL CONDITION AND RESULTS OF OPERATIONS
118K characters. Original on sec.gov · Markdown
Item 7. MANAGEMENT’S DISCUSSION AND ANALYSIS OF FINANCIAL CONDITION AND RESULTS OF OPERATIONS
The discussion in our MD&A and elsewhere in this Form 10-K contains trend analyses and other forward-looking statements within the meaning of Section 27A of the Securities Act of 1933 and Section 21E of the Securities Exchange Act of 1934. Forward-looking statements are any statements that look to future events and consist of, among other things, our business strategies, including those discussed in “Strategy” and “Overview of Fiscal 2018” below, future net revenue, operating expenses, recurring revenue, annualized recurring revenue, annualized revenue per subscription, other future financial results (by product type and geography) and subscriptions, the effectiveness of our restructuring efforts, the effectiveness of our efforts to successfully manage transitions to new business models and markets, our expectations regarding the continued transition of our business model, expectations for our maintenance plan and subscription plan subscriptions, our ability to increase our subscription base, expected market trends, including the growth of cloud and mobile computing, the effect of unemployment, the availability of credit, our expectations for our restructuring, the effects of global economic conditions, the effects of revenue recognition, the effects of recently issued accounting standards, expected trends in certain financial metrics, including expenses, the impact of acquisitions and investment activities, expectations regarding our cash needs, the effects of fluctuations in exchange rates and our hedging activities on our financial results, our ability to successfully expand adoption of our products, our ability to gain market acceptance of new businesses and sales initiatives, the impact of economic volatility and geopolitical activities in certain countries, particularly emerging economy countries, the timing and amount of purchases under our stock buy-back plan, and the effects of potential non-cash charges on our financial results and the resulting effect on our financial results. In addition, forward-looking statements also consist of statements involving expectations regarding product capability and acceptance, remediation to our controls environment, statements regarding our liquidity and short-term and long-term cash requirements, as well as statements involving trend analyses and statements including such words as “may,” “believe,” “could,” “anticipate,” “would,” “might,” “plan,” “expect,” and similar expressions or the negative of these terms or other comparable terminology. These forward-looking statements speak only as of the date of this Annual Report on Form 10-K and are subject to business and economic risks. As such, our actual results could differ materially from those set forth in the forward-looking statements as a result of a number of factors, including those set forth below in Part II, Item 1A, “Risk Factors,” and in our other reports filed with the U.S. Securities and Exchange Commission. We assume no obligation to update the forward-looking statements to reflect events that occur or circumstances that exist after the date on which they were made, except as required by law.
Strategy
Autodesk makes software for people who make things. If you have ever driven a high-performance car, admired a towering skyscraper, used a smartphone, or watched a great film, chances are you have experienced what millions of Autodesk customers are doing with our software. Autodesk gives you the power to make anything.
Autodesk was founded during the platform transition from mainframe computers and engineering workstations to personal computers. We developed and sustained a compelling value proposition based upon desktop software for the personal computer. Just as the transition from mainframes to personal computers transformed the industry over 30 years ago, we believe our industry is undergoing a similar transition from the personal computer to cloud, mobile, and social computing. To address this transition, we have accelerated our move to the cloud and mobile devices and are offering more flexible licensing. Our product subscriptions currently represent a hybrid of desktop software and cloud functionality, which provides a device-independent, collaborative design workflow for designers and their stakeholders. Our SaaS offerings, for example, BIM 360, Shotgun, Fusion, and AutoCAD 360 Pro, provide tools, including mobile and social capabilities, to streamline design, collaboration, building and manufacturing and data management processes. We believe that customer adoption of these new offerings will continue to grow as customers across a range of industries begin to take advantage of the scalable computing power and flexibility provided through these new services.
Our strategy is to lead the industries we serve to cloud-based technologies and business models. This entails both a technological shift and a business model shift. As part of the transition, we discontinued selling new perpetual licenses of most individual software products effective February 1, 2016, and discontinued selling new perpetual licenses of suites while introducing industry collections effective August 1, 2016. Industry collections provide our customers with increased access to a broader selection of Autodesk products and services that exceeds those previously available in suites - simplifying the customer ability to get access to a complete set of tools for their industry. We now offer subscriptions for individual products and industry collections, cloud service offerings, and flexible enterprise business agreements (collectively referred to as "subscription plan"). These subscription plan offerings are designed to give our customers more flexibility with how they use our products and service offerings and to attract a broader range of customers, such as project-based users and small businesses.

2018 Form 10-K 35
With the discontinuation of the sale of most perpetual licenses, we have transitioned away from selling a mix of perpetual licenses and term-based product subscriptions toward a single subscription model. On June 15, 2017, we commenced a program to incentivize maintenance plan customers to move to subscription plan offerings. Through this program we offer discounts to those maintenance customers that move to a subscription plan, while at the same time increasing maintenance plan pricing over time for customers that remain on maintenance.
To provide more meaningful information as to the performance of different categories of product and services, we have changed our presentation of revenue and cost of revenue on our Condensed Consolidated Statements of Operations effective the first quarter of fiscal 2018. See Note 1, "Business and Summary of Significant Accounting Policies," for additional information.
During the first three years of the transition, revenue, margins, EPS, deferred revenue and cash flow from operations have been impacted as more revenue is recognized ratably rather than upfront and as subscription plan offerings generally have a lower initial purchase price.
As we progress through the current stage of the business model transition, annualized recurring revenue ("ARR"), growth of billings, and total subscriptions better reflect business momentum. To further analyze progress, we disaggregate our growth between the original maintenance model ("maintenance plan") and the subscription plan model. Maintenance plan subscriptions peaked in the fourth quarter of our fiscal 2016 as we discontinued selling new maintenance plan subscriptions in fiscal 2017, and we expect them to decline slowly over time as maintenance plan customers continue to convert to our subscription plans.
In order to support our strategic priorities of completing the subscription transition, digitizing the Company, and re-imagining manufacturing, construction, and production, we commenced a world-wide restructuring plan in the fourth quarter of fiscal 2018. Through the restructuring, we seek to reduce our investments in areas not aligned with our strategic priorities, including in areas related to research and development and go-to-market activities. At the same time, we plan to further invest in strategic priority areas related to digital infrastructure, customer success, and construction. By re-balancing resources to better align with our strategic priorities, we are positioning ourselves to meet our long-term goals, while keeping non-GAAP spend flat in fiscal 2019. We anticipate incurring pre-tax restructuring charges of $135 million to $149 million, substantially all of which would result in cash expenditures, $124 million to $137 million of which would be for one-time employee termination benefits, and $11 million to $12 million of which would be for facilities-related and other costs. If we are unable to successfully complete our reorganizational efforts we may need to undertake additional restructuring efforts, and our business and operating results may be harmed.
2018 Form 10-K 36
We sell our products and services globally, through a combination of indirect and direct channels. Our indirect channels include value added resellers, direct market resellers, distributors, computer manufacturers, and other software developers. Our direct channels include internal sales resources dedicated to selling in our largest accounts, our highly specialized products, and business transacted through our online Autodesk branded store. The following chart shows our split between indirect and direct
channels for the fiscal years ended January 31, 2018, 2017 and 2016:
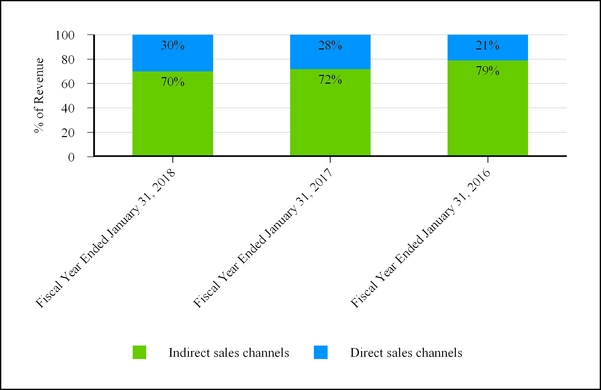
We anticipate that our channel mix will continue to change as we scale our online Autodesk branded store business and our largest accounts shift towards direct-only business models. However, we expect our indirect channel will continue to transact and support the majority of our customers and revenue as we move beyond the business model transition. We employ a variety of incentive programs and promotions to align our direct and indirect channels with our business strategies. In addition, we have a worldwide user group organization and we have created online user communities dedicated to the exchange of information related to the use of our products.
One of our key strategies is to maintain an open-architecture design of our software products to facilitate third-party development of complementary products and industry-specific software solutions. This approach enables customers and third parties to customize solutions for a wide variety of highly specific uses. We offer several programs that provide strategic investment funding, technological platforms, user communities, technical support, forums, and events to developers who develop add-on applications for our products. For example, we have established the Autodesk Forge program to support innovators that build solutions to facilitate the development of a single connected ecosystem for the future of how things are designed, made, and used as well as support ideas that push the boundaries of 3D printing.
In addition to the competitive advantages afforded by our technology, our large global network of distributors, resellers, third-party developers, customers, educational institutions, educators, and students is a key competitive advantage which has been cultivated over an extensive period of time. This network of partners and relationships provides us with a broad and deep reach into volume markets around the world. Our distributor and reseller network is extensive and provides our customers with the resources to purchase, deploy, learn, and support our products quickly and easily. We have a significant number of registered third-party developers who create products that work well with our products and extend them for a variety of specialized applications.
Autodesk is committed to helping fuel a lifelong passion for design in students of all ages. We offer free educational licenses of Autodesk software worldwide to students, educators, and accredited educational institutions. We inspire and support beginners with Tinkercad, a simple online 3D design and 3D printing tool. Through Autodesk Design Academy, we provide
2018 Form 10-K 37
secondary and postsecondary school markets hundreds of standards-aligned class projects to support design-based disciplines in Science, Technology, Engineering, Digital Arts, and Math (STEAM) while using Autodesk's professional-grade 3D design, engineering and entertainment software used in industry. We also have made Autodesk Design Academy curricula available on iTunes U and Udemy. Our intention is to make Autodesk software ubiquitous and the design and making software of choice for those poised to become the next generation of professional users.
Our strategy includes improving our product functionality and expanding our product offerings through internal development as well as through the acquisition of products, technology, and businesses. Acquisitions often increase the speed at which we can deliver product functionality to our customers; however, they entail cost and integration challenges and may, in certain instances, negatively impact our operating margins. We continually review these trade-offs in making decisions regarding acquisitions. We currently anticipate that we will continue to acquire products, technology, and businesses as compelling opportunities become available.
Our strategy depends upon a number of assumptions to successfully make the transition toward new cloud and mobile platforms, including: the related technology and business model shifts; making our technology available to mainstream markets; leveraging our large global network of distributors, resellers, third-party developers, customers, educational institutions, and students; improving the performance and functionality of our products; and adequately protecting our intellectual property. If the outcome of any of these assumptions differs from our expectations, we may not be able to implement our strategy, which could potentially adversely affect our business. For further discussion regarding these and related risks, see Part I, Item 1A, “Risk Factors.”
Critical Accounting Policies and Estimates
Our Consolidated Financial Statements are prepared in conformity with U.S. generally accepted accounting principles. In preparing our Consolidated Financial Statements, we make assumptions, judgments, and estimates that can have a significant impact on amounts reported in our Consolidated Financial Statements. We base our assumptions, judgments, and estimates on historical experience and various other factors that we believe to be reasonable under the circumstances. Actual results could differ materially from these estimates under different assumptions or conditions. We regularly reevaluate our assumptions, judgments, and estimates. Our significant accounting policies are described in Note 1, “Business and Summary of Significant Accounting Policies,” in the Notes to Consolidated Financial Statements. We believe that of all our significant accounting policies, the following policies involve a higher degree of judgment and complexity. Accordingly, these are the policies we believe are the most critical to aid in fully understanding and evaluating our financial condition and results of operations.
Revenue Recognition. We recognize revenue when persuasive evidence of an arrangement exists, delivery has occurred or services have been rendered, the price is fixed or determinable, and collection is probable. However, determining whether and when some of these criteria have been satisfied often involves assumptions and judgments that can have a significant impact on the timing and amount of revenue we report.
For multiple element arrangements containing only software and software-related elements, we allocate the sales price among each of the deliverables using the residual method, under which revenue is allocated to undelivered elements based on our vendor-specific objective evidence (“VSOE”) of fair value. VSOE is the price charged when an element is sold separately or a price set by management with the relevant authority. If we do not have VSOE of an undelivered software license, we defer revenue recognition on the entire sales arrangement until all elements for which we do not have VSOE are delivered. If we do not have VSOE for undelivered product subscriptions, maintenance or services, the revenue for the arrangement is recognized over the longest contractual service period in the arrangement. We are required to exercise judgment in determining whether VSOE exists for each undelivered element based on whether our pricing for these elements is sufficiently consistent.
For multiple elements arrangements involving non-software elements, including cloud subscription services, our revenue recognition policy is based upon the accounting guidance contained in Accounting Standards Codification ("ASC") 605, Revenue Recognition. For these arrangements, we first allocate the total arrangement consideration based on the relative selling prices of the software group of elements as a whole and to the non-software elements. We then further allocate consideration within the software group to the respective elements within that group using the residual method as described above. We exercise judgment and use estimates in connection with the determination of the amount of revenue to be recognized in each accounting period.
We allocate the total arrangement consideration among the various elements based on a selling price hierarchy. The selling price for a deliverable is based on its VSOE if available, third-party evidence ("TPE") if VSOE is not available, or the best estimated selling price ("BESP") if neither VSOE nor TPE is available. BESP represents the price at which Autodesk would transact for the deliverable if it were sold regularly on a standalone basis. To establish BESP for those elements for which
2018 Form 10-K 38
neither VSOE nor TPE are available, we perform a quantitative analysis of pricing data points for historical standalone transactions involving such elements for a twelve-month period. As part of this analysis, we monitor and evaluate the BESP against actual pricing to ensure that it continues to represent a reasonable estimate of the standalone selling price, considering several other external and internal factors including, but not limited to, pricing and discounting practices, contractually stated prices, the geographies in which we offer our products and services, and the type of customer (i.e. distributor, value-added reseller, and direct end user, among others). We analyze BESP at least annually or on a more frequent basis if a significant change in our business necessitates a more timely analysis or if we experience significant variances in our selling prices.
In situations when we have multiple contracts with a single counterparty, we use the guidance in ASC 985-605 to evaluate both the form and the substance of the arrangements to determine if they should be combined and accounted for as one arrangement or as separate arrangements.
Our assessment of the likelihood of collection is also a critical factor in determining the timing of revenue recognition. If we do not believe that collection is probable, the revenue will be deferred until payment is received.
Our indirect channel model includes both a two-tiered distribution structure, where distributors sell to resellers, and a one-tiered structure where Autodesk sells directly to resellers. Our subscription revenue from distributors and resellers generally commences recognition at the time access is provided to their customers, provided all other criteria for revenue recognition are met. This policy is predicated on our ability to estimate sales returns, among other criteria. We are also required to evaluate whether our distributors and resellers have the ability to honor their commitment to make fixed or determinable payments, regardless of whether they collect payment from their customers. If we were to change any of these assumptions or judgments, it could cause a material increase or decrease in the amount of revenue that we report in a particular period.
As part of the indirect channel model, we have a partner incentive program that uses quarterly attainment of monetary rewards to motivate distributors and resellers to achieve mutually agreed upon business goals in a specified time period. A portion of these incentives reduce license and other revenue in the current period. The remainder, which relates to incentives on our Subscription Program, is recorded as a reduction to deferred revenue in the period the subscription transaction is billed and subsequently recognized as a reduction to subscription revenue over the contract period. These incentive balances do not require significant assumptions or judgments. Depending on how the payments are made, the reserves associated with the partner incentive program are treated on the balance sheet as either contra account receivable or accounts payable.
Marketable Securities and Privately Held Company Investments. As described in Note 2, “Financial Instruments,” in the Notes to the Consolidated Financial Statements, our investments in marketable securities are measured at the end of each reporting period and reported at fair value. Fair value is defined as the price that would be received from the sale of an asset or paid to transfer a liability in the principal or most advantageous market for the asset or liability in an orderly transaction between market participants on the measurement date. In determining the fair value of our investments, we are sometimes required to use various alternative valuation techniques. Inputs to valuation techniques are either observable or unobservable. Observable inputs reflect market data obtained from independent sources, while unobservable inputs reflect our market assumptions. These two types of inputs have created the following fair value hierarchy:
| • | Level 1 - Quoted prices for identical instruments in active markets; |
| • | Level 2 - Quoted prices for similar instruments in active markets, quoted prices for identical or similar instruments in markets that are not active, and model-derived valuations in which all significant inputs and significant value drivers are observable in active markets; and |
| • | Level 3 - Valuations derived from valuation techniques in which one or more significant inputs or significant value drivers are unobservable. |
This hierarchy requires us to minimize the use of unobservable inputs and to use observable market data, if available, when determining fair value. This is generally true for our cash and cash equivalents and the majority of our marketable securities, which we consider to be Level 1 assets and Level 2 assets. However, determining the fair value of marketable securities or convertible note investments in privately held companies when observable inputs are not available (Level 3) requires significant judgment. For example, we use probability weighted discounted cash flow models, in which some of the inputs are unobservable in the market, to estimate the fair value of our convertible debt securities. These assumptions are inherently subjective and involve significant management judgment. Whenever possible, we use observable market data and rely on unobservable inputs only when observable market data is not available, when determining fair value.
2018 Form 10-K 39
All of Autodesk’s marketable securities and privately held company investments are subject to a periodic impairment review. We recognize an impairment charge when a decline in the fair value of its investments below the cost basis is judged to be other-than-temporary. Autodesk considers various factors in determining whether to recognize an impairment charge, including the length of time and extent to which the fair value has been less than Autodesk’s cost basis, the financial condition and near-term prospects of the investee, and Autodesk’s intent and ability to hold the investment for a period of time sufficient to allow for any anticipated recovery in the market value.
Business Combinations. We allocate the fair value of the consideration transferred to the assets and liabilities acquired, as well as to in-process research and development based on their estimated fair values at the acquisition date. Any residual purchase price is recorded as goodwill. The purchase price allocation requires us to make significant estimates and assumptions, especially at the acquisition date with respect to intangible assets and deferred revenue obligations.
Although we believe the assumptions and estimates we have made are reasonable, they are based in part on historical experience and information obtained from the management of the acquired companies and are inherently uncertain. Examples of critical estimates used in valuing certain of the intangible assets we have acquired or may acquire in the future include but are not limited to:
| • | future expected cash flows from sales, maintenance agreements, and acquired developed technologies; |
| • | the acquired company's trade name, trademark and existing customer relationship, as well as assumptions about the period of time the acquired trade name and trademark will continue to be used in the our product portfolio; |
| • | expected costs to develop the in-process research and development into commercially viable products and estimated cash flows from the projects when completed; and |
| • | discount rates used to determine the present value of estimated future cash flows. |
These estimates are inherently uncertain and unpredictable, and if different estimates were used the purchase price for the acquisition could be allocated to the acquired assets and liabilities differently from the allocation that we have made. In addition, unanticipated events and circumstances may occur which may affect the accuracy or validity of such estimates, and if such events occur we may be required to record a charge against the value ascribed to an acquired asset or an increase in the amounts recorded for assumed liabilities.
Realizability of Long-Lived Assets. We assess the realizability of our long-lived assets and related intangible assets, other than goodwill, quarterly, or sooner should events or changes in circumstances indicate the carrying values of such assets may not be recoverable. We consider the following factors important in determining when to perform an impairment review: significant under-performance of a business or product line relative to budget; shifts in business strategies which affect the continued uses of the assets; significant negative industry or economic trends; and the results of past impairment reviews. When such events or changes in circumstances occur, we assess recoverability of these assets.
We assess recoverability of these assets by comparing the carrying amounts to the future undiscounted cash flows the assets are expected to generate. If impairment indicators were present based on our undiscounted cash flow models, which include assumptions regarding projected cash flows, we would perform a discounted cash flow analysis to assess impairments on long-lived assets. Variances in these assumptions could have a significant impact on our conclusion as to whether an asset is impaired or the amount of any impairment charge. Impairment charges, if any, result in situations where any fair values of these assets are less than their carrying values.
In addition to our recoverability assessments, we routinely review the remaining estimated useful lives of our long-lived assets. Any reduction in the useful life assumption will result in increased depreciation and amortization expense in the quarter when such determinations are made, as well as in subsequent quarters.
We will continue to evaluate the values of our long-lived assets in accordance with applicable accounting rules. As changes in business conditions and our assumptions occur, we may be required to record impairment charges.
Income Taxes. We account for income taxes under the asset and liability approach. Under this method, deferred tax assets, including those related to tax loss carryforwards and credits, and deferred tax liabilities are determined based on the differences between the financial statement and tax bases of assets and liabilities using enacted tax rates in effect for the year in which the differences are expected to reverse. We recognize the tax benefit for an uncertain tax position when it meets a more
2018 Form 10-K 40
likely than not threshold. We recognize potential accrued interest and penalties related to unrecognized tax benefits as income tax expense.
A valuation allowance is recorded to reduce deferred tax assets when management cannot conclude that it is more likely than not that the net deferred tax asset will be recovered. The valuation allowance is determined by assessing both positive and negative evidence to determine whether it is more likely than not that deferred tax assets are recoverable; such assessment is required on a jurisdiction-by-jurisdiction basis. Significant judgment is required in determining whether the valuation allowance should be recorded against deferred tax assets. In assessing the need for valuation allowance, we consider all available evidence including past operating results and estimates of future taxable income. Beginning in the second quarter of fiscal 2016, we considered cumulative losses in the U.S. arising from the Company’s business model transition as a significant source of negative evidence. Considering this negative evidence and the absence of sufficient positive objective evidence that we would generate sufficient taxable income in the U.S. to realize the deferred tax assets, we determined that it was more likely than not that the Company would not realize U.S. federal and state deferred tax assets and recorded a valuation allowance on our federal and state deferred tax assets. We continue to have a full valuation allowance against our U.S. deferred tax assets in fiscal 2018.
As we continually strive to optimize our overall business model, tax planning strategies may become feasible and prudent whereby management may determine that it is more likely than not that the federal and state deferred tax assets will be realized; therefore, we will continue to evaluate the evidence around our ability to utilize our net deferred tax assets each quarter, both in the US and in foreign jurisdictions, based on all available evidence, both positive and negative.
Stock-Based Compensation. We measure stock-based compensation cost at the grant date fair value of the award, and recognize expense ratably over the requisite service period, which is generally the vesting period. We estimate the fair value of certain stock-based payment awards (including grants of employee stock purchases related to the employee stock purchase plan) using either the Black-Scholes-Merton option-pricing model or a binomial-lattice model (e.g., Monte Carlo simulation model). To determine the grant-date fair value of our stock-based payment awards, we use a Black-Scholes model or the quoted stock price on the date of grant, unless the awards are subject to market conditions, in which case we use the Monte Carlo simulation model. The Monte Carlo simulation model utilizes multiple input variables to estimate the probability that market conditions will be achieved. These variables include our expected stock price volatility over the expected term of the award, actual and projected employee stock option exercise behaviors, the risk-free interest rate for the expected term of the award, and expected dividends. The variables used in these models are reviewed on a quarterly basis and adjusted, as needed. Share-based compensation cost for restricted stock is measured on the closing fair market value of our common stock on the date of grant. The value of the portion of the award that is ultimately expected to vest is recognized as expense in our Consolidated Statements of Operations.
Legal Contingencies. As described in Part I, Item 3, “Legal Proceedings” and Part II, Item 8, Note 8, “Commitments and Contingencies,” in the Notes to Consolidated Financial Statements, we are periodically involved in various legal claims and proceedings. We routinely review the status of each significant matter and assess our potential financial exposure. If the potential loss from any matter is considered probable and the amount can be reasonably estimated, we record a liability for the estimated loss. Because of inherent uncertainties related to these legal matters, we base our loss accruals on the best information available at the time. As additional information becomes available, we reassess our potential liability and may revise our estimates. Such revisions could have a material impact on future quarterly or annual results of operations.
Restructuring Charges and other facility exit costs, net and Accruals. The Company’s restructuring plans include one–time termination benefits as well as certain contractual termination benefits. We record costs associated with exit activities related to restructuring plans in accordance with the ASC Topic 420, Exit or Disposal Obligations. Liabilities for costs associated with an exit or disposal activity are recognized in the period in which the liability is incurred. The timing of associated cash payments is dependent upon the type of exit cost and may extend over a 12-month period or longer. We record restructuring charge liabilities in “Other accrued liabilities,” or "Other liabilities" in the consolidated balance sheet.
Restructuring charges include employee termination costs, facility closure, accelerated depreciation of certain assets and relocation costs, and contract termination costs. One–time termination benefits are recognized as a liability at estimated fair value when the approved plan of termination has been communicated to employees, unless employees must provide future service that is longer than the statutory requirement, in which case the benefits are recognized ratably over the future service period. For the facility-related restructuring charges, we recognize upon exiting all or a portion of a leased facility and meeting cease-use and other requirements. The amount of restructuring charges is based on the fair value of the lease obligation for the abandoned space, which includes a sublease assumption that could be reasonably obtained. We also recognize accelerated depreciation related to assets at the time we commit to a plan to abandon.
2018 Form 10-K 41
Restructuring charges require significant estimates and assumptions, including sub-lease income and expenses for severance and other employee separation costs. Our estimates involve a number of risks and uncertainties, some of which are beyond our control, including future real estate market conditions and our ability to successfully enter into subleases or termination agreements with terms as favorable as those assumed when arriving at our estimates. We monitor these estimates and assumptions on at least a quarterly basis for changes in circumstances and any corresponding adjustments to the accrual are recorded in our statement of operations in the period when such changes are known.
Recently Issued Accounting Standards
See Part II, Item 8, Note 1, “Business and Summary of Significant Accounting Policies,” in the Notes to Consolidated Financial Statements for a full description of recent accounting pronouncements, including the expected dates of adoption and estimated effects on results of operations and financial condition.
Overview of Fiscal 2018
| • | Total net revenue increased 1 percent during fiscal 2018 as compared to the prior fiscal year. |
| • | Total ARR increased 25 percent as of January 31, 2018, as compared to the end of fiscal 2017. |
| • | Total subscriptions increased 20 percent to $3.72 million. |
| • | The base of both subscription plan ARR and subscriptions surpassed the base of maintenance plan ARR and subscriptions. |
| • | Total spend (cost of revenue + operating expenses) increased 1 percent. |
| • | Total deferred revenue (short term + long term deferred revenue) increased 9 percent. |
We are undergoing a business model transition in which we have discontinued selling new perpetual licenses for most of our products in favor of subscriptions. During the first three years of the transition, revenue, margins, EPS, deferred revenue and cash flow from operations were impacted as more revenue is recognized ratably rather than upfront and as product subscription plan offerings generally have a lower initial purchase price.
Revenue Analysis
During fiscal 2018, net revenue increased 1%, as compared to the prior fiscal year, primarily due to a 102% increase in subscription revenue. The increase in subscription revenue was partially offset by a 64% decrease in license and other revenue.
Further discussion of the drivers of these results are described below under the heading “Results from Operations.”
We rely significantly upon major distributors and resellers in both the U.S. and international regions, including Tech Data Corporation and its global affiliates (collectively, “Tech Data”). Total sales to Tech Data accounted for 31%, 30%, and 25% of our consolidated net revenue during fiscal 2018, 2017, and 2016, respectively. Our customers through Tech Data are the resellers and end users who purchase our software licenses and services. Should any of the agreements with Tech Data be terminated for any reason, we believe the resellers and end users who currently purchase our products through Tech Data would be able to continue to do so under substantially the same terms from one of our many other distributors without substantial disruption to our revenue. Consequently, we believe our business is not substantially dependent on Tech Data.
Business Model Transition Metrics
In order to help better understand our financial performance during and after the business model transition, we use several metrics including recurring revenue, total subscriptions, ARR, and annualized revenue per subscription ("ARPS"). ARR, ARPS, and recurring revenue are performance metrics and should be viewed independently of revenue and deferred revenue as ARR, ARPS, and recurring revenue are not intended to be combined with those items. Our determination and presentation may differ from that of other companies. Please refer to the Glossary of Terms for the definitions of these metrics.
2018 Form 10-K 42
The following table outlines our recurring revenue metric for the fiscal years ended 2018, 2017, and 2016:
| Fiscal Year Ended January 31, 2018 | Change compared to prior fiscal year end | Fiscal Year Ended January 31, 2017(1) | Change compared to prior fiscal year end | Fiscal Year Ended January 31, 2016(1) | |||||||||||||||||||
| $ | % | $ | % | ||||||||||||||||||||
| Recurring Revenue (in millions) (2) | $ | 1,882.3 | $ | 342.0 | 22 | % | $ | 1,540.3 | $ | 160.2 | 12 | % | $ | 1,380.1 | |||||||||
| As a percentage of net revenue | 92 | % | 76 | % | 55 | % |
| (1) | Prior periods have been adjusted to conform with current period's presentation. |
| (2) | The acquisition of a business may cause variability in the comparison of recurring revenue in this table above and recurring revenue derived from the revenue reported in the Consolidated Statement of Operations. |
The following table outlines our ARR, subscriptions, and ARPS metrics as of fiscal years ended January 31, 2018 and 2017:
| Change compared to prior fiscal year | ||||||||||||||
| January 31, 2018 | $ | % | January 31, 2017 (1) | |||||||||||
| ARR (in millions) | ||||||||||||||
| Subscription plan ARR | $ | 1,175.0 | $ | 603.6 | 106 | % | $ | 571.4 | ||||||
| Maintenance plan ARR | $ | 879.1 | $ | (188.9 | ) | (18 | )% | $ | 1,068.0 | |||||
| Total ARR (2) | $ | 2,054.1 | $ | 414.7 | 25 | % | $ | 1,639.4 | ||||||
| Number of Subscriptions (in thousands) | ||||||||||||||
| Subscription plan | 2,266.8 | 1,179.7 | 109 | % | 1,087.1 | |||||||||
| Maintenance plan | 1,448.9 | (569.1 | ) | (28 | )% | 2,018.0 | ||||||||
| Total subscriptions | 3,715.7 | 610.6 | 20 | % | 3,105.1 | |||||||||
| ARPS (ARR divided by number of Subscriptions) | ||||||||||||||
| Subscription plan ARPS | $ | 518 | $ | (8 | ) | (2 | )% | $ | 526 | |||||
| Maintenance plan ARPS | $ | 607 | $ | 78 | 15 | % | $ | 529 | ||||||
| Total ARPS (3) | $ | 553 | $ | 25 | 5 | % | $ | 528 |
| (1) | Prior periods have been adjusted to conform with the current period's presentation. |
| (2) | The acquisition of a business may cause variability in the comparison of ARR reported in this table above and ARR derived from the revenue reported in the Consolidated Statement of Operations. |
| (3) | There are small variances between ARR and total subscriptions due in part to the inherent limitation with collecting all subscriptions information. For example, Buzzsaw and Constructware are included with ARR but not in total subscriptions due to these inherent limitations. We do not view these variances as meaningful to amounts or quarterly comparisons presented here for ARPS. |
Total ARR increased 25% as of January 31, 2018 as compared to the end of fiscal 2017, due to a 106% increase in subscription plan ARR, which for the first time represents the majority of our total ARR. The increase in subscription plan ARR was driven by growth in all subscription plan types, led by product subscription. The increase was partially offset by an 18% decrease in maintenance plan ARR.
Subscription plan subscriptions increased 109% or approximately 1.2 million as compared to the end of fiscal 2017, driven by growth in all subscription plan types, led by new product subscriptions. Subscription plan subscriptions benefited from approximately 342,000 maintenance subscribers that were converted to product subscription under the maintenance-to-subscription program during the fiscal year ended January 31, 2018.
Maintenance plan subscriptions decreased 28% or approximately 569,000 as compared to the end of fiscal 2017, primarily as a result of the discontinuation of new maintenance agreement sales as well as the maintenance-to-subscription program in which approximately 342,000 maintenance plan subscriptions were converted to product subscription during the fiscal year
2018 Form 10-K 43
ended January 31, 2018. The net decrease was expected and we expect to see ongoing declines in maintenance plan subscriptions going forward as part of the business model transition. The rate of decline will vary based on the number of subscriptions subject to renewal, the renewal rate, and our ability to incentivize customers to switch over to enterprise business agreements ("EBAs") or product subscriptions.
ARPS was $553, a 5% increase compared to the prior fiscal year primarily driven by a 15% increase in maintenance plan ARPS as a result of the maintenance-to-subscription program and a 14% increase in product subscription ARPS, which is a component of our subscription plan. Partially offsetting the increase in maintenance plan and product subscription ARPS was a decrease in both cloud and EBA subscription ARPS.
Our ARPS is currently, and will continue to be, affected by various factors including subscription term-length, migration from maintenance plan subscriptions, geography and product mix, promotions, sales linearity within a quarter, pricing changes, and foreign currency. We expect to see ARPS fluctuate up or down on a quarterly basis. As we progress through our business model transition, we expect all of the impacts of these factors to start to stabilize.
Foreign Currency Analysis
We generate a significant amount of our revenue in the U.S., Germany, Japan, the United Kingdom and Canada.
The following table shows the impact of foreign exchanges rate changes on our net revenue and total spend:
| Fiscal Year Ended January 31, 2018 | |||||||
| Percent change compared to prior fiscal year (as reported) | Constant Currency percent change compared to prior fiscal year (2) | Positive/Negative/Neutral impact from foreign exchange rate changes | |||||
| Revenue | 1 | % | 2 | % | Negative | ||
| Spend (1) | 1 | % | 1 | % | Neutral |
| (1) | Our total spend is defined as cost of revenue plus operating expenses. |
| (2) | Please refer to Glossary of Terms for the definitions of our constant currency growth rates. |
Changes in the value of the U.S. dollar may have a significant effect on net revenue, total spend, and income (loss) from operations in future periods. We use foreign currency contracts to reduce the exchange rate effect on a portion of the net revenue of certain anticipated transactions but do not attempt to completely mitigate the impact of fluctuations of such foreign currency against the U.S. dollar.
Deferred Revenue and Unbilled Deferred Revenue
Our deferred revenue balance at January 31, 2018, was $1.96 billion and primarily relates to subscription and maintenance agreements invoiced for which the revenue has not yet been recognized but will be recognized as revenue ratably over the life of the contracts. The term of our subscription contracts is typically between one and three years.
We define unbilled deferred revenue as contractually stated or committed orders under multi-year billing plans for subscription, services, license and maintenance for which the associated deferred revenue has not been recognized and the customer has not been invoiced. Unbilled deferred revenue is not included on our Consolidated Balance Sheet until invoiced to the customer.
| (in millions) | Fiscal Year Ended January 31, 2018 | ||
| Deferred revenue | $ | 1,955.1 | |
| Unbilled deferred revenue (1) | 326.4 | ||
| Total | $ | 2,281.5 |
| (1) | This is our first year presenting this metric and we are not able to provide historical information at this time. Comparative information will not be available until our first quarter of fiscal 2019. |
2018 Form 10-K 44
We expect that the amount of unbilled deferred revenue and deferred revenue will change from quarter to quarter for several reasons, including the specific timing, duration and size of large customer subscription and support agreements, varying billing cycles of such agreements, the specific timing of customer renewals, foreign currency fluctuations and the timing of when unbilled deferred revenue is recognized as revenue.
Balance Sheet and Cash Flow Items
At January 31, 2018, we had $1.51 billion in cash and marketable securities. This amount includes the aggregate net proceeds of $492.0 million, after deducting the underwriting discounts and related offering expenses, from our June 2017 registered underwritten public offering of $500.0 million aggregate principal amount of 3.5% notes due June 15, 2027. On July 27, 2017, we redeemed in full, $400.0 million in aggregate principal amount of outstanding 1.95% senior notes due December 15, 2017. To redeem the notes, we used a portion of the proceeds of the June 2017 notes to pay a redemption price of approximately $400.9 million, plus accrued and unpaid interest from June 15, 2017, to, but excluding, the redemption date. Total cash repayment was $401.8 million. Our cash flow from operations decreased 99% to $0.9 million for the fiscal year ended January 31, 2018 from $169.7 million for the fiscal year ended January 31, 2017. We repurchased 6.9 million shares of our common stock for $690.1 million during fiscal 2018. Comparatively, we repurchased 9.7 million shares of our common stock for $631.6 million during fiscal 2017. Further discussion regarding the balance sheet and cash flow activities are discussed below under the heading “Liquidity and Capital Resources.”
Results of Operations
Net Revenue
Income Statement Presentation
Maintenance revenue consists of renewal fees for existing maintenance plan agreements that were initially purchased with a perpetual software license. Under our maintenance plan, customers are eligible to receive unspecified upgrades, when and if available, and technical support. We recognize maintenance revenue over the term of the agreements, generally between one and three years.
Subscription revenue consists of our term-based product subscriptions, cloud service offerings, and flexible enterprise business arrangements. Note that with the change in our presentation of revenue in our condensed consolidated statement of operations in the first quarter of fiscal 2018, our term-based product subscriptions and flexible enterprise business arrangements are classified and presented in a single line item. Revenue from these arrangements is recognized ratably over the contract term. Revenue for our cloud service offerings is recognized ratably over the contract term commencing with the date our service is made available to customers and when all other revenue recognition criteria have been satisfied.
License and other revenue consists of (1) license revenue and (2) other revenue. License revenue includes software license revenue from the sale of perpetual licenses. Other revenue includes revenue such as consulting and training, and is recognized over time as the services are performed.
2018 Form 10-K 45
| Fiscal Year Ended January 31, 2018 | Change compared to prior fiscal year | Fiscal Year Ended January 31, 2017 | Management Comments | |||||||||||||
| (in millions) | $ | % | ||||||||||||||
| Net Revenue: | ||||||||||||||||
| Maintenance (1) | $ | 989.6 | $ | (113.5 | ) | (10 | )% | $ | 1,103.1 | The decrease in maintenance revenue is driven by the discontinuation of new maintenance agreements. We expect maintenance revenue will slowly decline; however, the rate of decline will vary based on the number of renewals, the renewal rate, and our ability to incentivize maintenance plan customers to switch over to subscription plan offerings. | ||||||
| Subscription (1) | 894.3 | 451.2 | 102 | % | 443.1 | The increase in subscription revenue is primarily a result of the business model transition. We saw growth across all subscription plan types, led by product subscriptions and enterprise business agreements. | ||||||||||
| Total maintenance and subscription revenue | 1,883.9 | 337.7 | 22 | % | 1,546.2 | |||||||||||
| License and other (1) (2) | 172.7 | (312.1 | ) | (64 | )% | 484.8 | The decrease in license revenue is driven by the business model transition, and the discontinuation of suite license sales, resulting in a decrease in revenue from perpetual licenses. | |||||||||
| $ | 2,056.6 | $ | 25.6 | 1 | % | $ | 2,031.0 | |||||||||
| (1) | Prior periods have been adjusted to conform with current period's presentation. See Note 1, "Business and Summary of Significant Accounting Policies" of our consolidated financial statements for additional information. |
| (2) | Within license and other revenue, there was an 18% decrease in other revenue during fiscal 2018 as compared to fiscal 2017. Other revenue represented 5% and 6% of total revenue for fiscal 2018 and 2017, respectively. |
2018 Form 10-K 46
| Fiscal Year Ended January 31, 2017 | Change compared to prior fiscal year | Fiscal Year Ended January 31, 2016 | Management Comments | |||||||||||||
| (in millions) | $ | % | ||||||||||||||
| Net Revenue: | ||||||||||||||||
| Maintenance (1) | $ | 1,103.1 | $ | (49.4 | ) | (4 | )% | $ | 1,152.5 | The decrease in maintenance revenue is driven by the discontinuation of new maintenance agreements. We expect maintenance revenue will slowly decline; however, the rate of decline will vary based on the number of renewals, the renewal rate, and our ability to incentivize maintenance plan customers to switch over to subscription plan offerings. | ||||||
| Subscription (1) | 443.1 | 215.0 | 94 | % | 228.1 | The increase in subscription revenue is primarily a result of the business model transition. We saw growth across all subscription plan types, led by product subscriptions and enterprise business agreements. | ||||||||||
| Total maintenance and subscription revenue | 1,546.2 | 165.6 | 12 | % | 1,380.6 | |||||||||||
| License and other (1) (2) | 484.8 | (638.7 | ) | (57 | )% | 1,123.5 | The decrease in license and other revenue is driven by the discontinuation of our perpetual license sales in favor of subscription offerings. | |||||||||
| $ | 2,031.0 | $ | (473.1 | ) | (19 | )% | $ | 2,504.1 | ||||||||
| (1) | Prior periods have been adjusted to conform with current period's presentation. See Note 1, "Business and Summary of Significant Accounting Policies" of our consolidated financial statements for additional information. |
| (2) | Within license and other revenue, there was a 17% decrease in other revenue during fiscal 2017 as compared to fiscal 2016. Other revenue represented 6% and 6% of total revenue for fiscal 2017 and 2016, respectively. |
Net Revenue by Product Family
Our product offerings are focused in four primary product families: AEC, MFG, AutoCAD and AutoCAD LT (“ACAD”), and M&E. During the business model transition, revenue has been and will be negatively impacted as more revenue is recognized ratably rather than upfront and as new product offerings generally have a lower initial purchase price. As part of the transition, we discontinued selling new perpetual licenses of most individual software products effective February 1, 2016, and discontinued selling new perpetual licenses of suites effective August 1, 2016. These broad impacts are reflected in the summary below.
2018 Form 10-K 47
| Fiscal Year Ended January 31, 2018 | Change compared to prior fiscal year | Fiscal Year Ended January 31, 2017 | Management Comments | |||||||||||||
| (in millions) | $ | % | ||||||||||||||
| Net Revenue by Product Family: | ||||||||||||||||
| Architecture, Engineering and Construction ("AEC") | $ | 866.5 | (14.4 | ) | (2 | )% | $ | 880.9 | Driven by a net decrease in AEC collections and legacy suites due to the discontinuation of perpetual licenses. The decrease was partially offset by an increase in revenue from individual AEC product offerings and EBAs driven by the respective increases in subscription additions. | |||||||
| Manufacturing ("MFG") | 589.2 | (36.6 | ) | (6 | )% | 625.8 | Driven by a net decrease in MFG collections and legacy suites due to the discontinuation of perpetual licenses, partially offset by an increase in revenue from MFG EBAs driven by an increase in subscription additions. | |||||||||
| AutoCAD and AutoCAD LT ("ACAD") | 401.4 | 74.7 | 23 | % | 326.7 | Driven by increases in both AutoCAD LT and AutoCAD due to increases in subscription additions. | ||||||||||
| Media and Entertainment ("M&E") | 152.0 | 13.1 | 9 | % | 138.9 | Driven by an increase in Animation, partially offset by a decrease in Creative Finishing. | ||||||||||
| Other | 47.5 | (11.2 | ) | (19 | )% | 58.7 | ||||||||||
| $ | 2,056.6 | $ | 25.6 | 1 | % | $ | 2,031.0 |
| Fiscal Year Ended January 31, 2017 | Change compared to prior fiscal year | Fiscal Year Ended January 31, 2016 | Management Comments | |||||||||||||
| (in millions) | $ | % | ||||||||||||||
| Net Revenue by Product Family: | ||||||||||||||||
| Architecture, Engineering and Construction ("AEC") | $ | 880.9 | $ | (68.2 | ) | (7 | )% | $ | 949.1 | Driven by a decrease in revenue from individual product offerings. | ||||||
| Manufacturing ("MFG") | 625.8 | (98.8 | ) | (14 | )% | 724.6 | Driven by a decrease in individual product offerings and a decrease in our MFG suites. | |||||||||
| AutoCAD and AutoCAD LT ("ACAD") | 326.7 | (268.1 | ) | (45 | )% | 594.8 | As part of the transition to term-based product subscriptions for our individual software products in February 2016, products like AutoCAD and AutoCAD LT were negatively impacted when compared to the same period in the prior fiscal year as revenue is recognized ratably rather than upfront. | |||||||||
| Media and Entertainment ("M&E") | 138.9 | (21.1 | ) | (13 | )% | 160.0 | Driven by a decrease in Creative Finishing, as we exited the Creative Finishing hardware business at the beginning of the fourth quarter of fiscal 2016. | |||||||||
| Other | 58.7 | (16.9 | ) | (22 | )% | 75.6 | ||||||||||
| $ | 2,031.0 | $ | (473.1 | ) | (19 | )% | $ | 2,504.1 |
2018 Form 10-K 48
Net Revenue by Geographic Area
| Fiscal Year Ended January 31, 2018 | Change compared to prior fiscal year | Constant Currency Change compared to prior fiscal year | Fiscal Year Ended January 31, 2017 | Change compared to prior fiscal year | Constant Currency Change compared to prior fiscal year | Fiscal Year Ended January 31, 2016 | |||||||||||||||||||||||||
| (in millions) | $ | % | % | $ | % | % | |||||||||||||||||||||||||
| Net Revenue: | |||||||||||||||||||||||||||||||
| Americas | |||||||||||||||||||||||||||||||
| U.S. | $ | 740.4 | $ | (1.7 | ) | — | % | * | $ | 742.1 | $ | (61.8 | ) | (8 | )% | * | $ | 803.9 | |||||||||||||
| Other Americas | 130.7 | 0.9 | 1 | % | * | 129.8 | (39.1 | ) | (23 | )% | * | 168.9 | |||||||||||||||||||
| Total Americas | 871.1 | (0.8 | ) | — | % | — | % | 871.9 | (100.9 | ) | (10 | )% | (10 | )% | 972.8 | ||||||||||||||||
| Europe, Middle East, and Africa ("EMEA") | 815.4 | 15.0 | 2 | % | 4 | % | 800.4 | (134.2 | ) | (14 | )% | (8 | )% | 934.6 | |||||||||||||||||
| Asia Pacific ("APAC") | 370.1 | 11.4 | 3 | % | 2 | % | 358.7 | (238.0 | ) | (40 | )% | (39 | )% | 596.7 | |||||||||||||||||
| Total Net Revenue (1) | $ | 2,056.6 | $ | 25.6 | 1 | % | 2 | % | $ | 2,031.0 | $ | (473.1 | ) | (19 | )% | (16 | )% | $ | 2,504.1 | ||||||||||||
| Emerging Economies | $ | 226.5 | (1.0 | ) | — | % | — | % | $ | 227.5 | (138.4 | ) | (38 | )% | (37 | )% | $ | 365.9 |
| (1) | Totals may not sum due to rounding. |
- Constant currency data not provided at this level.
We believe that international revenue will continue to comprise a majority of our net revenue. Unfavorable economic conditions in the countries that contribute a significant portion of our net revenue, including in emerging economies such as Brazil, Russia, India, and China, may have an adverse effect on our business in those countries and our overall financial performance. Changes in the value of the U.S. dollar relative to other currencies have significantly affected, and could continue to significantly affect, our financial results for a given period even though we hedge a portion of our current and projected revenue. Increases to the levels of political and economic unpredictability in the global market may impact our future financial results. Additionally, during the first three years of the business model transition, revenue has been impacted as more revenue is recognized ratably rather than upfront and as new product offerings generally have a lower initial purchase price. While the transition to a subscription model has had a broad impact within all markets, it has had a particular impact to emerging economies as sales of perpetual licenses have historically comprised a greater percentage of total emerging economy sales in comparison to mature markets.
Cost of Revenue and Operating Expenses
Cost of maintenance and subscription revenue includes the labor costs of providing product support to our maintenance and subscription customers, including allocated IT and facilities costs, shipping and handling costs, professional services fees related to operating our network and cloud infrastructure, royalties, depreciation expense and operating lease payments associated with computer equipment, data center costs, salaries, related expenses of network operations, and stock-based compensation expense.
Cost of license and other revenue includes labor costs associated with product setup, costs of consulting and training services contracts, and collaborative project management services contracts. Cost of license and other revenue also includes stock-based compensation expense, direct material and overhead charges, allocated IT and facilities costs, professional services fees and royalties. Direct material and overhead charges include the cost associated with electronic and physical fulfillment.
Cost of revenue, at least over the near term, is affected by the volume and mix of product sales, fluctuations in consulting costs, amortization of developed technology, new customer support offerings, royalty rates for licensed technology embedded in our products and employee stock-based compensation expense.
2018 Form 10-K 49
Marketing and sales expenses include salaries, bonuses, benefits and stock-based compensation expense for our marketing and sales employees, the expense of travel, entertainment and training for such personnel, the costs of programs aimed at increasing revenue, such as advertising, trade shows and expositions, and various sales and promotional programs. Marketing and sales expenses also include labor costs associated with sales and order management, sales and dealer commissions, payment processing fees, the cost of supplies and equipment, gains and losses on our operating expense cash flow hedges, and allocated IT and facilities costs.
Research and development expenses, which are expensed as incurred, consist primarily of salaries, bonuses, benefits and stock-based compensation expense for research and development employees, and the expense of travel, entertainment and training for such personnel, professional services such as fees paid to software development firms and independent contractors, gains and losses on our operating expense cash flow hedges, and allocated IT and facilities costs.
General and administrative expenses include salaries, bonuses, transition costs, benefits and stock-based compensation expense for our CEO, finance, human resources and legal employees, as well as professional fees for legal and accounting services, certain foreign business taxes, gains and losses on our operating expense cash flow hedges, expense of travel, entertainment and training, net IT and facilities costs, and the cost of supplies and equipment.
| Fiscal Year Ended January 31, 2018 | Change compared to prior fiscal year | Fiscal Year Ended January 31, 2017 | Management Comments | |||||||||||||
| (in millions) | $ | % | ||||||||||||||
| Cost of revenue: | ||||||||||||||||
| Maintenance and subscription (1) | $ | 214.4 | $ | 22.7 | 12 | % | $ | 191.7 | Up due to an increase in employee-related costs driven by increased headcount associated with maintenance and subscription services in support of the business model transition. | |||||||
| License and other (1) | 72.6 | (37.6 | ) | (34 | )% | 110.2 | Down due to lower employee-related costs from reduced headcount associated with license and other revenue products and services as a result of our move to a subscription based business model. | |||||||||
| Amortization of developed technology (1) | 16.4 | (23.6 | ) | (59 | )% | 40.0 | Down as previously acquired developed technologies continue to become fully amortized while fewer assets are acquired compared to the prior year. | |||||||||
| Total cost of revenue | $ | 303.4 | $ | (38.5 | ) | (11 | )% | $ | 341.9 | |||||||
| Marketing and sales | $ | 1,087.3 | $ | 64.8 | 6 | % | $ | 1,022.5 | Up due to increase in employee-related costs from higher headcount, increased commissions, and increased stock-based compensation expense from a higher fair value of awards granted. | |||||||
| Research and development | 755.5 | (10.6 | ) | (1 | )% | 766.1 | Down due to a decrease in employee-related costs from lower headcount. | |||||||||
| General and administrative | 305.2 | 17.4 | 6 | % | 287.8 | Up driven by costs associated with the CEO transition and an increase in stock-based compensation expense from a higher fair value of awards granted, partially offset by a decrease in employee-related costs from lower headcount. | ||||||||||
| Amortization of purchased intangibles | 20.2 | (11.6 | ) | (36 | )% | 31.8 | Down as previously acquired intangible assets continue to become fully amortized and fewer assets are acquired compared to the prior year. | |||||||||
| Restructuring charges and other facility exit costs, net | 94.1 | 13.6 | 17 | % | 80.5 | Driven by the Fiscal 2018 Plan to re-balance resources to better align with the Company's strategic priorities and position itself to meet long-term goals. Costs associated with the Fiscal 2018 Plan are principally from employee termination benefits, lease termination costs and other exit costs. | ||||||||||
| $ | 2,262.3 | $ | 73.6 | 3 | % | $ | 2,188.7 | |||||||||
2018 Form 10-K 50
| Fiscal Year Ended January 31, 2017 | Change compared to prior fiscal year | Fiscal Year Ended January 31, 2016 | Management Comments | |||||||||||||
| (in millions) | $ | % | ||||||||||||||
| Cost of revenue: | ||||||||||||||||
| Maintenance and subscription (1) | $ | 191.7 | $ | 29.4 | 18 | % | $ | 162.3 | Up due to increases in employee related costs and direct costs associated with our subscription plan offerings, such as royalties and fulfillment costs. | |||||||
| License and other (1) | 110.2 | (49.2 | ) | (31 | )% | 159.4 | Down due to lower professional fees and employee-related costs from reduced headcount associated with license and other revenue products and the elimination of our Creative Finishing hardware business that was exited in the fourth quarter of fiscal 2016. | |||||||||
| Amortization of developed technology (1) | 40.0 | (9.0 | ) | (18 | )% | 49.0 | Down as previously acquired developed technologies continue to become fully amortized while fewer assets are acquired compared to the prior year. | |||||||||
| Total cost of revenue | $ | 341.9 | $ | (28.8 | ) | (8 | )% | $ | 370.7 | |||||||
| Marketing and sales | $ | 1,022.5 | $ | 7.0 | 1 | % | $ | 1,015.5 | Up due to increases in stock-based compensation and advertising and promotional expenses, offset by a decrease in employee-related costs from reduced headcount and lower professional fees. | |||||||
| Research and development | 766.1 | (23.9 | ) | (3 | )% | 790.0 | Down due to a decrease in professional fees and employee-related costs, partially offset by an increase in stock-based compensation expense. | |||||||||
| General and administrative | 287.8 | (5.6 | ) | (2 | )% | 293.4 | Down due to decreases in bad debt expense and professional fees. | |||||||||
| Amortization of purchased intangibles | 31.8 | (1.4 | ) | (4 | )% | 33.2 | Down as previously acquired intangible assets continue to become fully amortized and fewer assets are acquired compared to the prior year. | |||||||||
| Restructuring charges and other facility exit costs, net | 80.5 | 80.5 | * | — | Driven by the Fiscal 2017 Plan to re-balance staffing levels and reduce operating expenses to better align with the evolving needs of the Company. Costs associated with the Fiscal 2017 Plan are principally from employee termination benefits, lease termination costs and other exit costs. | |||||||||||
| $ | 2,188.7 | $ | 56.6 | 3 | % | $ | 2,132.1 | |||||||||
| (1) | Prior periods have been adjusted to conform with current period's presentation. See Note 11, Business and Summary of Significant Accounting Policies, Basis of Presentation, of our consolidated financial statements for additional information. |
- Percentage is not meaningful.
The following table highlights our expectation for the absolute dollar change and percent of revenue change between the fiscal 2019 as compared to fiscal 2018:
| Absolute dollar impact | Percent of net revenue impact | ||
| Cost of Revenue | Decrease | Decrease | |
| Marketing and sales | Increase | Decrease | |
| Research and development | Increase | Decrease | |
| General and administrative | Increase | Decrease | |
| Amortization of purchased intangibles | Decrease | Flat |
2018 Form 10-K 51
Interest and Other Expense, Net
The following table sets forth the components of interest and other expense, net:
| Fiscal Year Ended January 31, | |||||||||||
| 2018 | 2017 | 2016 | |||||||||
| (in millions) | |||||||||||
| Interest and investment expense, net | $ | (34.5 | ) | $ | (29.7 | ) | $ | (33.9 | ) | ||
| Loss on foreign currency | (3.3 | ) | (3.3 | ) | — | ||||||
| (Loss) gain on strategic investments | (16.4 | ) | 0.3 | 3.8 | |||||||
| Other income | 6.0 | 8.5 | 8.5 | ||||||||
| Interest and other expense, net | $ | (48.2 | ) | $ | (24.2 | ) | $ | (21.6 | ) |
Interest and other expense, net, increased $24.0 million during fiscal 2018, as compared to fiscal 2017, primarily related to increases in impairment losses on certain of our privately-held strategic investments and interest expense resulting from our June 2017 issuance of $500.0 million aggregate principal amount of 3.5% notes due June 15, 2027.
Interest and other expense, net, increased $2.6 million during fiscal 2017, as compared to fiscal 2016, primarily related to a decrease in gains on certain of our privately-held strategic investments and an increase in losses on foreign currency. This increase was partially offset by a decrease in interest and investments expense, net, that was primarily driven by mark to market gains on deferred compensation plans partially offset by an increase in interest expense resulting from the June 2015 issuance of $450.0 million aggregate principal amount of 3.125% senior notes due June 15, 2020 and $300.0 million aggregate principal amount of 4.375% senior notes due June 15, 2025.
Interest expense and investment income fluctuates based on average cash, marketable securities and debt balances, average maturities and interest rates.
Gains and losses on foreign currency are primarily due to the impact of re-measuring foreign currency transactions and net monetary assets into the functional currency of the corresponding entity. The amount of the gain or loss on foreign currency is driven by the volume of foreign currency transactions and the foreign currency exchange rates for the year.
Provision for Income Taxes
We account for income taxes and the related accounts under the liability method. Deferred tax liabilities and assets are determined based on the difference between the financial statement and tax bases of assets and liabilities, using enacted rates expected to be in effect during the year in which the basis differences reverse.
Income tax expense was $9.6 million and $58.3 million for fiscal 2018 and 2017, respectively, relative to pre-tax losses of $557.3 million and $523.8 million, respectively, for the same periods. Tax expense for fiscal 2018 consists primarily of foreign tax expense including withholding tax, and tax amortization on indefinite-lived intangibles offset by a benefit on the revaluation of our deferred tax liability due to the corporate rate reduction under the Tax Act. Tax expense for fiscal 2017 consisted primarily of foreign tax expense including withholding tax, and tax amortization on indefinite-lived intangibles.
The Tax Act was enacted on December 22, 2017, and provides broad and significant changes to the U.S. tax code and how the U.S. imposes income tax on multinational corporations. The Tax Act requires complex computations to be performed that were not previously provided for in the U.S. tax law. These computations require significant judgments to be made regarding the interpretation of the provisions within the Tax Act along with preparation and analysis of information not previously required. In conjunction with the Tax Act, the SEC issued SAB 118 that allows for the Company to record provisional amounts until a final assessment can be made within a period not to exceed one year from the date of enactment.
We have not completed our determination of the accounting implications of the Tax Act on our results of operations. However, we have reasonably estimated the effects of the Tax Act and recorded provisional amounts in our financial statements as of January 31, 2018. We recorded a provisional tax benefit for the impact of the Tax Act of approximately $32.3 million. This amount is primarily comprised of the remeasurement of our indefinite-lived deferred tax liability resulting from the permanent reduction in the U.S. statutory corporate rate from 35% to 21%. We recorded a provisional estimate of the
2018 Form 10-K 52
mandatory one-time tax on accumulated earnings of our foreign subsidiaries that is primarily offset by other current year operating losses and net operating loss carryforwards that are fully valued resulting in no impact to the current year effective tax rate. As additional regulatory guidance is issued and we continue to collect and analyze necessary data, we may make adjustments to provisional amounts previously recorded. We do not anticipate these adjustments to materially impact our provision for income taxes in the period in which the adjustments are made since we are in a full valuation allowance in the U.S.
A valuation allowance is recorded to reduce deferred tax assets when management cannot conclude that it is more likely than not that the net deferred tax asset will be recovered. The valuation allowance is determined by assessing both positive and negative evidence to determine whether it is more likely than not that deferred tax assets are recoverable; such assessment is required on a jurisdiction-by-jurisdiction basis. Significant judgment is required in determining whether the valuation allowance should be recorded against deferred tax assets. In assessing the need for a valuation allowance, we consider all available evidence including past operating results and estimates of future taxable income. Beginning in the second quarter of fiscal 2016, we considered recent cumulative losses in the U.S. arising from the Company's business model transition as a significant source of negative evidence. Considering this negative evidence and the absence of sufficient positive objective evidence that we would generate sufficient taxable income in the U.S. to realize the deferred tax assets, we determined that it was more likely than not that the Company would not realize the U.S. federal and state deferred tax assets and recorded a full valuation allowance. As we continually strive to optimize our overall business model, tax planning strategies may become feasible whereby management may determine that it is more likely than not that the federal and state deferred tax assets will be realized; as a result, we will continue to evaluate the realizability of our net deferred tax assets each quarter, both in the U.S. and in foreign jurisdictions, based on all available evidence, both positive and negative.
As of January 31, 2018, the Company had $337.6 million of gross unrecognized tax benefits, of which $304.8 million would reduce our valuation allowance, if recognized. The remaining $32.8 million would impact the effective tax rate. It is possible that the amount of unrecognized tax benefits will change in the next twelve months; however, an estimate of the range of the possible change cannot be made at this time.
Our future effective annual tax rate may be materially impacted by the amount of benefits and charges from tax amounts associated with our foreign earnings that are taxed at rates different from the federal statutory rate, changes in valuation allowances, level of profit before tax, accounting for uncertain tax positions, business combinations, closure of statute of limitations or settlement of tax audits, and changes in tax laws including impacts of the Tax Act. A significant amount of our earnings is generated by our Europe and Asia Pacific subsidiaries. Our future effective tax rates may be adversely affected to the extent earnings are lower than anticipated in countries where we have lower statutory tax rates.
At January 31, 2018, we had non-current foreign net deferred tax assets of $68.0 million that management believes are more likely than not to be realized in future years.
For additional information regarding our income tax provision and reconciliation of our effective rate to the federal statutory rate of 33.81%, see Note 4, “Income Taxes,” in the Notes to Consolidated Financial Statements.
2018 Form 10-K 53
Other Financial Information
In addition to our results determined under U.S. generally accepted accounting principles (“GAAP”) discussed above, we believe the following non-GAAP measures are useful to investors in evaluating our operating performance. For the fiscal years ended January 31, 2018, 2017, and 2016, our gross profit, gross margin, (loss) income from operations, operating margin, net (loss) income, diluted net (loss) income per share and diluted shares used in per share calculation on a GAAP and non-GAAP basis were as follows (in millions except for gross margin, operating margin, and per share data):
| Fiscal Year Ended January 31, | |||||||||||
| 2018 | 2017 | 2016 | |||||||||
| (Unaudited) | |||||||||||
| Gross profit | $ | 1,753.2 | $ | 1,689.1 | $ | 2,133.4 | |||||
| Non-GAAP gross profit | $ | 1,785.5 | $ | 1,743.2 | $ | 2,194.2 | |||||
| Gross margin | 85 | % | 83 | % | 85 | % | |||||
| Non-GAAP gross margin | 87 | % | 86 | % | 88 | % | |||||
| (Loss) income from operations | $ | (509.1 | ) | $ | (499.6 | ) | $ | 1.3 | |||
| Non-GAAP (loss) income from operations | $ | (112.0 | ) | $ | (125.5 | ) | $ | 280.7 | |||
| Operating margin | (25 | )% | (25 | )% | — | % | |||||
| Non-GAAP operating margin | (5 | )% | (6 | )% | 11 | % | |||||
| Net loss | $ | (566.9 | ) | $ | (582.1 | ) | $ | (330.5 | ) | ||
| Non-GAAP net (loss) income | $ | (106.3 | ) | $ | (111.0 | ) | $ | 194.1 | |||
| Diluted net (loss) income per share (1) | $ | (2.58 | ) | $ | (2.61 | ) | $ | (1.46 | ) | ||
| Non-GAAP diluted (loss) income per share (1) | $ | (0.48 | ) | $ | (0.50 | ) | $ | 0.84 | |||
| GAAP diluted weighted average shares used in per share calculation | 219.5 | 222.7 | 226.0 | ||||||||
| Non-GAAP diluted weighted average shares used in per share calculation | 219.5 | 222.7 | 230.7 |
| (1) | Net (loss) income per share were computed independently for each of the periods presented; therefore the sum of the net (loss) income per share amount for the quarters may not equal the total for the year. |
For our internal budgeting and resource allocation process and as a means to provide consistency in period-to-period comparisons, we use non-GAAP measures to supplement our consolidated financial statements presented on a GAAP basis. These non-GAAP measures do not include certain items that may have a material impact upon our reported financial results. We also use non-GAAP measures in making operating decisions because we believe those measures provide meaningful supplemental information regarding our earning potential and performance for management by excluding certain benefits, credits, expenses and charges that may not be indicative of our core business operating results. For the reasons set forth below, we believe these non-GAAP financial measures are useful to investors both because (1) they allow for greater transparency with respect to key metrics used by management in its financial and operational decision-making and (2) they are used by our institutional investors and the analyst community to help them analyze the health of our business. This allows investors and others to better understand and evaluate our operating results and future prospects in the same manner as management, compare financial results across accounting periods and to those of peer companies and to better understand the long-term performance of our core business. We also use some of these measures for purposes of determining company-wide incentive compensation.
There are limitations in using non-GAAP financial measures because non-GAAP financial measures are not prepared in accordance with GAAP and may be different from non-GAAP financial measures used by other companies. The non-GAAP financial measures included above are limited in value because they exclude certain items that may have a material impact upon our reported financial results. In addition, they are subject to inherent limitations as they reflect the exercise of judgments by management about which charges are excluded from the non-GAAP financial measures. We compensate for these limitations by analyzing current and future results on a GAAP basis as well as a non-GAAP basis and also by providing GAAP measures in our public disclosures. The presentation of non-GAAP financial information is meant to be considered in addition to, not as a substitute for or in isolation from, the directly comparable financial measures prepared in accordance with GAAP. We urge investors to review the reconciliation of our non-GAAP financial measures to the comparable GAAP financial measures included below, and not to rely on any single financial measure to evaluate our business.
2018 Form 10-K 54
Reconciliation of GAAP Financial Measures to Non-GAAP Financial Measures
(In millions except for gross margin, operating margin, and per share data):
| Fiscal Year Ended January 31, | |||||||||||
| 2018 | 2017 | 2016 | |||||||||
| (Unaudited) | |||||||||||
| Gross profit | $ | 1,753.2 | $ | 1,689.1 | $ | 2,133.4 | |||||
| Stock-based compensation expense | 15.9 | 14.1 | 11.8 | ||||||||
| Amortization of developed technologies | 16.4 | 40.0 | 49.0 | ||||||||
| Non-GAAP gross profit | $ | 1,785.5 | $ | 1,743.2 | $ | 2,194.2 | |||||
| Gross margin | 85 | % | 83 | % | 85 | % | |||||
| Stock-based compensation expense | 1 | % | 1 | % | 1 | % | |||||
| Amortization of developed technologies | 1 | % | 2 | % | 2 | % | |||||
| Non-GAAP gross margin | 87 | % | 86 | % | 88 | % | |||||
| (Loss) income from operations | $ | (509.1 | ) | $ | (499.6 | ) | $ | 1.3 | |||
| Stock-based compensation expense | 245.0 | 221.8 | 197.2 | ||||||||
| Amortization of developed technologies | 16.4 | 40.0 | 49.0 | ||||||||
| Amortization of purchased intangibles | 20.2 | 31.8 | 33.2 | ||||||||
| CEO transition costs (1) | 21.4 | — | — | ||||||||
| Restructuring charges and other facility exit costs, net | 94.1 | 80.5 | — | ||||||||
| Non-GAAP (loss) income from operations | $ | (112.0 | ) | $ | (125.5 | ) | $ | 280.7 | |||
| Operating margin | (25 | )% | (25 | )% | — | % | |||||
| Stock-based compensation expense | 12 | % | 11 | % | 8 | % | |||||
| Amortization of developed technologies | 1 | % | 2 | % | 2 | % | |||||
| Amortization of purchased intangibles | 1 | % | 2 | % | 1 | % | |||||
| CEO transition costs (1) | 1 | % | — | % | — | % | |||||
| Restructuring charges and other facility exit costs, net | 5 | % | 4 | % | — | % | |||||
| Non-GAAP operating margin | (5 | )% | (6 | )% | 11 | % | |||||
| Net loss | $ | (566.9 | ) | $ | (582.1 | ) | $ | (330.5 | ) | ||
| Stock-based compensation expense | 245.0 | 221.8 | 197.2 | ||||||||
| Amortization of developed technologies | 16.4 | 40.0 | 49.0 | ||||||||
| Amortization of purchased intangibles | 20.2 | 31.8 | 33.2 | ||||||||
| CEO transition costs (1) | 21.4 | — | — | ||||||||
| Restructuring charges and other facility exit costs, net | 94.1 | 80.5 | — | ||||||||
| Loss (gain) on strategic investments | 16.5 | (0.3 | ) | (3.7 | ) | ||||||
| Establishment of valuation allowance on deferred tax assets | — | — | 230.9 | ||||||||
| Discrete tax provision items | (20.7 | ) | (2.7 | ) | 0.8 | ||||||
| Income tax effect of non-GAAP adjustments | 67.7 | 100.0 | 17.2 | ||||||||
| Non-GAAP net (loss) income | $ | (106.3 | ) | $ | (111.0 | ) | $ | 194.1 |
2018 Form 10-K 55
| Fiscal Year Ended January 31, | |||||||||||
| 2018 | 2017 | 2016 | |||||||||
| (Unaudited) | |||||||||||
| Diluted net (loss) income per share (2) | $ | (2.58 | ) | $ | (2.61 | ) | $ | (1.46 | ) | ||
| Stock-based compensation expense | 1.11 | 1.00 | 0.86 | ||||||||
| Amortization of developed technologies | 0.08 | 0.18 | 0.21 | ||||||||
| Amortization of purchased intangibles | 0.09 | 0.14 | 0.15 | ||||||||
| CEO transition costs (1) | 0.09 | — | — | ||||||||
| Restructuring charges and other facility exit costs, net | 0.43 | 0.35 | — | ||||||||
| Loss (gain) on strategic investments | 0.08 | — | (0.01 | ) | |||||||
| Establishment of valuation allowance on deferred tax assets | — | — | 1.01 | ||||||||
| Discrete tax provision items | (0.09 | ) | (0.01 | ) | — | ||||||
| Income tax effect of non-GAAP adjustments | 0.31 | 0.45 | 0.08 | ||||||||
| Non-GAAP diluted (loss) income per share (2) | $ | (0.48 | ) | $ | (0.50 | ) | $ | 0.84 |
| (1) | CEO transition costs include stock-based compensation of $16.4 million related to the acceleration of eligible stock awards in conjunction with the Company's former CEOs' transition agreements. |
| (2) | Net (loss) income per share were computed independently for each of the periods presented; therefore the sum of the net (loss) income per share amount for the quarters may not equal the total for the year. |
Our non-GAAP financial measures may exclude the following:
Stock-based compensation expenses. We exclude stock-based compensation expenses from non-GAAP measures primarily because they are non-cash expenses and management finds it useful to exclude certain non-cash charges to assess the appropriate level of various operating expenses to assist in budgeting, planning, and forecasting future periods. Moreover, because of varying available valuation methodologies, subjective assumptions and the variety of award types that companies can use under FASB ASC Topic 718, we believe excluding stock-based compensation expenses allows investors to make meaningful comparisons between our recurring core business operating results and those of other companies.
Amortization of developed technologies and purchased intangibles. We incur amortization of acquisition-related developed technology and purchased intangibles in connection with acquisitions of certain businesses and technologies. Amortization of developed technologies and purchased intangibles is inconsistent in amount and frequency and is significantly affected by the timing and size of our acquisitions. Management finds it useful to exclude these variable charges from our cost of revenues to assist in budgeting, planning, and forecasting future periods. Investors should note that the use of intangible assets contributed to our revenues earned during the periods presented and will contribute to our future period revenues as well. Amortization of developed technologies and purchased intangible assets will recur in future periods.
CEO transition costs. We exclude amounts paid to the Company's former CEOs upon departure under the terms of their transition agreements, including severance payments, acceleration of restricted stock units, and continued vesting of performance stock units, and legal fees incurred with the transition. Also excluded from our non-GAAP measures are recruiting costs related to the search for a new CEO. These costs represent non-recurring expenses and are not indicative of our ongoing operating expenses. We further believe that excluding the CEO transition costs from our non-GAAP results is useful to investors in that it allows for period-over-period comparability.
Goodwill impairment. This is a non-cash charge to write-down goodwill to fair value when there was an indication that the asset was impaired. As explained above, management finds it useful to exclude certain non-cash charges to assess the appropriate level of various operating expenses to assist in budgeting, planning, and forecasting future periods.
Restructuring charges and other facility exit costs (benefits), net. These expenses are associated with realigning our business strategies based on current economic conditions. In connection with these restructuring actions or other exit actions, we recognize costs related to termination benefits for former employees whose positions were eliminated, the closure of facilities and cancellation of certain contracts. We exclude these charges because these expenses are not reflective of ongoing business and operating results. We believe it is useful for investors to understand the effects of these items on our total operating expenses.
2018 Form 10-K 56
Loss (gain) on strategic investments. We exclude gains and losses related to our strategic investments from our non-GAAP measures primarily because management finds it useful to exclude these variable gains and losses on these investments in assessing our financial results. Included in these amounts are non-cash unrealized gains and losses on the derivative components and realized gains and losses on the sale or losses on the impairment of these investments. We believe excluding these items is useful to investors because these excluded items do not correlate to the underlying performance of our business and these losses or gains were incurred in connection with strategic investments which do not occur regularly.
Establishment of a valuation allowance on certain net deferred tax assets. This is a non-cash charge to record a valuation allowance on certain deferred tax assets. As explained above, management finds it useful to exclude certain non-cash charges to assess the appropriate level of various cash expenses to assist in budgeting, planning, and forecasting future periods.
Discrete tax items. We exclude the GAAP tax provision, including discrete items, from the non-GAAP measure of net (loss) income, and include a non-GAAP tax provision based upon the projected annual non-GAAP effective tax rate. Discrete tax items include income tax expenses or benefits that do not relate to ordinary income from continuing operations in the current fiscal year, unusual or infrequently occurring items, or the tax impact of certain stock-based compensation. Examples of discrete tax items include, but are not limited to, certain changes in judgment and changes in estimates of tax matters related to prior fiscal years, certain costs related to business combinations, certain changes in the ability to utilize deferred tax assets or changes in tax law. Management believes this approach assists investors in understanding the tax provision and the effective tax rate related to ongoing operations. We believe the exclusion of these discrete tax items provides investors with useful supplemental information about our operational performance.
Income tax effects on the difference between GAAP and non-GAAP costs and expenses. The income tax effects that are excluded from the non-GAAP measures relate to the tax impact on the difference between GAAP and non-GAAP expenses, primarily due to stock-based compensation, amortization of purchased intangibles, restructuring charges and other facilities exit costs, and impacts of the corporate rate reduction and one-time deemed mandatory repatriation of certain foreign earnings under the Tax Act, net for GAAP and non-GAAP measures.
Liquidity and Capital Resources
Our primary source of cash is from subscriptions to our products, maintenance payments, and related services. Our primary use of cash is payment of our operating costs, which consist primarily of employee-related expenses, such as compensation and benefits, as well as general operating expenses for marketing, facilities and overhead costs. In addition to operating expenses, we also use cash to fund our stock repurchase program and invest in our growth initiatives, which include acquisitions of products, technology and businesses. See further discussion of these items below.
At January 31, 2018, our principal sources of liquidity were cash, cash equivalents, and marketable securities totaling $1.5 billion and net accounts receivable of $438.2 million.
In June 2017, we issued $500.0 million aggregate principal amount of 3.5% notes due June 15, 2027. In June 2015, we issued $450.0 million aggregate principal amount of 3.125% notes due June 15, 2020, and $300.0 million aggregate principal amount of 4.375% notes due June 15, 2025. In December 2012, we issued $400.0 million aggregate principal amount of 1.95% notes due December 15, 2017, and $350.0 million aggregate principal amount of 3.6% notes due December 15, 2022 (all five series of notes collectively, the “Notes”). In July 2017, we redeemed in full $400.0 million in aggregate principal amount of outstanding 1.95% senior notes due December 15, 2017. The redemption was completed pursuant to the optional redemption provisions of the first supplemental indenture dated December 13, 2012. To redeem the notes, we used a portion of the proceeds of the June 2017 Notes to pay a redemption price of approximately $400.9 million, plus accrued and unpaid interest. Total cash repayment was $401.8 million. The Company did not incur any additional early termination penalties relating to such redemption.
As of January 31, 2018, we have $1.6 billion aggregate principal amount of Notes outstanding. In addition, we have a line of credit facility that permits unsecured short-term borrowings of up to $400.0 million with a May 2020 maturity date, with an option to request an increase in the amount of the credit facility by up to an additional $100.0 million. This credit agreement contains customary covenants that could restrict the imposition of liens on our assets, and restrict the Company’s ability to incur additional indebtedness or make dispositions of assets if we fail to maintain the financial covenants. The financial covenants consist of a maximum debt to total cash ratio, a fixed charge coverage ratio through April 30, 2018, and after April 30, 2018, a minimum interest coverage ratio. As of January 31, 2018, we are compliant with all financial covenants related to our line of credit facility and as of March 22, 2018, we have no amounts outstanding under the credit facility. If we are unable to remain in compliance with the covenants, we will not be able to draw on our credit facility. Borrowings under the credit facility and the
2018 Form 10-K 57
net proceeds from the offering of the Notes are available for general corporate purposes.
Our cash and cash equivalents are held by diversified financial institutions globally. Our primary commercial banking relationship is with Citigroup and its global affiliates. In addition, Citibank N.A., an affiliate of Citigroup, is one of the lead lenders and agent in the syndicate of our $400.0 million line of credit.
Long-term cash requirements for items other than normal operating expenses are anticipated for the following: repayment of debt; common stock repurchases; the acquisition of businesses, software products, or technologies complementary to our business; and capital expenditures, including the purchase and implementation of internal-use software applications.
Our strategy includes improving our product functionality and expanding our product offerings through internal development as well as through the acquisition of products, technology, and businesses. Acquisitions often increase the speed at which we can deliver product functionality to our customers; however, they entail cost and integration challenges and, in certain instances, negatively impact our operating margins. We continually review these trade-offs in making decisions regarding acquisitions. We currently anticipate that we will continue to acquire products, technology, and businesses as compelling opportunities become available. Our decision to acquire businesses or technology is dependent on our business needs, the availability of suitable sellers and technology, and our own financial condition.
Our cash, cash equivalents, and marketable securities balances are concentrated in a few locations around the world, with substantial amounts held outside of the United States. As of January 31, 2018, approximately 74% of our total cash or cash equivalents and marketable securities are located in foreign jurisdictions and that percentage will fluctuate subject to business needs. There are several factors that can impact our ability to utilize foreign cash balances, such as foreign exchange restrictions, foreign regulatory restrictions or adverse tax costs. The Tax Act includes a mandatory one-time tax on accumulated earnings of foreign subsidiaries and generally eliminates U.S. taxes on foreign subsidiary distributions in future periods. As a result, earnings in foreign jurisdictions are generally available for distribution to the U.S. with little to no incremental U.S. taxes. We expect to meet our liquidity needs through current cash balances, ongoing cash flows, external borrowings, or a combination. We regularly review our capital structure and consider a variety of potential financing alternatives and planning strategies to ensure we have the proper liquidity available in the locations in which it is needed.
Cash from operations could also be affected by various risks and uncertainties, including, but not limited to the risks detailed in Part I, Item 1A titled “Risk Factors.” However, based on our current business plan and revenue prospects, we believe that our existing balances, our anticipated cash flows from operations and our available credit facility will be sufficient to meet our working capital and operating resource expenditure requirements for at least the next 12 months.
Our revenue, earnings, cash flows, receivables, and payables are subject to fluctuations due to changes in foreign currency exchange rates, for which we have put in place foreign currency contracts as part of our risk management strategy. See Part II, Item 7A, “Quantitative and Qualitative Disclosures about Market Risk” for further discussion.
| Fiscal year ended January 31, | |||||||||||
| (in millions) | 2018 | 2017 | 2016 | ||||||||
| Net cash provided by operating activities | $ | 0.9 | $ | 169.7 | $ | 414.0 | |||||
| Net cash provided by (used in) investing activities | 506.4 | 272.0 | (809.5 | ) | |||||||
| Net cash used in financing activities | (656.6 | ) | (578.3 | ) | 343.2 |
Net cash provided by operating activities of $0.9 million for fiscal 2018 consisted of $330.7 million of non-cash expenses, including stock-based compensation expense, depreciation, amortization and accretion expense, and $135.7 million of cash flow provided by changes in operating assets and liabilities, offsetting our net loss of $566.9 million.
The primary working capital source of cash was an increase in deferred revenue from $1,788.0 million as of January 31, 2017, to $1,955.1 million as of January 31, 2018. The primary working capital uses of cash were decreases in accrued income taxes and other accrued liabilities.
Net cash provided by investing was $506.4 million for fiscal 2018 and was primarily due to the sale and maturities of marketable securities. These cash inflows were partially offset by purchases of marketable securities and capital expenditures.
2018 Form 10-K 58
At January 31, 2018, our short-term investment portfolio had an estimated fair value of $245.2 million and a cost basis of $236.4 million. The portfolio fair value consisted of $99.3 million invested in corporate debt securities, $37.1 million invested in U.S. government securities, $27.5 million invested in commercial paper, $13.1 million invested in asset backed securities, and $9.2 million invested in other short-term securities.
At January 31, 2018, $59.0 million of trading securities were invested in a defined set of mutual funds as directed by the participants in our Deferred Compensation Plan (see Note 6, “Deferred Compensation,” in the Notes to Consolidated Financial Statements for further discussion).
Net cash used in financing activities was $656.6 million fiscal 2018 and was primarily due to repurchases of our common stock and the repayment of debt noted earlier in this section. These cash outflows were offset in part by the issuance of debt also noted earlier in this section.
Contractual Obligations
The following table summarizes our significant financial contractual obligations at January 31, 2018, and the effect such obligations are expected to have on our liquidity and cash flows in future periods.
| Total | Fiscal 2019 | Fiscal Years 2010-2021 | Fiscal Years 2022-2023 | Thereafter | |||||||||||||||
| (in millions) | |||||||||||||||||||
| Notes | $ | 1,955.6 | $ | 57.3 | $ | 555.7 | $ | 434.9 | $ | 907.7 | |||||||||
| Operating lease obligations | 247.0 | 61.3 | 80.5 | 47.5 | 57.7 | ||||||||||||||
| Purchase obligations | 147.6 | 63.8 | 59.7 | 14.8 | 9.3 | ||||||||||||||
| Deferred compensation obligations | 59.0 | 3.4 | 9.0 | 8.3 | 38.3 | ||||||||||||||
| Pension obligations | 67.6 | 7.1 | 12.9 | 12.8 | 34.8 | ||||||||||||||
| Asset retirement obligations | 10.6 | 2.9 | 7.3 | 0.1 | 0.3 | ||||||||||||||
| Total (1) | $ | 2,487.4 | $ | 195.8 | $ | 725.1 | $ | 518.4 | $ | 1,048.1 |
| (1) | This table generally excludes amounts already recorded on the balance sheet as current liabilities, certain purchase obligations as discussed below, long term deferred revenue, and amounts related to income tax liabilities for uncertain tax positions, since we cannot predict with reasonable reliability the timing of cash settlements to the respective taxing authorities (see Note 4, “Income Taxes” to the Notes to Consolidated Financial Statements). |
Notes consist of the Senior Notes issued in December 2012, June 2015 and June 2017 described above.
Operating lease obligations consist primarily of obligations for facilities, net of sublease income, computer equipment and other equipment leases.
Purchase obligations are contractual obligations for purchase of goods or services and are defined as agreements that are enforceable and legally binding on Autodesk and that specify all significant terms, including: fixed or minimum quantities to be purchased; fixed, minimum, or variable price provisions; and the approximate timing of the transaction. Purchase obligations relate primarily to enterprise subscription agreements, IT infrastructure costs, and marketing costs.
Deferred compensation obligations relate to amounts held in a rabbi trust under our non-qualified deferred compensation plan. See Note 6, “Deferred Compensation,” in our Notes to Consolidated Financial Statements for further information regarding this plan.
Pension obligations relate to our obligations for pension plans outside of the U.S. See Note 14, “Retirement Benefit Plans,” in our Notes to Consolidated Financial Statements for further information regarding these obligations.
Asset retirement obligations represent the estimated costs to bring certain office buildings that we lease back to their original condition after the termination of the lease.
Purchase orders or contracts for the purchase of supplies and other goods and services are not included in the table above. We are not able to determine the aggregate amount of such purchase orders that represent contractual obligations, as purchase
2018 Form 10-K 59
orders may represent authorizations to purchase rather than binding agreements. Our purchase orders are based on our current procurement or development needs and are fulfilled by our vendors within short time horizons. We do not have significant agreements for the purchase of supplies or other goods specifying minimum quantities or set prices that exceed our expected requirements for three months. In addition, we have certain software royalty commitments associated with the shipment and licensing of certain products.
The expected timing of payment of the obligations discussed above is estimated based on current information. Timing of payments and actual amounts paid may be different depending on the time of receipt of goods or services or changes to agreed-upon amounts for some obligations.
We provide indemnifications of varying scopes and certain guarantees, including limited product warranties. Historically, costs related to these warranties and indemnifications have not been significant, but because potential future costs are highly variable, we are unable to estimate the maximum potential impact of these guarantees on our future results of operations.
Issuer Purchases of Equity Securities
Autodesk's stock repurchase program provides Autodesk with the ability to offset the dilution from the issuance of stock under our employee stock plans and reduce shares outstanding over time, and has the effect of returning excess cash generated from our business to stockholders. Under the share repurchase program, Autodesk may repurchase shares from time to time in open market transactions, privately-negotiated transactions, accelerated share repurchase programs, tender offers, or by other means. The share repurchase program does not have an expiration date and the pace and timing of repurchases will depend on factors such as cash generation from operations, available surplus, the volume of employee stock plan activity, remaining shares available in the authorized pool, cash requirements for acquisitions, economic and market conditions, stock price and legal and regulatory requirements.
During the three and twelve months ended January 31, 2018, we repurchased 2.5 million and 6.9 million shares of our common stock, respectively. At January 31, 2018, 19.6 million shares remained available for repurchase under the repurchase program approved by the Board of Directors. This programs does not have a fixed expiration date. See Note 9, “Stockholders' (Deficit) Equity,” in the Notes to Consolidated Financial Statements for further discussion.
Off-Balance Sheet Arrangements
As of January 31, 2018, we did not have any significant off-balance sheet arrangements other than operating leases, as defined in Item 303(a)(4)(ii) of Regulation S-K.
2018 Form 10-K 60
Previous: Item 6. SELECTED FINANCIAL DATA · Next: Item 7A. QUANTITATIVE AND QUALITATIVE DISCLOSURES ABOUT MARKET RISK