 filings.tools
Item 5. MARKET FOR REGISTRANTS’ COMMON EQUITY, RELATED STOCKHOLDER MATTERS, AND ISSUER PURCHASE OF EQUITY SECURITIES
6K characters. Original on sec.gov · Markdown
Item 5. MARKET FOR REGISTRANTS’ COMMON EQUITY, RELATED STOCKHOLDER MATTERS, AND ISSUER PURCHASE OF EQUITY SECURITIES
Ameren’s common stock is listed on the NYSE (ticker symbol: AEE). Ameren common shareholders of record totaled 47,748 on January 31, 2018. The following table presents the price ranges, closing prices, and dividends declared per Ameren common share for each quarter during 2017 and 2016:
| High | Low | Close | Dividends Declared | ||||||||||||
| 2017 Quarter Ended: | |||||||||||||||
| March 31 | $ | 56.57 | $ | 51.35 | $ | 54.59 | $ | 0.44 | |||||||
| June 30 | 57.21 | 53.72 | 54.67 | 0.44 | |||||||||||
| September 30 | 60.91 | 53.54 | 57.84 | 0.44 | |||||||||||
| December 31 | 64.89 | 57.67 | 58.99 | 0.4575 | |||||||||||
| 2016 Quarter Ended: | |||||||||||||||
| March 31 | $ | 50.16 | $ | 41.50 | $ | 50.10 | $ | 0.425 | |||||||
| June 30 | 53.59 | 46.29 | 53.58 | 0.425 | |||||||||||
| September 30 | 54.08 | 47.79 | 49.18 | 0.425 | |||||||||||
| December 31 | 52.88 | 46.84 | 52.46 | 0.44 |
There is no trading market for the common stock of Ameren Missouri and Ameren Illinois. Ameren holds all outstanding common stock of Ameren Missouri and Ameren Illinois.
The following table sets forth the quarterly common stock dividend payments made by Ameren and its registrant subsidiaries during 2017 and 2016:
| 2017 | 2016 | |||||||||||||||||||||||||||||||
| (In millions) | Quarter Ended | Quarter Ended | ||||||||||||||||||||||||||||||
| Registrant | December 31 | September 30 | June 30 | March 31 | December 31 | September 30 | June 30 | March 31 | ||||||||||||||||||||||||
| Ameren Missouri | $ | 30 | $ | 160 | $ | 112 | $ | 60 | $ | 70 | $ | 75 | $ | 70 | $ | 140 | ||||||||||||||||
| Ameren Illinois | — | — | — | — | 15 | 35 | 30 | 30 | ||||||||||||||||||||||||
| Ameren | 111 | 106 | 107 | 107 | 107 | 103 | 103 | 103 |
On February 9, 2018, the board of directors of Ameren declared a quarterly dividend on Ameren’s common stock of 45.75 cents per share. The common share dividend is payable March 29, 2018, to shareholders of record on March 14, 2018.
For a discussion of restrictions on the Ameren Companies’ payment of dividends, see Liquidity and Capital Resources in Management’s Discussion and Analysis of Financial Condition and Results of Operations under Part II, Item 7, of this report.
Purchases of Equity Securities
The following table presents Ameren Corporation’s purchases of equity securities reportable under Item 703 of Regulation S-K:
| Period | (a) Total Number of Shares (or Units) Purchased | (b) Average Price Paid per Share (or Unit) | (c) Total Number of Shares (or Units) Purchased as Part of Publicly Announced Plans or Programs | (d) Maximum Number (or Approximate Dollar Value) of Shares (or Units) that May Yet Be Purchased Under the Plans or Programs | ||||||||
| October 1 – October 31, 2017 | — | $ | — | — | — | |||||||
| November 1 – November 30, 2017(a) | 5,232 | 62.35 | — | — | ||||||||
| December 1 – December 31, 2017 | — | — | — | — | ||||||||
| Total | 5,232 | $ | 62.35 | — | — |
| (a) | The shares of Ameren common stock were purchased in open-market transactions in satisfaction of Ameren’s obligations for Ameren board of directors’ compensation awards issued under its stock-based compensation plans. Ameren does not have any publicly announced equity securities repurchase plans or programs. |
Ameren Missouri and Ameren Illinois did not purchase any equity securities reportable under Item 703 of Regulation S-K during the period from October 1, 2017, to December 31, 2017.
Performance Graph
The following graph shows Ameren’s cumulative total shareholder return during the five years ended December 31, 2017. The graph also shows the cumulative total returns of the S&P 500 Index and the Edison Electric Institute Index (EEI Index), which comprises most investor-owned electric utilities in the United States. The comparison assumes that $100 was invested on December 31, 2012, in Ameren common stock and in each of the indices shown, and it assumes that all of the dividends were reinvested.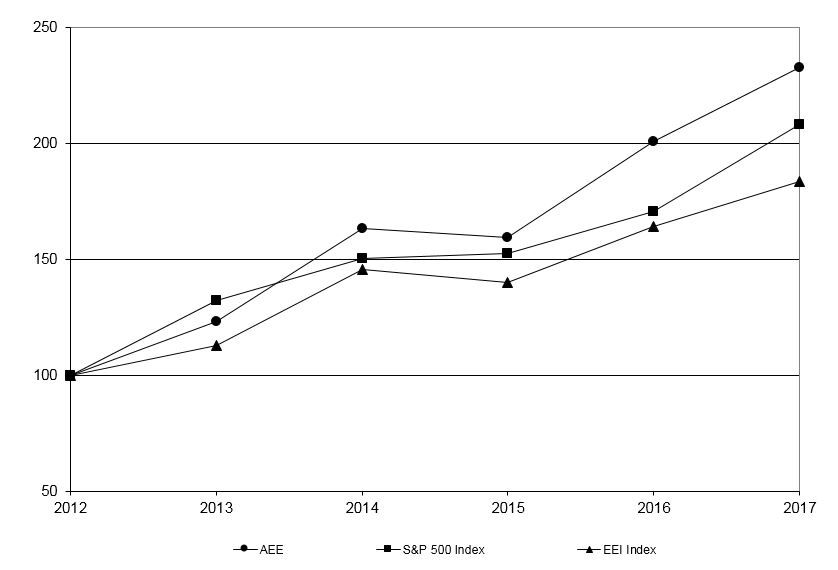
| December 31, | 2012 | 2013 | 2014 | 2015 | 2016 | 2017 | |||||||||||||||||
| Ameren (AEE) | $ | 100.00 | $ | 123.31 | $ | 163.67 | $ | 159.79 | $ | 200.79 | $ | 232.84 | |||||||||||
| S&P 500 Index | 100.00 | 132.39 | 150.51 | 152.59 | 170.84 | 208.14 | |||||||||||||||||
| EEI Index | 100.00 | 113.01 | 145.68 | 140.00 | 164.42 | 183.69 |
Ameren management cautions that the stock price performance shown above should not be considered indicative of future stock price performance.
Previous: Item 4. MINE SAFETY DISCLOSURES · Next: Item 6. SELECTED FINANCIAL DATA