 filings.tools
Item 1. BUSINESS
117K characters. Original on sec.gov · Markdown
Item 1. BUSINESS
GENERAL
Overview and Description of Major Subsidiaries
AEP was incorporated under the laws of the State of New York in 1906 and reorganized in 1925. It is a public utility holding company that owns, directly or indirectly, all of the outstanding common stock of its public utility subsidiaries and varying percentages of other subsidiaries.
The service areas of AEP’s public utility subsidiaries cover portions of the states of Arkansas, Indiana, Kentucky, Louisiana, Michigan, Ohio, Oklahoma, Tennessee, Texas, Virginia and West Virginia. Transmission networks are interconnected with extensive distribution facilities in the territories served. The public utility subsidiaries of AEP have traditionally provided electric service, consisting of generation, transmission and distribution, on an integrated basis to their retail customers. Restructuring laws in Michigan, Ohio and the ERCOT area of Texas have caused AEP public utility subsidiaries in those states to unbundle previously integrated regulated rates for their retail customers.
The member companies of the AEP System have contractual, financial and other business relationships with the other member companies, such as participation in the AEP System savings and retirement plans and tax returns, sales of electricity and transportation and handling of fuel. The companies of the AEP System also obtain certain accounting, administrative, information systems, engineering, financial, legal, maintenance and other services at cost from a common provider, AEPSC.
As of December 31, 2019, the subsidiaries of AEP had a total of 17,408 employees. Because it is a holding company rather than an operating company, AEP has no employees. The material subsidiaries of AEP are as follows:
AEP Texas
Organized in Delaware in 1925, AEP Texas is engaged in the transmission and distribution of electric power to approximately 1,049,000 retail customers through REPs in west, central and southern Texas. As of December 31, 2019, AEP Texas had 1,585 employees. Among the principal industries served by AEP Texas are petroleum and coal products manufacturing, chemical manufacturing, oil and gas extraction, pipeline transportation and primary metal manufacturing. The territory served by AEP Texas also includes several military installations and correctional facilities. AEP Texas is a member of ERCOT. AEP Texas is part of AEP’s Transmission and Distribution Utilities segment.
AEPTCo
Organized in Delaware in 2006, AEPTCo is a holding company for the State Transcos. The State Transcos develop and own new transmission assets that are physically connected to the AEP System. Individual State Transcos (a) have obtained the approvals necessary to operate in Indiana, Kentucky, Michigan, Ohio, Oklahoma and West Virginia, subject to any applicable siting requirements, (b) are authorized to submit projects for commission approval in Virginia and (c) have been granted consent to enter into a joint license agreement that will support investment in Tennessee. Neither AEPTCo nor its subsidiaries have any employees. Instead, AEPSC and certain AEP utility subsidiaries provide services to these entities. AEPTCo is part of the AEP Transmission Holdco segment.
APCo
Organized in Virginia in 1926, APCo is engaged in the generation, transmission and distribution of electric power to approximately 956,000 retail customers in the southwestern portion of Virginia and southern West Virginia, and in supplying and marketing electric power at wholesale to other electric utility companies, municipalities and other market participants. APCo owns 6,629 MWs of generating capacity. APCo uses its generation to serve its retail and other customers. As of December 31, 2019, APCo had 1,699 employees. Among the principal industries served by APCo are coal mining, primary metals, pipeline transportation, chemical manufacturing and paper manufacturing. APCo is a member of PJM. APCo is part of AEP’s Vertically Integrated Utilities segment.
I&M
Organized in Indiana in 1907, I&M is engaged in the generation, transmission and distribution of electric power to approximately 599,000 retail customers in northern and eastern Indiana and southwestern Michigan, and in supplying and marketing electric power at wholesale to other electric utility companies, rural electric cooperatives, municipalities and other market participants. I&M owns or leases 3,634 MWs of generating capacity, which it uses to serve its retail and other customers. As of December 31, 2019, I&M had 2,336 employees. Among the principal industries served are primary metals, transportation equipment, chemical manufacturing, plastics and rubber products and fabricated metal product manufacturing. I&M is a member of PJM. I&M is part of AEP’s Vertically Integrated Utilities segment.
KPCo
Organized in Kentucky in 1919, KPCo is engaged in the generation, transmission and distribution of electric power to approximately 165,000 retail customers in eastern Kentucky, and in supplying and marketing electric power at wholesale to other electric utility companies, municipalities and other market participants. KPCo owns 1,060 MWs of generating capacity. KPCo uses its generation to serve its retail and other customers. As of December 31, 2019, KPCo had 500 employees. Among the principal industries served are petroleum and coal products manufacturing, chemical manufacturing, coal mining, oil and gas extraction and primary metals. KPCo is a member of PJM. KPCo is part of AEP’s Vertically Integrated Utilities segment.
KGPCo
Organized in Virginia in 1917, KGPCo provides electric service to approximately 48,000 retail customers in Kingsport and eight neighboring communities in northeastern Tennessee. KGPCo does not own any generating facilities and is a member of PJM. It purchases electric power from APCo for distribution to its customers. As of December 31, 2019, KGPCo had 54 employees. KGPCo is part of AEP’s Vertically Integrated Utilities segment.
OPCo
Organized in Ohio in 1907 and reincorporated in 1924, OPCo is engaged in the transmission and distribution of electric power to approximately 1,494,000 retail customers in Ohio. OPCo purchases energy and capacity at auction to serve generation service customers who have not switched to a competitive generation supplier. As of December 31, 2019, OPCo had 1,681 employees. Among the principal industries served by OPCo are primary metals, petroleum and coal products manufacturing, plastics and rubber products, chemical manufacturing, fabricated metal product manufacturing and data centers. OPCo is a member of PJM. OPCo is part of AEP’s Transmission and Distribution Utilities segment.
PSO
Organized in Oklahoma in 1913, PSO is engaged in the generation, transmission and distribution of electric power to approximately 559,000 retail customers in eastern and southwestern Oklahoma, and in supplying and marketing electric power at wholesale to other electric utility companies, municipalities, rural electric cooperatives and other market participants. PSO owns 3,833 MWs of generating capacity, which it uses to serve its retail and other customers. As of December 31, 2019, PSO had 1,097 employees. Among the principal industries served by PSO are paper manufacturing, oil and gas extraction, petroleum and coal products manufacturing, transportation equipment and pipeline transportation. PSO is a member of SPP. PSO is part of AEP’s Vertically Integrated Utilities segment.
SWEPCo
Organized in Delaware in 1912, SWEPCo is engaged in the generation, transmission and distribution of electric power to approximately 540,000 retail customers in northeastern and panhandle of Texas, northwestern Louisiana and western Arkansas and in supplying and marketing electric power at wholesale to other electric utility companies, municipalities, rural electric cooperatives and other market participants. SWEPCo owns 5,169 MWs of generating capacity, which it uses to serve its retail and other customers. As of December 31, 2019, SWEPCo had 1,469 employees. Among the principal industries served by SWEPCo are petroleum and coal products manufacturing, food manufacturing, paper manufacturing, oil and gas extraction and chemical manufacturing. The territory served by SWEPCo includes several military installations, colleges and universities. SWEPCo also owns and operates a lignite coal mining operation. SWEPCo is a member of SPP. SWEPCo is part of AEP’s Vertically Integrated Utilities segment.
WPCo
Organized in West Virginia in 1883 and reincorporated in 1911, WPCo provides electric service to approximately 42,000 retail customers in northern West Virginia and in supplying and marketing electric power at wholesale to other market participants. WPCo owns 780 MWs of generating capacity which it uses to serve its retail and other customers. Among the principal industries served by WPCo are coal mining, primary metals, pipeline transportation, chemical manufacturing and paper manufacturing. WPCo is a member of PJM. As of December 31, 2019, WPCo had 50 employees. WPCo is part of AEP’s Vertically Integrated Utilities segment.
Service Company Subsidiary
AEPSC is a service company subsidiary that provides accounting, administrative, information systems, engineering, financial, legal, maintenance and other services at cost to AEP subsidiaries. The executive officers of AEP and certain of the executive officers of its public utility subsidiaries are employees of AEPSC. As of December 31, 2019, AEPSC had 6,439 employees.
Company Website and Availability of SEC Filings
Our principal corporate website address is www.aep.com. Information on our website is not incorporated by reference herein and is not part of this Form 10-K. We make available free of charge through our website our Annual Report on Form 10-K, quarterly reports on Form 10-Q, current reports on Form 8-K and amendments to those reports filed or furnished pursuant to Section 13(a) or 15(d) of the Exchange Act as soon as reasonably practicable after such documents are electronically filed with, or furnished to, the SEC. The SEC maintains a website at www.sec.gov that contains reports, proxy and information statements and other information regarding AEP.
Public Utility Subsidiaries by Jurisdiction
The following table illustrates certain regulatory information with respect to the jurisdictions in which the public utility subsidiaries of AEP operate:
| Principal Jurisdiction | AEP Utility Subsidiaries Operating in that Jurisdiction | Authorized Return on Equity (a) | |||
| FERC | AEPTCo - PJM | 10.35% | |||
| AEPTCo - SPP | 10.50% | ||||
| Ohio | OPCo | 10.20% | (b) | ||
| West Virginia | APCo | 9.75% | |||
| WPCo | 9.75% | ||||
| Virginia | APCo | 9.42% | |||
| Indiana | I&M | 9.95% | |||
| Michigan | I&M | 9.86% | |||
| Texas | AEP Texas | 9.96% | |||
| SWEPCo | 9.60% | ||||
| Tennessee | KGPCo | 9.85% | |||
| Kentucky | KPCo | 9.70% | |||
| Louisiana | SWEPCo | 9.80% | |||
| Arkansas | SWEPCo | 9.45% | |||
| Oklahoma | PSO | 9.40% |
| (a) | Identifies the predominant authorized ROE and may not include other, less significant, permitted recovery. Actual ROE varies from authorized ROE. |
| (b) | Authorized ROE was approved in OPCo’s last distribution base case. The authorized ROE for riders with an approved equity return (e.g. Distribution Investment Rider) is 10.00%. See “Ohio Electric Security Plan Filings” section of Note 4 included in the 2019 Annual Report. |

| (a) | Pretax income does not include intercompany eliminations. |
CLASSES OF SERVICE
The principal classes of service from which AEP’s subsidiaries derive revenues and the amount of such revenues during the years ended December 31, 2019, 2018 and 2017 are as follows:
| Years Ended December 31, | ||||||||||||
| Description | 2019 | 2018 | 2017 | |||||||||
| (in millions) | ||||||||||||
| Vertically Integrated Utilities Segment | ||||||||||||
| Retail Revenues | ||||||||||||
| Residential Sales | $ | 3,641.2 | $ | 3,818.6 | $ | 3,399.8 | ||||||
| Commercial Sales | 2,151.1 | 2,223.7 | 2,124.4 | |||||||||
| Industrial Sales | 2,178.3 | 2,261.3 | 2,180.8 | |||||||||
| PJM Net Charges | (0.2 | ) | 0.4 | (1.1 | ) | |||||||
| Other Retail Sales | 179.4 | 186.8 | 181.7 | |||||||||
| Total Retail Revenues (a) | 8,149.8 | 8,490.8 | 7,885.6 | |||||||||
| Wholesale Revenues | ||||||||||||
| Off-system Sales | 814.5 | 888.0 | 907.4 | |||||||||
| Transmission | 200.7 | 263.7 | 202.2 | |||||||||
| Total Wholesale Revenues | 1,015.2 | 1,151.7 | 1,109.6 | |||||||||
| Other Electric Revenues | 93.8 | 93.7 | 106.1 | |||||||||
| Provision for Rate Refund | (44.7 | ) | (210.1 | ) | (46.4 | ) | ||||||
| Other Operating Revenues | 31.6 | 30.6 | 40.2 | |||||||||
| Sales to Affiliates | 121.4 | 88.8 | 96.9 | |||||||||
| Total Revenues Vertically Integrated Utilities Segment | $ | 9,367.1 | $ | 9,645.5 | $ | 9,192.0 | ||||||
| Transmission and Distribution Utilities Segment | ||||||||||||
| Retail Revenues | ||||||||||||
| Residential Sales | $ | 2,084.5 | $ | 2,213.6 | $ | 2,085.3 | ||||||
| Commercial Sales | 1,148.8 | 1,266.7 | 1,205.8 | |||||||||
| Industrial Sales | 426.5 | 517.2 | 489.2 | |||||||||
| Other Retail Sales | 43.7 | 43.1 | 43.1 | |||||||||
| Total Retail Revenues (a) | 3,703.5 | 4,040.6 | 3,823.4 | |||||||||
| Wholesale Revenues | ||||||||||||
| Off-system Sales | 93.0 | 119.3 | 100.5 | |||||||||
| Transmission | 437.7 | 394.7 | 359.6 | |||||||||
| Total Wholesale Revenues | 530.7 | 514.0 | 460.1 | |||||||||
| Other Electric Revenues | 58.6 | 54.5 | 48.4 | |||||||||
| Provision for Rate Refund | 12.5 | (69.2 | ) | (11.4 | ) | |||||||
| Other Operating Revenues | 13.7 | 12.4 | 8.4 | |||||||||
| Sales to Affiliates | 163.5 | 100.8 | 90.4 | |||||||||
| Total Revenues Transmission and Distribution Utilities Segment | $ | 4,482.5 | $ | 4,653.1 | $ | 4,419.3 | ||||||
| AEP Transmission Holdco Segment | ||||||||||||
| Transmission Revenues | $ | 265.1 | $ | 291.3 | $ | 204.3 | ||||||
| Other Electric Revenues | 0.3 | 0.3 | — | |||||||||
| Other Operating Revenues | 0.1 | 0.3 | 0.8 | |||||||||
| Sales to Affiliates | 812.9 | 555.5 | 588.3 | |||||||||
| Provision for Rate Refund | (5.2 | ) | (43.3 | ) | (26.7 | ) | ||||||
| Total Revenues AEP Transmission Holdco Segment | $ | 1,073.2 | $ | 804.1 | $ | 766.7 | ||||||
| Generation & Marketing Segment | ||||||||||||
| Generation Revenues | ||||||||||||
| Affiliated | $ | — | $ | — | $ | — | ||||||
| Nonaffiliated | 264.4 | 431.5 | 528.5 | |||||||||
| Renewable Generation | ||||||||||||
| Affiliated | — | — | — | |||||||||
| Nonaffiliated | 77.7 | 44.5 | 33.4 | |||||||||
| Retail, Trading and Marketing | ||||||||||||
| Affiliated | 135.7 | 122.2 | 103.7 | |||||||||
| Nonaffiliated | 1,379.8 | 1,342.1 | 1,209.5 | |||||||||
| Total Revenues Generation & Marketing Segment | $ | 1,857.6 | $ | 1,940.3 | $ | 1,875.1 |
AEP Texas
| Years Ended December 31, | ||||||||||||
| Description | 2019 | 2018 | 2017 | |||||||||
| (in millions) | ||||||||||||
| Retail Revenues | ||||||||||||
| Residential Sales | $ | 588.9 | $ | 594.6 | $ | 573.9 | ||||||
| Commercial Sales | 424.0 | 426.6 | 431.0 | |||||||||
| Industrial Sales | 133.3 | 131.0 | 121.9 | |||||||||
| Other Retail Sales | 30.8 | 30.1 | 30.0 | |||||||||
| Total Retail Revenues (a) | 1,177.0 | 1,182.3 | 1,156.8 | |||||||||
| Wholesale Revenues | ||||||||||||
| Transmission | 379.2 | 313.4 | 293.8 | |||||||||
| Other Electric Revenues | 24.4 | 21.9 | 20.8 | |||||||||
| Provision for Rate Refund | (34.7 | ) | (31.3 | ) | (1.1 | ) | ||||||
| Total Electric Transmission and Distribution Revenues | 1,545.9 | 1,486.3 | 1,470.3 | |||||||||
| Sales to Affiliates | 160.5 | 105.2 | 65.7 | |||||||||
| Other Revenues | 2.9 | 3.8 | 2.4 | |||||||||
| Total Revenues | $ | 1,709.3 | $ | 1,595.3 | $ | 1,538.4 |
AEPTCo
| Years Ended December 31, | ||||||||||||
| Description | 2019 | 2018 | 2017 | |||||||||
| (in millions) | ||||||||||||
| Transmission Revenues | $ | 217.2 | $ | 212.8 | $ | 167.9 | ||||||
| Other Electric Revenues | 0.3 | 0.3 | — | |||||||||
| Other Operating Revenues | 0.1 | 0.2 | 0.8 | |||||||||
| Sales to Affiliates | 806.7 | 598.9 | 580.5 | |||||||||
| Provision for Rate Refund | (2.9 | ) | (36.1 | ) | (26.0 | ) | ||||||
| Total Revenues | $ | 1,021.4 | $ | 776.1 | $ | 723.2 |
APCo
| Years Ended December 31, | ||||||||||||
| Description | 2019 | 2018 | 2017 | |||||||||
| (in millions) | ||||||||||||
| Retail Revenues | ||||||||||||
| Residential Sales | $ | 1,272.3 | $ | 1,372.1 | $ | 1,242.8 | ||||||
| Commercial Sales | 562.2 | 596.3 | 584.2 | |||||||||
| Industrial Sales | 594.5 | 620.7 | 640.8 | |||||||||
| PJM Net Charges | (0.2 | ) | (0.2 | ) | (0.4 | ) | ||||||
| Other Retail Sales | 75.6 | 79.5 | 78.0 | |||||||||
| Total Retail Revenues (a) | 2,504.4 | 2,668.4 | 2,545.4 | |||||||||
| Wholesale Revenues | ||||||||||||
| Off-system Sales | 124.9 | 116.4 | 126.8 | |||||||||
| Transmission | 57.0 | 56.3 | 57.1 | |||||||||
| Total Wholesale Revenues | 181.9 | 172.7 | 183.9 | |||||||||
| Other Electric Revenues | 32.3 | 31.1 | 33.4 | |||||||||
| Provision for Rate Refund | (10.4 | ) | (95.1 | ) | (13.7 | ) | ||||||
| Total Electric Generation, Transmission and Distribution Revenues | 2,708.2 | 2,777.1 | 2,749.0 | |||||||||
| Sales to Affiliates | 205.3 | 181.4 | 172.0 | |||||||||
| Other Revenues | 11.2 | 9.0 | 13.2 | |||||||||
| Total Revenues | $ | 2,924.7 | $ | 2,967.5 | $ | 2,934.2 |
I&M
| Years Ended December 31, | ||||||||||||
| Description | 2019 | 2018 | 2017 | |||||||||
| (in millions) | ||||||||||||
| Retail Revenues | ||||||||||||
| Residential Sales | $ | 730.9 | $ | 736.5 | $ | 620.9 | ||||||
| Commercial Sales | 494.9 | 489.3 | 438.8 | |||||||||
| Industrial Sales | 551.4 | 570.6 | 522.0 | |||||||||
| PJM Net Charges | 0.1 | 0.2 | (1.0 | ) | ||||||||
| Other Retail Sales | 7.3 | 7.2 | 7.1 | |||||||||
| Total Retail Revenues (a) | 1,784.6 | 1,803.8 | 1,587.8 | |||||||||
| Wholesale Revenues | ||||||||||||
| Off-system Sales | 406.4 | 459.3 | 431.2 | |||||||||
| Transmission | 19.3 | 18.4 | 17.2 | |||||||||
| Total Wholesale Revenues | 425.7 | 477.7 | 448.4 | |||||||||
| Other Electric Revenues | 14.4 | 15.7 | 13.5 | |||||||||
| Provision for Rate Refund | (2.6 | ) | (24.6 | ) | (7.2 | ) | ||||||
| Total Electric Generation, Transmission and Distribution Revenues | 2,222.1 | 2,272.6 | 2,042.5 | |||||||||
| Sales to Affiliates | 73.9 | 85.5 | 64.4 | |||||||||
| Other Revenues | 10.7 | 12.6 | 14.3 | |||||||||
| Total Revenues | $ | 2,306.7 | $ | 2,370.7 | $ | 2,121.2 |
OPCo
| Years Ended December 31, | ||||||||||||
| Description | 2019 | 2018 | 2017 | |||||||||
| (in millions) | ||||||||||||
| Retail Revenues | ||||||||||||
| Residential Sales | $ | 1,495.6 | $ | 1,619.0 | $ | 1,511.3 | ||||||
| Commercial Sales | 724.9 | 840.1 | 774.8 | |||||||||
| Industrial Sales | 293.2 | 386.2 | 367.2 | |||||||||
| Other Retail Sales | 12.9 | 13.0 | 13.2 | |||||||||
| Total Retail Revenues (a) | 2,526.6 | 2,858.3 | 2,666.5 | |||||||||
| Wholesale Revenues | ||||||||||||
| Off-system Sales | 93.0 | 119.3 | 100.5 | |||||||||
| Transmission | 58.5 | 61.4 | 65.8 | |||||||||
| Total Wholesale Revenues | 151.5 | 180.7 | 166.3 | |||||||||
| Other Electric Revenues | 34.2 | 32.7 | 31.0 | |||||||||
| Provision for Rate Refund | 47.2 | (37.9 | ) | (10.3 | ) | |||||||
| Total Electricity, Transmission and Distribution Revenues | 2,759.5 | 3,033.8 | 2,853.5 | |||||||||
| Sales to Affiliates | 27.3 | 21.0 | 24.4 | |||||||||
| Other Revenues | 10.8 | 8.6 | 6.0 | |||||||||
| Total Revenues | $ | 2,797.6 | $ | 3,063.4 | $ | 2,883.9 |
PSO
| Years Ended December 31, | ||||||||||||
| Description | 2019 | 2018 | 2017 | |||||||||
| (in millions) | ||||||||||||
| Retail Revenues | ||||||||||||
| Residential Sales | $ | 636.1 | $ | 668.5 | $ | 601.4 | ||||||
| Commercial Sales | 377.3 | 401.1 | 387.7 | |||||||||
| Industrial Sales | 296.5 | 308.5 | 284.0 | |||||||||
| Other Retail Sales | 80.7 | 84.5 | 81.1 | |||||||||
| Total Retail Revenues (a) | 1,390.6 | 1,462.6 | 1,354.2 | |||||||||
| Wholesale Revenues | ||||||||||||
| Off-system Sales | 39.5 | 36.3 | 13.9 | |||||||||
| Transmission | 31.9 | 47.4 | 42.3 | |||||||||
| Total Wholesale Revenues | 71.4 | 83.7 | 56.2 | |||||||||
| Other Electric Revenues | 9.6 | 10.3 | 8.5 | |||||||||
| Provision for Rate Refund | (2.0 | ) | (19.0 | ) | (1.4 | ) | ||||||
| Total Electric Generation, Transmission and Distribution Revenues | 1,469.6 | 1,537.6 | 1,417.5 | |||||||||
| Sales to Affiliates | 6.1 | 5.4 | 4.3 | |||||||||
| Other Revenues | 6.1 | 4.3 | 5.4 | |||||||||
| Total Revenues | $ | 1,481.8 | $ | 1,547.3 | $ | 1,427.2 |
SWEPCo
| Years Ended December 31, | ||||||||||||
| Description | 2019 | 2018 | 2017 | |||||||||
| (in millions) | ||||||||||||
| Retail Revenues | ||||||||||||
| Residential Sales | $ | 645.3 | $ | 666.0 | $ | 597.0 | ||||||
| Commercial Sales | 490.6 | 502.6 | 487.0 | |||||||||
| Industrial Sales | 342.3 | 346.2 | 336.9 | |||||||||
| Other Retail Sales | 9.1 | 8.9 | 8.8 | |||||||||
| Total Retail Revenues (a) | 1,487.3 | 1,523.7 | 1,429.7 | |||||||||
| Wholesale Revenues | ||||||||||||
| Off-system Sales | 194.7 | 216.8 | 251.3 | |||||||||
| Transmission | 72.6 | 94.2 | 71.7 | |||||||||
| Total Wholesale Revenues | 267.3 | 311.0 | 323.0 | |||||||||
| Other Electric Revenues | 20.6 | 20.9 | 20.4 | |||||||||
| Provision for Rate Refund | (30.6 | ) | (63.7 | ) | (21.0 | ) | ||||||
| Total Electric Generation, Transmission and Distribution Revenues | 1,744.6 | 1,791.9 | 1,752.1 | |||||||||
| Sales to Affiliates | 4.9 | 28.4 | 25.9 | |||||||||
| Other Revenues | 1.4 | 1.6 | 1.9 | |||||||||
| Total Revenues | $ | 1,750.9 | $ | 1,821.9 | $ | 1,779.9 |
| (a) | 2018 and 2017 amounts have been revised to reflect the reclassification of certain customer accounts between Retail classes. This reclassification did not impact previously reported Total Retail Revenues. Management concluded that these prior period disclosure only errors were immaterial individually and in the aggregate. |
FINANCING
General
Companies within the AEP System generally use short-term debt to finance working capital needs. Short-term debt may also be used to finance acquisitions, construction and redemption or repurchase of outstanding securities until such needs can be financed with long-term debt. In recent history, short-term funding needs have been provided for by cash on hand and AEP’s commercial paper program. Funds are made available to subsidiaries under the AEP corporate borrowing program. Certain public utility subsidiaries of AEP also sell accounts receivable to provide liquidity. See “Financial Condition” section of Management’s Discussion and Analysis of Financial Condition and Results of Operations included in the 2019 Annual Report for additional information.
AEP’s revolving credit agreement (which backstops the commercial paper program) includes covenants and events of default typical for this type of facility, including a maximum debt/capital test. In addition, the acceleration of AEP’s payment obligations, or the obligations of certain of its major subsidiaries, prior to maturity under any other agreement or instrument relating to debt outstanding in excess of $50 million, would cause an event of default under the credit agreement. As of December 31, 2019, AEP was in compliance with its debt covenants. With the exception of a voluntary bankruptcy or insolvency, any event of default has either or both a cure period or notice requirement before termination of the agreement. A voluntary bankruptcy or insolvency of AEP or one of its significant subsidiaries would be considered an immediate termination event. See “Financial Condition” section of Management’s Discussion and Analysis of Financial Condition and Results of Operations included in the 2019 Annual Report for additional information.
AEP’s subsidiaries have also utilized, and expect to continue to utilize, additional financing arrangements, such as securitization financings and leasing arrangements, including the leasing of coal transportation equipment and facilities.
ENVIRONMENTAL AND OTHER MATTERS
General
AEP subsidiaries are currently subject to regulation by federal, state and local authorities with regard to air and water-quality control and other environmental matters, and are subject to zoning and other regulation by local authorities. The environmental issues that management believes are potentially material to the AEP System are outlined below.
Clean Water Act Requirements
Operations for AEP subsidiaries are subject to the Federal Clean Water Act, which prohibits the discharge of pollutants into waters of the United States except pursuant to appropriate permits and regulates systems that withdraw surface water for use in power plants. In 2014, the Federal EPA issued a final rule setting forth standards for water withdrawals at existing power plants that is intended to reduce mortality of aquatic organisms pinned against a plant’s cooling water intake screen (impingement) or entrained in the cooling water. The standards affect all plants withdrawing more than two million gallons of cooling water per day. Compliance with this standard is required within eight years of the effective date of the final rule.
In November 2015, the Federal EPA issued a final rule revising effluent limitation guidelines for electricity generating facilities. The rule establishes limits on Flue Gas Desulfurization wastewater, fly ash and bottom ash transport water and flue gas mercury control wastewater to be imposed as soon as possible after November 2018 and no later than December 2023. In January 2020, the Federal EPA issued a final rule revising the scope of the “waters of the United States” subject to Clean Water Act regulation. See “Environmental Issues - Clean Water Act Regulations” section of Management’s Discussion and Analysis of Financial Condition and Results of Operations included in the 2019 Annual Report for additional information.
Coal Ash Regulation
AEP’s operations produce a number of different coal combustion by-products, including fly ash, bottom ash, gypsum and other materials. A Federal EPA rule regulates the disposal and beneficial re-use of coal combustion residuals, including fly ash and bottom ash generated at coal-fired electric generating units. The rule requires certain standards for location, groundwater monitoring and dam stability to be met at landfills and certain surface impoundments at operating facilities. If existing disposal facilities cannot meet these standards, they will be required to close. See “Environmental Issues - Coal Combustion Residual Rule” section of Management’s Discussion and Analysis of Financial Condition and Results of Operations included in the 2019 Annual Report for additional information.
Clean Air Act Requirements
The CAA establishes a comprehensive program to protect and improve the nation’s air quality and control mobile and stationary sources of air emissions. The major CAA programs affecting AEP’s power plants are described below. The states implement and administer many of these programs and could impose additional or more stringent requirements.
The Acid Rain Program
The CAA includes a cap-and-trade emission reduction program for SO2 emissions from power plants and requirements for power plants to reduce NOx emissions through the use of available combustion controls, collectively called the Acid Rain Program. AEP continues to meet its obligations under the Acid Rain Program through the installation of controls, use of alternate fuels and participation in the emissions allowance markets.
National Ambient Air Quality Standards (NAAQS)
The CAA requires the Federal EPA to review the available scientific data for criteria pollutants periodically and establish a concentration level in the ambient air for those substances that is adequate to protect the public health and welfare with an extra safety margin. The Federal EPA also can list additional pollutants and develop concentration levels for them. These concentration levels are known as NAAQS.
Each state identifies the areas within its boundaries that meet the NAAQS (attainment areas) and those that do not (non-attainment areas). Each state must develop a SIP to bring non-attainment areas into compliance with the NAAQS and maintain good air quality in attainment areas. All SIPs are submitted to the Federal EPA for approval. If a state fails to develop adequate plans, the Federal EPA develops and implements a plan. As the Federal EPA reviews the NAAQS and establishes new concentration levels, the attainment status of areas can change and states may be required to develop new SIPs. See “Environmental Issues - Clean Air Act Requirements” section of Management’s Discussion and Analysis of Financial Condition and Results of Operations included in the 2019 Annual Report for additional information.
Hazardous Air Pollutants (HAP)
The CAA also requires the Federal EPA to investigate HAP emissions from the electric utility sector and submit a report to Congress to determine whether those emissions should be regulated. In 2011, the Federal EPA issued a rule setting Maximum Achievable Control Technology standards for new and existing coal and oil-fired utility units and New Source Performance Standards for emissions from new and modified power plants. In 2014, the U.S. Supreme Court determined that the Federal EPA acted unreasonably in refusing to consider costs in determining if it was appropriate and necessary to regulate HAP emissions from electric generating units. The Federal EPA has engaged in additional rulemaking activity but the 2011 rule remains in effect. See “Environmental Issues - Hazardous Air Pollutants” section of Management’s Discussion and Analysis of Financial Condition and Results of Operations included in the 2019 Annual Report for additional information.
Regional Haze
The CAA establishes visibility goals for certain federally designated areas, including national parks, and requires states to submit SIPs that will demonstrate reasonable progress toward preventing impairment of visibility in these protected areas. In 2005, the Federal EPA issued its Clean Air Visibility Rule, detailing how the CAA’s best available retrofit technology requirements will be applied to facilities built between 1962 and 1977 that emit more than 250 tons per year of certain pollutants in specific industrial categories, including power plants.
PSO executed a settlement with the Federal EPA and the State of Oklahoma to comply with Regional Haze program requirements in Oklahoma, and the settlement is now codified in the Oklahoma SIP and approved by the Federal EPA. The Federal EPA disapproved portions of the Arkansas and Texas SIPs, and finalized FIPs for both states. Arkansas submitted and received approval of a revised SIP, and EPA developed a revised FIP for Texas. See “Environmental Issues - Clean Air Act Requirements” section of Management’s Discussion and Analysis of Financial Condition and Results of Operations included in the 2019 Annual Report for additional information.
Climate Change
AEP has taken action to reduce and offset CO2 emissions from its generating fleet and expects CO2 emissions from its operations to continue to decline due to the retirement of some of its coal-fired generation units, and actions taken to diversify the generation fleet and increase energy efficiency where there is regulatory support for such activities. In 2019, AEP announced revised intermediate and long-term CO2 emission reduction goals, based on the output of the company’s integrated resource plans, which take into account economics, customer demand, regulations, grid reliability and resiliency, and reflect the company’s current business strategy. The intermediate goal is a 70% reduction from 2000 CO2 emission levels from AEP generating facilities by 2030; the long-term goal is an 80% or more reduction of CO2 emissions from AEP generating facilities from 2000 levels by 2050. AEP’s total estimated CO2 emissions in 2019 were approximately 58 million metric tons, a 65% reduction from AEP’s 2000 CO2 emissions.
The Federal EPA has taken action to regulate CO2 emissions from new and existing fossil fueled electric generating units under the existing provisions of the CAA. The Clean Power Plan was adopted in October 2015 but the U.S. Supreme Court issued a stay of its implementation, including all of the deadlines for submission of initial or final state plans. The Federal EPA issued a proposal in 2017 to repeal the Clean Power Plan and finalized the repeal in 2019. In 2018 the Federal EPA issued a proposal to revise the standards for new and modified sources. In 2019, the Federal EPA finalized new guidelines for states to use to develop CO2 performance standards for coal–fired generating units. See “Environmental Issues - Climate Change, CO2 Regulation and Energy Policy” section of Management’s Discussion and Analysis of Financial Condition and Results of Operations included in the 2019 Annual Report for additional information.
Management expects emissions to continue to decline over time as AEP diversifies generating sources and operates fewer coal units. The projected decline in coal-fired generation is due to a number of factors, including the ongoing cost of operating older units, the relative cost of coal and natural gas as fuel sources, increasing environmental regulations requiring significant capital investments and changing commodity market fundamentals.
Transforming AEP’s Generation Fleet
The electric utility industry is in the midst of an historic transformation, driven by changing customer needs, policy demands, demographics, competitive offerings, technologies and commodity prices. AEP is also transforming to be more agile and customer-focused as a valued provider of energy solutions. AEP’s long-term commitment to reduce CO2 emissions reflects the current direction of the company’s resource plans to meet those needs. AEP’s exposure to carbon regulation has been greatly reduced over the last several years. From 2000 to 2019, AEP’s CO2 emissions declined 65%. In 2019, coal represented 45% of AEP’s generating capacity, compared with 70% in 2005. Management expects the percentage of AEP’s generating resources fueled by coal will continue to decline. Transforming AEP’s generation portfolio to include, where there is regulatory support, more renewable energy and focusing on the efficient use of energy, demand response, distributed resources and technology solutions to more efficiently manage the grid over time is part of this strategy.
The graph below summarizes AEP’s generation capacity by resource type for the years 1999, 2005 and 2019:
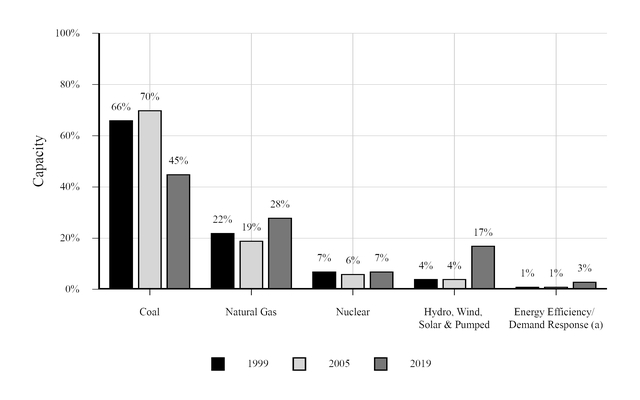
| (a) | Energy Efficiency/Demand Response represents avoided capacity rather than physical assets. |
Renewable Sources of Energy
The states AEP serves, other than Kentucky, West Virginia and Tennessee, have established mandatory or voluntary programs to increase the use of energy efficiency, alternative energy or renewable energy sources.
As of December 31, 2019, AEP’s regulated utilities had long-term contracts for 2,750 MWs of wind, 80 MWs of hydro, and 10 MWs of solar power delivering renewable energy to the companies’ customers. In addition, I&M owns four solar projects that make up I&M’s 16 MW Clean Energy Solar Pilot Project. Management actively manages AEP’s compliance position and is on pace to meet the relevant requirements or benchmarks in each applicable jurisdiction.
In July 2019, PSO and SWEPCo submitted filings before their respective commissions for approval to acquire the North Central Wind Energy Facilities, comprised of three Oklahoma wind facilities totaling 1,485 MWs, on a fixed cost turn-key basis at completion. Subject to regulatory approval, PSO will own 45.5% and SWEPCo will own 54.5% of the project, which will cost approximately $2 billion. Two wind facilities, totaling 1,286 MWs, would qualify for 80% of the federal Production Tax Credits (PTCs) with year-end 2021 in-service dates. The third wind facility (199 MWs) would qualify for 100% of the PTCs with a year-end 2020 in-service date. The acquisition can be scaled, subject to commercial limitation, to align with individual state resource needs and approvals. In December 2019, PSO reached a joint stipulation and settlement agreement with the OCC, Oklahoma Attorney General’s office and customer groups. In January 2020, SWEPCo reached a joint settlement agreement with the APSC, Arkansas Attorney General’s office and Walmart, Inc. Hearings are scheduled for the first quarter of 2020. PSO and SWEPCo are seeking regulatory approvals by July 2020.
The growth of AEP’s renewable generation portfolio reflects the company’s strategy to diversify generation resources to provide clean energy options to customers that meet both their energy and capacity needs. In addition to gradually reducing AEP’s reliance on coal-fueled generating units, the growth of renewables and natural gas helps AEP to maintain a diversity of generation resources.
The integrated resource plans filed with state regulatory commissions by AEP’s regulated utility subsidiaries reflect AEP’s renewable strategy to balance reliability and cost with customers’ desire for clean energy in a carbon-constrained world. AEP has committed significant capital investments to modernize the electric grid and integrate these new resources. Transmission assets of the AEP System interconnect approximately 11,900 MWs of renewable energy resources. AEP’s transmission development initiatives are designed to facilitate the interconnection of additional renewable energy resources.
AEP Energy Supply, LLC is a holding company with several divisions, including AEP Renewables and AEP OnSite Partners.
AEP Renewables develops, owns and operates utility scale renewable projects backed with long-term contracts with creditworthy counterparties throughout the United States. AEP Renewables works directly with stakeholders to ensure that customers have clean, sustainable renewable energy to meet their environmental goals. As of December 31, 2019, AEP Renewables owned projects operating in 11 states, including approximately 1,212 MWs of installed wind capacity and 90 MWs of installed solar capacity. These figures include the 2019 addition of 724 MWs of wind generation and battery assets located in several states acquired from Sempra Renewables LLC and the 75% interest, or 227 MWs, of Santa Rita East wind generation located in west Texas. In October 2019, AEP Renewables entered into an agreement to construct Flat Ridge 3, a wind farm in Kansas. The 128 MW facility is expected to reach commercial operation before the end of 2020.
AEP OnSite Partners works directly with wholesale and large retail customers to provide tailored solutions to reduce their energy costs based upon market knowledge, innovative applications of technology and deal structuring capabilities. AEP OnSite Partners targets opportunities in distributed solar, combined heat and power, energy storage, waste heat recovery, energy efficiency, peaking generation and other energy solutions that create value for customers. AEP OnSite Partners pursues and develops behind the meter projects with creditworthy customers. As of December 31, 2019, AEP OnSite Partners owned projects located in 17 states, including approximately 119 MWs of installed solar capacity, and approximately 28 MWs of solar projects under construction.
Competitive Renewable Generation Facilities
| Size of Energy Resource | AEP Energy Supply, LLC Division | Renewable Energy Resource | Location | In-Service or Under Construction | ||||
| 1,212 MW | AEP Renewables | Wind | Eight states (a) | In-service | ||||
| 128 MW | AEP Renewables | Wind | Kansas | Under Construction | ||||
| 20 MW | AEP Renewables | Solar | California | In-service | ||||
| 20 MW | AEP Renewables | Solar | Utah | In-service | ||||
| 50 MW | AEP Renewables | Solar | Nevada | In-service | ||||
| 119 MW | AEP OnSite Partners | Solar | Fifteen states (b) | In-service | ||||
| 28 MW | AEP OnSite Partners | Solar | Three states (c) | Under Construction |
| (a) | Colorado, Hawaii, Indiana, Kansas, Michigan, Minnesota, Pennsylvania, and Texas. |
| (b) | California, Colorado, Florida, Hawaii, Iowa, Minnesota, Nebraska, New Hampshire, New Jersey, New Mexico, New York, Ohio, Rhode Island, Texas and Vermont. |
| (c) | Illinois, New Mexico and Ohio. |
End Use Energy Efficiency
AEP has reduced energy consumption and peak demand through the introduction of additional energy efficiency and demand response programs. These programs, commonly referred to as demand side management, were implemented in jurisdictions where appropriate cost recovery was available. AEP’s operating companies’ programs have reduced annual consumption by over 9 million MWhs and peak demand by approximately 2,806 MWs since 2008. AEP estimates that its operating companies spent approximately $1.5 billion during that period to achieve these levels.
Energy efficiency and demand reduction programs have received regulatory support in most of the states AEP serves. Appropriate cost recovery will be essential for AEP operating companies to continue and expand these consumer offerings. Appropriate recovery of program costs, lost revenues and an opportunity to earn a reasonable return ensures that energy efficiency programs are considered equally with supply side investments. As AEP continues to transition to a cleaner, more efficient energy future, energy efficiency and demand response programs will continue to play an important role in how the company serves its customers. AEP believes its experience providing robust energy efficiency programs in several states positions the company to be a cost-effective provider of these programs as states develop their implementation plans.
Corporate Governance
In response to environmental issues and in connection with its assessment of AEP’s strategic plan, the Board of Directors continually reviews the risks posed by new environmental rules and requirements that could accelerate the retirement of coal-fired generation assets. The Board of Directors is informed of any new environmental regulations and proposed regulation or legislation that would significantly affect AEP. The Board’s Committee on Directors and Corporate Governance oversees AEP’s annual Corporate Accountability Report, which includes information about AEP’s environmental, social, governance and financial performance. AEP set CO2 emission reduction goals in 2018 after considering input from corporate governance outreach effort with shareholders.
In September 2019, AEP announced new intermediate and long-term CO2 emission reduction goals, based on the output of the company’s integrated resource plans, which take into account economics, customer demand, grid reliability and resiliency, regulations and the company’s current business strategy. The intermediate goal is a 70% reduction from 2000 CO2 emission levels from AEP generating facilities by 2030; the long-term goal is to surpass an 80% reduction of CO2 emissions from AEP generating facilities from 2000 levels by 2050. AEP has made significant progress in reducing CO2 emissions from its power generation fleet and expects its emissions to continue to decline. AEP’s aspirational emissions goal is zero CO2 emissions by 2050. Technological advances, including energy storage, will determine how quickly AEP can achieve zero emissions while continuing to provide reliable, affordable power for customers.
Other Environmental Issues and Matters
The Comprehensive Environmental Response, Compensation and Liability Act of 1980 imposes costs for environmental remediation upon owners and previous owners of sites, as well as transporters and generators of hazardous material disposed of at such sites. See “The Comprehensive Environmental Response Compensation and Liability Act (Superfund) and State Remediation” section of Note 6 included in the 2019 Annual Report for additional information.
Environmental Investments
Investments related to improving AEP System plants’ environmental performance and compliance with air and water quality standards during 2017, 2018 and 2019 and the current estimate for 2020 are shown below. These investments include both environmental as well as other related spending. Estimated construction expenditures are subject to periodic review and modification and may vary based on the ongoing effects of regulatory constraints, environmental regulations, business opportunities, market volatility, economic trends and the ability to access capital. In addition to the amounts set forth below, AEP expects to make substantial investments in future years in connection with the modification and addition at generation plants’ facilities for environmental quality controls. Such future investments are needed in order to comply with air and water quality standards that have been adopted and have deadlines for compliance after 2019 or have been proposed and may be adopted. Future investments could be significantly greater if emissions reduction requirements are accelerated or otherwise become more stringent. The cost of complying with applicable environmental laws, regulations and rules is expected to be material to the AEP System. AEP typically recovers costs of complying with environmental standards from customers through rates in regulated jurisdictions. Failure to recover these costs could reduce future net income and cash flows and possibly harm AEP’s financial condition. See “Environmental Issues” section of Management’s Discussion and Analysis of Financial Condition and Results of Operations and Note 6 - Commitments, Guarantees and Contingencies included in the 2019 Annual Report for additional information.
| Historical and Projected Environmental Investments | ||||||||||||||||
| 2017 | 2018 | 2019 | 2020 | |||||||||||||
| Actual | Actual | Actual | Estimate (b) | |||||||||||||
| (in millions) | ||||||||||||||||
| AEP (a) | $ | 135.9 | $ | 115.6 | $ | 167.2 | $ | 176.1 | ||||||||
| APCo | 25.6 | 20.4 | 23.8 | 37.3 | ||||||||||||
| I&M | 41.9 | 31.1 | 56.4 | 33.4 | ||||||||||||
| PSO | 0.6 | — | — | 6.0 | ||||||||||||
| SWEPCo | 11.7 | 14.1 | 10.5 | 40.1 |
| (a) | Includes expenditures of the subsidiaries shown and other subsidiaries not shown. The figures reflect construction expenditures, not investments in subsidiary companies. |
| (b) | Estimated amounts are exclusive of debt AFUDC. |
Management continues to refine the cost estimates of complying with air and water quality standards and other impacts of the environmental proposals. The following cost estimates for the years 2020 through 2026 will change depending on the timing of implementation and whether the Federal EPA provides flexibility in the final rules. These cost estimates will also change based on: (a) the states’ implementation of these regulatory programs, including the potential for SIPs or FIPs that impose more stringent standards, (b) additional rulemaking activities in response to court decisions, (c) the actual performance of the pollution control technologies installed on the units, (d) changes in costs for new pollution controls, (e) new generating technology developments, (f) total MWs of capacity retired, replaced or sold, including the type and amount of such replacement capacity and (g) other factors. Management’s current ranges of estimates of new major environmental investments beginning in 2020, exclusive of debt AFUDC, are set forth below:
| Projected (2020 - 2026) Environmental Investment | ||||||||
| Company | Low | High | ||||||
| (in millions) | ||||||||
| AEP | $ | 500 | $ | 1,000 | ||||
| APCo | 125 | 230 | ||||||
| I&M | 45 | 85 | ||||||
| PSO | 20 | 30 | ||||||
| SWEPCo | 150 | 305 |
BUSINESS SEGMENTS
AEP’s Reportable Segments
AEP’s primary business is the generation, transmission and distribution of electricity. Within its Vertically Integrated Utilities segment, AEP centrally dispatches generation assets and manages its overall utility operations on an integrated basis because of the substantial impact of cost-based rates and regulatory oversight. Intersegment sales and transfers are generally based on underlying contractual arrangements and agreements. AEP’s reportable segments are as follows:
| • | Vertically Integrated Utilities |
| • | Transmission and Distribution Utilities |
| • | AEP Transmission Holdco |
| • | Generation & Marketing |
The remainder of AEP’s activities is presented as Corporate and Other, which is not considered a reportable segment. See Note 9 - Business Segments included in the 2019 Annual Report for additional information on AEP’s segments.
VERTICALLY INTEGRATED UTILITIES
GENERAL
AEP’s vertically integrated utility operations are engaged in the generation, transmission and distribution of electricity for sale to retail and wholesale customers through assets owned and operated by AEGCo, APCo, I&M, KGPCo, KPCo, PSO, SWEPCo and WPCo. AEPSC, as agent for AEP’s public utility subsidiaries, performs marketing, generation dispatch, fuel procurement and power-related risk management and trading activities on behalf of each of these subsidiaries.
ELECTRIC GENERATION
Facilities
As of December 31, 2019, AEP’s vertically integrated public utility subsidiaries owned or leased approximately 22,000 MWs of domestic generation. See Item 2 – Properties for more information regarding the generation capacity of vertically integrated public utility subsidiaries.
Fuel Supply
The following table shows the owned and leased generation sources by type (including wind purchase agreements), on an actual net generation (MWhs) basis, used by the Vertically Integrated Utilities:
| 2019 | 2018 | 2017 | |||
| Coal and Lignite | 54% | 58% | 61% | ||
| Nuclear | 19% | 18% | 18% | ||
| Natural Gas | 16% | 14% | 11% | ||
| Renewables | 11% | 10% | 10% |
A price increase/decrease in one or more fuel sources relative to other fuels, as well as the addition of renewable resources, may result in the decreased/increased use of other fuels. AEP’s overall 2019 fossil fuel costs for the Vertically Integrated Utilities increased 2.4% on a dollar per MMBtu basis from 2018.
Coal and Lignite
AEP’s Vertically Integrated Utilities procure coal and lignite under a combination of purchasing arrangements including long-term contracts, affiliate operations and spot agreements with various producers, marketers and coal trading firms. Coal consumption in 2019 decreased approximately 18% from 2018 mainly due to lower dispatching of coal generation from weaker power market prices.
Management believes that the Vertically Integrated Utilities will be able to secure and transport coal and lignite of adequate quality and in adequate quantities to operate their coal and lignite-fired units. Through subsidiaries, AEP owns, leases or controls more than 4,004 railcars, 468 barges, 8 towboats and a coal handling terminal with approximately 18 million tons of annual capacity to move and store coal for use in AEP generating facilities.
Spot market prices for coal started to weaken in the second half of 2019. The decreased spot coal prices reflect lower demand for domestic and export coal. AEP’s strategy for purchasing coal includes layering in supplies over time. The price impact of this process is reflected in subsequent periods and can occasionally cause current spot market prices to be trending opposite to the price of coal delivered. The price paid for coal delivered in 2019 increased approximately 6% from 2018.
The following table shows the amount of coal and lignite delivered to the Vertically Integrated Utilities’ plants during the past three years and the average delivered price of coal purchased by the Vertically Integrated Utilities:
| 2019 | 2018 | 2017 | |||||||||
| Total coal delivered to the plants (millions of tons) | 30.4 | 29.0 | 29.3 | ||||||||
| Average cost per ton of coal delivered | $ | 45.85 | $ | 43.21 | $ | 44.24 |
The coal supplies at the Vertically Integrated Utilities plants vary from time to time depending on various factors, including, but not limited to, demand for electric power, unit outages, transportation infrastructure limitations, space limitations, plant coal consumption rates, availability of acceptable coals, labor issues and weather conditions, which may interrupt production or deliveries. As of December 31, 2019, the Vertically Integrated Utilities’ coal inventory was approximately 54 days of full load burn. While inventory targets vary by plant and are changed as necessary, the current coal inventory target for the Vertically Integrated Utilities is approximately 30 days of full load burn.
Natural Gas
The Vertically Integrated Utilities consumed approximately 117 billion cubic feet of natural gas during 2019 for generating power. This represents an increase of 5% from 2018. Total gas consumption for the Vertically Integrated Utilities was higher year over year primarily due to lower natural gas prices. Several of AEP’s natural gas-fired power plants are connected to at least two pipelines which allow greater access to competitive supplies and improve delivery reliability. A portfolio of term, monthly, seasonal and daily supply and transportation agreements provide natural gas
requirements for each plant, as appropriate. AEP’s natural gas supply agreements are entered into on a competitive basis and based on market prices.
The following table shows the amount of natural gas delivered to the Vertically Integrated Utilities’ plants during the past three years and the average delivered price of natural gas purchased by the Vertically Integrated Utilities.
| 2019 | 2018 | 2017 | |||||||||
| Total natural gas delivered to the plants (billion of cubic feet) | 117.0 | 111.6 | 86.3 | ||||||||
| Average price per MMBtu of purchased natural gas | $ | 2.64 | $ | 3.26 | $ | 3.37 |
Nuclear
I&M has made commitments to meet the current nuclear fuel requirements of the Cook Plant. I&M has made and will make purchases of uranium in various forms in the spot, short-term and mid-term markets. I&M also continues to finance its nuclear fuel through leasing.
For purposes of the storage of high-level radioactive waste in the form of SNF, I&M completed modifications to its SNF storage pool in the early 1990’s. I&M entered into an agreement to provide for onsite dry cask storage of SNF to permit normal operations to continue. I&M is scheduled to conduct further dry cask loading and storage projects on an ongoing periodic basis.
Nuclear Waste and Decommissioning
As the owner of the Cook Plant, I&M has a significant future financial commitment to dispose of SNF and decommission and decontaminate the plant safely. The cost to decommission a nuclear plant is affected by NRC regulations and the SNF disposal program. The most recent decommissioning cost study was completed in 2018. The estimated cost of decommissioning and disposal of low-level radioactive waste for the Cook Plant was $2 billion in 2018 non-discounted dollars, with additional ongoing estimated costs of $6 million per year for post decommissioning storage of SNF and an eventual estimated cost of $37 million for the subsequent decommissioning of the spent fuel storage facility, also in 2018 non-discounted dollars. As of December 31, 2019 and 2018, the total decommissioning trust fund balance for the Cook Plant was approximately $2.7 billion and $2.2 billion, respectively. The balance of funds available to eventually decommission Cook Plant will differ based on contributions and investment returns. The ultimate cost of retiring the Cook Plant may be materially different from estimates and funding targets as a result of the:
| • | Escalation of various cost elements (including, but not limited to, general inflation and the cost of energy). |
| • | Further development of regulatory requirements governing decommissioning. |
| • | Technology available at the time of decommissioning differing significantly from that assumed in studies. |
| • | Availability of nuclear waste disposal facilities. |
| • | Availability of a United States Department of Energy facility for permanent storage of SNF. |
Accordingly, management is unable to provide assurance that the ultimate cost of decommissioning the Cook Plant will not be significantly different than current projections. AEP will seek recovery from customers through regulated rates if actual decommissioning costs exceed projections. See the “Nuclear Contingencies” section of Note 6 - Commitments, Guarantees and Contingencies included in the 2019 Annual Report for information with respect to nuclear waste and decommissioning.
Low-Level Radioactive Waste
The Low-Level Waste Policy Act of 1980 mandates that the responsibility for the disposal of low-level radioactive waste rests with the individual states. Low-level radioactive waste consists largely of ordinary refuse and other items that have come in contact with radioactive materials. Michigan does not currently have a disposal site for such waste available. I&M cannot predict when such a site may be available. However, the states of Utah and Texas have licensed low level radioactive waste disposal sites which currently accept low level radioactive waste from Michigan waste generators. There is currently no set date limiting I&M’s access to either of these facilities. The Cook Plant has a facility onsite designed specifically for the storage of low level radioactive waste. In the event that low level radioactive waste disposal facility access becomes unavailable, it can be stored onsite at this facility.
Counterparty Risk Management
The Vertically Integrated Utilities segment also sells power and enters into related energy transactions with wholesale customers and other market participants. As a result, counterparties and exchanges may require cash or cash related instruments to be deposited on transactions as margin against open positions. As of December 31, 2019, counterparties posted approximately $13 million in cash, cash equivalents or letters of credit with AEPSC for the benefit of AEP’s public utility subsidiaries (while, as of that date, AEP’s public utility subsidiaries posted approximately $24 million with counterparties and exchanges). Since open trading contracts are valued based on market prices of various commodities, exposures change daily. See the “Quantitative and Qualitative Disclosures About Market Risk” section of Management’s Discussion and Analysis of Financial Condition and Results of Operations included in the 2019 Annual Report for additional information.
Certain Power Agreements
I&M
The UPA between AEGCo and I&M, dated March 31, 1982, provides for the sale by AEGCo to I&M of all the capacity (and the energy associated therewith) available to AEGCo at the Rockport Plant. Whether or not power is available from AEGCo, I&M is obligated to pay a demand charge for the right to receive such power (and an energy charge for any associated energy taken by I&M). The agreement will continue in effect until the last of the lease terms of Unit 2 of the Rockport Plant have expired (currently December 2022) unless extended in specified circumstances.
Pursuant to an assignment between I&M and KPCo, and a UPA between AEGCo and KPCo, AEGCo sells KPCo 30% of the capacity (and the energy associated therewith) available to AEGCo from both units of the Rockport Plant. KPCo has agreed to pay to AEGCo the amounts that I&M would have paid AEGCo under the terms of the UPA between AEGCo and I&M for such entitlement. The KPCo UPA expires in December 2022.
OVEC
AEP and several nonaffiliated utility companies jointly own OVEC. The aggregate equity participation of AEP in OVEC is 43.47%. Parent owns 39.17% and OPCo owns 4.3%. Under the Inter-Company Power Agreement (ICPA), which defines the rights of the owners and sets the power participation ratio of each, the sponsoring companies are entitled to receive and are obligated to pay for all OVEC capacity (approximately 2,400 MWs) in proportion to their respective power participation ratios. The aggregate power participation ratio of APCo, I&M and OPCo is 43.47%. The ICPA terminates in June 2040. The proceeds from charges by OVEC to sponsoring companies under the ICPA based on their prower participation ratios are designed to be sufficient for OVEC to meet its operating expenses and fixed costs. OVEC’s Board of Directors, as elected by AEP and the other owners, has authorized environmental investments related to their ownership interests, with resulting expenses (including for related debt and interest thereon) included in charges under the ICPA. OVEC financed capital expenditures totaling $1.3 billion in connection with flue gas desulfurization projects and the associated scrubber waste disposal landfills at its two generation plants through debt issuances, including tax-advantaged debt issuances. Both OVEC generation plants are operating with the new environmental controls in service. OPCo attempted to assign its rights and obligations under the ICPA to an affiliate
as part of its transfer of its generation assets and liabilities in keeping with corporate separation required by Ohio law. OPCo failed to obtain the consent to assignment from the other owners of OVEC and therefore filed a request with the PUCO seeking authorization to maintain its ownership of OVEC. In December 2013, the PUCO approved OPCo’s request, subject to the condition that energy from the OVEC entitlements are sold into the day-ahead or real-time PJM energy markets, or on a forward basis through a bilateral arrangement. In November 2016, the PUCO approved OPCo’s request to approve a cost-based purchased power agreement (PPA) rider, effective in January 2017, that would initially be based upon OPCo’s contractual entitlement under the ICPA which is approximately 20% of OVEC’s capacity. In January 2020, provisions enacted as part of Ohio Am. Sub. H.B. 6 went into effect that replace the PPA rider and enable OPCo to continue recovering the net cost associated with the ICPA, including any additional contractual entitlement received as a result of the FirstEnergy Solutions (FES) bankruptcy, through 2030.
In March 2018, FES, with an aggregate power participation ratio of approximately 5% under the ICPA, filed bankruptcy. In July 2018, the Bankruptcy Court granted FES’s motion to reject the ICPA. OVEC appealed this decision in the United States Court of Appeals for the Sixth Circuit and in December 2019 the Sixth Circuit remanded the rejection of the ICPA back to the Bankruptcy Court for further consideration based on reversing the Bankruptcy Court’s application of the business judgment standard in rejecting the ICPA. If OVEC does not have sufficient funds to honor its payment obligations, there is risk that APCo, I&M and/or OPCo may need to make payments in addition to their power participation ratio payments. Further, if OVEC’s indebtedness is accelerated for any reason, there is risk that APCo, I&M and/or OPCo may be required to pay some or all of such accelerated indebtedness in amounts equal to their aggregate power participation ratio of 43.47%. The foregoing and other related actions have adversely impacted the credit ratings of OVEC.
ELECTRIC DELIVERY
General
Other than AEGCo, AEP’s vertically integrated public utility subsidiaries own and operate transmission and distribution lines and other facilities to deliver electric power. See Item 2 – Properties for more information regarding the transmission and distribution lines. Most of the transmission and distribution services are sold to retail customers of AEP’s vertically integrated public utility subsidiaries in their service territories. These sales are made at rates approved by the state utility commissions of the states in which they operate, and in some instances, approved by the FERC. See Item 1. Business – Vertically Integrated Utilities – Regulation – Rates. The FERC regulates and approves the rates for both wholesale transmission transactions and wholesale generation contracts. The use and the recovery of costs associated with the transmission assets of the AEP vertically integrated public utility subsidiaries are subject to the rules, principles, protocols and agreements in place with PJM and SPP, and as approved by the FERC. See Item 1. Business – Vertically Integrated Utilities – Regulation – FERC. As discussed below, some transmission services also are separately sold to nonaffiliated companies.
Other than AEGCo, AEP’s vertically integrated public utility subsidiaries hold franchises or other rights to provide electric service in various municipalities and regions in their service areas. In some cases, these franchises provide the utility with the exclusive right to provide electric service within a specific territory. These franchises have varying provisions and expiration dates. In general, the operating companies consider their franchises to be adequate for the conduct of their business. For a discussion of competition in the sale of power, see Item 1. Business – Vertically Integrated Utilities – Competition.
Transmission Agreement (TA)
APCo, I&M, KGPCo, KPCo and WPCo own and operate transmission facilities that are used to provide transmission service under the PJM OATT and are parties to the TA. OPCo, which is a subsidiary in AEP’s Transmission and Distribution Utilities segment that provides transmission service under the PJM OATT, is also a party to the TA. The TA defines how the parties to the agreement share the revenues associated with their transmission facilities and the costs of transmission service provided by PJM. The TA has been approved by the FERC.
TCA and OATT
PSO, SWEPCo and AEPSC are parties to the TCA. Under the TCA, a coordinating committee is charged with the responsibility of (a) overseeing the coordinated planning of the transmission facilities of the parties to the agreement, including the performance of transmission planning studies, (b) the interaction of such subsidiaries with independent system operators and other regional bodies interested in transmission planning and (c) compliance with the terms of the OATT filed with the FERC and the rules of the FERC relating to such tariff. Pursuant to the TCA, AEPSC has responsibility for monitoring the reliability of their transmission systems and administering the OATT on behalf of the other parties to the agreement. The TCA also provides for the allocation among the parties of revenues collected for transmission and ancillary services provided under the OATT. These allocations have been determined by the FERC-approved OATT for the SPP.
Regional Transmission Organizations
AEGCo, APCo, I&M, KGPCo, KPCo and WPCo are members of PJM, and PSO and SWEPCo are members of SPP (both FERC-approved RTOs). RTOs operate, plan and control utility transmission assets in a manner designed to provide open access to such assets in a way that prevents discrimination between participants owning transmission assets and those that do not.
REGULATION
General
AEP’s vertically integrated public utility subsidiaries’ retail rates and certain other matters are subject to traditional cost-based regulation by the state utility commissions. AEP’s vertically integrated public utility subsidiaries are also subject to regulation by the FERC under the Federal Power Act with respect to wholesale power and transmission service transactions. I&M is subject to regulation by the NRC under the Atomic Energy Act of 1954, as amended, with respect to the operation of the Cook Plant. AEP and its vertically integrated public utility subsidiaries are also subject to the regulatory provisions of, much of the Energy Policy Act of 2005, which is administered by the FERC.
Rates
Historically, state utility commissions have established electric service rates on a cost-of-service basis, which is designed to allow a utility an opportunity to recover its cost of providing service and to earn a reasonable return on its investment used in providing that service. A utility’s cost of service generally reflects its operating expenses, including operation and maintenance expense, depreciation expense and taxes. State utility commissions periodically adjust rates pursuant to a review of (a) a utility’s adjusted revenues and expenses during a defined test period and (b) such utility’s level of investment. Absent a legal limitation, such as a law limiting the frequency of rate changes or capping rates for a period of time, a state utility commission can review and change rates on its own initiative. Some states may initiate reviews at the request of a utility, customer, governmental or other representative of a group of customers. Such parties may, however, agree with one another not to request reviews of or changes to rates for a specified period of time.
Public utilities have traditionally financed capital investments until the new asset is placed in service. Provided the asset was found to be a prudent investment, it was then added to rate base and entitled to a return through rate recovery. Given long lead times in construction, the high costs of plant and equipment and volatile capital markets, management actively pursues strategies to accelerate rate recognition of investments and cash flow. AEP representatives continue to engage state commissioners and legislators on alternative ratemaking options to reduce regulatory lag and enhance certainty in the process. These options include pre-approvals, a return on construction work in progress, rider/trackers, formula rates and the inclusion of future test-year projections into rates.
The rates of AEP’s vertically integrated public utility subsidiaries are generally based on the cost of providing traditional bundled electric service (i.e., generation, transmission and distribution service). Historically, the state regulatory frameworks in the service area of the AEP vertically integrated public utility subsidiaries reflected specified fuel costs
as part of bundled (or, more recently, unbundled) rates or incorporated fuel adjustment clauses in a utility’s rates and tariffs. Fuel adjustment clauses permit periodic adjustments to fuel cost recovery from customers and therefore provide protection against exposure to fuel cost changes.
The following state-by-state analysis summarizes the regulatory environment of certain major jurisdictions in which AEP’s vertically integrated public utility subsidiaries operate. Several public utility subsidiaries operate in more than one jurisdiction. See Note 4 - Rate Matters included in the 2019 Annual Report for more information regarding pending rate matters.
Indiana
I&M provides retail electric service in Indiana at bundled rates approved by the IURC, with rates set on a cost-of-service basis. Indiana provides for timely fuel and purchased power cost recovery through a fuel cost recovery mechanism.
Oklahoma
PSO provides retail electric service in Oklahoma at bundled rates approved by the OCC. PSO’s rates are set on a cost-of-service basis. Fuel and purchased energy costs are recovered or refunded by applying fuel adjustment and other factors to retail kilowatt-hour sales.
Virginia
APCo currently provides retail electric service in Virginia at unbundled generation and distribution rates approved by the Virginia SCC. Virginia generally allows for timely recovery of fuel costs through a fuel adjustment clause. In addition to base rates and fuel cost recovery, APCo is permitted to recover a variety of costs through rate adjustment clauses including transmission services provided at OATT rates based on rates established by the FERC.
West Virginia
APCo and WPCo provide retail electric service at bundled rates approved by the WVPSC, with rates set on a combined cost-of-service basis. West Virginia generally allows for timely recovery of fuel costs through an expanded net energy cost which trues-up to actual expenses.
FERC
The FERC regulates rates for interstate power sales at wholesale, transmission of electric power, accounting and other matters, including construction and operation of hydroelectric projects. The FERC regulations require AEP’s vertically integrated public utility subsidiaries to provide open access transmission service at FERC-approved rates, and AEP has approved cost-based formula transmission rates on file at the FERC. The FERC also regulates unbundled transmission service to retail customers. In addition, the FERC regulates the sale of power for resale in interstate commerce by (a) approving contracts for wholesale sales to municipal and cooperative utilities and (b) granting authority to public utilities to sell power at wholesale at market-based rates upon a showing that the seller lacks the ability to improperly influence market prices. AEP’s vertically integrated public utility subsidiaries have market-based rate authority from the FERC, under which much of their wholesale marketing activity takes place. The FERC requires each public utility that owns or controls interstate transmission facilities to, directly or through an RTO, to file an open access network and point-to-point transmission tariff that offers services comparable to the utility’s own uses of its transmission system. The FERC also requires all transmitting utilities, directly or through an RTO, to establish an Open Access Same-time Information System, which electronically posts transmission information such as available capacity and prices, and requires utilities to comply with Standards of Conduct that prohibit utilities’ transmission employees from providing non-public transmission information to the utility’s marketing employees. Additionally, the vertically integrated public utility subsidiaries are subject to reliability standards promulgated by the North American Electric Reliability Corporation, with the approval of the FERC.
The FERC oversees RTOs, entities created to operate, plan and control utility transmission assets. AEGCo, APCo, I&M, KGPCo, KPCo and WPCo are members of PJM. PSO and SWEPCo are members of SPP.
The FERC has jurisdiction over the issuances of securities of most of AEP’s public utility subsidiaries, the acquisition of securities of utilities, the acquisition or sale of certain utility assets and mergers with another electric utility or holding company. In addition, both the FERC and state regulators are permitted to review the books and records of any company within a holding company system.
COMPETITION
Other than AEGCo, AEP’s vertically integrated public utility subsidiaries generate, transmit and distribute electricity to retail customers of AEP’s vertically integrated public utility subsidiaries in their service territories. These sales are made at rates approved by the state utility commissions of the states in which they operate, and in some instances, approved by the FERC, and are not subject to competition from other vertically integrated public utilities. Other than AEGCo, AEP’s vertically integrated public utility subsidiaries hold franchises or other rights that effectively grant the exclusive ability to provide electric service in various municipalities and regions in their service areas.
AEP’s vertically integrated public utility subsidiaries compete with self-generation and with distributors of other energy sources, such as natural gas, fuel oil, renewables and coal, within their service areas. The primary factors in such competition are price, reliability of service and the capability of customers to utilize alternative sources of energy other than electric power. With respect to competing generators and self-generation, the public utility subsidiaries of AEP believe that they currently maintain a competitive position.
Changes in regulatory policies and advances in newer technologies for batteries or energy storage, fuel cells, microturbines, wind turbines and photovoltaic solar cells are reducing costs of new technology to levels that are making them competitive with some central station electricity production. The costs of photovoltaic solar cells in particular have continued to become increasingly competitive. The ability to maintain relatively low cost, efficient and reliable operations and to provide cost-effective programs and services to customers are significant determinants of AEP’s competitiveness.
SEASONALITY
The consumption of electric power is generally seasonal. In many parts of the country, demand for power peaks during the hot summer months, with market prices also peaking at that time. In other areas, power demand peaks during the winter. The pattern of this fluctuation may change due to the nature and location of AEP’s facilities and the terms of power sale contracts into which AEP enters. In addition, AEP has historically sold less power, and consequently earned less income, when weather conditions are milder. Unusually mild weather in the future could diminish AEP’s results of operations. Conversely, unusually extreme weather conditions could increase AEP’s results of operations.
TRANSMISSION AND DISTRIBUTION UTILITIES
GENERAL
This segment consists of the transmission and distribution of electricity for sale to retail and wholesale customers through assets owned and operated by AEP Texas and OPCo. OPCo is engaged in the transmission and distribution of electric power to approximately 1,494,000 retail customers in Ohio. OPCo purchases energy and capacity at auction to serve generation service customers who have not switched to a competitive generation supplier. AEP Texas is engaged in the transmission and distribution of electric power to approximately 1,049,000 retail customers through REPs in west, central and southern Texas.
AEP’s transmission and distribution utility subsidiaries own and operate transmission and distribution lines and other facilities to deliver electric power. See Item 2 – Properties, for more information regarding the transmission and distribution lines. Transmission and distribution services are sold to retail customers of AEP’s transmission and distribution utility subsidiaries in their service territories. These sales are made at rates approved by the PUCT for AEP Texas and by the PUCO and the FERC for OPCo. The FERC regulates and approves the rates for wholesale transmission transactions. As discussed below, some transmission services also are separately sold to nonaffiliated companies.
AEP’s transmission and distribution utility subsidiaries hold franchises or other rights to provide electric service in various municipalities and regions in their service areas. In some cases, these franchises provide the utility with the exclusive right to provide electric service. These franchises have varying provisions and expiration dates. In general, the operating companies consider their franchises to be adequate for the conduct of their business.
The use and the recovery of costs associated with the transmission assets of the AEP transmission and distribution utility subsidiaries are subject to the rules, protocols and agreements in place with PJM and ERCOT, and as approved by the FERC. In addition to providing transmission services in connection with power sales in their service areas, AEP’s transmission and distribution utility subsidiaries also provide transmission services for nonaffiliated companies through RTOs.
Transmission Agreement
OPCo owns and operates transmission facilities that are used to provide transmission service under the PJM OATT; OPCo is a party to the TA with other utility subsidiary affiliates. The TA defines how the parties to the agreement share the revenues associated with their transmission facilities and the costs of transmission service provided by PJM. The TA has been approved by the FERC.
Regional Transmission Organizations
OPCo is a member of PJM, a FERC-approved RTO. RTOs operate, plan and control utility transmission assets to provide open access to such assets in a way that prevents discrimination between participants owning transmission assets and those that do not. AEP Texas is a member of ERCOT.
REGULATION
OPCo provides distribution and transmission services to retail customers within its service territory at cost-based rates approved by the PUCO or by the FERC. AEP Texas provides transmission and distribution service on a cost-of-service basis at rates approved by the PUCT and wholesale transmission service under tariffs approved by the FERC consistent with PUCT rules. Transmission and distribution rates are established on a cost-of-service basis, which is designed to allow a utility an opportunity to recover its cost of providing service and to earn a reasonable return on its investment used in providing that service. The cost of service generally reflects operating expenses, including operation and maintenance expense, depreciation expense and taxes. Utility commissions periodically adjust rates pursuant to a review of: (a) a utility’s adjusted revenues and expenses during a defined test period and (b) such utility’s level of investment.
FERC
The FERC regulates rates for transmission of electric power, accounting and other matters. The FERC regulations require AEP to provide open access transmission service at FERC-approved rates, and it has approved cost-based formula transmission rates on file at the FERC. The FERC also regulates unbundled transmission service to retail customers. The FERC requires each public utility that owns or controls interstate transmission facilities to, directly or through an RTO, file an open access network and point-to-point transmission tariff that offers services comparable to the utility’s own uses of its transmission system. The FERC also requires all transmitting utilities, directly or through an RTO, to establish an Open Access Same-time Information System, which electronically posts transmission information such as available capacity and prices, and requires utilities to comply with Standards of Conduct that prohibit utilities’ transmission employees from providing non-public transmission information to the utility’s marketing employees. In addition, both the FERC and state regulators are permitted to review the books and records of any company within a holding company system. Additionally, the transmission and distribution utility subsidiaries are subject to reliability standards as set forth by the North American Electric Reliability Corporation, with the approval of the FERC.
SEASONALITY
The delivery of electric power is generally seasonal. In many parts of the country, demand for power peaks during the hot summer months. In other areas, power demand peaks during the winter months. The pattern of this fluctuation may change due to the nature and location of AEP’s transmission and distribution facilities. In addition, AEP transmission and distribution has historically delivered less power, and consequently earned less income, when weather conditions are milder. In Texas, and to a lesser extent, in Ohio, where there is residential decoupling, unusually mild weather in the future could diminish AEP’s results of operations. Conversely, unusually extreme weather conditions could increase AEP’s results of operations.
AEP TRANSMISSION HOLDCO
GENERAL
AEPTHCo is a holding company for (a) AEPTCo, which is the direct holding company for the State Transcos and (b) AEP’s Transmission Joint Ventures.
AEPTCo
AEPTCo wholly owns the State Transcos which are independent of, but respectively overlay, the following AEP electric utility operating companies: APCo, I&M, KPCo, OPCo, PSO, SWEPCo, and WPCo. The State Transcos develop, own, operate, and maintain their respective transmission assets. Assets of the State Transcos interconnect to transmission facilities owned by the aforementioned operating companies and nonaffiliated transmission owners within the footprints of PJM, MISO and SPP. APTCo, IMTCo, KTCo, OHTCo, and WVTCo are located within PJM. IMTCo also owns portions of the Greentown station assets located in MISO. OKTCo and SWTCo are located within SPP.
IMTCo, KTCo, OHTCo, OKTCo, and WVTCo own and operate transmission assets in their respective jurisdictions. The Virginia SCC and WVPSC granted consent for APCo and APTCo to enter into a joint license agreement that will support APTCo investment in the state of Tennessee. SWTCo does not currently own or operate transmission assets.
The State Transcos are regulated for rate-making purposes exclusively by the FERC and earn revenues through tariff rates charged for the use of their electric transmission systems. The State Transcos establish transmission rates each year through formula rate filings with the FERC. The rate filings calculate the revenue requirement needed to cover the costs of operation and debt service and to earn an allowed ROE. These rates are then included in an OATT for PJM, MISO and SPP.
The State Transcos own, operate, maintain and invest in transmission infrastructure in order to maintain and enhance system integrity and grid reliability, grid security, safety, reduce transmission constraints and facilitate interconnections of new generating resources and new wholesale customers, as well as enhance competitive wholesale electricity markets. A key part of AEP’s business is replacing and upgrading transmission facilities, assets and components of the existing AEP System as needed to maintain reliability.
The State Transcos provide the capability to build, replace and upgrade existing facilities. As of December 31, 2019, the State Transcos had $8.4 billion of transmission and other assets in-service with plans to construct approximately $4.3 billion of additional transmission assets through 2022. Additional investment in transmission infrastructure is needed within PJM and SPP to maintain the required level of grid reliability, resiliency, security and efficiency and to address an aging transmission infrastructure. Additional transmission facilities will be needed based on changes in generating resources, such as wind or solar projects, generation additions or retirements, and additional new customer interconnections. The State Transcos will continue their investment to enhance physical and cyber security of assets, and are also investing in improving the telecommunication network that supports the operation and control of the grid.
AEPTHCO JOINT VENTURE INITIATIVES
AEP has established joint ventures with other electric utility companies for the purpose of developing, building, and owning transmission assets that seek to improve reliability and market efficiency and provide transmission access to remote generation sources in North America (Transmission Joint Ventures).
The Transmission Joint Ventures currently include:
| Joint Venture Name | Location | Projected or Actual Completion Date | Owners (Ownership %) | Total Estimated/Actual Project Costs at Completion | Approved Return on Equity | ||||||||||
| (in millions) | |||||||||||||||
| ETT | Texas | (a) | Berkshire Hathaway | $ | 3,376.1 | (a) | 9.6 | % | |||||||
| (ERCOT) | Energy (50%) | ||||||||||||||
| AEP (50%) | |||||||||||||||
| Prairie Wind | Kansas | 2014 | Evergy, Inc. (50%) | 158.0 | 12.8 | % | |||||||||
| Berkshire Hathaway Energy (25%) | |||||||||||||||
| AEP (25%) | |||||||||||||||
| Pioneer | Indiana | 2018 | Duke Energy (50%) | 187.4 | 10.38 | % | (b) | ||||||||
| AEP (50%) | |||||||||||||||
| Transource | Missouri | 2016 | Evergy, Inc. | 310.5 | 11.2 | % | (c) | ||||||||
| Missouri | (13.5%) (d) | ||||||||||||||
| AEP (86.5%) (d) | |||||||||||||||
| Transource | West | 2019 | Evergy, Inc. | 82.0 | 10.5 | % | |||||||||
| West Virginia | Virginia | (13.5%) (d) | |||||||||||||
| AEP (86.5%) (d) | |||||||||||||||
| Transource | Maryland | 2022 | Evergy, Inc. | 23.1 | (e) | 10.4 | % | ||||||||
| Maryland | (13.5%) (d) | ||||||||||||||
| AEP (86.5%) (d) | |||||||||||||||
| Transource | Pennsylvania | 2022 | Evergy, Inc. | 238.9 | (e) | 10.4 | % | ||||||||
| Pennsylvania | (13.5%) (d) | ||||||||||||||
| AEP (86.5%) (d) |
| (a) | ETT is undertaking multiple projects and the completion dates will vary for those projects. ETT’s investment in completed and active projects in ERCOT is expected to be $3.4 billion. Future projects will be evaluated on a case-by-case basis. |
| (b) | In November 2019, Pioneer received FERC approval authorizing an ROE of 9.88% (10.38% inclusive of the RTO incentive adder of 0.5%. |
| (c) | The ROE represents the weighted average approved ROE based on the costs of two projects developed by Transource Missouri; the $64 million Iatan-Nashua project (10.3%) and the $247 million Sibley-Nebraska City project (11.3%). |
| (d) | AEP owns 86.5% of Transource Missouri, Transource West Virginia, Transource Maryland and Transource Pennsylvania through its ownership interest in Transource Energy, LLC (Transource). Transource is a joint venture with AEPTHCo and Evergy, Inc. formed to pursue competitive transmission projects. AEPTHCo and Evergy, Inc. own 86.5% and 13.5% of Transource, respectively. |
| (e) | In August 2016, Transource Maryland and Transource Pennsylvania received approval from the PJM Interconnection Board to construct portions of a transmission project located in both Maryland and Pennsylvania. The project is expected to go in service in 2022. Project costs are in 2019 dollars. |
Transource Missouri, Transource West Virginia, Transource Maryland and Transource Pennsylvania are consolidated joint ventures by AEP. All other joint ventures in the table above are not consolidated by AEP. AEP’s joint ventures do not have employees. Business services for the joint ventures are provided by AEPSC and other AEP subsidiaries and the joint venture partners. During 2019, approximately 608 AEPSC employees and 291 operating company employees provided service to one or more joint ventures.
REGULATION
The State Transcos and the Transmission Joint Ventures located outside of ERCOT establish transmission rates annually through forward looking formula rate filings with the FERC pursuant to FERC-approved implementation protocols. The protocols include a transparent, formal review process to ensure the updated transmission rates are prudently incurred and reasonably calculated. The IMTCo-owned Greentown station assets acquired from Duke Energy Indiana, LLC in December 2018 are located in MISO. IMTCo utilizes a historic cost recovery model to recover MISO assets.
The State Transcos’ and the Transmission Joint Ventures’ (where applicable) rates are included in the respective OATT for PJM and SPP. An OATT is the FERC rate schedule that provides the terms and conditions for transmission and related services on a transmission provider’s transmission system. The FERC requires transmission providers such as PJM and SPP to offer transmission service to all eligible customers (for example, load-serving entities, power marketers, generators and customers) on a non-discriminatory basis.
The FERC-approved formula rates establish the annual transmission revenue requirement (ATRR) and transmission service rates for transmission owners in annual rate base filings with the FERC. The formula rates establish rates for a one-year period based on the current projects in-service and proposed projects for a defined timeframe. The formula rates also include a true-up calculation for the previous year’s billings, allowing for over/under-recovery of the transmission owner’s ATRR. PJM and SPP pay the transmission owners their ATRR for use of their facilities and bill transmission customers taking service under the PJM and SPP OATTs, based on the terms and conditions in the respective OATT for the service taken. Additionally, the State Transcos are subject to reliability standards promulgated by the North American Electric Reliability Corporation, with the approval of the FERC.
The authorized returns on equity for the State Transcos are the FERC-authorized returns on equity in the PJM and SPP OATTs, respectively. These returns were challenged by parties in filings before the FERC. AEP’s transmission owning subsidiaries within PJM entered into a settlement agreement, approved by the FERC in May 2019, that established a total ROE of 9.85% (10.35% inclusive of the RTO incentive adder of 0.5%) based on a capital structure of up to 55% equity for APTCo, IMTCo, KTCo, OHTCo and WVTCo (the East Transcos). In June 2019, the FERC approved an unopposed settlement agreement between AEP’s transmission owning subsidiaries within SPP that established a total ROE of 10.0% (10.5% inclusive of the RTO incentive adder of 0.5%) without a cap on the capital structure for OKTCo and SWTCo (the West Transcos).
In the annual rate base filings described above, the State Transcos in aggregate filed rate base totals of $5.9 billion, $4.6 billion and $3.8 billion for 2019, 2018 and 2017, respectively. The total filed transmission revenue requirements, including prior year over/under-recovery of revenue and associated carrying charges were $992 million, $829 million and $690 million for 2019, 2018, and 2017, respectively.
The rates of ETT, which is located in ERCOT, are determined by the PUCT. ETT sets its rates through a combination of base rate cases and interim Transmission Cost of Services (TCOS) filings. ETT may file interim TCOS filings semi-annually to update its rates to reflect changes in its net invested capital.
The Transmission Joint Ventures have approved ROEs ranging from 9.6% to 12.8% based on equity capital structures ranging from 40% to 60%.
GENERATION & MARKETING
GENERAL
The AEP Generation & Marketing segment subsidiaries consist of competitive generating assets, a wholesale energy trading and marketing business and a retail supply and energy management business. The primary fossil generation subsidiary in the Generation & Marketing segment is AGR. As of December 31, 2019, AGR owns 1,294 MWs of generating capacity. Management plans to close 51% of this generation capacity in May 2020. Almost all of the remaining generating capacity is operated by Buckeye Power, a nonaffiliated electric cooperative. Other subsidiaries in this segment own or have the right to receive power from additional generation assets. See Item 2 – Properties for more information regarding the generation assets of the Generation & Marketing segment. AGR is a competitive generation subsidiary.
With respect to the wholesale energy trading and marketing business, AEP Generation & Marketing segment subsidiaries enter into short-term and long-term transactions to buy or sell capacity, energy and ancillary services in ERCOT, SPP, MISO and PJM. These subsidiaries sell power into the market and engage in power, natural gas and emissions allowances risk management and trading activities. These activities primarily involve the purchase-and-sale of electricity (and to a lesser extent, natural gas and emissions allowances) under forward contracts at fixed and variable prices. These contracts include physical transactions, exchange-traded futures, and to a lesser extent, OTC swaps and options. The majority of forward contracts are typically settled by entering into offsetting contracts. These transactions are executed with numerous counterparties or on exchanges.
With respect to the retail supply and energy management business, AEP Energy is a retail energy supplier that supplies electricity and/or natural gas to residential, commercial, and industrial customers. AEP Energy provides various energy solutions in Illinois, Pennsylvania, Delaware, Maryland, New Jersey, Ohio and Washington, D.C. AEP Energy also provides demand-side management solutions nationwide. AEP Energy had approximately 470,000 customer accounts as of December 31, 2019.
AEP Energy Supply, LLC is a holding company with several divisions, including AEP Renewables and AEP OnSite Partners.
AEP Renewables develops, owns and operates utility scale renewable projects backed with long-term contracts with creditworthy counterparties throughout the United States. AEP Renewables works directly with stakeholders to ensure that customers have clean, sustainable renewable energy to meet their environmental goals. As of December 31, 2019, AEP Renewables owned projects operating in 11 states, including approximately 1,212 MWs of installed wind capacity and approximately 90 MWs of installed solar capacity. These figures include the 2019 addition of 724 MWs of wind generation and battery assets located in several states acquired from Sempra Renewables LLC and the 75% interest, or 227 MWs, of Santa Rita East wind generation located in west Texas. In October 2019, AEP Renewables entered into an agreement to construct Flat Ridge 3, a wind farm in Kansas. The 128 MW facility is expected to reach commercial operation before the end of 2020.
AEP OnSite Partners works directly with wholesale and large retail customers to provide tailored solutions to reduce their energy costs based upon market knowledge, innovative applications of technology and deal structuring capabilities. AEP OnSite Partners targets opportunities in distributed solar, combined heat and power, energy storage, waste heat recovery, energy efficiency, peaking generation and other energy solutions that create value for customers. AEP OnSite Partners pursues and develops behind the meter projects with creditworthy customers. As of December 31, 2019, AEP OnSite Partners owned projects located in 17 states, including approximately 119 MWs of installed solar capacity, and approximately 28 MWs of solar projects under construction.
REGULATION
AGR is a public utility under the Federal Power Act, and is subject to the FERC’s exclusive ratemaking jurisdiction over wholesale sales of electricity and the transmission of electricity in interstate commerce. Under the Federal Power Act, the FERC has the authority to grant or deny market-based rates for sales of energy, capacity and ancillary services to ensure that such sales are just and reasonable. The FERC granted AGR market-based rate authority in December 2013. The FERC’s jurisdiction over ratemaking also includes the authority to suspend the market-based rates of AGR and set cost-based rates if the FERC subsequently determines that it can exercise market power, create barriers to entry or engage in abusive affiliate transactions. Periodically, AGR is required to file a market power update to show that it continues to meet the FERC’s standards with respect to generation market power and other criteria used to evaluate whether it continues to qualify for market-based rates. Other matters subject to the FERC jurisdiction include, but are not limited to, review of mergers, and dispositions of jurisdictional facilities and acquisitions of securities of another public utility or an existing operational generating facility.
Specific operations of AGR are also subject to the jurisdiction of various other federal, state, regional and local agencies, including federal and state environmental protection agencies. AGR is also regulated by the PUCT for transactions inside ERCOT. Additionally, AGR is subject to mandatory reliability standards promulgated by the North American Electric Reliability Corporation, with the approval of the FERC.
COMPETITION
The AEP Generation & Marketing segment subsidiaries face competition for the sale of available power, capacity and ancillary services. The principal factors of impact are electricity and fuel prices, new market entrants, construction or retirement of generating assets by others and technological advances in power generation. Because most of AGR’s remaining generation is coal-fired, lower relative natural gas prices will favor competitors that have a higher concentration of natural gas fueled generation. Other factors impacting competitiveness include environmental regulation, transmission congestion or transportation constraints at or near generation facilities, inoperability or inefficiencies, outages and deactivations and retirements at generation facilities.
Technology advancements, increased demand for clean energy, changing consumer behaviors, low-priced and abundant natural gas, and regulatory and public policy reforms are among the catalysts for transformation within the industry that impact competition for AEP’s Generation & Marketing segment. AGR also competes with self-generation and with distributors of other energy sources, such as natural gas, fuel oil, renewables and coal, within their service areas. The primary factors in such competition are price, unit availability and the capability of customers to utilize sources of energy other than electric power.
Changes in regulatory policies and advances in newer technologies for batteries or energy storage, fuel cells, microturbines, wind turbines and photovoltaic solar cells are reducing costs of new technology to levels that are making them competitive with some central station electricity production. The ability to maintain relatively low cost, efficient and reliable operations and to provide cost-effective programs and services to customers are significant determinants of AGR’s competitiveness. The costs of photovoltaic solar cells in particular have continued to become increasingly competitive.
This segment’s retail operations provide competitive electricity and natural gas in deregulated retail energy markets in six states and Washington, D.C. Each such retail choice jurisdiction establishes its own laws and regulations governing its competitive market, and public utility commission communications and utility default service pricing can affect customer participation in retail competition. Sustained low natural gas and power prices, low market volatility and maturing competitive environments can adversely affect this business.
This segment also engages in procuring and selling output from renewable generation sources under long-term contracts to creditworthy counterparties. New sources are not acquired without first securing a long-term placement of such power. Existing sources do not face competitive exposure. Competitive nonaffiliated suppliers of renewable or other generation could limit opportunities for future transactions for new sources and related output contracts.
SEASONALITY
The consumption of electric power is generally seasonal. In many parts of the country, demand for power peaks during the hot summer months, with market prices also peaking at that time. In other areas, power demand peaks during the winter months. The pattern of this fluctuation may change.
Fuel Supply
The following table shows the generation sources by type, on an actual net generation (MWhs) basis, used by the Generation & Marketing segment, not including AEP Energy Partners’ offtake agreement from the Oklaunion Power Station:
| 2019 | 2018 | 2017 | |||
| Coal | 64% | 88% | 85% | ||
| Natural Gas | —% | —% | 8% | ||
| Renewables | 36% | 12% | 7% |
Management expects the decline in coal generation sources to continue into 2020 due to the shutdown of Conesville Unit 4 in May 2020.
Coal and Consumables
AGR procures coal and consumables needed to burn the coal under a combination of purchasing arrangements including long-term and spot contracts with various producers and coal trading firms. As contracts expire, they are replaced, as needed, with contracts at market prices. Coal and consumable inventories remain adequate to meet generation requirements.
Management believes that AGR will be able to secure and transport coal and consumables of adequate quality and in adequate quantities to operate their coal-fired units. AGR, through its contracts with third party transporters, has the ability to adequately move and store coal and consumables for use in its generating facilities. AGR plants consumed 2.5 million tons of coal in 2019.
The coal supplies at AGR plants vary from time to time depending on various factors, including, but not limited to, demand for electric power, unit outages, transportation infrastructure limitations, space limitations, plant coal consumption rates, coal quality, availability of acceptable coals, labor issues and weather conditions, which may interrupt production or deliveries. AGR aims to maintain the coal inventory of its managed plants in the range of 20 to 60 days of full load burn. As of December 31, 2019, the coal inventory of AGR was within the target range.
Counterparty Risk Management
Counterparties and exchanges may require cash or cash related instruments to be deposited on these transactions as margin against open positions. As of December 31, 2019, counterparties posted approximately $16 million in cash, cash equivalents or letters of credit with AEP for the benefit of AEP’s Generation & Marketing segment subsidiaries (while, as of that date, AEP’s Generation & Marketing segment subsidiaries posted approximately $169 million with counterparties and exchanges). Since open trading contracts are valued based on market prices of various commodities, exposures change daily. See the “Quantitative and Qualitative Disclosures About Market Risk” section of Management’s Discussion and Analysis of Financial Condition and Results of Operations included in the 2019 Annual Report for additional information.
Certain Power Agreements
As of December 31, 2019, the assets utilized in this segment included approximately 1,212 MWs of company-owned domestic wind power facilities, 101 MWs of domestic wind power from long-term purchase power agreements and 355 MWs of coal-fired capacity which was obtained through an agreement effective through 2027 that transfers the interest of AEP Texas in the Oklaunion Power Station to AEPEP. Management has announced plans to close Oklaunion Power Station by October 2020. The power obtained from the Oklaunion Power Station is marketed and sold in ERCOT.
INFORMATION ABOUT OUR EXECUTIVE OFFICERS
The following persons are executive officers of AEP. Their ages are given as of February 20, 2020. The officers are appointed annually for a one-year term by the board of directors of AEP.
Nicholas K. Akins
Chairman of the Board, President and Chief Executive Officer
Age 59
Chairman of the Board since January 2014, President since January 2011 and Chief Executive Officer since November 2011.
Lisa M. Barton
Executive Vice President - Utilities
Age 54
Executive Vice President - Transmission from August 2011 to December 2018.
Paul Chodak, III
Executive Vice President - Generation
Age 56
Executive Vice President - Utilities from January 2017 to December 2018. President and Chief Operating Officer of I&M from July 2010 to December 2016.
David M. Feinberg
Executive Vice President, General Counsel and Secretary
Age 50
Executive Vice President since January 2013.
Lana L. Hillebrand
Executive Vice President and Chief Administrative Officer
Age 59
Chief Administrative Officer since December 2012 and Senior Vice President from December 2012 to December 2016.
Mark C. McCullough
Executive Vice President - Transmission
Age 60
Executive Vice President - Generation from January 2011 to December 2018.
Charles R. Patton
Executive Vice President - External Affairs
Age 60
Executive Vice President - External Affairs since January 2017. President and Chief Operating Officer of APCo from June 2010 to December 2016.
Brian X. Tierney
Executive Vice President and Chief Financial Officer
Age 52
Executive Vice President and Chief Financial Officer since October 2009.
Charles E. Zebula
Executive Vice President - Energy Supply
Age 59
Executive Vice President - Energy Supply since January 2013.
Previous: Cover and table of contents · Next: Item 1A. RISK FACTORS