 filings.tools
Item 7. MANAGEMENT'S DISCUSSION AND ANALYSIS OF FINANCIAL CONDITION AND RESULTS OF OPERATIONS
179K characters. Original on sec.gov · Markdown
Item 7. MANAGEMENT'S DISCUSSION AND ANALYSIS OF FINANCIAL CONDITION AND RESULTS OF OPERATIONS
Key Topics in Management's Discussion and Analysis
Our discussion covers the following:
| • | Executive Summary |
| • | Overview of 2016 Results and Strategic Performance |
| • | Review of Consolidated Results of Operations |
| • | SBU Performance Analysis |
| • | Key Trends and Uncertainties |
| • | Capital Resources and Liquidity |
Executive Summary
Consolidated Net Cash Provided by Operating Activities for the year ended December 31, 2016 was $2,884 million, an increase of $750 million compared to the year ended December 31, 2015. The increase was primarily driven by higher collections at the Company’s distribution business in Brazil, Eletropaulo and Sul, and the settlement of overdue receivables at Maritza in Bulgaria. These positive contributions were offset by lower margins across the SBUs (primarily due to lower wholesale prices and lower contributions from regulated customers in the U.S., lower contracted rates in Tietê, the prior year liability reversal in Eletropaulo and unfavorable FX in Kazakhstan), as well as the recovery of overdue receivables in the Dominican Republic in 2015, which benefited
2015 results. Proportional Free Cash Flow (a non-GAAP financial measure) for the year ended December 31, 2016 increased $176 million to $1,417 million compared to the year ended December 31, 2015, primarily due to the same factors as Consolidated Net Cash Provided by Operating Activities.
Overview of 2016 Results
Earnings Per Share and Proportional Free Cash Flow Results in 2016 (in millions, except per share amounts)
| Years Ended December 31, | 2016 | 2015 | 2014 | ||||||||
| Diluted earnings per share from continuing operations | $ | — | $ | 0.48 | $ | 0.97 | |||||
| Adjusted earnings per share (a non-GAAP measure) (1) | 0.98 | 1.25 | 1.18 | ||||||||
| Net cash provided by operating activities | 2,884 | 2,134 | 1,791 | ||||||||
| Proportional Free Cash Flow (a non-GAAP measure) (1) (2) | 1,417 | 1,241 | 891 |
| (1) | See reconciliation and definition under SBU Performance Analysis—Non-GAAP Measures. |
| (2) | Disclosure of Proportional Free Cash Flow will be discontinued beginning in the first quarter of 2017. See further discussion under SBU Performance Analysis—Non-GAAP Measures. |
Diluted earnings per share from continuing operations decreased primarily due to higher impairment expense on long lived assets, lower gains on foreign currency derivatives, lower operating margins at our US, Brazil and Europe SBUs, and lower equity in earnings of affiliates due to the gain earned in 2015 from the restructuring of Guacolda; partially offset by a lower effective tax rate, the absence of goodwill impairment expense in the current year, lower losses on extinguishment of debt and lower share count.
Adjusted EPS, a non-GAAP measure, decreased by 22% to $0.98 primarily driven by lower operating margins at our US, Brazil, and Europe SBUs, lower equity in earnings of affiliates due to the gain earned in 2015 from the restructuring of Guacolda; partially offset by a lower adjusted effective tax rate and lower share count.
Net cash provided by operating activities increased by 35% to $2.9 billion primarily driven by an increase in collections at our Brazil utilities, the collection of overdue receivables at Maritza, and lower costs associated with the fulfillment of our service concession arrangement and lower working capital requirements at Mong Duong. These positive impacts were partially offset by the timing of payments at our Brazil utilities for higher energy purchases made in the prior year, collections of overdue receivables in the prior year in the Dominican Republic, and lower net income adjusted for non-cash items.
Proportional free cash flow, a non-GAAP measure, increased by 14% to $1.4 billion primarily driven by an increase in collections at our Brazil utilities, the collection of overdue receivables at Maritza, and lower working capital requirements at Mong Duong. These positive impacts were partially offset by the timing of payments at our Brazil utilities for higher energy purchases made in the prior year, collections of overdue receivables in the prior year in the Dominican Republic, and a decrease in Adjusted Operating Margin (a non-GAAP measure).
Review of Consolidated Results of Operations
| Years Ended December 31, | 2016 | 2015 | 2014 | % Change 2016 vs. 2015 | % Change 2015 vs. 2014 | ||||||||||||
| (in millions, except per share amounts) | |||||||||||||||||
| Revenue: | |||||||||||||||||
| US SBU | $ | 3,429 | $ | 3,593 | $ | 3,826 | -5 | % | -6 | % | |||||||
| Andes SBU | 2,506 | 2,489 | 2,642 | 1 | % | -6 | % | ||||||||||
| Brazil SBU | 3,755 | 3,858 | 4,987 | -3 | % | -23 | % | ||||||||||
| MCAC SBU | 2,172 | 2,353 | 2,682 | -8 | % | -12 | % | ||||||||||
| Europe SBU | 918 | 1,191 | 1,439 | -23 | % | -17 | % | ||||||||||
| Asia SBU | 752 | 684 | 558 | 10 | % | 23 | % | ||||||||||
| Corporate and Other | 77 | 31 | 15 | NM | NM | ||||||||||||
| Intersegment eliminations | (23 | ) | (44 | ) | (25 | ) | 48 | % | -76 | % | |||||||
| Total Revenue | 13,586 | 14,155 | 16,124 | -4 | % | -12 | % | ||||||||||
| Operating Margin: | |||||||||||||||||
| US SBU | 582 | 621 | 699 | -6 | % | -11 | % | ||||||||||
| Andes SBU | 634 | 618 | 587 | 3 | % | 5 | % | ||||||||||
| Brazil SBU | 239 | 592 | 634 | -60 | % | -7 | % | ||||||||||
| MCAC SBU | 523 | 543 | 541 | -4 | % | — | % | ||||||||||
| Europe SBU | 259 | 303 | 403 | -15 | % | -25 | % | ||||||||||
| Asia SBU | 170 | 149 | 76 | 14 | % | 96 | % | ||||||||||
| Corporate and Other | 15 | 33 | 53 | -55 | % | -38 | % | ||||||||||
| Intersegment eliminations | 11 | (1 | ) | (13 | ) | NM | 92 | % | |||||||||
| Total Operating Margin | 2,433 | 2,858 | 2,980 | -15 | % | -4 | % | ||||||||||
| General and administrative expenses | (194 | ) | (196 | ) | (187 | ) | -1 | % | 5 | % | |||||||
| Interest expense | (1,431 | ) | (1,344 | ) | (1,451 | ) | 6 | % | -7 | % | |||||||
| Interest income | 464 | 460 | 320 | 1 | % | 44 | % | ||||||||||
| Loss on extinguishment of debt | (13 | ) | (182 | ) | (261 | ) | -93 | % | -30 | % | |||||||
| Other expense | (103 | ) | (58 | ) | (65 | ) | 78 | % | -11 | % | |||||||
| Other income | 65 | 82 | 121 | -21 | % | -32 | % | ||||||||||
| Gain on disposal and sale of businesses | 29 | 29 | 358 | — | % | -92 | % | ||||||||||
| Goodwill impairment expense | — | (317 | ) | (164 | ) | NM | 93 | % | |||||||||
| Asset impairment expense | (1,096 | ) | (285 | ) | (91 | ) | NM | NM | |||||||||
| Foreign currency transaction gains (losses) | (15 | ) | 107 | 11 | NM | NM | |||||||||||
| Other non-operating expense | (2 | ) | — | (128 | ) | NM | NM | ||||||||||
| Income tax benefit (expense) | 188 | (472 | ) | (371 | ) | NM | 27 | % | |||||||||
| Net equity in earnings of affiliates | 36 | 105 | 19 | -66 | % | NM | |||||||||||
| INCOME FROM CONTINUING OPERATIONS | 361 | 787 | 1,091 | -54 | % | -28 | % | ||||||||||
| Income (loss) from operations of discontinued businesses | (19 | ) | (25 | ) | 111 | -24 | % | NM | |||||||||
| Net loss from disposal and impairments of discontinued operations | (1,119 | ) | — | (55 | ) | NM | NM | ||||||||||
| NET INCOME (LOSS) | (777 | ) | 762 | 1,147 | NM | -34 | % | ||||||||||
| Noncontrolling interests: | |||||||||||||||||
| (Income) from continuing operations attributable to noncontrolling interests | (364 | ) | (456 | ) | (386 | ) | -20 | % | 18 | % | |||||||
| Net loss attributable to redeemable stocks of subsidiaries | 11 | — | — | NM | NM | ||||||||||||
| Loss from discontinued operations attributable to noncontrolling interests | — | — | 8 | NM | NM | ||||||||||||
| NET INCOME (LOSS) ATTRIBUTABLE TO THE AES CORPORATION | $ | (1,130 | ) | $ | 306 | $ | 769 | NM | -60 | % | |||||||
| AMOUNTS ATTRIBUTABLE TO THE AES CORPORATION COMMON STOCKHOLDERS: | |||||||||||||||||
| Income from continuing operations, net of tax | $ | 8 | $ | 331 | $ | 705 | -98 | % | -53 | % | |||||||
| Income (loss) from discontinued operations, net of tax | (1,138 | ) | (25 | ) | 64 | NM | NM | ||||||||||
| NET INCOME (LOSS) ATTRIBUTABLE TO THE AES CORPORATION | $ | (1,130 | ) | $ | 306 | $ | 769 | NM | -60 | % | |||||||
| Net cash provided by operating activities | $ | 2,884 | $ | 2,134 | $ | 1,791 | 35 | % | 19 | % | |||||||
| DIVIDENDS DECLARED PER COMMON SHARE | $ | 0.45 | $ | 0.41 | $ | 0.25 | 10 | % | 64 | % |
NM — Not meaningful
Components of Revenue, Cost of Sales and Operating Margin — Revenue includes revenue earned from the sale of energy from our utilities and the production of energy from our generation plants, which are classified as regulated and non-regulated, respectively, on the Consolidated Statements of Operations. Revenue also includes the gains or losses on derivatives associated with the sale of electricity.
Cost of sales includes costs incurred directly by the businesses in the ordinary course of business. Examples include electricity and fuel purchases, operations & maintenance costs, depreciation and amortization expense, bad debt expense and recoveries, and general administrative and support costs (including employee-related costs directly associated with the operations of the business). Cost of sales also includes the gains or losses on derivatives (including embedded derivatives other than foreign currency embedded derivatives) associated with the purchase of electricity or fuel.
Operating margin is defined as revenue less cost of sales.
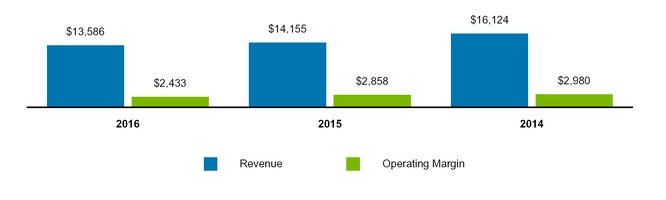
Consolidated Revenue and Operating Margin
(in millions)
Year Ended December 31, 2016
Consolidated Revenue — Revenue decreased in 2016 compared to 2015 primarily due to:
| • | Unfavorable FX impacts of $511 million, primarily in Brazil of $213 million, Argentina of $94 million, Kazakhstan of $63 million and Colombia of $54 million. |
| • | Brazil due to lower rates for energy sold in Brazil under new contracts at Tietê; operations in 2015 but not in 2016 at Uruguiana; the reversal of a contingent regulatory liability in 2015, and lower demand, partially offset by the annual tariff adjustment at Eletropaulo. |
| • | Lower pass-through costs at El Salvador and IPP4 in Jordan, the sale of DPLER in January 2016, and lower rates at DPL. |
These decreases were partially offset by:
| • | The full operations at Mong Duong in 2016 compared to Unit 1 in March 2015 with principal operations commencing in April 2015 |
| • | The commencement of operations at Cochrane in Chile with Unit 1 operational in July 2016 and principal operations in October). |
| • | Higher environmental returns and new rate case at IPL. |
Consolidated Operating Margin — Operating margin decreased in 2016 compared to 2015 primarily due to:
| • | Unfavorable FX impacts of $80 million, primarily in Kazakhstan, Argentina, and Colombia. |
| • | Brazil driven by the revenue drivers above as well as higher fixed costs at Eletropaulo. |
These decreases were partially offset by:
| • | Higher margin at Gener, impact from full operations at Mong Duong in Vietnam and Cochrane in Chile, and higher margins at IPL as discussed above. |
Year Ended December 31, 2015
Consolidated Revenue — Revenue decreased in 2015 compared to 2014 primarily due to:
| • | Unfavorable FX impacts of $2.2 billion, mainly in Brazil of $1.8 billion, Colombia of $179 million, and Bulgaria of $74 million. |
| • | US Utilities due to lower volumes primarily at DPL and outages, milder weather, and lower demand at IPL. |
| • | Lower prices in the Dominican Republic and El Salvador (primarily resulting from lower pass-through costs). |
These decreases were partially offset by:
| • | Brazil due to higher tariffs at Eletropaulo (including higher pass-through costs) and the reversal of a contingent regulatory liability at Eletropaulo. |
| • | Higher capacity prices at DPL. |
| • | Commencement of principal operations at Mong Duong in April 2015. |
Consolidated Operating Margin — Operating margin decreased in 2015 compared to 2014 primarily due to:
| • | Unfavorable FX impacts of $362 million, primarily in Brazil of $228 million and Colombia of $83 million. |
| • | Brazil due to lower demand, lower hydrology, and higher fixed costs. |
| • | The Dominican Republic due to lower prices and lower availability. |
These decreases were partially offset by:
| • | Higher tariffs in Brazil as discussed above and lower spot prices on energy purchases at Tietê. |
| • | Higher generation and lower energy purchases driven by improved hydrological conditions in Panama. |
| • | Higher prices at Chivor driven by a strong El Niño. |
| • | Higher availability at Gener and Masinloc. |
See Item 7.—SBU Performance Analysis of this Form 10-K for additional discussion and analysis of operating results for each SBU.
Consolidated Results of Operations — Other
General and administrative expenses
General and administrative expenses include expenses related to corporate staff functions and/or initiatives, executive management, finance, legal, human resources and information systems, as well as global development costs.
General and administrative expenses decreased in 2016 from 2015 primarily due to decreased employee-related costs, partially offset by increased business development costs.
General and administrative expenses increased in 2015 from 2014 primarily due to increased business development costs and employee-related costs partially offset by decreased professional fees.
Interest expense
Interest expense increased in 2016 from 2015 primarily due to a $97 million increase at Eletropaulo as a result of the prior year reversal of $64 million in interest expense, previously recognized on a contingent regulatory liability, and increased interest expense due to higher regulatory liabilities and interest rates in the current year. Additionally, there was a $26 million increase at Mong Duong, mainly due to this entity no longer capitalizing interest as a result of the commencement of operations in April 2015. These increases were partially offset by lower interest expense of $22 million due to a reduction in debt principal at the Parent Company.
Interest expense decreased in 2015 from 2014 primarily due to lower interest expense of $63 million at the Parent Company due to a reduction in debt principal, and a $64 million reversal of interest expense previously recognized on a contingent regulatory liability at Eletropaulo. These decreases were partially offset by an increase at Mong Duong as the plant commenced operations in April 2015 and ceased capitalizing interest.
Interest income
Interest income increased in 2016 from 2015 primarily due to higher interest income of $19 million recognized on the financing element of the service concession arrangement at Mong Duong, which became fully operational in April 2015, partially offset by lower interest income of $16 million in Argentina due to prior year recognition of accumulated interest on VAT balances related to CAMESSA.
Interest income increased in 2015 from 2014 primarily due to interest income of $114 million recognized in 2015 on the financing element of the service concession arrangement at Muong Duong, as well as an increase of $36 million at Eletropaulo resulting from higher interest rates and an increase in regulatory assets.
Loss on extinguishment of debt
Loss on extinguishment of debt was $13 million for the year ended December 31, 2016 primarily related to expense of $14 million recognized on debt extinguishment at the Parent Company.
Loss on extinguishment of debt was $182 million for the year ended December 31, 2015. This loss was primarily related to expense of $105 million, $22 million, and $19 million recognized on debt extinguishments at the Parent Company, IPL, and the Dominican Republic, respectively.
Loss on extinguishment of debt was $261 million for the year ended December 31, 2014. This was primarily related to expense of $193 million, $31 million, and $20 million recognized on debt extinguishments at the Parent
Company, DPL, and Gener, respectively.
Other income and expense
Other income decreased in 2016 from 2015 primarily due to gains on early contract termination in 2015 and lower gains on asset sales in 2016; partially offset by an increase in allowance for funds used during construction as a result of increased construction activity at IPL.
Other income decreased in 2015 from 2014 primarily due to lower gains on asset sales in 2015 and the 2014 reversal of a liability in Kazakhstan due to the expiration of a statute of limitations for the Republic of Kazakhstan to claim payment from AES.
Other expense increased in 2016 from 2015 primarily due to the 2016 recognition a full allowance on a non-trade receivable in the MCAC SBU as a result of payment delays and discussions with the counterparty. The allowance relates to certain reimbursements the Company was expecting in connection with a legal matter. Management believes the counterparty is obligated to pay and plans to continue to attempt to fully collect the non-trade receivable.
Other expense decreased in 2015 from 2014 primarily due to lower losses on sales and disposal of assets at Termo Andes and Eletropaulo.
See Note 19—Other Income and Expense included in Item 8.—Financial Statements and Supplementary Data of this Form 10-K for further information.
Gain on disposal and sale of businesses
Gain on sale of businesses was $29 million for the year ended December 31, 2016, which was primarily related to the gain on sale of DPLER, partially offset by a loss on the deconsolidation of U.K. Wind.
Gain on sale of businesses was $29 million for the year ended December 31, 2015, which was primarily related to the sale of Armenia Mountain.
Gain on disposal and sale of investments for the year ended December 31, 2014 was $358 million, which was primarily related to the sale of 45% of the Company's interest in Masinloc, as well as the sale of U.K. Wind (Operating Projects).
Goodwill impairment expense
There were no goodwill impairments for the year ended December 31, 2016.
Goodwill impairment expense was $317 million for the year ended December 31, 2015 due to a goodwill impairment at DP&L.
Goodwill impairment expense was $164 million for the year ended December 31, 2014. This expense consisted of $136 million, $20 million and $8 million of goodwill impairments at DPLER, Buffalo Gap II and Buffalo Gap I, respectively.
See Note 9—Goodwill and Other Intangible Assets included in Item 8.—Financial Statements and Supplementary Data of this Form 10-K for further information.
Asset impairment expense
Asset impairment expense was $1.1 billion for the year ended December 31, 2016. This was primarily related to asset impairments of $859 million, $159 million and $77 million at DPL, Buffalo Gap II and Buffalo Gap I, respectively.
Asset impairment expense was $285 million for the year ended December 31, 2015 primarily due to asset impairments of $121 million, $116 million and $37 million at Kilroot, Buffalo Gap III and U.K. Wind, respectively.
Asset impairment expense was $91 million for the year ended December 31, 2014 primarily due to asset impairments of $67 million, $12 million and $12 million at Ebute, U.K. Wind and DPL, respectively.
See Note 20—Asset Impairment Expense included in Item 8.—Financial Statements and Supplementary Data of this Form 10-K for further information.
Income tax expense
Income tax decreased to a benefit of $188 million in 2016 as compared to expense of $472 million in 2015. The Company's effective tax rates were (137%) and 41% for the years ended December 31, 2016 and 2015, respectively.
The net decrease in the 2016 effective tax rate was due, in part, to the 2016 asset impairments in the U.S. and to the current year benefit related to a restructuring of one of our Brazilian businesses that increases tax basis in long-term assets. Further, the 2015 rate was impacted by the items described below. See Note 20—Asset Impairment Expense for additional information regarding the 2016 U.S. asset impairments.
Income tax expense increased $101 million, or 27%, to $472 million in 2015. The Company's effective tax rates were 41% and 26% for the years ended December 31, 2015 and 2014, respectively.
The net increase in the 2015 effective tax rate was due, in part, to the nondeductible 2015 impairment of goodwill at our U.S. utility, DP&L and Chilean withholding taxes offset by the release of valuation allowance at certain of our businesses in Brazil, Vietnam and the U.S. Further, the 2014 rate was impacted by the sale of approximately 45% of the Company’s interest in Masin AES Pte Ltd., which owns the Company’s business interests in the Philippines and the 2014 sale of the Company’s interests in four U.K. wind operating projects. Neither of these transactions gave rise to income tax expense. See Note 15—Equity for additional information regarding the sale of approximately 45% of the Company’s interest in Masin-AES Pte Ltd. See Note 23—Dispositions for additional information regarding the sale of the Company’s interests in four U.K. wind operating projects.
Our effective tax rate reflects the tax effect of significant operations outside the U.S., which are generally taxed at rates lower than the U.S. statutory rate of 35%. A future proportionate change in the composition of income before income taxes from foreign and domestic tax jurisdictions could impact our periodic effective tax rate. The Company also benefits from reduced tax rates in certain countries as a result of satisfying specific commitments regarding employment and capital investment. See Note 21—Income Taxes for additional information regarding these reduced rates.
Foreign currency transaction gains (losses)
Foreign currency transaction gains (losses) in millions were as follows:
| Years Ended December 31, | 2016 | 2015 | 2014 | ||||||||
| AES Corporation | $ | (50 | ) | $ | (31 | ) | $ | (34 | ) | ||
| Chile | (9 | ) | (18 | ) | (30 | ) | |||||
| Colombia | (8 | ) | 29 | 17 | |||||||
| Mexico | (8 | ) | (6 | ) | (14 | ) | |||||
| Philippines | 12 | 8 | 11 | ||||||||
| United Kingdom | 13 | 11 | 12 | ||||||||
| Argentina | 37 | 124 | 66 | ||||||||
| Other | (2 | ) | (10 | ) | (17 | ) | |||||
| Total (1) | $ | (15 | ) | $ | 107 | $ | 11 |
| (1) | Includes gains of $17 million, $247 million and $172 million on foreign currency derivative contracts for the years ended December 31, 2016, 2015 and 2014, respectively. |
The Company recognized a net foreign currency transaction loss of $15 million for the year ended December 31, 2016 primarily due to losses of $50 million at The AES Corporation mainly due to remeasurement losses on intercompany notes, and losses on swaps and options.
This loss was partially offset by gains of $37 million in Argentina, mainly due to the favorable impact of foreign currency derivatives related to government receivables.
The Company recognized a net foreign currency transaction gain of $107 million for the year ended December 31, 2015 primarily due to gains of:
| • | $124 million in Argentina, due to the favorable impact from foreign currency derivatives related to government receivables, partially offset by losses from the devaluation of the Argentine Peso associated with U.S. Dollar denominated debt, and losses at Termoandes (a U.S. Dollar functional currency subsidiary) primarily associated with cash and accounts receivable balances in local currency, |
| • | $29 million in Colombia, mainly due to the depreciation of the Colombian Peso, positively impacting Chivor (a U.S. Dollar functional currency subsidiary) due to liabilities denominated in Colombian Pesos, |
| • | $11 million in the United Kingdom, mainly due to the depreciation of the Pound Sterling, resulting in gains at Ballylumford Holdings (a U.S. Dollar functional currency subsidiary) associated with intercompany notes payable denominated in Pound Sterling, and |
These gains were partially offset by losses of:
| • | $31 million at The AES Corporation primarily due to decreases in the valuation of intercompany notes receivable denominated in foreign currency, resulting from the weakening of the Euro and British Pound during the year, partially offset by gains related to foreign currency option purchases, and |
| • | $18 million in Chile primarily due to the devaluation of the Chilean Peso at Gener (a U.S. Dollar functional currency subsidiary) from working capital denominated in Chilean Pesos, partially offset by gains on foreign currency derivatives. |
The Company recognized a net foreign currency transaction gains of $11 million for the year ended December 31, 2014 primarily due to gains of:
| • | $66 million in Argentina, due to the favorable impact from foreign currency derivatives related to government receivables, partially offset by losses from the devaluation of the Argentine Peso associated with U.S. Dollar denominated debt, and losses at Termoandes (a U.S. Dollar functional currency subsidiary) primarily associated with cash and accounts receivable balances in local currency, and the purchase of Argentine sovereign bonds, |
| • | $17 million in Colombia, mainly due to a 23% depreciation of the Colombian Peso, positively impacting Chivor (a U.S. Dollar functional currency subsidiary) due to liabilities denominated in Colombian Pesos, primarily income tax payable and accounts payable, |
| • | $12 million in the United Kingdom, mainly due to a 6% depreciation of the Pound Sterling, resulting in gains at Ballylumford Holdings (a U.S. Dollar functional currency subsidiary) associated with intercompany notes payable denominated in Pound Sterling, and gains related to foreign currency derivatives, and |
| • | $11 million in the Philippines, mainly due to amortization of frozen embedded derivatives and a 4% appreciation of the Philippine Peso against the U.S. Dollar, resulting in a revaluation of cash accounts, customer receivables, and deferred tax asset. |
These gains were partially offset by losses of:
| • | $34 million at The AES Corporation primarily due to decreases in the valuation of intercompany notes receivable denominated in foreign currency, resulting from the weakening of the Euro and British Pound during the year, partially offset by gains related to foreign currency option purchases, |
| • | $30 million in Chile primarily due to a 16% devaluation of the Chilean Peso, resulting in a $39 million loss at Gener (a U.S. Dollar functional currency subsidiary) from working capital denominated in Chilean Pesos, primarily cash, accounts receivable and VAT receivables, partially offset by income of $9 million on foreign currency derivatives, and |
| • | $14 million in Mexico, primarily due to a 13% devaluation of the Mexican Peso, resulting in a loss at TEGTEP and Merida (U.S. Dollar functional currency subsidiaries) from working capital denominated in Pesos (primarily cash, recoverable tax, and VAT). |
Other non-operating expense
There were no significant non-operating expenses for the years ended December 31, 2016 and 2015.
Other non-operating expense was $128 million for the year ended December 31, 2014 due to impairments recognized at Entek and Silver Ridge.
See Note 8—Other Non-Operating Expense included in Item 8.—Financial Statements and Supplementary Data of this Form 10-K for further information.
Net equity in earnings of affiliates
Net equity in earnings of affiliates decreased in 2016 compared to 2015 as a result of the restructuring of Guacolda in September 2015, which resulted in a $66 million benefit. No comparable transaction occurred in 2016.
Net equity in earnings of affiliates increased in 2015 compared to 2014 as a result of the restructuring of Guacolda in September 2015, which resulted in a $66 million benefit, as well as the impairment at Elsta in 2014.
See Note 7—Investments In and Advances to Affiliates included in Item 8.—Financial Statements and Supplementary Data of this Form 10-K for further information.
Income from continuing operations attributable to noncontrolling interests
Income from continuing operations attributable to noncontrolling interests decreased in 2016 compared to 2015 as a result of:
| • | a decrease at Tietê due to lower earnings |
| • | a decrease at Eletropaulo resulting from the the reversal of a contingent regulatory liability in 2015, and |
| • | asset impairments at Buffalo Gap I and II; |
Partially offset by:
| • | a lower asset impairment at Buffalo Gap III in 2015, and |
| • | income tax benefits at Eletropaulo. |
Income from continuing operations attributable to noncontrolling interests increased in 2015 compared to 2014 as a result of:
| • | an increase at Mong Duong due to commencement of operations in 2015, |
| • | an increase at Gener primarily due to the restructuring of Guacolda, |
| • | an increase at Masinloc due to increased earnings in 2015 and the 2014 sale of a noncontrolling interest in that business |
Partially offset by:
| • | a decrease at Buffalo Gap III resulting from the asset impairment expense allocation to the tax equity partner, and |
| • | a decrease at Eletropaulo resulting from unfavorable foreign exchange and lower demand. |
Loss from discontinued operations
Total loss from discontinued operations in 2016 and 2015 was due to the sale of AES Sul. The loss in 2016 includes an after tax loss on impairment of $382 million recognized in the second quarter of 2016 and an additional after tax loss on sale of $737 million upon disposal of AES Sul in October 2016. There were no significant changes in loss from operations related to the AES Sul discontinued business.
Total income from discontinued operations for the year ended December 31, 2014 was primarily due to AES Sul, Cameroon, Saurashtra and U.S. wind projects.
See Note 22—Discontinued Operations included in Item 8.—Financial Statements and Supplementary Data of this Form 10-K for further information.
Net income (loss) attributable to The AES Corporation
Net income (loss) attributable to The AES Corporation decreased in 2016 compared to 2015 as a result of:
| • | impairments and loss on sale at discontinued businesses; |
| • | higher impairment expense on long lived assets; |
| • | lower operating margins at our US, Brazil and Europe SBUs; |
| • | lower equity in earnings of affiliates due to the 2015 restructuring at Guacolda; and |
| • | lower gains on foreign currency derivatives. |
These decreases were partially offset by:
| • | lower effective tax rate; |
| • | lower debt extinguishment expense; and |
| • | absence of goodwill impairment expense. |
Net income attributable to The AES Corporation decreased in 2015 compared to 2014 as result of:
| • | Higher impairment expense |
| • | Lower gains from the sale of businesses |
These decreases were partially offset by:
| • | Lower debt extinguishment expense |
SBU Performance Analysis
Non-GAAP Measures
Adjusted Operating Margin, Adjusted PTC, Adjusted EPS, and Proportional Free Cash Flow are non-GAAP supplemental measures that are used by management and external users of our consolidated financial statements such as investors, industry analysts and lenders.
Adjusted Operating Margin
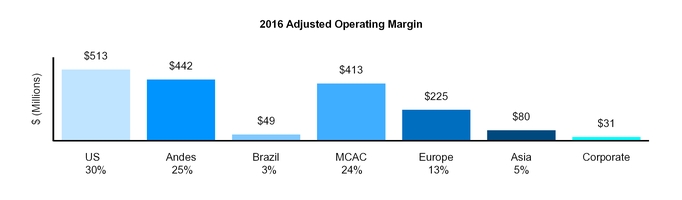
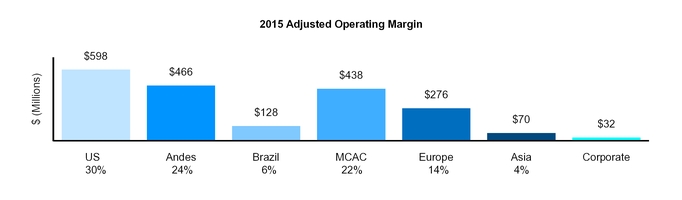
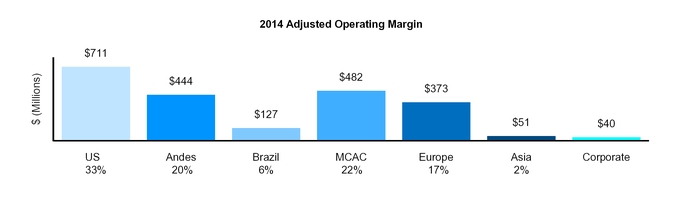
We define Adjusted Operating Margin as Operating Margin, adjusted for the impact of NCI, excluding unrealized gains or losses related to derivative transactions. See Review of Consolidated Results of Operations for definitions of Operating Margin and cost of sales.
The GAAP measure most comparable to Adjusted Operating Margin is Operating Margin. We believe that Adjusted Operating Margin better reflects the underlying business performance of the Company. Factors in this determination include the impact of NCI, where AES consolidates the results of a subsidiary that is not wholly owned by the Company, as well as the variability due to unrealized derivatives gains or losses. Adjusted Operating Margin should not be construed as an alternative to Operating Margin, which is determined in accordance with GAAP.
| Reconciliation of Adjusted Operating Margin (in millions) | Years Ended December 31, | ||||||||||
| 2016 | 2015 | 2014 | |||||||||
| Operating Margin | $ | 2,433 | $ | 2,858 | $ | 2,980 | |||||
| Noncontrolling Interests Adjustment | (689 | ) | (869 | ) | (760 | ) | |||||
| Derivatives Adjustment | 9 | 19 | 8 | ||||||||
| Total Adjusted Operating Margin | $ | 1,753 | $ | 2,008 | $ | 2,228 |
Adjusted PTC
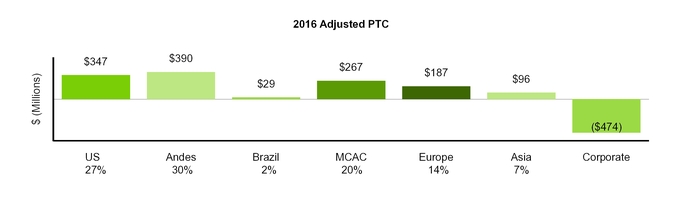
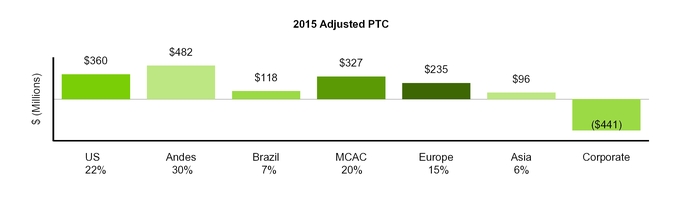
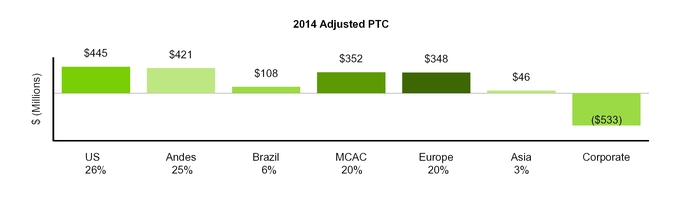
We define Adjusted PTC as pretax income from continuing operations attributable to The AES Corporation excluding gains or losses due to (a) unrealized gains or losses related to derivative transactions, (b) unrealized foreign currency gains or losses, (c) gains or losses due to dispositions and acquisitions of business interests, (d) losses due to impairments, and (e) costs due to the early retirement of debt. Adjusted PTC also includes net equity in earnings of affiliates on an after-tax basis adjusted for the same gains or losses excluded from consolidated entities.
Adjusted PTC reflects the impact of NCI and excludes the items specified in the definition above. In addition to the revenue and cost of sales reflected in Operating Margin, Adjusted PTC includes the other components of our income statement, such as general and administrative expense in the corporate segment, as well as business development costs; interest expense and interest income; other expense and other income; realized foreign currency transaction gains and losses; and net equity in earnings of affiliates.
The GAAP measure most comparable to Adjusted PTC is income from continuing operations attributable to The AES Corporation. We believe that Adjusted PTC better reflects the underlying business performance of the Company and is considered in the Company's internal evaluation of financial performance. Factors in this determination include the variability due to unrealized gains or losses related to derivative transactions, unrealized foreign currency gains or losses, losses due to impairments and strategic decisions to dispose of or acquire business interests or retire debt, which affect results in a given period or periods. In addition, earnings before tax represents the business performance of the Company before the application of statutory income tax rates and tax adjustments, including the effects of tax planning, corresponding to the various jurisdictions in which the Company operates. Adjusted PTC should not be construed as an alternative to income from continuing operations attributable to The AES Corporation, which is determined in accordance with GAAP.
| Reconciliation of Adjusted PTC (in millions) | Years Ended December 31, | ||||||||||
| 2016 | 2015 | 2014 | |||||||||
| Income from continuing operations, net of tax, attributable to The AES Corporation | $ | 8 | $ | 331 | $ | 705 | |||||
| Income tax (benefit) expense attributable to The AES Corporation | (148 | ) | 275 | 179 | |||||||
| Pretax contribution | (140 | ) | 606 | 884 | |||||||
| Unrealized derivative (gains) losses | (9 | ) | (166 | ) | (135 | ) | |||||
| Unrealized foreign currency losses | 23 | 96 | 110 | ||||||||
| Disposition/acquisition (gains) losses | 6 | (42 | ) | (361 | ) | ||||||
| Impairment losses | 933 | 504 | 415 | ||||||||
| Loss on extinguishment of debt | 29 | 179 | 274 | ||||||||
| Total Adjusted PTC | $ | 842 | $ | 1,177 | $ | 1,187 |
Adjusted EPS
We define Adjusted EPS as diluted earnings per share from continuing operations excluding gains or losses of both consolidated entities and entities accounted for under the equity method due to (a) unrealized gains or losses related to derivative transactions, (b) unrealized foreign currency gains or losses, (c) gains or losses due to dispositions and acquisitions of business interests, (d) losses due to impairments, and (e) costs due to the early retirement of debt.
The GAAP measure most comparable to Adjusted EPS is diluted earnings per share from continuing operations. We believe that Adjusted EPS better reflects the underlying business performance of the Company and is considered in the Company's internal evaluation of financial performance. Factors in this determination include the variability due to unrealized gains or losses related to derivative transactions, unrealized foreign currency gains or losses, losses due to impairments and strategic decisions to dispose of or acquire business interests or retire debt, which affect results in a given period or periods. Adjusted EPS should not be construed as an alternative to diluted earnings per share from continuing operations, which is determined in accordance with GAAP.
| Adjusted EPS | Years Ended December 31, | |||||||||||
| 2016 | 2015 | 2014 | ||||||||||
| Diluted earnings per share from continuing operations | $ | — | $ | 0.48 | $ | 0.97 | ||||||
| Unrealized derivative gains | (0.02 | ) | (0.24 | ) | (0.19 | ) | ||||||
| Unrealized foreign currency losses | 0.04 | 0.14 | 0.16 | |||||||||
| Disposition/acquisition (gains) losses | 0.01 | (1) | (0.06 | ) | (2) | (0.50 | ) | (3) | ||||
| Impairment losses | 1.41 | (4) | 0.73 | (5) | 0.57 | (6) | ||||||
| Loss on extinguishment of debt | 0.05 | (7) | 0.26 | (8) | 0.38 | (9) | ||||||
| Less: Net income tax benefit | (0.51 | ) | (10) | (0.06 | ) | (11) | (0.21 | ) | (12) | |||
| Adjusted EPS | $ | 0.98 | $ | 1.25 | $ | 1.18 |
| (1) | Amount primarily relates to the loss on deconsolidation of UK Wind of $20 million, or $0.03 per share and losses associated with the sale of Sul of $10 million, or $0.02; partially offset by the gain on sale of DPLER of $22 million, or $0.03 per share. |
| (2) | Amount primarily relates to the gains on the sale of Armenia Mountain of $22 million, or $0.03 per share and from the sale of Solar Spain and Solar Italy of $7 million, or $0.01 per share. |
| (3) | Amount primarily relates to the gain on the sale of a noncontrolling interest in Masinloc of $283 million, or $0.39 per share; and the gain from the sale of the U.K. wind projects of $78 million, or $0.11 per share. |
| (4) | Amount primarily relates to asset impairments at DPL of $859 million, or $1.30 per share; $159 million at Buffalo Gap II ($49 million, or $0.07 per share, net of NCI); and $77 million at Buffalo Gap I ($23 million, or $0.03 per share, net of NCI). |
| (5) | Amount primarily relates to the goodwill impairment at DPL of $317 million, or $0.46 per share, and asset impairments at Kilroot of $121 million ($119 million, or $0.17 per share, net of NCI), at Buffalo Gap III of $116 million ($27 million, or $0.04 per share, net of NCI), and at U.K. Wind (Development Projects) of $38 million ($30 million, or $0.04 per share, net of NCI). |
| (6) | Amount primarily relates to the goodwill impairments at DPLER of $136 million, or $0.19 per share, and at Buffalo Gap I & II of $28 million, or $0.04 per share; and asset impairments at Ebute of $67 million ($64 million, or $0.09 per share, net of NCI), at Elsta of $41 million, or $0.06 per share; and the other-than-temporary impairments at Entek of $86 million, $0.12 per share and at Silver Ridge Power of $42 million, or $0.06 per share. |
| (7) | Amount primarily relates to the loss on early retirement of debt at the Parent Company of $19 million, or $0.03 per share. |
| (8) | Amount primarily relates to the loss on early retirement of debt at the Parent Company of $116 million, or $0.17 per share and at IPL of $22 million ($17 million, or $0.02 per share, net of NCI). |
| (9) | Amount primarily relates to the loss on early retirement of debt at the Parent Company of $200 million, or $0.28 per share, at DPL of $31 million, or $0.04 per share, at Angamos of $20 million ($14 million, or $0.02 per share, net of NCI) and at U.K. wind projects of $18 million, or $0.02 per share. |
| (10) | Amount primarily relates to the per share income tax benefit associated with asset impairment of $332 million, or $0.50 per share in the twelve months ended December 31, 2016. |
| (11) | Amount primarily relates to the per share income tax benefit associated with losses on extinguishment of debt of $55 million, or $0.08 per share in the twelve months ended December 31, 2015. |
| (12) | Amount primarily relates to the per share income tax benefit associated with losses on extinguishment of debt of $90 million, or $0.12 per share and dispositions/acquisitions of $67 million, or $0.09 per share in the twelve months ended December 31, 2014. |
Proportional Free Cash Flow
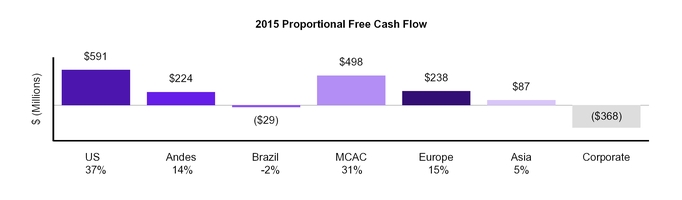
We define proportional free cash flow as cash flows from operating activities less maintenance capital expenditures (including non-recoverable environmental capital expenditures), adjusted for the estimated impact of noncontrolling interests. The proportionate share of cash flows and related adjustments attributable to noncontrolling interests in our subsidiaries comprise the proportional adjustment factor presented in the reconciliation below. Upon the Company's adoption of the accounting guidance for service concession arrangements effective January 1, 2015, capital expenditures related to service concession assets that would have been classified as investing activities on the Consolidated Statement of Cash Flows are now classified as operating activities. See Note 1—General and Summary of Significant Accounting Policies of this Form 10-K for further information on the adoption of this guidance.
Beginning in the quarter ended March 31, 2015, the Company changed the definition of proportional free cash flow to exclude the cash flows for capital expenditures related to service concession assets that are now classified within net cash provided by operating activities on the Consolidated Statement of Cash Flows. The proportional adjustment factor for these capital expenditures is presented in the reconciliation below.
We also exclude environmental capital expenditures that are expected to be recovered through regulatory, contractual or other mechanisms. An example of recoverable environmental capital expenditures is IPL's investment in MATS-related environmental upgrades that are recovered through a tracker. See Item 1.—US SBU—IPL—Environmental Matters for details of these investments.
The GAAP measure most comparable to proportional free cash flow is cash flows from operating activities. We believe that proportional free cash flow better reflects the underlying business performance of the Company, as it measures the cash generated by the business, after the funding of maintenance capital expenditures, that may be available for investing in growth opportunities or repaying debt. Factors in this determination include the impact of noncontrolling interests, where AES consolidates the results of a subsidiary that is not wholly-owned by the Company.
The presentation of free cash flow has material limitations. Proportional free cash flow should not be construed as an alternative to cash from operating activities, which is determined in accordance with GAAP. Proportional free cash flow does not represent our cash flow available for discretionary payments because it excludes certain payments that are required or to which we have committed, such as debt service requirements and dividend payments. Our definition of proportional free cash flow may not be comparable to similarly titled measures presented by other companies.
Beginning in the first quarter of 2017, we will no longer include these non-GAAP proportional free cash flow disclosures that have historically been provided and will instead disclose non-GAAP free cash flows only on a consolidated basis. Our use of proportional free cash flow was intended to provide investors with an understanding of the portion of free cash flows attributable to AES after the impact of non-controlling interests. However, since the concept of a non-controlling interest is not contemplated under GAAP with respect to the statement of cash flows, we will no longer be able to disclose proportional free cash flow in light of recent interpretive guidance issued by the SEC staff.
| Reconciliation of Proportional Free Cash Flow (in millions) | Years Ended December 31, | |||||||||||||||||||
| 2016 | 2015 | 2014 | 2016/2015 Change | 2015/2014 Change | ||||||||||||||||
| Net Cash Provided by Operating Activities | $ | 2,884 | $ | 2,134 | $ | 1,791 | $ | 750 | $ | 343 | ||||||||||
| Add: capital expenditures related to service concession assets (1) | 29 | 165 | — | (136 | ) | 165 | ||||||||||||||
| Adjusted Operating Cash Flow | 2,913 | 2,299 | 1,791 | 614 | 508 | |||||||||||||||
| Less: proportional adjustment factor on operating cash activities (2) (3) | (1,032 | ) | (558 | ) | (359 | ) | (474 | ) | (199 | ) | ||||||||||
| Proportional Adjusted Operating Cash Flow | 1,881 | 1,741 | 1,432 | 140 | 309 | |||||||||||||||
| Less: proportional maintenance capital expenditures, net of reinsurance proceeds (2) | (425 | ) | (449 | ) | (485 | ) | 24 | 36 | ||||||||||||
| Less: proportional non-recoverable environmental capital expenditures (2) (4) | (39 | ) | (51 | ) | (56 | ) | 12 | 5 | ||||||||||||
| Proportional Free Cash Flow | $ | 1,417 | $ | 1,241 | $ | 891 | $ | 176 | $ | 350 |
| (1) | Service concession asset expenditures are excluded from the proportional free cash flow non-GAAP metric. |
| (2) | The proportional adjustment factor, proportional maintenance capital expenditures (net of reinsurance proceeds) and proportional non-recoverable environmental capital expenditures are calculated by multiplying the percentage owned by noncontrolling interests for each entity by its corresponding consolidated cash flow metric and are totaled to the resulting figures. For example, Parent Company A owns 20% of Subsidiary Company B, a consolidated subsidiary. Thus, Subsidiary Company B has an 80% noncontrolling interest. Assuming a consolidated net cash flow from operating activities of $100 from Subsidiary B, the proportional adjustment factor for Subsidiary B would equal $80 (or $100 x 80%). The Company calculates the proportional adjustment factor for each consolidated business in this manner and then sums these amounts to determine the total proportional adjustment factor used in the reconciliation. The proportional adjustment factor may differ from the proportion of income attributable to noncontrolling interests as a result of (a) non-cash items which impact income but not cash and (b) AES' ownership interest in the subsidiary where such items occur. |
| (3) | Includes proportional adjustment amount for service concession asset expenditures of $15 million and $84 million for the years ended December 31, 2016 and 2015, respectively. The Company adopted service concession accounting effective January 1, 2015. |
| (4) | Excludes IPL's proportional recoverable environmental capital expenditures of $132 million, $205 million and $163 million for the years ended December 31, 2016, 2015 and 2014, respectively. |

Parent Free Cash Flow (a non-GAAP measure)
The Company defines Parent Free Cash Flow as dividends and other distributions received from our operating businesses less certain cash costs at the Parent Company level, primarily interest payments, overhead, and development costs. Parent Free Cash Flow is used to fund shareholder dividends, share repurchases, growth investments, recourse debt repayments, and other uses by the Parent Company. Refer to Item 1—Business—Overview for further discussion of the Parent Company's capital allocation strategy.
US SBU
A summary of Operating Margin, Adjusted Operating Margin, Adjusted PTC, and Proportional Free Cash Flow ($ in millions) is as follows:
| For the Years Ended December 31, | 2016 | 2015 | 2014 | $ Change 2016 vs. 2015 | $ Change 2015 vs. 2014 | % Change 2016 vs. 2015 | % Change 2015 vs. 2014 | |||||||||||||||||||
| Operating Margin | $ | 582 | $ | 621 | $ | 699 | $ | (39 | ) | $ | (78 | ) | -6 | % | -11 | % | ||||||||||
| Noncontrolling Interests Adjustment (1) | (75 | ) | (38 | ) | — | |||||||||||||||||||||
| Derivatives Adjustment | 6 | 15 | 12 | |||||||||||||||||||||||
| Adjusted Operating Margin | $ | 513 | $ | 598 | $ | 711 | $ | (85 | ) | $ | (113 | ) | -14 | % | -16 | % | ||||||||||
| Adjusted PTC | $ | 347 | $ | 360 | $ | 445 | $ | (13 | ) | $ | (85 | ) | -4 | % | -19 | % | ||||||||||
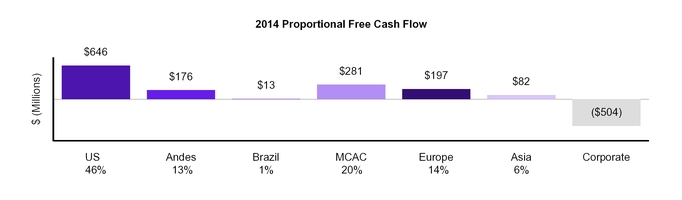
| Proportional Free Cash Flow | $ | 614 | $ | 591 | $ | 646 | $ | 23 | $ | (55 | ) | 4 | % | -9 | % |
| (1) | See Item 1. Business for the respective ownership interest for key business. In addition, AES owns 70% of IPL as of March 2016 compared to 75% beginning April 2015, 85% beginning in February 2015 and 100% prior to February 2015. |
Fiscal year 2016 versus 2015
Operating margin decreased $39 million, or 6%, which was driven primarily by the following:
| US Generation | |||
| Southland related to an increase in depreciation expense as a result of a change in estimated useful lives of the plants | $ | (17 | ) |
| Impact from sale of Armenia Mountain in July 2015 | (10 | ) | |
| Warrior Run due to lower availability and higher maintenance cost primarily due to major outages in 2016 | (8 | ) | |
| Laurel Mountain due to lower regulation dispatch as well as lower energy and regulation pricing | (8 | ) | |
| Other | (4 | ) | |
| Total US Generation Decrease | (47 | ) | |
| DPL | |||
| Impact of lower wholesale prices and completion of DP&L’s transition to a competitive-bid market | (42 | ) | |
| Decrease in RTO capacity and other revenues primarily due to lower capacity cleared in the auction | (21 | ) | |
| Lower depreciation expense due to June 2016 fixed asset impairment and decrease in generating facility maintenance and other expenses | 17 | ||
| Other | 2 | ||
| Total DPL Decrease | (44 | ) | |
| IPL | |||
| Higher retail margin driven by environmental revenues and higher rates due to a new rate order | 36 | ||
| Change in accrual resulting from the implementation of new rates | 18 | ||
| Other | (2 | ) | |
| Total IPL Increase | 52 | ||
| Total US SBU Operating Margin Decrease | $ | (39 | ) |
Adjusted Operating Margin decreased $85 million for the US SBU due to the drivers above, excluding the impact of unrealized derivative gains and losses and adjusted for the impact of noncontrolling interests.
Adjusted PTC decreased $13 million driven by the decrease of $85 million in Adjusted Operating Margin described above, partially offset by a gain on contract termination at DP&L, lower interest expense at DPL and IPL in part due to the sell-down impacts as discussed above and the impact of HLBV at our Distributed Energy business as a result of new projects achieving COD in 2016.
Proportional Free Cash Flow increased $23 million, primarily driven by a $93 million decrease in coal purchases due to the ongoing conversion of coal generation assets to natural gas at IPL, a build-up of inventory due to mild winter weather in December 2015, and inventory optimization efforts at DPL. Additionally, Proportional Free Cash Flow benefited from a $32 million increase in accounts payable due to the timing of vendor payments, $17 million in net settlements of accounts receivable primarily resulting from the sale of DPLER in 2016, and lower interest payments of $19 million due to timing and lower interest rates. These positive impacts were partially offset by an $81 million decrease in Adjusted Operating Margin (net of non-cash impacts of $4 million, primarily related to the implementation of IPL’s new rates and depreciation), and a $84 million decrease in the timing of receivables collections resulting primarily from higher rates at IPL, more favorable weather in 2016, and the impact of DPLER’s declining customer base in 2015.
Fiscal year 2015 versus 2014
Operating margin decreased by $78 million, or 11%, which was driven primarily by the following:
| DPL | |||
| Impact of more of DP&L's generation being sold in the wholesale market at lower prices in 2015 compared to supplying DP&L retail customers in 2014, lower generation driven by plant outages in 2015, and unfavorable weather; partially offset by the impact of outages and lower gas availability occurring in Q1 2014 | $ | (53 | ) |
| Increase in capacity margin due to increase in PJM capacity price | 26 | ||
| Total DPL Decrease | (27 | ) | |
| US Generation | |||
| Lower production and prices across the US Wind businesses | (20 | ) | |
| Lower availability and dispatch at Hawaii | (10 | ) | |
| Other | 4 | ||
| Total US Generation Decrease | (26 | ) | |
| IPL | |||
| Lower wholesale margin due to lower market prices of electricity and outages | (26 | ) | |
| Higher fixed costs primarily due to higher maintenance expense attributed to plant outages and higher depreciation expense due to MATS assets | (18 | ) | |
| Higher retail margins | 20 | ||
| Other | (1 | ) | |
| Total IPL Decrease | (25 | ) | |
| Total US SBU Operating Margin Decrease | $ | (78 | ) |
Adjusted Operating Margin decreased $113 million at the US SBU due to the drivers above, excluding the
impact of unrealized derivative gains and losses and adjusted for the impact of noncontrolling interests.
Adjusted PTC decreased $85 million driven by the decrease of $113 million in Adjusted Operating Margin described above as well as a decrease in the Company's share of earnings under the HLBV allocation of noncontrolling interest at Buffalo Gap, partially offset by IPL due to lower interest expense related to the impact of the sell down and increased AFUDC, and DPL due to lower interest expense.
Proportional Free Cash Flow decreased $55 million, primarily driven by the $113 million decrease in Adjusted Operating Margin described above, and a $22 million increase in maintenance and non-recoverable capital expenditures. These negative impacts were partially offset by a $22 million increase due to the collection of previously deferred storm costs, a one-time payment of $19 million in 2014 to terminate an unfavorable coal contract, higher collections of $16 million due to settlement of a receivable balance related to the sale of MC2 in 2015, and the timing of inventory payments of $16 million at DPL. Additionally, Proportional Free Cash Flow was favorably impacted by the timing of power purchase payments of $7 million and the timing of $9 million of receivables collections at IPL.
ANDES SBU
A summary of Operating Margin, Adjusted Operating Margin, Adjusted PTC, and Proportional Free Cash Flow ($ in millions) is as follows:
| For the Years Ended December 31, | 2016 | 2015 | 2014 | $ Change 2016 vs. 2015 | $ Change 2015 vs. 2014 | % Change 2016 vs. 2015 | % Change 2015 vs. 2014 | |||||||||||||||||||
| Operating Margin | $ | 634 | $ | 618 | $ | 587 | $ | 16 | $ | 31 | 3 | % | 5 | % | ||||||||||||
| Noncontrolling Interests Adjustment (1) | (192 | ) | (152 | ) | (143 | ) | ||||||||||||||||||||
| Adjusted Operating Margin | $ | 442 | $ | 466 | $ | 444 | $ | (24 | ) | $ | 22 | -5 | % | 5 | % | |||||||||||
| Adjusted PTC | $ | 390 | $ | 482 | $ | 421 | $ | (92 | ) | $ | 61 | -19 | % | 14 | % | |||||||||||
| Proportional Free Cash Flow | $ | 264 | $ | 224 | $ | 176 | $ | 40 | $ | 48 | 18 | % | 27 | % |
| (1) | See Item 1. Business for the respective ownership interest for key business. In addition, AES owned 71% of Gener and Chivor prior to sell down effective December 2015 which resulted in ownership of 67%. The Alto Maipo (under construction) and Cochrane plants are owned 40%. |
Fiscal year 2016 versus 2015
Including the unfavorable impact of foreign currency translation and remeasurement of $36 million, operating margin increased $16 million, or 3%, which was driven primarily by the following:
| Gener | |||
| Lower spot prices on energy and fuel purchases | $ | 82 | |
| Start of operations of Cochrane Plant | 36 | ||
| Other | (3 | ) | |
| Total Gener Increase | 115 | ||
| Argentina | |||
| Higher rates driven by annual price review granted by Resolution 22/2016 | 61 | ||
| Lower availability mainly associated with planned major maintenance | (20 | ) | |
| Higher fixed costs primarily driven by higher inflation and by higher maintenance cost | (44 | ) | |
| Unfavorable FX remeasurement impacts | (21 | ) | |
| Total Argentina Decrease | (24 | ) | |
| Chivor | |||
| Higher volume of energy sales to Spot Market | 14 | ||
| Unfavorable FX remeasurement impacts | (15 | ) | |
| Lower spot sales prices | (72 | ) | |
| Other | (2 | ) | |
| Total Chivor Decrease | (75 | ) | |
| Total Andes SBU Operating Margin Increase | $ | 16 |
Adjusted Operating Margin decreased $24 million for the year due to the drivers above, adjusted for the impact of noncontrolling interests.
Adjusted PTC decreased $92 million, driven by the decrease in Equity Earnings of $54 million mainly related to Guacolda’s reorganization in September 2015, the decrease of $24 million in Adjusted Operating Margin and the increase of $12 million in interest expense primarily associated to lower interest capitalization after beginning of commercial operations at Cochrane.
Proportional Free Cash Flow increased $40 million, primarily driven by $57 million in collections of financing receivables and the timing of maintenance remuneration from CAMMESSA in Argentina, a $25 million positive impact related to a one-time interest rate swap termination payment at Ventanas in July 2015, a decrease of $58 million in working capital requirements at Chivor mainly related to collections of prior period sales, and a $23 million reduction in proportional maintenance and non-recoverable capital expenditures due to lower expenditures on
emissions control equipment at Chile. These positive impacts were partially offset by a reduction of $4 million in Adjusted Operating Margin (net of non-cash impacts), $43 million of lower VAT refunds related to our Cochrane and Alto Maipo construction projects, higher net tax payments of $56 million primarily related to withholding taxes paid on Chilean distributions to AES Affiliates and higher taxable income in Colombia, and $18 million of higher interest payments primarily as a consequence of debt refinancing at higher interest rates and lower interest capitalization under construction projects.
Fiscal year 2015 versus 2014
Including the unfavorable impact of foreign currency translation and remeasurement of $87 million, operating margin increased $31 million, or 5%, which was driven primarily by the following:
| Gener | |||
| Higher margins associated to Nueva Renca Plant tolling agreement | $ | 26 | |
| Higher volume of energy sales mainly related to higher availability | 21 | ||
| Other | (2 | ) | |
| Total Gener Increase | 45 | ||
| Argentina | |||
| Higher rates driven by an annual price review and additional contributions introduced by Resolution 482 | 49 | ||
| Higher fixed costs primarily driven by higher inflation and by higher maintenance cost | (45 | ) | |
| Unfavorable FX remeasurement impacts | (4 | ) | |
| Other | 4 | ||
| Total Argentina Increase | 4 | ||
| Chivor | |||
| Unfavorable FX remeasurement impacts | (83 | ) | |
| Higher rates driven by a strong El Niño impact on prices | 60 | ||
| Higher volume of energy sales mainly associated to higher generation | 12 | ||
| Other | (7 | ) | |
| Total Chivor Decrease | (18 | ) | |
| Total Andes SBU Operating Margin Increase | $ | 31 |
Adjusted Operating Margin increased $22 million for the year due to the drivers above, adjusted for the impact of noncontrolling interests.
Adjusted PTC increased $61 million driven by a restructuring of Guacolda in Chile which increased our equity investment and resulted in additional Equity Earnings of $46 million as well as realized FX gains, lower interest expense at Chivor and the $22 million in Adjusted Operating Margin described above. This was partially offset by lower equity earnings at Guacolda of $16 million (excluding restructuring impact above) mainly driven by a 2014 gain on sale of a transmission line.
Proportional Free Cash Flow increased $48 million, primarily driven by $107 million higher VAT refunds at Cochrane and Alto Maipo, $27 million of non-recurring maintenance collections in Argentina, and a $17 million decrease in interest payments. These positive impacts were partially offset by $49 million of higher tax payments and $25 million of lower collections primarily from contract customers at Chivor, and a $25 million impact related to a one-time interest rate swap termination payment at Ventanas in July 2015.
BRAZIL SBU
A summary of Operating Margin, Adjusted Operating Margin, Adjusted PTC, and Proportional Free Cash Flow ($ in millions) is as follows:
| For the Years Ended December 31, | 2016 | 2015 | 2014 | $ Change 2016 vs. 2015 | $ Change 2015 vs. 2014 | % Change 2016 vs. 2015 | % Change 2015 vs. 2014 | |||||||||||||||||||
| Operating Margin | $ | 239 | $ | 592 | $ | 634 | $ | (353 | ) | $ | (42 | ) | -60 | % | -7 | % | ||||||||||
| Noncontrolling Interests Adjustment (1) | (190 | ) | (464 | ) | (507 | ) | ||||||||||||||||||||
| Adjusted Operating Margin | $ | 49 | $ | 128 | $ | 127 | $ | (79 | ) | $ | 1 | -62 | % | 1 | % | |||||||||||
| Adjusted PTC | $ | 29 | $ | 118 | $ | 108 | $ | (89 | ) | $ | 10 | -75 | % | 9 | % | |||||||||||
| Proportional Free Cash Flow | $ | 110 | $ | (29 | ) | $ | 13 | $ | 139 | $ | (42 | ) | 479 | % | -323 | % |
| (1) | See Item 1. Business for the respective ownership interest for key business. |
Fiscal year 2016 versus 2015
Including the unfavorable impact of foreign currency translation of $6 million, operating margin decreased $353 million, or 60%, which was driven primarily by the following:
| Tietê | |||
| Lower rates for energy sold under new contracts | $ | (239 | ) |
| Unfavorable FX impacts | (14 | ) | |
| Higher fixed costs due to higher legal settlements | (13 | ) | |
| Lower rates for energy purchases mainly due to decrease in spot market prices | 78 | ||
| Other | (2 | ) | |
| Total Tietê Decrease | (190 | ) | |
| Eletropaulo | |||
| Negative impact of reversal of contingent regulatory liability in 2015 | (97 | ) | |
| Higher fixed costs mainly due to higher bad debt and employee-related costs | (68 | ) | |
| Lower demand mainly due to economic decline | (59 | ) | |
| Higher regulatory penalties in 2016 partially offset by regulatory penalties contingency provision in 2015 | (30 | ) | |
| Higher tariffs | 116 | ||
| Other | (3 | ) | |
| Total Eletropaulo Decrease | (141 | ) | |
| Uruguaiana | |||
| Operations in 2015 compared to not operating in 2016 | (20 | ) | |
| Total Uruguaiana Decrease | (20 | ) | |
| Other Business Drivers | (2 | ) | |
| Total Brazil SBU Operating Margin Decrease | $ | (353 | ) |
Adjusted Operating Margin decreased $79 million primarily due to the drivers discussed above, adjusted for the impact of noncontrolling interests.
Adjusted PTC decreased $89 million, driven by the decrease of $79 million in Adjusted Operating Margin described above as well as higher interest expense of $10 million related to the reversal of a contingent regulatory liability at Eletropaulo in 2015.
Proportional Free Cash Flow increased by $139 million, primarily driven by favorable timing of $309 million in net collections of higher costs deferred in net regulatory assets in the prior year at Eletropaulo and Sul as a result of unfavorable hydrology in prior periods, favorable timing of $133 million in collections on current year energy sales, and lower energy purchases of $23 million at Tietê due to favorable hydrology. These positive impacts were partially offset by unfavorable timing of $241 million in payments for energy purchases and regulatory charges at Eletropaulo and Sul, and a $72 million decrease in in Adjusted Operating Margin (net of $7 million in non-cash impacts, primarily due to the reversal of a contingent regulatory liability at Eletropaulo in 2015).
Fiscal year 2015 versus 2014
Including the unfavorable impact of foreign currency translation of $228 million, operating margin decreased $42 million, or 7%, which was driven primarily by the following:
| Tietê | |||
| Energy purchases at lower rates primarily due to lower spot prices | $ | 311 | |
| Unfavorable FX impacts | (152 | ) | |
| Higher volume purchased on the spot market due to higher assured energy requirement | (113 | ) | |
| Other | (8 | ) | |
| Total Tietê Increase | 38 | ||
| Uruguaiana | |||
| Higher generation from a longer period of temporary restart of operations | 11 | ||
| Total Uruguaiana Increase | 11 | ||
| Eletropaulo | |||
| Higher fixed costs, primarily due to higher bad debt expense, storms and employee-related costs | (142 | ) | |
| Unfavorable FX impacts | (74 | ) | |
| Contingency related to performance indicators | (59 | ) | |
| Lower volumes due to lower demand | (35 | ) | |
| Reversal of a contingent regulatory liability (excluding FX) | 135 | ||
| Higher tariffs | 82 | ||
| Total Eletropaulo Decrease | (93 | ) | |
| Other Business Drivers | 2 | ||
| Total Brazil SBU Operating Margin Decrease | $ | (42 | ) |
Adjusted Operating Margin increased $1 million primarily due to the drivers discussed above, adjusted for the impact of noncontrolling interests.
Adjusted PTC increased $10 million, driven by the increase of $1 million in Adjusted Operating Margin described above as well as favorable net interest income recognized on receivables at Eletropaulo.
Proportional Free Cash Flow decreased by $42 million, primarily driven by a $99 million decrease in Sul's Adjusted Operating Margin classified as a discontinued operation (not included in the $1 million increase in Adjusted Operating Margin described above), higher energy purchases of $59 million at Tietê due to the timing of purchases in the spot market at higher prices, unfavorable timing of $32 million of higher costs deferred in net regulatory assets at Sul as result of unfavorable hydrology, and $17 million of higher interest payments at Sul due to a higher debt balance and higher interest rate. These negative impacts were partially offset by favorable timing of $121 million in payments for energy purchases and regulatory charges at Eletropaulo and Sul, $31 million of lower income tax payments at Tietê, and favorable timing of $14 million in net collections of higher costs deferred in net regulatory assets in the prior year at Eletropaulo.
MCAC SBU
A summary of Operating Margin, Adjusted Operating Margin, Adjusted PTC, and Proportional Free Cash Flow ($ in millions) is as follows:
| For the Years Ended December 31, | 2016 | 2015 | 2014 | $ Change 2016 vs. 2015 | $ Change 2015 vs. 2014 | % Change 2016 vs. 2015 | % Change 2015 vs. 2014 | |||||||||||||||||||
| Operating Margin | $ | 523 | $ | 543 | $ | 541 | $ | (20 | ) | $ | 2 | -4 | % | — | % | |||||||||||
| Noncontrolling Interests Adjustment (1) | (108 | ) | (106 | ) | (59 | ) | ||||||||||||||||||||
| Derivatives Adjustment | (2 | ) | 1 | — | ||||||||||||||||||||||
| Adjusted Operating Margin | $ | 413 | $ | 438 | $ | 482 | $ | (25 | ) | $ | (44 | ) | -6 | % | (9 | )% | ||||||||||
| Adjusted PTC | $ | 267 | $ | 327 | $ | 352 | $ | (60 | ) | $ | (25 | ) | -18 | % | (7 | )% | ||||||||||
| Proportional Free Cash Flow | $ | 168 | $ | 498 | $ | 281 | $ | (330 | ) | $ | 217 | -66 | % | 77 | % |
| (1) | See Item 1. Business for the respective ownership interest for key business. In addition, AES owned 92% of Andres and Los Mina and 46% of Itabo in the Dominican Republic until December 2015 when the ownership changed to 90% at Andres and Los Mina and 45% at Itabo. |
Fiscal year 2016 versus 2015
Operating margin decreased $20 million, or 4%, which was driven primarily by the following:
| Mexico | |||
| Lower availability and related costs | $ | (11 | ) |
| Other | (6 | ) | |
| Total Mexico Decrease | (17 | ) | |
| El Salvador | |||
| Higher fixed costs | (6 | ) | |
| Lower energy sales margin | (4 | ) | |
| Total El Salvador Decrease | (10 | ) | |
| Panama | |||
| Expenses related to the ongoing construction of a natural gas generation plant and a liquefied natural gas terminal | (19 | ) | |
| Commencement of power barge operations at the end of March 2015 | 13 | ||
| Other | (3 | ) | |
| Total Panama Decrease | (9 | ) | |
| Dominican Republic | |||
| Higher contracted and spot energy sales | 24 | ||
| Total Dominican Republic Increase | 24 | ||
| Other Business Drivers | (8 | ) | |
| Total MCAC SBU Operating Margin Decrease | $ | (20 | ) |
Adjusted Operating Margin decreased $25 million due to the drivers above, adjusted for the impact of noncontrolling interests and excluding unrealized gains and losses on derivatives.
Adjusted PTC decreased $60 million, driven by the decrease in Adjusted Operating Margin of $25 million as described above as well as a 2015 compensation agreement regarding early termination of the original Barge PPA of $10 million and a $26 million allowance recognized in 2016 at Puerto Rico.
Proportional Free Cash Flow decreased $330 million, primarily driven by $212 million of lower collections in the Dominican Republic mainly due to collections of overdue receivables in September 2015, the $25 million decrease in Adjusted Operating Margin described above, $47 million of decreased collections in Puerto Rico due to lower sales, $14 million of higher tax payments in El Salvador due to higher taxable income in 2015, and a $10 million impact from compensation received in the prior-year from the off-taker in Panama related to an early termination of the barge PPA.
Fiscal year 2015 versus 2014
Operating margin increased $2 million, or 0.4%, which was driven primarily by the following:
| Panama | |||
| Higher generation and lower energy purchases, driven by improved hydrological conditions | $ | 118 | |
| Commencement of power barge operations at the end of March 2015 | 18 | ||
| Lower compensation from the government of Panama due to lower volumes of energy purchased at lower spot prices | (34 | ) | |
| Other | (6 | ) | |
| Total Panama Increase | 96 | ||
| El Salvador | |||
| One-time unfavorable adjustment to unbilled revenue in 2014 | 12 | ||
| Lower energy losses and higher demand | 11 | ||
| Total El Salvador Increase | 23 | ||
| Dominican Republic | |||
| Lower commodity prices resulting in lower spot prices and lower than expected gas sales demand with excess gas used for generation at lower margins | (29 | ) | |
| Lower availability | (28 | ) | |
| Lower frequency regulation revenues | (21 | ) | |
| Total Dominican Republic Decrease | (78 | ) | |
| Puerto Rico | |||
| One-time reversal of bad debt in 2014 and higher maintenance expense | (11 | ) | |
| Total Puerto Rico Decrease | (11 | ) | |
| Mexico | |||
| Higher fuel costs, lower spot sales and lower availability | (29 | ) | |
| Total Mexico Decrease | (29 | ) | |
| Other Business Drivers | 1 | ||
| Total MCAC SBU Operating Margin Increase | $ | 2 |
Adjusted Operating Margin decreased $44 million due to the drivers above adjusted for the impact of noncontrolling interests and excluding unrealized gains and losses on derivatives.
Adjusted PTC decreased $25 million, driven by the decrease in Adjusted Operating Margin of $44 million described above. These results were partially offset by a compensation agreement regarding early termination of the original Barge PPA of $10 million and 2014 losses on a legal dispute settlement of $4 million in Panama as well as lower interest expense due to lower debt at Puerto Rico.
Proportional Free Cash Flow increased $217 million, primarily due to the favorable timing of $220 million of collections, mainly related to the collection of overdue receivables in the Dominican Republic in September 2015. Proportional Free Cash Flow also benefited from a $17 million impact of lower energy purchases in El Salvador due to lower fuel prices, and a $10 million impact from compensation received from the off-taker in Panama related to an early termination of the barge PPA. These favorable impacts were partially offset by the $44 million decrease in Adjusted Operating Margin as described above.
EUROPE SBU
A summary of Operating Margin, Adjusted Operating Margin, Adjusted PTC, and Proportional Free Cash Flow ($ in millions) is as follows:
| For the Years Ended December 31, | 2016 | 2015 | 2014 | $ Change 2016 vs. 2015 | $ Change 2015 vs. 2014 | % Change 2016 vs. 2015 | % Change 2015 vs. 2014 | |||||||||||||||||||
| Operating Margin | $ | 259 | $ | 303 | $ | 403 | $ | (44 | ) | $ | (100 | ) | -15 | % | -25 | % | ||||||||||
| Noncontrolling Interests Adjustment (1) | (33 | ) | (30 | ) | (26 | ) | ||||||||||||||||||||
| Derivatives Adjustment | (1 | ) | 3 | (4 | ) | |||||||||||||||||||||
| Adjusted Operating Margin | $ | 225 | $ | 276 | $ | 373 | $ | (51 | ) | $ | (97 | ) | -18 | % | -26 | % | ||||||||||
| Adjusted PTC | $ | 187 | $ | 235 | $ | 348 | $ | (48 | ) | $ | (113 | ) | -20 | % | -32 | % | ||||||||||
| Proportional Free Cash Flow | $ | 552 | $ | 238 | $ | 197 | $ | 314 | $ | 41 | 132 | % | 21 | % |
| (1) | See Item 1. Business for the respective ownership interest for key business. |
Fiscal year 2016 versus 2015
Including the unfavorable impact of foreign currency translation of $36 million, operating margin decreased $44 million, or 15%, which was driven primarily by the following:
| Kazakhstan | |||
| Unfavorable FX impact due to KZT depreciation against USD | $ | (29 | ) |
| Other | (1 | ) | |
| Total Kazakhstan Decrease | (30 | ) | |
| Maritza | |||
| Lower contracted capacity prices due to PPA amendment | (18 | ) | |
| Other | (2 | ) | |
| Total Maritza Decrease | (20 | ) | |
| Ballylumford | |||
| Higher contracted revenues | 27 | ||
| Lower plant capacity resulting from the retirement of one generation facility | (21 | ) | |
| Total Ballylumford Increase | 6 | ||
| Total Europe SBU Operating Margin Decrease | $ | (44 | ) |
Adjusted Operating Margin decreased $51 million due to the drivers above adjusted for noncontrolling interests and excluding unrealized gains and losses on derivatives.
Adjusted PTC decreased $48 million, driven primarily by the decrease of $51 million in Adjusted Operating Margin described above.
Proportional Free Cash Flow increased $314 million, primarily driven by $360 million of increased collections at Maritza from NEK, net of payments to the fuel supplier (MMI), and a decrease in maintenance and non-recoverable environmental capital expenditures of $21 million. These favorable increases were partially offset by the $51 million decrease in Adjusted Operating Margin and a $24 million decrease in CO2 allowances due to a price decrease.
Fiscal year 2015 versus 2014
Including the unfavorable impact of foreign currency translation of $47 million, operating margin decreased $100 million, or 25%, which was driven primarily by the following:
| Maritza | |||
| Unfavorable FX impacts due to Euro depreciation against USD | $ | (30 | ) |
| Lower rates due to non-operating costs passed through the tariff | (8 | ) | |
| Higher availability in 2015 | 8 | ||
| Total Maritza Decrease | (30 | ) | |
| Kilroot | |||
| Lower dispatch and lower market prices due to gas/coal spread as well as lower capacity prices | (23 | ) | |
| Higher fixed costs primarily driven by maintenance cost due to timing of outages | (3 | ) | |
| Lower depreciation due to impairment in Q3 2015 | 7 | ||
| Other | 1 | ||
| Total Kilroot Decrease | (18 | ) | |
| Ballylumford | |||
| Lower availability and lower capacity prices | (8 | ) | |
| Write down of non-primary fuel inventory | (4 | ) | |
| Total Ballylumford Decrease | (12 | ) | |
| Other | |||
| Reduction due to the sale of Ebute in 2014 | (34 | ) | |
| Lower Heat Rate margin at Jordan | (6 | ) | |
| Total Other Decrease | (40 | ) | |
| Total Europe SBU Operating Margin Decrease | $ | (100 | ) |
Adjusted Operating Margin decreased $97 million due to the drivers above adjusted for noncontrolling interests and excluding unrealized gains and losses on derivatives.
Adjusted PTC decreased $113 million, driven by the decrease of $97 million in Adjusted Operating Margin described above, and by higher depreciation and unfavorable FX impact from Elsta as well as unfavorable impact due to the reversal of a liability in 2014 in Kazakhstan. These results partially offset by lower interest expenses in Bulgaria.
Proportional Free Cash Flow increased $41 million, primarily driven by $69 million of increased collections at Maritza from NEK, net of payments to the fuel supplier (MMI), a $22 million benefit at IPP4 Jordan due to the commencement of operations in July 2014, and lower interest expense of $38 million due primarily to the sale of UK Wind in 2014. These favorable increases were partially offset by the $97 million decrease in Adjusted Operating
Margin described above.
ASIA SBU
A summary of Operating Margin, Adjusted Operating Margin, Adjusted PTC, and Proportional Free Cash Flow ($ in millions) is as follows:
| For the Years Ended December 31, | 2016 | 2015 | 2014 | $ Change 2016 vs. 2015 | $ Change 2015 vs. 2014 | % Change 2016 vs. 2015 | % Change 2015 vs. 2014 | |||||||||||||||||||
| Operating Margin | $ | 170 | $ | 149 | $ | 76 | $ | 21 | $ | 73 | 14 | % | 96 | % | ||||||||||||
| Noncontrolling Interests Adjustment (1) | (91 | ) | (79 | ) | (25 | ) | ||||||||||||||||||||
| Derivatives Adjustment | 1 | — | — | |||||||||||||||||||||||
| Adjusted Operating Margin | $ | 80 | $ | 70 | $ | 51 | $ | 10 | $ | 19 | 14 | % | 37 | % | ||||||||||||
| Adjusted PTC | $ | 96 | $ | 96 | $ | 46 | $ | — | $ | 50 | — | % | 109 | % | ||||||||||||
| Proportional Free Cash Flow | $ | 136 | $ | 87 | $ | 82 | $ | 49 | $ | 5 | 56 | % | 6 | % |
| (1) | See Item 1. Business for the respective ownership interest for key business. |
Fiscal year 2016 versus 2015
Operating margin increased $21 million, or 14%, which was driven primarily by the following:
| Mong Duong | |||
| Impact of full year operations for 2016 compared to commencement of principal operations in April 2015 | $ | 16 | |
| Total Mong Duong Increase | 16 | ||
| Other business drivers | 5 | ||
| Total Asia SBU Operating Margin Increase | $ | 21 |
Adjusted Operating Margin increased $10 million due to the drivers above adjusted for the impact of noncontrolling interests.
Adjusted PTC was neutral driven by the increase of $10 million in Adjusted Operating Margin described above offset by lower equity earnings at OPGC in India due to lower tariffs and the net impact of higher interest expense and higher interest income at Mong Duong.
Proportional Free Cash Flow increased $49 million, primarily driven by a decrease of $29 million in working capital requirements at Mong Duong due to a build up in the prior year in preparation for commencement of plant operations, and an increase in Adjusted Operating Margin of $35 million (net of non-cash service concession expense of $24 million). These positive impacts were partially offset by higher interest expense of $18 million as interest is no longer capitalized as part of service concession asset expenditures.
Fiscal year 2015 versus 2014
Operating margin increased $73 million, or 96%, which was driven primarily by the following:
| Masinloc | |||
| Higher availability | $ | 27 | |
| One-time unfavorable impact in 2014 due to market operator's retrospective adjustment to energy prices in Nov and Dec 2013 | 15 | ||
| Lower fixed costs and lower tax assessments in 2015 relative to 2014 | 7 | ||
| Other | 3 | ||
| Total Masinloc Increase | 52 | ||
| Mong Duong | |||
| Commencement of principal operations in April 2015 | 24 | ||
| Total Mong Duong Increase | 24 | ||
| Other Business Drivers | (3 | ) | |
| Total Asia SBU Operating Margin Increase | $ | 73 |
Adjusted Operating Margin increased $19 million due to the drivers above adjusted for the impact of noncontrolling interests.
Adjusted PTC increased $50 million, driven by the increase of $19 million in Adjusted Operating Margin described above, and the additional net impact of $28 million at Mong Duong due to a component of service concession revenue recognized as interest income, net of higher interest expense as interest is no longer capitalized. See Note 1—General and Summary of Significant Accounting Policies in Part II.—Item 8.—Financial Statements and Supplementary Data for further information regarding the accounting for service concession arrangements.
Proportional Free Cash Flow increased $5 million, primarily driven by an increase in Adjusted Operating Margin of $28 million (net of $9 million in non-cash items, primarily service concession expense and the
retrospective adjustment to energy prices noted above), and $58 million in higher interest income recognized at Mong Duong as a result of the financing component under service concession accounting. These positive impacts were partially offset by $26 million in higher working capital requirements at Mong Duong due to a build-up in preparation of the commencement of operations, $22 million in higher interest payments at Mong Duong, $11 million of higher tax payments at Masinloc, and $9 million in higher working capital requirements at Masinloc due primarily to the timing of coal purchases.
Key Trends and Uncertainties
During 2017 and beyond, we expect to face the following challenges at certain of our businesses. Management expects that improved operating performance at certain businesses, growth from new businesses and global cost reduction initiatives may lessen or offset their impact. If these favorable effects do not occur, or if the challenges described below and elsewhere in this section impact us more significantly than we currently anticipate, or if volatile foreign currencies and commodities move more unfavorably, then these adverse factors (or other adverse factors unknown to us) may impact our operating margin, net income attributable to The AES Corporation and cash flows. We continue to monitor our operations and address challenges as they arise. For the risk factors related to our business, see Item 1.—Business and Item 1A.—Risk Factors of this Form 10-K.
Macroeconomic and Political
During 2016, the political environments in some countries where our subsidiaries conduct business have changed which could result in significant impacts to tax laws, and environmental and energy policies. Additionally, we operate in multiple countries and as such are subject to volatility in exchange rates at the subsidiary level. See Item 7A.—Quantitative and Qualitative Disclosures About Market Risk for further information.
Brazil — President Michel Temer, with majority congressional support, continues to implement the fiscal reforms needed to improve the country’s finances. While uncertainty dominates the political arena, if enacted, President Temer's market reforms would improve the the economic outlook, which may benefit our businesses in Brazil.
In October 2016, AES completed the sale of the Company's 100% ownership interest in AES Sul and recognized an after-tax loss on disposal of $737 million. This after-tax loss excludes the impact of contingent proceeds linked to the favorable settlement of pending litigation, which is not guaranteed. If the case is decided in the Company's favor, amounts would be remitted to AES over an unknown period of time. Any potential gain from the eventual resolution of this contingency would be presented separately as Discontinued Operations.
United Kingdom — On June 23, 2016, the United Kingdom (U.K.) held a referendum in which voters approved an exit from the European Union (“E.U.”), commonly referred to as “Brexit”. As a result of the referendum, it is expected that the British government will begin negotiating the terms of the U.K.’s future relationship with the E.U. Although it is unclear what the long-term global implications will be, it is possible that the European or U.K. economy could weaken and our businesses may experience a decline in demand. While the full impact of the Brexit is uncertain, these changes may adversely affect our operations and financial results. The most immediate impact has been a devaluation of the pound and euro against the U.S. dollar. For 2016 and 2017, the Company has hedged against these foreign currency movements, however, the impact could be greater in future years.
Puerto Rico — Our subsidiaries in Puerto Rico have long term PPAs with state-owned PREPA. Due to the ongoing economic situation in the territory, PREPA faces significant financial challenges. There have been no significant adverse impacts to AES Puerto Rico due to PREPA’s financial challenges.
If PREPA continues to face challenges, or those challenges worsen, or otherwise impact PREPA’s ability to make payments to AES Puerto Rico, there could be a material impact on the Company.
United States of America — The outcome of the 2016 U.S. elections could result in significant changes to U.S. tax laws, and environmental and energy policies, the impact of which is uncertain.
Philippines — The outcome of the 2016 Philippines election could result in changes in policies towards the U.S., China or other nations the impact of which on our business is uncertain.
Foreign Exchange and Commodities
Our businesses are exposed to and proactively manage market risk. Our primary market risk exposure is to the price of commodities, particularly electricity, oil, natural gas, coal and environmental credits. In 2016, there were more than 50% improvement in both oil and natural gas prices, which had a positive impact on our businesses in the Dominican Republic, Ohio and Northern Ireland. Since we operate in multiple countries, we are subject to volatility in exchange rates at varying degrees at the subsidiary level and between our functional currency, the U.S.
Dollar, and currencies of the countries in which we operate. In 2016, we had a significant devaluation in the Argentine Peso. The Brazilian Real, Colombian Peso and Kazakhstani Tenge recovered during the year, but remain devalued as compared to the beginning of 2015, which had an offsetting impact on our 2016 results. For additional information, refer to Item 7A.—Quantitative and Qualitative Disclosures About Market Risk.
Alto Maipo
During 2016, the Alto Maipo project in Chile experienced technical difficulties in construction which resulted in an increase in projected costs of up to 22% over the original $2 billion budget. These additional costs have led to a series of negotiations with the main contractors, financiers and partners of the project, with the intention to restructure the existing financing and obtain additional financing to guarantee project completion. On January 19, 2017, the parties agreed on the basis of the restructuring process, including new project milestones. These agreements are subject to the negotiation and finalization of the specific restructuring terms and conditions; and the negotiation and approval of the terms and conditions of each of the financing documents. Currently, the Company's indirect equity interest in the project is 40%.
Impairments
Long-lived Assets — During the year ended December 31, 2016, the Company recognized asset impairment expense of $1.1 billion. Due to decreased wind production and a decline in forward power curves in 2016, the Company tested the recoverability of its long-lived assets at Buffalo Gap I, II, and III. After recognizing asset impairment expense of $236 million at Buffalo Gap I and II, the carrying value of the long-lived asset groups at Buffalo Gap I, II, and III totaled $242 million at December 31, 2016.
Additionally, the Company recognized an asset impairment expense of $859 million at DPL in 2016. After recognizing asset impairment expense at DPL, the carrying value of the long-lived asset groups at DPL, including those that were not impaired, totaled $498 million at December 31, 2016. See Note 20—Asset Impairment Expense in Item 8.—Financial Statements and Supplementary Data for further information regarding the impairments at Buffalo Gap and DPL.
Events or changes in circumstances that may necessitate further recoverability tests and potential impairments of long-lived assets may include, but are not limited to, adverse changes in the regulatory environment, unfavorable changes in power prices or fuel costs, increased competition due to additional capacity in the grid, technological advancements, declining trends in demand, or an expectation that it is more likely than not that the asset will be disposed of before the end of its previously estimated useful life.
Goodwill — The Company currently has no reporting units considered to be "at risk." A reporting unit is considered "at risk" when its fair value is not higher than its carrying amount by more than 10%. The Company monitors its reporting units at risk of Step 1 failure on an ongoing basis. It is possible that the Company may incur goodwill impairment charges at any reporting units containing goodwill in future periods if adverse changes in their business or operating environments occur. See Note 9—Goodwill and Other Intangible Assets in Item 8.—Financial Statements and Supplementary Data for further information.
Capital Resources and Liquidity
Overview — As of December 31, 2016, the Company had unrestricted cash and cash equivalents of $1.3 billion, of which $100 million was held at the Parent Company and qualified holding companies. The Company also had $798 million in short term investments, held primarily at subsidiaries. In addition, we had restricted cash and debt service reserves of $871 million. The Company also had non-recourse and recourse aggregate principal amounts of debt outstanding of $15.8 billion and $4.7 billion, respectively. Of the approximately $1.3 billion of our current non-recourse debt, $1.2 billion was presented as such because it is due in the next twelve months and $128 million relates to debt considered in default due to covenant violations. The defaults are not payment defaults, but are instead technical defaults triggered by failure to comply with other covenants and/or other conditions such as (but not limited to) failure to meet information covenants, complete construction or other milestones in an allocated time, meet certain minimum or maximum financial ratios, or other requirements contained in the non-recourse debt documents of the Company.
We expect such current maturities will be repaid from net cash provided by operating activities of the subsidiary to which the debt relates or through opportunistic refinancing activity or some combination thereof. None of our recourse debt matures within the next twelve months. From time to time, we may elect to repurchase our outstanding debt through cash purchases, privately negotiated transactions or otherwise when management believes that such securities are attractively priced. Such repurchases, if any, will depend on prevailing market conditions, our liquidity requirements and other factors. The amounts involved in any such repurchases may be material.
We rely mainly on long-term debt obligations to fund our construction activities. We have, to the extent available at acceptable terms, utilized non-recourse debt to fund a significant portion of the capital expenditures and investments required to construct and acquire our electric power plants, distribution companies and related assets. Our non-recourse financing is designed to limit cross default risk to the Parent Company or other subsidiaries and affiliates. Our non-recourse long-term debt is a combination of fixed and variable interest rate instruments. Generally, a portion or all of the variable rate debt is fixed through the use of interest rate swaps. In addition, the debt is typically denominated in the currency that matches the currency of the revenue expected to be generated from the benefiting project, thereby reducing currency risk. In certain cases, the currency is matched through the use of derivative instruments. The majority of our non-recourse debt is funded by international commercial banks, with debt capacity supplemented by multilaterals and local regional banks.
Given our long-term debt obligations, the Company is subject to interest rate risk on debt balances that accrue interest at variable rates. When possible, the Company will borrow funds at fixed interest rates or hedge its variable rate debt to fix its interest costs on such obligations. In addition, the Company has historically tried to maintain at least 70% of its consolidated long-term obligations at fixed interest rates, including fixing the interest rate through the use of interest rate swaps. These efforts apply to the notional amount of the swaps compared to the amount of related underlying debt. Presently, the Parent Company's only material un-hedged exposure to variable interest rate debt relates to indebtedness under its floating rate senior unsecured notes due 2019. On a consolidated basis, of the Company's $20.5 billion of total debt outstanding as of December 31, 2016, approximately $3.5 billion bore interest at variable rates that were not subject to a derivative instrument which fixed the interest rate. Brazil holds $1.3 billion of our floating rate non-recourse exposure as we have no ability to fix local debt interest rates efficiently.
In addition to utilizing non-recourse debt at a subsidiary level when available, the Parent Company provides a portion, or in certain instances all, of the remaining long-term financing or credit required to fund development, construction or acquisition of a particular project. These investments have generally taken the form of equity investments or intercompany loans, which are subordinated to the project's non-recourse loans. We generally obtain the funds for these investments from our cash flows from operations, proceeds from the sales of assets and/or the proceeds from our issuances of debt, common stock and other securities. Similarly, in certain of our businesses, the Parent Company may provide financial guarantees or other credit support for the benefit of counterparties who have entered into contracts for the purchase or sale of electricity, equipment or other services with our subsidiaries or lenders. In such circumstances, if a business defaults on its payment or supply obligation, the Parent Company will be responsible for the business' obligations up to the amount provided for in the relevant guarantee or other credit support. At December 31, 2016, the Parent Company had provided outstanding financial and performance-related guarantees or other credit support commitments to or for the benefit of our businesses, which were limited by the terms of the agreements, of approximately $535 million in aggregate (excluding those collateralized by letters of credit and other obligations discussed below).
As a result of the Parent Company's below investment grade rating, counterparties may be unwilling to accept our general unsecured commitments to provide credit support. Accordingly, with respect to both new and existing commitments, the Parent Company may be required to provide some other form of assurance, such as a letter of credit, to backstop or replace our credit support. The Parent Company may not be able to provide adequate assurances to such counterparties. To the extent we are required and able to provide letters of credit or other collateral to such counterparties, this will reduce the amount of credit available to us to meet our other liquidity needs. At December 31, 2016, we had $6 million in letters of credit outstanding, provided under our senior secured credit facility, $245 million in letters of credit outstanding, provided under our un-senior secured credit facility and $3 million in cash collateralized letters of credit outstanding outside of our senior secured credit facility. These letters of credit operate to guarantee performance relating to certain project development activities and business operations. During the year ended December 31, 2016, the Company paid letter of credit fees ranging from 0.2% to 2.5% per annum on the outstanding amounts.
We expect to continue to seek, where possible, non-recourse debt financing in connection with the assets or businesses that we or our affiliates may develop, construct or acquire. However, depending on local and global market conditions and the unique characteristics of individual businesses, non-recourse debt may not be available
on economically attractive terms or at all. If we decide not to provide any additional funding or credit support to a subsidiary project that is under construction or has near-term debt payment obligations and that subsidiary is unable to obtain additional non-recourse debt, such subsidiary may become insolvent, and we may lose our investment in that subsidiary. Additionally, if any of our subsidiaries lose a significant customer, the subsidiary may need to withdraw from a project or restructure the non-recourse debt financing. If we or the subsidiary choose not to proceed with a project or are unable to successfully complete a restructuring of the non-recourse debt, we may lose our investment in that subsidiary.
Many of our subsidiaries depend on timely and continued access to capital markets to manage their liquidity needs. The inability to raise capital on favorable terms, to refinance existing indebtedness or to fund operations and other commitments during times of political or economic uncertainty may have material adverse effects on the financial condition and results of operations of those subsidiaries. In addition, changes in the timing of tariff increases or delays in the regulatory determinations under the relevant concessions could affect the cash flows and results of operations of our businesses.
Long-Term Receivables — As of December 31, 2016, the Company had approximately $264 million of accounts receivable classified as Noncurrent assets—other related to certain of its generation businesses in Argentina and the U.S. and its utility business in Brazil. The noncurrent portion primarily consists of accounts receivable in Argentina that, pursuant to amended agreements or government resolutions, have collection periods that extend beyond December 31, 2017, or one year from the latest balance sheet date. The majority of Argentinian receivables have been converted into long-term financing for the construction of power plants. See Note 6—Financing Receivables included in Item 8.—Financial Statements and Supplementary Data and Item 1.—Business—Regulatory Matters—Argentina of this Form 10-K for further information.
Consolidated Cash Flows
The following table reflects the changes in operating, investing, and financing cash flows for the comparative twelve month periods (in millions):
| December 31, | $ Change | |||||||||||||||||||
| Cash flows provided by (used in): | 2016 | 2015 | 2014 | 2016 vs. 2015 | 2015 vs. 2014 | |||||||||||||||
| Operating activities | $ | 2,884 | $ | 2,134 | $ | 1,791 | $ | 750 | $ | 343 | ||||||||||
| Investing activities | (2,108 | ) | (2,366 | ) | (656 | ) | 258 | (1,710 | ) | |||||||||||
| Financing activities | (747 | ) | 28 | (1,262 | ) | (775 | ) | 1,290 |
Operating Activities
The following table summarizes the key components of our consolidated operating cash flows (in millions):
| December 31, | $ Change | |||||||||||||||||||
| 2016 | 2015 | 2014 | 2016 vs. 2015 | 2015 vs. 2014 | ||||||||||||||||
| Net Income (Loss) | $ | (777 | ) | $ | 762 | $ | 1,147 | $ | (1,539 | ) | $ | (385 | ) | |||||||
| Depreciation and amortization | 1,176 | 1,144 | 1,245 | 32 | (101 | ) | ||||||||||||||
| Impairment expenses | 2,481 | 602 | 433 | 1,879 | 169 | |||||||||||||||
| Loss on the extinguishment of debt | 20 | 186 | 261 | (166 | ) | (75 | ) | |||||||||||||
| Deferred Income Taxes | (793 | ) | (50 | ) | 47 | (743 | ) | (97 | ) | |||||||||||
| Other adjustments to net income | 225 | (73 | ) | (320 | ) | 298 | 247 | |||||||||||||
| Non-cash adjustments to net income | 3,109 | 1,809 | 1,666 | 1,300 | 143 | |||||||||||||||
| Net income, adjusted for non-cash items | $ | 2,332 | $ | 2,571 | $ | 2,813 | $ | (239 | ) | $ | (242 | ) | ||||||||
| Net change in operating assets and liabilities (1) | 552 | (437 | ) | (1,022 | ) | 989 | 585 | |||||||||||||
| Net cash provided by operating activities (2) | $ | 2,884 | $ | 2,134 | $ | 1,791 | $ | 750 | $ | 343 |
| (1) | Refer to the table below for explanations of the variance in operating assets and liabilities. |
| (2) | Amounts included in the table above include the results of discontinued operations, where applicable. |
Fiscal Year 2016 versus 2015
The variance of $989 million in changes in operating assets and liabilities for the year ended December 31, 2016 compared to the year ended December 31, 2015 was driven by (in millions):
| Decreases in: | |||
| Other assets, primarily long-term regulatory assets at Eletropaulo and service concession assets at Vietnam | $ | 1,054 | |
| Accounts receivable, primarily at Maritza and Eletropaulo | 615 | ||
| Prepaid expenses and other current assets, primarily regulatory assets at Eletropaulo and Sul | 215 | ||
| Accounts payable and other current liabilities, primarily at Eletropaulo and Sul | (651 | ) | |
| Income taxes payable, net and other taxes payable, primarily at Tietê, Chivor and Gener | (252 | ) | |
| Other operating assets and liabilities | 8 | ||
| Total increase in cash from changes in operating assets and liabilities | $ | 989 |
Fiscal Year 2015 versus 2014
The variance of $585 million in changes in operating assets and liabilities for the year ended December 31, 2015 compared to the year ended December 31, 2014 was driven by (in millions):
| Decreases in: | |||
| Prepaid expenses and other current assets, primarily at Eletropaulo, Gener and DPL | $ | 728 | |
| Accounts receivable, primarily at Andres and Itabo Opco | 142 | ||
| Other operating assets and liabilities | 39 | ||
| Increases in: | |||
| Income tax payables, net and other tax payables, primarily at Tietê and Gener | 142 | ||
| Accounts payable and other current liabilities, primarily at Eletropaulo, Sul and Tietê | 116 | ||
| Other assets, primarily long-term regulatory assets at Eletropaulo and Sul and service concession assets at Mong Duong | (582 | ) | |
| Total increase in cash from changes in operating assets and liabilities | $ | 585 |
Investing Activities
Fiscal Year 2016 versus 2015
Net cash used in investing activities decreased $258 million for the year ended December 31, 2016 compared to December 31, 2015, which was primarily driven by (in millions):
| Increases in: | |||
| Capital expenditures (1) | $ | (37 | ) |
| Acquisitions, net of cash acquired (primarily Distributed Energy) | (38 | ) | |
| Proceeds from the sales of businesses, net of cash sold (primarily related to sales of DPLER and Sul) | 493 | ||
| Net purchases of short-term investments | (297 | ) | |
| Decreases in: | |||
| Restricted cash, debt service and other assets | 98 | ||
| Other investing activities | 39 | ||
| Total decrease in net cash used in investing activities | $ | 258 |
| (1) | Refer to the tables below for a breakout of capital expenditure by type and by primary business driver. |
Capital Expenditures
The following table summarizes the Company's capital expenditures for growth investments, maintenance and environmental reported in investing cash activities for the periods indicated (in millions):
| December 31, | $ Change | |||||||||||
| 2016 | 2015 | 2016 vs. 2015 | ||||||||||
| Growth Investments | $ | (1,510 | ) | $ | (1,401 | ) | $ | (109 | ) | |||
| Maintenance | (617 | ) | (606 | ) | (11 | ) | ||||||
| Environmental (1) | (218 | ) | (301 | ) | 83 | |||||||
| Total capital expenditures | $ | (2,345 | ) | $ | (2,308 | ) | $ | (37 | ) |
| (1) | Includes both recoverable and non-recoverable environmental capital expenditures. See SBU Performance Analysis for more information. |
Cash used for capital expenditures increased by $37 million for the year ended December 31, 2016 compared to December 31, 2015, which was primarily driven by (in millions):
| Increases in: | |||
| Growth expenditures at the Asia SBU, primarily due to investments at Masinloc related to the construction of a coal-fired plant, a battery storage project, and retrofit related costs | $ | (124 | ) |
| Growth expenditures at the MCAC SBU, primarily due to the construction of a natural gas-fired generation plant in Panama and construction of a combined cycle project at Los Mina in the Dominican Republic | (266 | ) | |
| Decreases in: | |||
| Growth expenditures at the Andes SBU, primarily due to lower spending related to Cochrane and the Andes Solar plant; partially offset by higher investments in the Alto Maipo construction project | 280 | ||
| Growth expenditures at the US SBU, primarily due to lower spending related to the CCGT and Transmission & Distribution projects at IPALCO | 20 | ||
| Maintenance and environmental expenditures at the US SBU, primarily due to lower spending related to MATS compliance and the conversion of Harding Street Stations 5, 6 and 7 to natural gas upon being placed into service in late 2015 and early 2016; partially offset by higher spending on CCR compliance | 63 | ||
| Other capital expenditures | (10 | ) | |
| Total increase in net cash used for capital expenditures | $ | (37 | ) |
Fiscal Year 2015 versus 2014
Net cash used in investing activities increased $1.7 billion for the year ended December 31, 2015 compared to December 31, 2014, which was primarily driven by (in millions):
| Increases in: | |||
| Capital expenditures (1) | $ | (292 | ) |
| Restricted cash, debt service and other assets | (578 | ) | |
| Decreases in: | |||
| Proceeds from sales of businesses (primarily related to the Guacolda and Masinloc transactions in 2014) | (1,669 | ) | |
| Acqusitions, net of cash acquired (primarily related to the Guacolda transaction in 2014) | 711 | ||
| Net purchases of short-term investments | 170 | ||
| Other investing activities | (52 | ) | |
| Total increase in net cash used in investing activities | $ | (1,710 | ) |
| (1) | Refer to the tables below for a breakout of capital expenditures by type and by primary business driver. |
The following table summarizes the Company's capital expenditures for growth investments, maintenance and environmental for the periods indicated (in millions):
| December 31, | $ Change | |||||||||||
| 2015 | 2014 | 2015 vs. 2014 | ||||||||||
| Growth Investments | $ | (1,401 | ) | $ | (1,151 | ) | $ | (250 | ) | |||
| Maintenance | (606 | ) | (645 | ) | 39 | |||||||
| Environmental (1) | (301 | ) | (220 | ) | (81 | ) | ||||||
| Total capital expenditures | $ | (2,308 | ) | $ | (2,016 | ) | $ | (292 | ) |
| (1) | Includes both recoverable and non-recoverable environmental capital expenditures. See SBU Performance Analysis for more information. |
Cash used for capital expenditures increased by $292 million for the year ended December 31, 2015 compared to December 31, 2014, which was primarily driven by (in millions):
| Increases in: | |||
| Growth expenditures at the Andes SBU, primarily due to higher spending on Cochrane projects | $ | (271 | ) |
| Growth expenditures at the US SBU, primarily due to higher spending on the CCGT, Transmission & Distribution projects and a battery storage project at IPALCO | (192 | ) | |
| Maintenance and environmental expenditures at the US SBU, primarily due to higher spending on the NPDES compliance and Harding Street refueling projects as they began in 2015; partially offset by lower spending on MATS compliance | (98 | ) | |
| Decreases In: | |||
| Growth expenditures at Mong Duong due to the adoption of service concession accounting in 2015 | 111 | ||
| Growth expenditures at Jordan due to the completion of IPP4 plant construction | 72 | ||
| Other capital expenditures | 86 | ||
| Total increase in net cash used for capital expenditures | $ | (292 | ) |
Financing Activities
Net cash used in financing activities increased $775 million for the year ended December 31, 2016 compared to December 31, 2015, which was primarily driven by (in millions):
| Increases in: | |||
| Distributions to noncontrolling interests, primarily at the Brazil SBU | $ | (150 | ) |
| Contributions from noncontrolling interests, primarily at the MCAC SBU | 64 | ||
| Decreases in: | |||
| Net issuance of non-recourse debt, primarily at the Andes and Brazil SBUs | (624 | ) | |
| Proceeds from the sale of redeemable stock of subsidiaries at IPALCO | (327 | ) | |
| Proceeds from sales to noncontrolling interests, net of transaction costs | (154 | ) | |
| Purchases of treasury stock by the Parent Company | 403 | ||
| Net repayments of recourse debt at the Parent Company (1) | 32 | ||
| Other financing activities | (19 | ) | |
| Total increase in net cash used in financing activities | $ | (775 | ) |
| (1) | See Note 11—Debt in Item 8.—Financial Statements and Supplementary Data of this Form 10-K for more information regarding significant recourse debt transactions. |
Net cash provided by financing activities increased $1.3 billion for the year ended December 31, 2015 compared to the year ended December 31, 2014, which was primarily driven by (in millions):
| Increases in: | |||
| Proceeds from the sale of redeemable stock of subsidiaries at IPALCO | $ | 461 | |
| Net issuance of non-recourse debt, primarily at the Andes and Brazil SBUs | 238 | ||
| Proceeds from sales to noncontrolling interests, net of transaction costs | 71 | ||
| Dividends paid on The AES Corporation common stock | (132 | ) | |
| Purchases of treasury stock by the Parent Company | (174 | ) | |
| Decreases in: | |||
| Net repayments of recourse debt at the Parent Company (1) | 252 | ||
| Payments for financed capital expenditures, primarily at the Andes and Asia SBUs | 378 | ||
| Other financing activities | 196 | ||
| Total increase in net cash provided by financing activities | $ | 1,290 |
| (1) | See Note 11—Debt in Item 8.—Financial Statements and Supplementary Data of this Form 10-K for more information regarding significant recourse debt transactions. |
Segment Operating Cash Flow Analysis
Operating Cash Flow (1)
| Operating Cash Flow by SBU | ||||||||||||||||||||
| 2016 | 2015 | 2014 | 2016/2015 Change | 2015/2014 Change | ||||||||||||||||
| US | $ | 912 | $ | 845 | $ | 830 | $ | 67 | $ | 15 | ||||||||||
| Andes | 475 | 462 | 359 | 13 | 103 | |||||||||||||||
| Brazil | 716 | 136 | 316 | 580 | (180 | ) | ||||||||||||||
| MCAC | 312 | 705 | 370 | (393 | ) | 335 | ||||||||||||||
| Europe | 637 | 339 | 292 | 298 | 47 | |||||||||||||||
| Asia | 255 | 15 | 105 | 240 | (90 | ) | ||||||||||||||
| Corporate | (423 | ) | (368 | ) | (481 | ) | (55 | ) | 113 | |||||||||||
| Total SBUs | $ | 2,884 | $ | 2,134 | $ | 1,791 | $ | 750 | $ | 343 |
| (1) | Operating cash flow as presented above include the effect of intercompany transactions with other segments except for interest, tax sharing, charges for management fees and transfer pricing. |
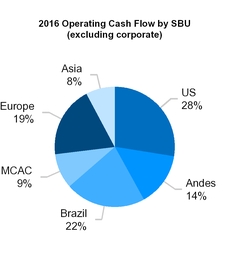
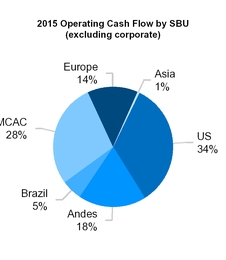

US SBU
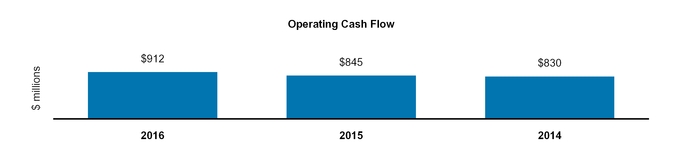
Fiscal Year 2016 versus 2015
The increase in Operating Cash Flow of $67 million was driven primarily by the following (in millions):
| US SBU 2016 vs. 2015 | ||||
| Timing of payments for accounts payable and consumption of inventory, primarily due to lower inventory purchases from inventory optimization efforts | $ | 142 | ||
| Net impact of receivable settlements related to the 2016 sale of DPLER and the 2015 sale of MC2 | 17 | |||
| Lower payments for interest expense, primarily due to debt repayments at DPL, and lower interest rates | 16 | |||
| Timing of receivables collections, primarily due to higher rates at IPL, favorable weather in Q4 2016, and the impact of DPLER's declining customer base in 2015 | (97 | ) | ||
| Lower operating margin, net of non-cash items (primarily depreciation of $28 and an $18 accrual impact from IPL's new rates) | (21 | ) | ||
| Other | 10 | |||
| Total US SBU Operating Cash Increase | $ | 67 |
Fiscal Year 2015 versus 2014
The increase in Operating Cash Flow of $15 million was driven primarily by the following (in millions):
| US SBU 2015 vs. 2014 | ||||
| Decrease in Operating Margin, net of non-cash items (primarily depreciation of $6) | $ | (84 | ) | |
| Collection of previously deferred storm costs at DPL | 22 | |||
| One-time payment occurring in 2014 at DPL to terminate an unfavorable coal contract | 19 | |||
| Settlement of receivables related to the sale of MC2 | 16 | |||
| Favorable timing of inventory purchases and power purchase payments | 25 | |||
| Increased A/R collections at IPL | 12 | |||
| Other | 5 | |||
| Total US SBU Operating Cash Increase | $ | 15 |
ANDES SBU

Fiscal Year 2016 versus 2015
The increase in Operating Cash Flow of $13 million was driven primarily by the following (in millions):
| Andes SBU 2016 vs. 2015 | ||||
| Higher operating margin, net of non-cash items (primarily depreciation of $44) | $ | 58 | ||
| Higher collections at Chivor, primarily due to increased sales in Q4 2015 | 83 | |||
| Collections of FONINVEMEM III receivables in Argentina, primarily as result of the commencement of operations at Termoelectrica Guillermo Brown in 2016 | 57 | |||
| Impact from a prior year payment to unwind an interest rate swap as part of the Ventanas refinancing in July 2015 | 38 | |||
| Lower VAT refunds due to projects entering COD at Cochrane and the timing of VAT Refunds at Alto Maipo | (107 | ) | ||
| Higher interest payments due primarily to new unsecured notes issued by Gener in July 2015 as part of the Ventanas refinancing | (29 | ) | ||
| Higher tax payments in Chile, primarily due to withholding taxes paid on Chilean distributions to AES affiliates | (29 | ) | ||
| Increase in income tax payments due to higher taxable income at Chivor | (28 | ) | ||
| Timing of collections at Gener | (22 | ) | ||
| Other | (8 | ) | ||
| Total Andes SBU Operating Cash Increase | $ | 13 |
Fiscal Year 2015 versus 2014
The increase in Operating Cash Flow of $103 million was driven primarily by the following (in millions):
| Andes SBU 2015 vs. 2014 | ||||
| Higher VAT refunds due to the construction of the Cochrane and Alto Maipo plants | $ | 153 | ||
| Timing of non-recurring maintenance collections in Argentina | 27 | |||
| Lower interest payments at Chivor | 15 | |||
| Higher income tax payments at Chivor due to an increase in the tax rate and advance payments made in 2015 | (37 | ) | ||
| Lower collections on contract sales at Chivor | (36 | ) | ||
| Impact from payments to unwind an interest rate swap as part of the Ventanas refinancing in July 2015 | (38 | ) | ||
| Other | 19 | |||
| Total Andes SBU Operating Cash Increase | $ | 103 |
BRAZIL SBU
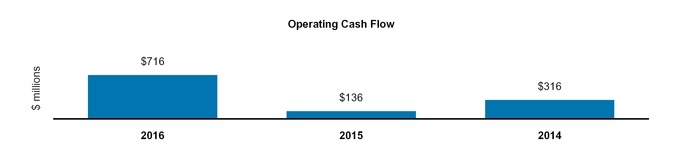
Fiscal Year 2016 versus 2015
The increase in Operating Cash Flow of $580 million was driven primarily by the following (in millions):
| Brazil SBU 2016 vs. 2015 | ||||
| Lower operating margin (1), net of non-cash items (primarily a net $45 impact from contingency items at Eletropaulo) | $ | (308 | ) | |
| Timing of payments at Eletropaulo and Sul related to regulatory charges and tariff flags due to improved hydrology in 2016 | (581 | ) | ||
| Collections of higher costs deferred in net regulatory assets at Eletropaulo and Sul as result of unfavorable hydrology in prior periods | 974 | |||
| Timing of collections on energy sales in the current year | 416 | |||
| Lower energy purchases at Tietê in the current year as result of favorable hydrology | 93 | |||
| Timing of non-income tax payments | 28 | |||
| Other | (42 | ) | ||
| Total Brazil SBU Operating Cash Increase | $ | 580 |
| (1) | Includes the results of AES Sul, which is excluded from continuing operations in the Condensed Consolidated Statements of Operations but is included within operating cash flow on the Condensed Consolidated Statements of Cash Flows. See Note 22 of Item 8.—Notes to Condensed Consolidated Financial Statements within this Form 10-K for further information. |
Fiscal Year 2015 versus 2014
The decrease in Operating Cash Flow of $180 million was driven primarily by the following (in millions):
| Brazil SBU 2015 vs. 2014 | ||||
| Lower operating margin (1), net of non-cash items (primarily a net $38 impact from contingency items at Eletropaulo) | $ | (179 | ) | |
| Timing of energy purchases in the spot market at Tietê at higher prices | (241 | ) | ||
| Timing of collections at Eletropaulo due to higher tarriffs | (41 | ) | ||
| Higher interest payments at Sul due to higher debt and a higher interest rate | (17 | ) | ||
| Timing of payments at Eletropaulo and Sul related to regulatory charges and tariff flags due to unfavorable hydrology | 181 | |||
| Lower income tax payments at Tietê due to lower taxable income in 2014 | 127 | |||
| Collections of higher costs deferred in net regulatory assets at Eletropaulo and Sul as result of unfavorable hydrology in prior periods | 53 | |||
| Other | (63 | ) | ||
| Total Brazil SBU Operating Cash Decrease | $ | (180 | ) |
| (1) | Includes the results of AES Sul, which is excluded from continuing operations in the Condensed Consolidated Statements of Operations but is included within operating cash flow on the Condensed Consolidated Statements of Cash Flows. See Note 22 of Item 8.—Notes to Condensed Consolidated Financial Statements within this Form 10-K for further information |
MCAC SBU
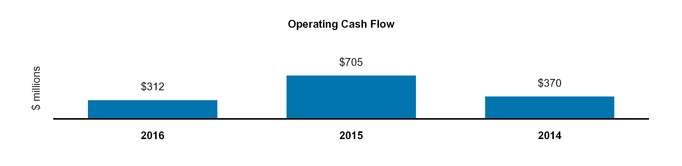
Fiscal Year 2016 versus 2015
The decrease in Operating Cash Flow of $393 million was driven primarily by the following (in millions):
| MCAC SBU 2016 vs. 2015 | ||||
| Collection of overdue receivables in September 2015 from distribution companies in the Dominican Republic | $ | (243 | ) | |
| Lower operating margin, net of non-cash items (primarily depreciation of $10) | (55 | ) | ||
| Lower collections from the off-taker in Puerto Rico, primarily due to lower sales from Q4 2015 | (47 | ) | ||
| Compensation received in the prior year due to an early termination of the barge PPA by the off-taker in Panama | (20 | ) | ||
| Higher withholding taxes paid on dividend distributions to AES affiliates in the Dominican Republic | (16 | ) | ||
| Higher tax payments due to higher taxable income in El Salvador | (17 | ) | ||
| Other | 5 | |||
| Total MCAC SBU Operating Cash Decrease | $ | (393 | ) |
Fiscal Year 2015 versus 2014
The increase in Operating Cash Flow of $335 million was driven primarily by the following (in millions):
| MCAC SBU 2015 vs. 2014 | ||||
| Higher collections on contract sales in Panama | $ | 27 | ||
| Collection of overdue receivables in September 2015 from distribution companies in the Dominican Republic | 243 | |||
| Lower energy purchases due to a decrease in fuel prices in El Salvador | 22 | |||
| Timing of collections from the off-taker in Puerto Rico | 45 | |||
| Compensation received due to an early termination of the barge PPA by the off-taker in Panama | 20 | |||
| Other | (22 | ) | ||
| Total MCAC SBU Operating Cash Increase | $ | 335 |
EUROPE SBU
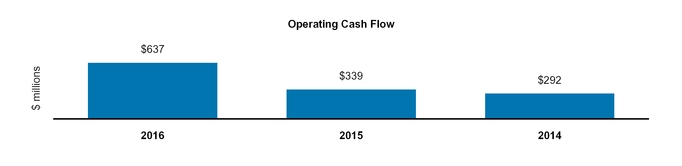
Fiscal Year 2016 versus 2015
The increase in Operating Cash Flow of $298 million was driven primarily by the following (in millions):
| Europe SBU 2016 vs. 2015 | ||||
| Increase in collections at Maritza from NEK (off-taker), net of payments to MMI (fuel supplier) | $ | 360 | ||
| Timing of vendor payments | 47 | |||
| Lower operating margin, net of non cash items (primarily lower depreciation of $18) | (92 | ) | ||
| Decrease in CO2 allowances due to a price decrease | (24 | ) | ||
| Other | 7 | |||
| Total Europe SBU Operating Cash Increase | $ | 298 |
Fiscal Year 2015 versus 2014
The increase in Operating Cash Flow of $47 million was driven primarily by the following (in millions):
| Europe SBU 2015 vs. 2014 | ||||
| Increase in collections at Maritza from NEK (off-taker), net of payments to MMI (fuel supplier) | $ | 69 | ||
| Favorable timing of collections at IPP4 | 34 | |||
| Lower operating margin | (102 | ) | ||
| Lower payments for interest expense | 42 | |||
| Other | 4 | |||
| Total Europe SBU Operating Cash Increase | $ | 47 |
ASIA SBU
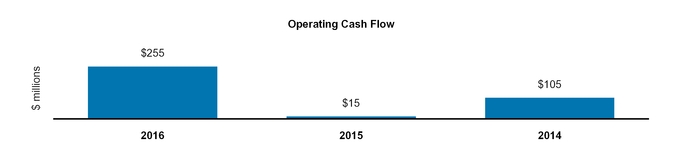
Fiscal Year 2016 versus 2015
The increase in Operating Cash Flow of $240 million was driven primarily by the following (in millions):
| Asia SBU 2016 vs. 2015 | ||||
| Reduction in service concession asset expenditures, net of previously capitalized interest payments | $ | 98 | ||
| Higher operating margin, net of an increase of $48 in non-cash service concession amortization | 69 | |||
| Decrease in working capital requirements at Mong Duong as the plant was fully operational in 2016 | 58 | |||
| Higher interest income as a result of the financing component under service concession accounting | 34 | |||
| Other | (19 | ) | ||
| Total Asia SBU Operating Cash Increase | $ | 240 |
Fiscal Year 2015 versus 2014
The decrease in Operating Cash Flow of $90 million was driven primarily by the following (in millions):
| Asia SBU 2015 vs. 2014 | ||||
| Service concession asset expenditures at Mong Duong | $ | (165 | ) | |
| Increase in interest payments at Mong Duong | (44 | ) | ||
| Higher working capital at Mong Duong, due to a build-up in preparation for commencement of plant operations | (50 | ) | ||
| Higher working capital at Masinloc, due primarily to the timing of coal purchases | (17 | ) | ||
| Higher tax payments at Masinloc | (21 | ) | ||
| Higher interest income as a result of the financing component under service concession accounting | 115 | |||
| Higher operating margin, net of non-cash items (primarily $33 in service concession amortization and a $15 retrospective adjustment to energy prices in 2014) | 91 | |||
| Other | 1 | |||
| Total Asia SBU Operating Cash Decrease | $ | (90 | ) |
CORPORATE AND OTHER
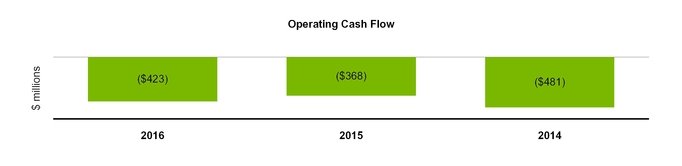
Fiscal Year 2016 versus 2015
The decrease in Operating Cash Flow of $55 million was driven primarily by the following (in millions):
| Corporate and Other 2016 vs. 2015 | ||||
| Lower interest payments due principal repayments on debt | $ | 18 | ||
| Decrease in cash from net settlements of FX and oil derivatives | (40 | ) | ||
| Higher payments for people-related costs, primarily due to health benefit costs and severance | (25 | ) | ||
| Other | (8 | ) | ||
| Total Corporate and Other Operating Cash Decrease | $ | (55 | ) |
Fiscal Year 2015 versus 2014
The increase in Operating Cash Flow of $113 million was driven primarily by the following (in millions):
| Corporate and Other 2015 vs. 2014 | ||||
| Lower interest payments due primarily to corporate debt refinancing | $ | 60 | ||
| Impact of swap termination payments occurring in the prior year related to corporate debt refinancing | 22 | |||
| Reduction in people-related costs, primarily due to benefit costs | 16 | |||
| Increase in collections from realized gains resulting from the settlement of foreign currency derivatives | 15 | |||
| Total Corporate and Other Operating Cash Increase | $ | 113 |
Parent Company Liquidity
The following discussion of Parent Company Liquidity has been included because we believe it is a useful measure of the liquidity available to The AES Corporation, or the Parent Company, given the non-recourse nature of most of our indebtedness. Parent Company Liquidity as outlined below is a non-GAAP measure and should not be construed as an alternative to cash and cash equivalents which are determined in accordance with GAAP, as a measure of liquidity. Cash and cash equivalents are disclosed in the consolidated statements of cash flows. Parent Company Liquidity may differ from similarly titled measures used by other companies. The principal sources of liquidity at the Parent Company level are dividends and other distributions from our subsidiaries, including refinancing proceeds; proceeds from debt and equity financings at the Parent Company level, including availability under our credit facility; and proceeds from asset sales. Cash requirements at the Parent Company level are primarily to fund interest; principal repayments of debt; construction commitments; other equity commitments; common stock repurchases; acquisitions; taxes; Parent Company overhead and development costs; and dividends on common stock.
The Company defines Parent Company Liquidity as cash available to the Parent Company plus available borrowings under existing credit facility. The cash held at qualified holding companies represents cash sent to subsidiaries of the Company domiciled outside of the U.S.. Such subsidiaries have no contractual restrictions on their ability to send cash to the Parent Company. Parent Company Liquidity is reconciled to its most directly comparable U.S. GAAP financial measure, Cash and cash equivalents, at December 31, 2016 and 2015 as follows:
| Parent Company Liquidity (in millions) | 2016 | 2015 | ||||||
| Consolidated cash and cash equivalents | $ | 1,305 | $ | 1,257 | ||||
| Less: Cash and cash equivalents at subsidiaries | 1,205 | 857 | ||||||
| Parent and qualified holding companies' cash and cash equivalents | 100 | 400 | ||||||
| Commitments under Parent credit facility | 800 | 800 | ||||||
| Less: Letters of credit under the credit facilities | (6 | ) | (62 | ) | ||||
| Borrowings available under Parent credit facilities | 794 | 738 | ||||||
| Total Parent Company Liquidity | $ | 894 | $ | 1,138 |
The Company paid dividends of $0.44 per share to its common stockholders during the year ended December 31, 2016. While we intend to continue payment of dividends and believe we will have sufficient liquidity to do so, we can provide no assurance that we will continue to pay dividends, or if continued, the amount of such dividends.
Recourse Debt — Our recourse debt at year-end was approximately $4.7 billion and $5.0 billion in 2016 and 2015, respectively. See Note 11—Debt in Item 8.—Financial Statements and Supplementary Data of this Form 10-K for additional detail.
While we believe that our sources of liquidity will be adequate to meet our needs for the foreseeable future, this belief is based on a number of material assumptions, including, without limitation, assumptions about our ability to access the capital markets (see Key Trends and Uncertainties—Global Economic Conditions), the operating and financial performance of our subsidiaries, currency exchange rates, power market pool prices, and the ability of our subsidiaries to pay dividends. In addition, our subsidiaries' ability to declare and pay cash dividends to us (at the Parent Company level) is subject to certain limitations contained in loans, governmental provisions and other agreements. We can provide no assurance that these sources will be available when needed or that the actual cash requirements will not be greater than anticipated. See Item 1A.—Risk Factors—The AES Corporation is a holding company and its ability to make payments on its outstanding indebtedness, including its public debt securities, is dependent upon the receipt of funds from its subsidiaries by way of dividends, fees, interest, loans or otherwise, of this Form 10-K.
Various debt instruments at the Parent Company level, including our senior secured credit facility, contain certain restrictive covenants. The covenants provide for — among other items — limitations on other indebtedness, liens, investments and guarantees; limitations on dividends, stock repurchases and other equity transactions; restrictions and limitations on mergers and acquisitions, sales of assets, leases, transactions with affiliates and off-balance sheet and derivative arrangements; maintenance of certain financial ratios; and financial and other reporting requirements.
As of December 31, 2016, we were in compliance with these covenants at the Parent Company level.
Non-Recourse Debt — While the lenders under our non-recourse debt financings generally do not have direct recourse to the Parent Company, defaults thereunder can still have important consequences for our results of operations and liquidity, including, without limitation:
| • | reducing our cash flows as the subsidiary will typically be prohibited from distributing cash to the Parent Company during the time period of any default; |
| • | triggering our obligation to make payments under any financial guarantee, letter of credit or other credit support we have provided to or on behalf of such subsidiary; |
| • | causing us to record a loss in the event the lender forecloses on the assets; and |
| • | triggering defaults in our outstanding debt at the Parent Company. |
For example, our senior secured credit facility and outstanding debt securities at the Parent Company include events of default for certain bankruptcy related events involving material subsidiaries. In addition, our revolving credit agreement at the Parent Company includes events of default related to payment defaults and accelerations of outstanding debt of material subsidiaries.
Some of our subsidiaries are currently in default with respect to all or a portion of their outstanding indebtedness. The total non-recourse debt classified as current in the accompanying Consolidated Balance Sheets amounts to $1.3 billion. The portion of current debt related to such defaults was $128 million at December 31, 2016, all of which was non-recourse debt related to two subsidiaries — Kavarna, and Sogrinsk. See Note 11—Debt in Item 8.—Financial Statements and Supplementary Data of this Form 10-K for additional detail.
None of the subsidiaries that are currently in default are subsidiaries that met the applicable definition of materiality under AES' corporate debt agreements as of December 31, 2016 in order for such defaults to trigger an event of default or permit acceleration under AES' indebtedness. However, as a result of additional dispositions of
assets, other significant reductions in asset carrying values or other matters in the future that may impact our financial position and results of operations or the financial position of the individual subsidiary, it is possible that one or more of these subsidiaries could fall within the definition of a "material subsidiary" and thereby upon an acceleration trigger an event of default and possible acceleration of the indebtedness under the Parent Company's outstanding debt securities. A material subsidiary is defined in the Company's senior secured revolving credit facility as any business that contributed 20% or more of the Parent Company's total cash distributions from businesses for the four most recently completed fiscal quarters. As of December 31, 2016, none of the defaults listed above individually or in the aggregate results in or is at risk of triggering a cross-default under the recourse debt of the Company.
Contractual Obligations and Parent Company Contingent Contractual Obligations
A summary of our contractual obligations, commitments and other liabilities as of December 31, 2016 is presented below and excludes any businesses classified as discontinued operations or held-for-sale (in millions):
| Contractual Obligations | Total | Less than 1 year | 1-3 years | 3-5 years | More than 5 years | Other | Footnote Reference(4) | |||||||||||||||||||
| Debt Obligations (1) | $ | 20,949 | $ | 1,339 | $ | 2,897 | $ | 5,115 | $ | 11,598 | $ | — | 11 | |||||||||||||
| Interest Payments on Long-Term Debt (2) | 7,945 | 1,160 | 1,962 | 1,511 | 3,312 | — | n/a | |||||||||||||||||||
| Capital Lease Obligations | 165 | 25 | 32 | 19 | 89 | — | 12 | |||||||||||||||||||
| Operating Lease Obligations | 1,374 | 84 | 181 | 183 | 926 | — | 12 | |||||||||||||||||||
| Electricity Obligations | 33,106 | 2,513 | 4,874 | 5,454 | 20,265 | — | 12 | |||||||||||||||||||
| Fuel Obligations | 5,163 | 1,609 | 1,213 | 916 | 1,425 | — | 12 | |||||||||||||||||||
| Other Purchase Obligations | 14,009 | 2,966 | 3,260 | 1,771 | 6,012 | — | 12 | |||||||||||||||||||
| Other Long-Term Liabilities Reflected on AES' Consolidated Balance Sheet under GAAP (3) | 783 | — | 264 | 41 | 430 | 48 | n/a | |||||||||||||||||||
| Total | $ | 83,494 | $ | 9,696 | $ | 14,683 | $ | 15,010 | $ | 44,057 | $ | 48 |
| (1) | Includes recourse and non-recourse debt presented on the Consolidated Balance Sheet. These amounts exclude capital lease obligations which are included in the capital lease category. |
| (2) | Interest payments are estimated based on final maturity dates of debt securities outstanding at December 31, 2016 and do not reflect anticipated future refinancing, early redemptions or new debt issuances. Variable rate interest obligations are estimated based on rates as of December 31, 2016. |
| (3) | These amounts do not include current liabilities on the Consolidated Balance Sheet except for the current portion of uncertain tax obligations. Noncurrent uncertain tax obligations are reflected in the "Other" column of the table above as the Company is not able to reasonably estimate the timing of the future payments. In addition, these amounts do not include: (1) regulatory liabilities (See Note 10—Regulatory Assets and Liabilities), (2) contingencies (See Note 13—Contingencies), (3) pension and other post retirement employee benefit liabilities (see Note 14—Benefit Plans), (4) derivatives and incentive compensation (See Note 5—Derivative Instruments and Hedging Activities) or (5) any taxes (See Note 21—Income Taxes) except for uncertain tax obligations, as the Company is not able to reasonably estimate the timing of future payments. See the indicated notes to the Consolidated Financial Statements included in Item 8 of this Form 10-K for additional information on the items excluded. |
| (4) | For further information see the note referenced below in Item 8.—Financial Statements and Supplementary Data of this Form 10-K. |
The following table presents our Parent Company's contingent contractual obligations as of December 31, 2016:
| Contingent contractual obligations ($ in millions) | Amount | Number of Agreements | Maximum Exposure Range for Each Agreement | ||||
| Guarantees and commitments | $ | 508 | 18 | $8 - 58 | |||
| Letters of Credit under the unsecured credit facility | 245 | 8 | $2 - 73 | ||||
| Asset sale related indemnities (1) | 27 | 1 | 27 | ||||
| Letters of Credit under the senior secured credit facility | 6 | 15 | <$1 - 1 | ||||
| Cash collateralized letters of credit | 3 | 1 | 3 | ||||
| Total | $ | 789 | 43 |
| (1) | Excludes normal and customary representations and warranties in agreements for the sale of assets (including ownership in associated legal entities) where the associated risk is considered to be nominal. |
As of December 31, 2016, the Company had no commitments to invest in subsidiaries under construction and to purchase related equipment that were not included in the letters of credit disclosed above.
We have a diverse portfolio of performance-related contingent contractual obligations. These obligations are designed to cover potential risks and only require payment if certain targets are not met or certain contingencies occur. The risks associated with these obligations include change of control, construction cost overruns, subsidiary default, political risk, tax indemnities, spot market power prices, sponsor support and liquidated damages under power sales agreements for projects in development, in operation and under construction. In addition, we have an asset sale program through which we may have customary indemnity obligations under certain assets sale agreements. While we do not expect that we will be required to fund any material amounts under these contingent contractual obligations beyond 2016, many of the events which would give rise to such obligations are beyond our control. We can provide no assurance that we will be able to fund our obligations under these contingent contractual obligations if we are required to make substantial payments thereunder.
Critical Accounting Policies and Estimates
The Consolidated Financial Statements of AES are prepared in conformity with U.S. GAAP, which requires the use of estimates, judgments and assumptions that affect the reported amounts of assets and liabilities at the date of the financial statements and the reported amounts of revenue and expenses during the periods presented. AES' significant accounting policies are described in Note 1—General and Summary of Significant Accounting Policies to the Consolidated Financial Statements included in Item 8 of this Form 10-K.
An accounting estimate is considered critical if the estimate requires management to make assumptions about matters that were highly uncertain at the time the estimate was made; different estimates reasonably could have been used; or the impact of the estimates and assumptions on financial condition or operating performance is material.
Management believes that the accounting estimates employed are appropriate and the resulting balances are reasonable; however, actual results could materially differ from the original estimates, requiring adjustments to these balances in future periods. Management has discussed these critical accounting policies with the Audit Committee, as appropriate. Listed below are the Company's most significant critical accounting estimates and assumptions used in the preparation of the Consolidated Financial Statements.
Income Taxes — We are subject to income taxes in both the U.S. and numerous foreign jurisdictions. Our worldwide income tax provision requires significant judgment and is based on calculations and assumptions that are subject to examination by the Internal Revenue Service and other taxing authorities. The Company and certain of its subsidiaries are under examination by relevant taxing authorities for various tax years. The Company regularly assesses the potential outcome of these examinations in each tax jurisdiction when determining the adequacy of the provision for income taxes. Accounting guidance for uncertainty in income taxes prescribes a more likely than not recognition threshold. Tax reserves have been established, which the Company believes to be adequate in relation to the potential for additional assessments. Once established, reserves are adjusted only when there is more information available or when an event occurs necessitating a change to the reserves. While the Company believes that the amounts of the tax estimates are reasonable, it is possible that the ultimate outcome of current or future examinations may be materially different than the reserve amounts.
Because we have a wide range of statutory tax rates in the multiple jurisdictions in which we operate, any changes in our geographical earnings mix could materially impact our effective tax rate. Furthermore, our tax position could be adversely impacted by changes in tax laws, tax treaties or tax regulations or the interpretation or enforcement thereof and such changes may be more likely or become more likely in view of recent economic trends in certain of the jurisdictions in which we operate. As an example, new tax laws were enacted in February 2016 in Chile which increased the statutory income tax rate for most of our Chilean businesses from 25% to 25.5% in 2017 and to 27% for 2018 and future years. Accordingly, in 2016 our net Chilean deferred tax liabilities were remeasured to the new rates. The remeasurement amount and other potential future impacts of the changes in tax law may be material to continuing operations. See Note 21—Income Taxes to the Consolidated Financial Statements included in Item 8 of this Form 10-K for additional information.
The Company's provision for income taxes could be adversely impacted by changes to the U.S. taxation of earnings of our foreign subsidiaries. Since 2006, the Company has benefited from the Controlled Foreign Corporation look-through rule, originally enacted in the TIPRA of 2005, subject to five temporary extensions, including the most recent five year retroactive extension enacted on December 18, 2015 in the H.R.2029 - Consolidated Appropriations Act, 2016. There can be no assurance that this provision will continue to be extended beyond December 31, 2019. Further, the U.S. is considering corporate tax reform that may significantly change corporate tax rates, business rules such as interest deductibility and capital expenditure cost recovery, and U.S. international tax rules. Our expected effective tax rate could increase by amounts that may be material to the Company should such reforms be enacted.
In addition, U.S. income taxes and foreign withholding taxes have not been provided on undistributed earnings for certain of our non-U.S. subsidiaries to the extent such earnings are considered to be indefinitely reinvested in the operations of those subsidiaries.
Deferred tax assets and liabilities are recognized for the future tax consequences attributable to differences between the financial statement carrying amounts of the existing assets and liabilities, and their respective income tax bases. The Company establishes a valuation allowance when it is more likely than not that all or a portion of a deferred tax asset will not be realized.
Sales of Noncontrolling Interests — The accounting for a sale of noncontrolling interests under the accounting standards depends on whether the sale is considered to be a sale of in-substance real estate (as
opposed to an equity transaction), where the gain (loss) on sale would be recognized in earnings rather than within stockholders' equity. If management's estimation process determines that there is no significant value beyond the in-substance real estate, the gain (loss) on the sale of the noncontrolling interest is recognized in earnings. However, if it is determined that significant value likely exists beyond the in-substance real estate, the gain (loss) on the sale of the noncontrolling interest would be recognized within stockholders' equity. In-substance real estate is comprised of land plus improvements and integral equipment. The determination of whether property, plant and equipment is integral equipment is based on the significance of the costs to remove the equipment from its existing location (including the cost of repairing damage resulting from the removal), combined with the decrease in the fair value of the equipment as a result of those removal activities. When the combined total of removal costs and the decrease in fair value of the equipment exceeds 10% of the fair value of the equipment, the equipment is considered integral equipment. The accounting standards specifically identify power plants as an example of in-substance real estate. Where the consolidated entity in which noncontrolling interests have been sold contains in-substance real estate, management estimates the extent to which the total fair value of the assets of the entity is represented by the in-substance real estate and whether significant value exists beyond the in-substance real estate. This estimation considers all qualitative and quantitative factors relevant for each sale and, where appropriate, includes making quantitative estimates about the fair value of the entity and its identifiable assets and liabilities (including any favorable or unfavorable contracts) by analogy to the accounting standards on business combinations. As such, these estimates may require significant judgment and assumptions, similar to the critical accounting estimates discussed below for impairments and fair value.
Impairments — Our accounting policies on goodwill and long-lived assets are described in detail in Note 1—General and Summary of Significant Accounting Policies, included in Item 8 of this Form 10-K. The Company makes considerable judgments in its impairment evaluations of goodwill and long-lived assets; however, the fair value determination is typically the most judgmental part in an impairment evaluation.
The Company determines the fair value of a reporting unit or a long-lived asset (asset group) by applying the approaches prescribed under the fair value measurement accounting framework. Generally, the market approach and income approach are most relevant in the fair value measurement of our reporting units and long-lived assets; however, due to the lack of available relevant observable market information in many circumstances, the Company often relies on the income approach. The Company may engage an independent valuation firm to assist management with the valuation. The decision to engage an independent valuation firm considers all relevant facts and circumstances, including a cost-benefit analysis and the Company's internal valuation knowledge of the long-lived asset (asset group) or business. The Company develops the underlying assumptions consistent with its internal budgets and forecasts for such valuations. Additionally, the Company uses an internal discounted cash flow valuation model (the "DCF model"), based on the principles of present value techniques, to estimate the fair value of its reporting units or long-lived assets under the income approach. The DCF model estimates fair value by discounting our internal budgets and cash flow forecasts, adjusted to reflect market participant assumptions, to the extent necessary, at an appropriate discount rate.
Management applies considerable judgment in selecting several input assumptions during the development of our internal budgets and cash flow forecasts. Examples of the input assumptions that our budgets and forecasts are sensitive to include macroeconomic factors such as growth rates, industry demand, inflation, exchange rates, power prices and commodity prices. Whenever appropriate, management obtains these input assumptions from observable market data sources (e.g., Economic Intelligence Unit) and extrapolates the market information if an input assumption is not observable for the entire forecast period. Many of these input assumptions are dependent on other economic assumptions, which are often derived from statistical economic models with inherent limitations such as estimation differences. Further, several input assumptions are based on historical trends which often do not recur. The input assumptions most significant to our budgets and cash flows are based on expectations of macroeconomic factors which have been volatile recently. It is not uncommon that different market data sources have different views of the macroeconomic factor expectations and related assumptions. As a result, macroeconomic factors and related assumptions are often available in a narrow range; however, in some situations these ranges become wide and the use of a different set of input assumptions could produce significantly different budgets and cash flow forecasts.
A considerable amount of judgment is also applied in the estimation of the discount rate used in the DCF model. To the extent practical, inputs to the discount rate are obtained from market data sources (e.g., Bloomberg, Capital IQ, etc.). The Company selects and uses a set of publicly traded companies from the relevant industry to estimate the discount rate inputs. Management applies judgment in the selection of such companies based on its view of the most likely market participants. It is reasonably possible that the selection of a different set of likely market participants could produce different input assumptions and result in the use of a different discount rate.
Fair value of a reporting unit or a long-lived asset (asset group) is sensitive to both input assumptions to our budgets and cash flow forecasts and the discount rate. Further, estimates of long-term growth and terminal value are often critical to the fair value determination. As part of the impairment evaluation process, management analyzes the sensitivity of fair value to various underlying assumptions. The level of scrutiny increases as the gap between fair value and carrying amount decreases. Changes in any of these assumptions could result in management reaching a different conclusion regarding the potential impairment, which could be material. Our impairment evaluations inherently involve uncertainties from uncontrollable events that could positively or negatively impact the anticipated future economic and operating conditions.
Further discussion of the impairment charges recognized by the Company can be found within Note 9—Goodwill and Other Intangible Assets, Note 20—Asset Impairment Expense and Note 8—Other Non-Operating Expense to the Consolidated Financial Statements included in Item 8 of this Form 10-K.
Fair Value
Fair Value Hierarchy — The Company uses valuation techniques and methodologies that maximize the use of observable inputs and minimize the use of unobservable inputs. Where available, fair value is based on observable market prices or parameters or derived from such prices or parameters. Where observable prices are not available, valuation models are applied to estimate the fair value using the available observable inputs. The valuation techniques involve some level of management estimation and judgment, the degree of which is dependent on the price transparency for the instruments or market and the instruments' complexity.
To increase consistency and enhance disclosure of the fair value of financial instruments, the fair value measurement standard includes a fair value hierarchy to prioritize the inputs used to measure fair value into three categories. An asset or liability's level within the fair value hierarchy is based on the lowest level of input significant to the fair value measurement, where Level 1 is the highest and Level 3 is the lowest. For more information regarding the fair value hierarchy, see Note 1—General and Summary of Significant Accounting Policies included in Item 8 of this Form 10-K.
Fair Value of Financial Instruments — A significant number of the Company's financial instruments are carried at fair value with changes in fair value recognized in earnings or other comprehensive income each period. The Company makes estimates regarding the valuation of assets and liabilities measured at fair value in preparing the Consolidated Financial Statements. These assets and liabilities include short and long-term investments in debt and equity securities, included in the balance sheet line items Short-term investments and Other assets (Noncurrent), derivative assets, included in Other current assets and Other assets (Noncurrent) and derivative liabilities, included in Accrued and other liabilities (current) and Other long-term liabilities. Investments are generally fair valued based on quoted market prices or other observable market data such as interest rate indices. The Company's investments are primarily certificates of deposit, government debt securities and money market funds. Derivatives are valued using observable data as inputs into internal valuation models. The Company's derivatives primarily consist of interest rate swaps, foreign currency instruments, and commodity and embedded derivatives. Additional discussion regarding the nature of these financial instruments and valuation techniques can be found in Note 4—Fair Value included in Item 8 of this Form 10-K.
Fair Value of Nonfinancial Assets and Liabilities — Significant estimates are made in determining the fair value of long-lived tangible and intangible assets (i.e., property, plant and equipment, intangible assets and goodwill) during the impairment evaluation process. In addition, the majority of assets acquired and liabilities assumed in a business combination are required to be recognized at fair value under the relevant accounting guidance. In determining the fair value of these items, management makes several assumptions as discussed in the Impairments section above.
Accounting for Derivative Instruments and Hedging Activities — We enter into various derivative transactions in order to hedge our exposure to certain market risks. We primarily use derivative instruments to manage our interest rate, commodity and foreign currency exposures. We do not enter into derivative transactions for trading purposes.
In accordance with the accounting standards for derivatives and hedging, we recognize all derivatives as either assets or liabilities in the balance sheet and measure those instruments at fair value except where derivatives qualify and are designated as "normal purchase/normal sale" transactions. Changes in fair value of derivatives are recognized in earnings unless specific hedge criteria are met. Income and expense related to derivative instruments are recognized in the same category as that generated by the underlying asset or liability. See Note 5—Derivative Instruments and Hedging Activities included in Item 8 of this Form 10-K for further information on the classification.
The accounting standards for derivatives and hedging enable companies to designate qualifying derivatives as hedging instruments based on the exposure being hedged. These hedge designations include fair value hedges and cash flow hedges. Changes in the fair value of a derivative that is highly effective and is designated and qualifies as a fair value hedge, are recognized in earnings as offsets to the changes in fair value of the exposure being hedged. The Company has no fair value hedges at this time. Changes in the fair value of a derivative that is highly effective and is designated as and qualifies as a cash flow hedge, are deferred in accumulated other comprehensive income and are recognized into earnings as the hedged transactions occur. Any ineffectiveness is recognized in earnings immediately. For all hedge contracts, the Company provides formal documentation of the hedge and effectiveness testing in accordance with the accounting standards for derivatives and hedging.
The fair value measurement accounting standard provides additional guidance on the definition of fair value and defines fair value as the price that would be received to sell an asset or paid to transfer a liability in an orderly transaction between market participants at the measurement date, or exit price. The fair value measurement standard requires the Company to consider and reflect the assumptions of market participants in the fair value calculation. These factors include nonperformance risk (the risk that the obligation will not be fulfilled) and credit risk, both of the reporting entity (for liabilities) and of the counterparty (for assets). Due to the nature of the Company's interest rate swaps, which are typically associated with non-recourse debt, credit risk for AES is evaluated at the subsidiary level rather than at the Parent Company level. Nonperformance risk on the Company's derivative instruments is an adjustment to the initial asset/liability fair value position that is derived from internally developed valuation models that utilize observable market inputs.
As a result of uncertainty, complexity and judgment, accounting estimates related to derivative accounting could result in material changes to our financial statements under different conditions or utilizing different assumptions. As a part of accounting for these derivatives, we make estimates concerning nonperformance, volatilities, market liquidity, future commodity prices, interest rates, credit ratings (both ours and our counterparty's), and future exchange rates. Refer to Note 4—Fair Value included in Item 8 of this Form 10-K for additional details.
The fair value of our derivative portfolio is generally determined using internal and third party valuation models, most of which are based on observable market inputs including interest rate curves and forward and spot prices for currencies and commodities. The Company derives most of its financial instrument market assumptions from market efficient data sources (e.g., Bloomberg, Reuters and Platt's). In some cases, where market data is not readily available, management uses comparable market sources and empirical evidence to derive market assumptions to determine a financial instrument's fair value. In certain instances, the published curve may not extend through the remaining term of the contract and management must make assumptions to extrapolate the curve. Specifically, where there is limited forward curve data with respect to foreign exchange contracts, beyond the traded points the Company utilizes the purchasing power parity approach to construct the remaining portion of the forward curve using relative inflation rates. Additionally, in the absence of quoted prices, we may rely on "indicative pricing" quotes from financial institutions to input into our valuation model for certain of our foreign currency swaps. These indicative pricing quotes do not constitute either a bid or ask price and therefore are not considered observable market data. For individual contracts, the use of different valuation models or assumptions could have a material effect on the calculated fair value.
Regulatory Assets — Management continually assesses whether the regulatory assets are probable of future recovery by considering factors such as applicable regulatory changes, recent rate orders applicable to other regulated entities and the status of any pending or potential deregulation legislation. If future recovery of costs ceases to be probable, any asset write-offs would be required to be recognized in operating income.
Consolidation — The Company has recently entered into several transactions whereby the Company sells an interest in its controlled subsidiaries and/or equity method investments. In connection with each transaction, the Company must determine whether the sale of the interest impacts the Company's consolidation conclusion by first determining whether the transaction should be evaluated under the variable interest model or the voting model. In determining which consolidation model applies to the transaction, the Company is required to make judgments about how the entity operates, the most significant of which are whether (i) the entity has sufficient equity to finance its activities, (ii) the equity holders, as a group, have the characteristics of a controlling financial interest, and (iii) whether the entity has non-substantive voting rights.
If the entity is determined to be a variable interest entity, the most significant judgment in determining whether the Company must consolidate the entity is whether the Company, including its related parties and de facto agents, collectively have power and benefits. If AES is determined to have power and benefits, the entity will be consolidated by AES.
Alternatively, if the entity is determined to be a voting model entity, the most significant judgments involve determining whether the non-AES shareholders have substantive participating rights. The assessment of shareholder rights and whether they are substantive participating rights requires significant judgment since the rights provided under shareholders' agreements may include selecting, terminating, and setting the compensation of management responsible for implementing the subsidiary's policies and procedures, establishing operating and capital decisions of the entity, including budgets, in the ordinary course of business. On the other hand, if shareholder rights are only protective in nature (referred to as protective rights) then such rights would not overcome the presumption that the owner of a majority voting interest shall consolidate its investee. Significant judgment is required to determine whether minority rights represent substantive participating rights or protective rights that do not affect the evaluation of control. While both represent an approval or veto right, a distinguishing factor is the underlying activity or action to which the right relates.
Pension and Other Postretirement Plans — Effective January 1, 2016 the Company applied a disaggregated discount rate approach for determining service cost and interest cost for its defined benefit pension plans and post-retirement plans in the U.S. and U.K. Refer to Note 1—General and Summary of Significant Accounting Policies included in Item 8 of this Form 10-K for further information.
New Accounting Pronouncements — See Note 1—General and Summary of Significant Accounting Policies included in Item 8 of this Form 10-K for further information about new accounting pronouncements adopted during 2016 and accounting pronouncements issued but not yet effective.
Previous: Item 6. SELECTED FINANCIAL DATA · Next: Item 7A. QUANTITATIVE AND QUALITATIVE DISCLOSURES ABOUT MARKET RISK