 filings.tools
Item 1. BUSINESS
212K characters. Original on sec.gov · Markdown
Item 1. BUSINESS
Item 1.—Business is an outline of our strategy and our businesses by SBU, including key financial drivers. Additional items that may have an impact on our businesses are discussed in Item 1A.—Risk Factors and Item 3.—Legal Proceedings.
| 5 | 2020 Annual Report |
Executive Summary
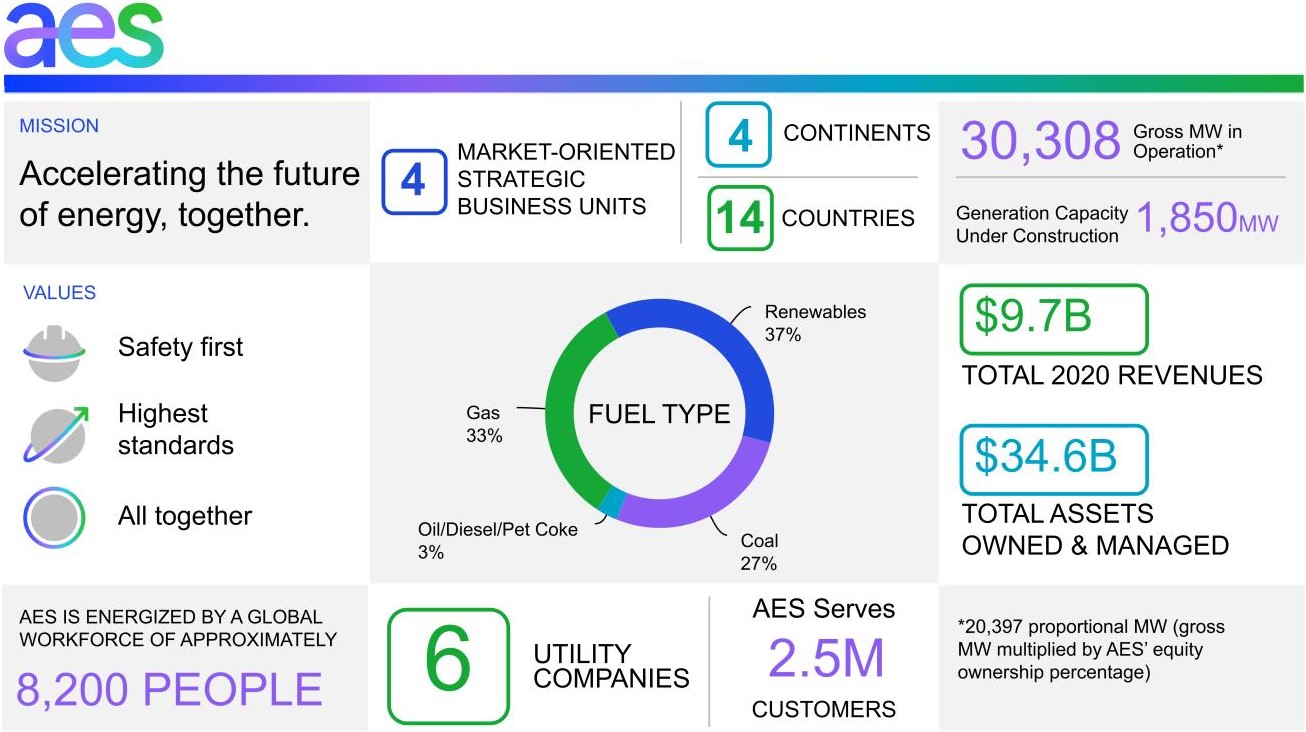
Incorporated in 1981, AES is a global energy company accelerating the future of energy. Together with our many stakeholders, we are improving lives by delivering the greener, smarter energy solutions the world needs. Our diverse workforce is committed to continuous innovation and operational excellence, while partnering with our customers on their strategic energy transitions and continuing to meet their energy needs today.
Our Strategy
AES is leading the energy transition by investing in sustainable growth and innovative solutions to deliver superior results. We are taking advantage of favorable trends in clean power generation, transmission and distribution, and LNG infrastructure.
Through our presence in key growth markets, we are well-positioned to benefit from the global transition toward a more sustainable power generation mix. Our robust backlog of projects under construction or under signed PPAs continues to increase, driven by our focus on select markets where we can take advantage of our global scale and synergies with our existing businesses. In 2020, we signed long-term PPAs for 3 GW, representing 10% of our existing capacity, and in line with our expectation of signing 2 to 3 GW of new PPAs annually.
We are enhancing some of our current contracts by extending existing PPAs and adding renewable energy. We call this approach Green Blend and Extend. With this strategy, we leverage our existing platforms, contracts and relationships to grow our business, while meeting our customers' energy needs on a reliable and sustainable basis. We are negotiating new long-term renewable PPAs with existing customers, which preserves the value of thermal contracts and creates incremental value with long-term contracted renewables. Customers receive carbon-free energy at less than the marginal cost of thermal power, enabling them to meet their sustainability goals and affordable energy needs. We are executing on this strategy in Chile and Mexico and see significant potential additional opportunities in those markets, as well as in the United States.
We recently merged all of our renewables businesses in the U.S. into one team: AES Clean Energy, representing one of the top renewables growth platforms in the U.S. AES Clean Energy offers its customers an expanded portfolio of innovative solutions based on cutting-edge technologies that are designed to accelerate their energy futures.
We are facilitating access to reliable and affordable cleaner energy through our LNG import terminals, allowing
| 6 | 2020 Annual Report |
the displacement of the use of heavy fuel oil and diesel. We have two LNG regasification terminals in Central America and the Caribbean, with a total of 150 TBTU of LNG storage capacity. These terminals were built to supply not only the gas for our co-located combined cycle plants, but also to meet the growing demand for natural gas in the region. In order to meet this demand, we are expanding our capacity in the Dominican Republic by adding a second storage tank with 50 TBTU of additional capacity and we recently completed construction of a pipeline that will transport natural gas from our LNG terminal to several power plants in the country.
We are replicating our success with LNG infrastructure in the Dominican Republic and Panama by developing a similar project, on a larger scale, in Vietnam. This project will have 480 TBTU of LNG storage capacity co-located with 2.2 GW of combined cycle plants. The project will have substantial excess LNG capacity to help meet demand for natural gas in Vietnam and the power plants will have 20-year contracts with the Government of Vietnam.
At our utilities, we are accelerating growth through grid modernization and infrastructure investments to replace outdated networks. In 2020, Indianapolis Power & Light's seven-year $1.2 billion TDSIC plan was approved by the Indiana Utility Regulatory Commission. We see similar growth opportunities at Dayton Power & Light in Ohio, including DP&L's pending Smart Grid Plan.
We are developing and deploying innovative solutions such as battery-based energy storage, digital customer interfaces and energy management. These solutions are scalable and capital light, allowing us to work with our customers to deliver results that meet their requirements.
As a result of executing on our strategy, we have reduced our coal-fired generation to 25% of our total generation volume as of year-end 2020 (based on the portfolio as of year-end, adjusted for any announced asset sales and retirements at that time). We remain on track to further reduce our coal generation to below 10% by year-end 2030.
Strategic Highlights
In 2020, we achieved significant milestones on our strategic objectives, including:
Sustainable Growth
*•*We completed construction of 2,318 MW of new projects, including:
◦1,299 MW Southland Repowering; and
◦1,019 MW of solar, wind and energy storage globally
- We signed 3,017 MW of renewables and energy storage under long-term PPAs, including:
◦1,180 MW of energy storage, solar and solar plus storage and hydro in the US and El Salvador;
◦1,171 MW of wind and solar at AES Gener in Chile and Colombia;
◦346 MW of wind at AES Brasil;
◦211 MW of wind and solar in Panama and the Dominican Republic; and
◦109 MW of wind in Mexico
- As of December 31, 2020, our backlog of 6,909 MW includes:
◦1,850 MW under construction and coming on-line through 2022; and
◦5,059 MW of renewables signed under long-term PPAs
- The Company has reduced its coal-fired generation to 25% of total generation volume (proforma for asset sales and retirements announced in 2020) and is on track to further reduce its coal-fired generation to less than 10% by year-end 2030
Innovative Solutions
- Our joint venture with Siemens, Fluence, is the global leader in the fast-growing energy storage market, which is expected to increase by 15 to 20 GW annually
◦Fluence has been awarded or delivered 2.4 GW of projects, including 785 MW awarded in 2020
◦In December 2020, the Qatar Investment Authority ("QIA") agreed to invest $125 million in Fluence through a private placement transaction, valuing Fluence at more than $1 billion
| 7 | 2020 Annual Report |
Superior Results
- Following our efforts to strengthen our balance sheet, our Parent Company credit rating was upgraded to investment grade (BBB-) by S&P
Overview
Generation
We currently own and/or operate a generation portfolio of 30,308 MW, including generation from our integrated utility, IPL. Our generation fleet is diversified by fuel type. See discussion below under Fuel Costs.
Performance drivers of our generation businesses include types of electricity sales agreements, plant reliability and flexibility, availability of generation capacity to meet contracted sales, fuel costs, seasonality, weather variations and economic activity, fixed-cost management, and competition.
Contract Sales — Most of our generation businesses sell electricity under medium- or long-term contracts ("contract sales") or under short-term agreements in competitive markets ("short-term sales"). Our medium-term contract sales have terms of two to five years, while our long-term contracts have terms of more than five years.
Contracts requiring fuel to generate energy, such as natural gas or coal, are structured to recover variable costs, including fuel and variable O&M costs, either through direct or indexation-based contractual pass-throughs or tolling arrangements. When the contract does not include a fuel pass-through, we typically hedge fuel costs or enter into fuel supply agreements for a similar contract period (see discussion below under Fuel Costs). These contracts also help us to fund a significant portion of the total capital cost of the project through long-term non-recourse project-level financing.
Certain contracts include capacity payments that cover projected fixed costs of the plant, including fixed O&M expenses, debt service, and a return on capital invested. In addition, most of our contracts require that the majority of the capacity payments be denominated in the currency matching our fixed costs.
Contracts that do not have significant fuel cost or do not contain a capacity payment are structured based on long-term spot prices with some negotiated pass-through costs, allowing us to recover expected fixed and variable costs as well as provide a return on investment.
These contracts are intended to reduce exposure to the volatility of fuel and electricity prices by linking the business's revenues and costs. We generally structure our business to eliminate or reduce foreign exchange risk by matching the currency of revenue and expenses, including fixed costs and debt. Our project debt may consist of both fixed and floating rate debt for which we typically hedge a significant portion of our exposure. Some of our contracted businesses also receive a regulated market-based capacity payment, which is discussed in more detail in the Short-Term Sales section below.
Thus, these contracts, or other related commercial arrangements, significantly mitigate our exposure to changes in power and, as applicable, fuel prices, currency fluctuations and changes in interest rates. In addition, these contracts generally provide for a recovery of our fixed operating expenses and a return on our investment, as long as we operate the plant to the reliability and efficiency standards required in the contract.
Short-Term Sales — Our other generation businesses sell power and ancillary services under short-term contracts with average terms of less than two years, including spot sales, directly in the short-term market or at regulated prices. The short-term markets are typically administered by a system operator to coordinate dispatch. Short-term markets generally operate on merit order dispatch, where the least expensive generation facilities, based upon variable cost or bid price, are dispatched first and the most expensive facilities are dispatched last. The short-term price is typically set at the marginal cost of energy or bid price (the cost of the last plant required to meet system demand). As a result, the cash flows and earnings associated with these businesses are more sensitive to fluctuations in the market price for electricity. In addition, many of these wholesale markets include markets for ancillary services to support the reliable operation of the transmission system. Across our portfolio, we provide a wide array of ancillary services, including voltage support, frequency regulation and spinning reserves.
Many of the short-term markets in which we operate include regulated capacity markets. These capacity markets are intended to provide additional revenue based upon availability without reliance on the energy margin from the merit order dispatch. Capacity markets are typically priced based on the cost of a new entrant and the system capacity relative to the desired level of reserve margin (generation available in excess of peak demand).
| 8 | 2020 Annual Report |
Our generating facilities selling in the short-term markets typically receive capacity payments based on their availability in the market.
Plant Reliability and Flexibility — Our contract and short-term sales provide incentives to our generation plants to optimally manage availability, operating efficiency and flexibility. Capacity payments under contract sales are frequently tied to meeting minimum standards. In short-term sales, our plants must be reliable and flexible to capture peak market prices and to maximize market-based revenues. In addition, our flexibility allows us to capture ancillary service revenue while meeting local market needs.
Fuel Costs — For our thermal generation plants, fuel is a significant component of our total cost of generation. For contract sales, we often enter into fuel supply agreements to match the contract period, or we may financially hedge our fuel costs. Some of our contracts include indexation for fuels. In those cases, we seek to match our fuel supply agreements to the indexation. For certain projects, we have tolling arrangements where the power offtaker is responsible for the supply and cost of fuel to our plants.
In short-term sales, we sell power at market prices that are generally reflective of the market cost of fuel at the time, and thus procure fuel supply on a short-term basis, generally designed to match up with our market sales profile. Since fuel price is often the primary determinant for power prices, the economics of projects with short-term sales are often subject to volatility of relative fuel prices. For further information regarding commodity price risk please see Item 7A.—Quantitative and Qualitative Disclosures about Market Risk in this Form 10-K.
37% of the capacity of our generation plants are fueled by renewables, including hydro, solar, wind, energy storage, biomass and landfill gas, which do not have significant fuel costs.
33% of the capacity of our generation plants are fueled by natural gas. Generally, we use gas from local suppliers in each market. A few exceptions to this are AES Gener in Chile, where we purchase imported gas from third parties, and our plants in the Dominican Republic and Panama, where we import LNG to utilize in the local market.
27% of the capacity of our generation fleet is coal-fired. In the U.S., most of our coal-fired plants are supplied from domestic coal. At our non-U.S. generation plants, and at our plants in Hawaii and Puerto Rico, we source coal internationally. Across our fleet, we utilize our global sourcing program to maximize the purchasing power of our fuel procurement.
3% of the capacity of our generation fleet utilizes pet coke, diesel or oil for fuel. We source oil and diesel locally at prices linked to international markets. We largely source pet coke from Mexico and the U.S.
Seasonality, Weather Variations and Economic Activity — Our generation businesses are affected by seasonal weather patterns and, therefore, operating margin is not generated evenly throughout the year. Additionally, weather variations, including temperature, solar and wind resources, and hydrological conditions, may also have an impact on generation output at our renewable generation facilities. In competitive markets for power, local economic activity can also have an impact on power demand and short-term prices for power.
Fixed-Cost Management — In our businesses with long-term contracts, the majority of the fixed O&M costs are recovered through the capacity payment. However, for all generation businesses, managing fixed costs and reducing them over time is a driver of business performance.
Competition — For our businesses with medium- or long-term contracts, there is limited competition during the term of the contract. For short-term sales, plant dispatch and the price of electricity are determined by market competition and local dispatch and reliability rules.
Utilities
AES' six utility businesses distribute power to 2.5 million people in two countries. AES' two utilities in the U.S. also include generation capacity totaling 3,973 MW. Our utility businesses consist of IPL and DP&L in the U.S. and four utilities in El Salvador.
IPL, our fully integrated utility, and DP&L, our transmission and distribution regulated utility, operate as the sole distributors of electricity within their respective jurisdictions. IPL owns and operates all of the facilities necessary to generate, transmit and distribute electricity. DP&L owns and operates all of the facilities necessary to transmit and distribute electricity. At our distribution business in El Salvador, we face limited competition due to significant barriers to enter the market. According to El Salvador's regulation, large regulated customers have the option of becoming unregulated users and requesting service directly from generation or commercialization agents.
| 9 | 2020 Annual Report |
In general, our utilities sell electricity directly to end-users, such as homes and businesses, and bill customers directly. Key performance drivers for utilities include the regulated rate of return and tariff, seasonality, weather variations, economic activity and reliability of service. Revenue from utilities is classified as regulated on the Consolidated Statements of Operations.
Regulated Rate of Return and Tariff — In exchange for the right to sell or distribute electricity in a service territory, our utility businesses are subject to government regulation. This regulation sets the framework for the prices ("tariffs") that our utilities are allowed to charge customers for electricity and establishes service standards that we are required to meet.
Our utilities are generally permitted to earn a regulated rate of return on assets, determined by the regulator based on the utility's allowed regulatory asset base, capital structure and cost of capital. The asset base on which the utility is permitted a return is determined by the regulator, within the framework of applicable local laws, and is based on the amount of assets that are considered used and useful in serving customers. Both the allowed return and the asset base are important components of the utility's earning power. The allowed rate of return and operating expenses deemed reasonable by the regulator are recovered through the regulated tariff that the utility charges to its customers.
The tariff may be reviewed and reset by the regulator from time to time depending on local regulations, or the utility may seek a change in its tariffs. The tariff is generally based upon usage level and may include a pass-through of costs that are not controlled by the utility, such as the costs of fuel (in the case of integrated utilities) and/or the costs of purchased energy, to the customer. Components of the tariff that are directly passed through to the customer are usually adjusted through a summary regulatory process or an existing formula-based mechanism. In some regulatory regimes, customers with demand above an established level are unregulated and can choose to contract directly with the utility or with other retail energy suppliers and pay non-bypassable fees, which are fees to the distribution company for use of its distribution system.
The regulated tariff generally recognizes that our utility businesses should recover certain operating and fixed costs, as well as manage uncollectible amounts, quality of service and technical and non-technical losses. Utilities, therefore, need to manage costs to the levels reflected in the tariff, or risk non-recovery of costs or diminished returns.
Seasonality, Weather Variations, and Economic Activity — Our utility businesses are generally affected by seasonal weather patterns and, therefore, operating margin is not generated evenly throughout the year. Additionally, weather variations may also have an impact based on the number of customers, temperature variances from normal conditions, and customers' historic usage levels and patterns. Retail sales, after adjustments for weather variations, are also affected by changes in local economic activity, energy efficiency and distributed generation initiatives, as well as the number of retail customers.
Reliability of Service — Our utility businesses must meet certain reliability standards, such as duration and frequency of outages. Those standards may be explicit, with defined performance incentives or penalties, or implicit, where the utility must operate to meet customer and/or regulator expectations.
Development and Construction
We develop and construct new generation facilities. For our utility business, new plants may be built or existing plants retrofitted in response to customer needs or to comply with regulatory developments. The projects are developed subject to regulatory approval that permits recovery of our capital cost and a return on our investment. For our generation businesses, our priority for development is in key growth markets, where we can leverage our global scale and synergies with our existing businesses by adding renewable energy. We make the decision to invest in new projects by evaluating the strategic fit, project returns and financial profile against a fair risk-adjusted return for the investment and against alternative uses of capital, including corporate debt repayment.
In some cases, we enter into long-term contracts for output from new facilities prior to commencing construction. To limit required equity contributions from The AES Corporation, we also seek non-recourse project debt financing and other sources of capital, including partners, when it is commercially attractive. We typically contract with a third party to manage construction, although our construction management team supervises the construction work and tracks progress against the project's budget and the required safety, efficiency and productivity standards.
| 10 | 2020 Annual Report |
Segments
The segment reporting structure uses the Company's management reporting structure as its foundation to reflect how the Company manages the business internally. It is organized by geographic regions, which provides a socio-political-economic understanding of our business.
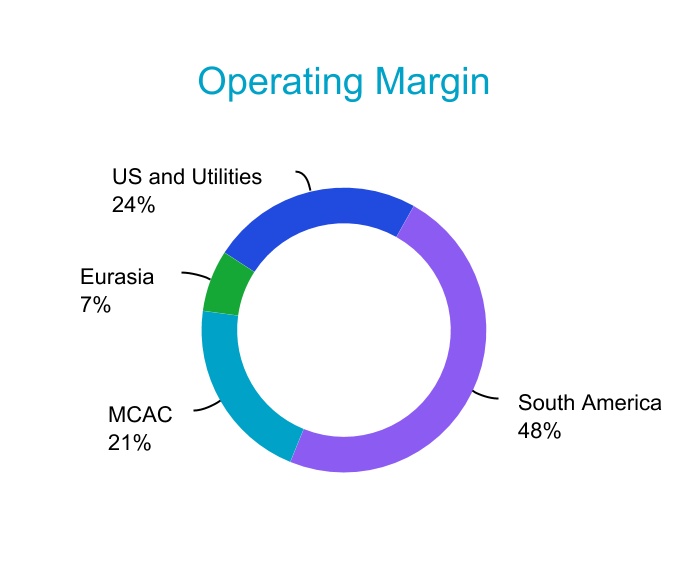
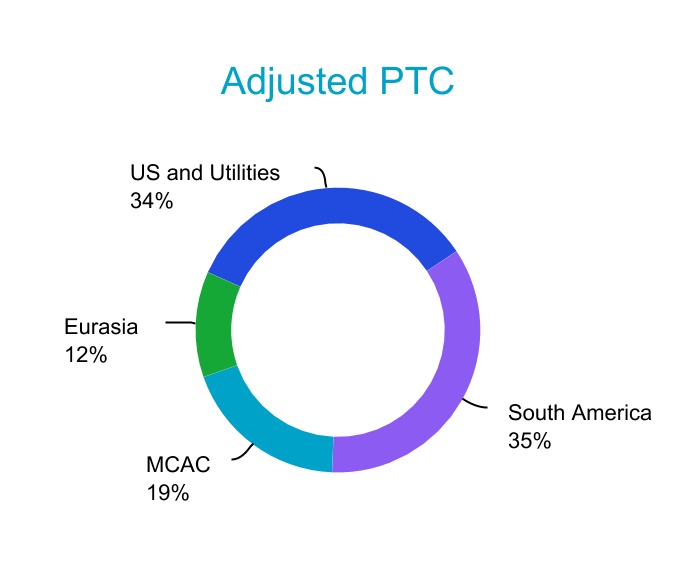
We are organized into four market-oriented SBUs: US and Utilities (United States, Puerto Rico and El Salvador); South America (Chile, Colombia, Argentina and Brazil); MCAC (Mexico, Central America and the Caribbean); and Eurasia (Europe and Asia) — which are led by our SBU Presidents. We have two lines of business: generation and utilities. Each of our SBUs participates in our first business line, generation, in which we own and/or operate power plants to generate and sell power to customers, such as utilities, industrial users, and other intermediaries. Our US and Utilities SBU participates in our second business line, utilities, in which we own and/or operate utilities to generate or purchase, distribute, transmit and sell electricity to end-user customers in the residential, commercial, industrial and governmental sectors within a defined service area. In certain circumstances, our utilities also generate and sell electricity on the wholesale market.
We measure the operating performance of our SBUs using Adjusted PTC, a non-GAAP measure. The Adjusted PTC by SBU for the year ended December 31, 2020 is shown below. The percentages for Adjusted PTC are the contribution by each SBU to the gross metric, i.e., the total Adjusted PTC by SBU, before deductions for Corporate. See Item 7.—Management's Discussion and Analysis of Financial Condition and Results of Operations—SBU Performance Analysis of this Form 10-K for reconciliation and definitions of Adjusted PTC.
For financial reporting purposes, the Company's corporate activities and certain other investments are reported within "Corporate and Other" because they do not require separate disclosure. See Item 7.—Management's Discussion and Analysis of Financial Condition and Results of Operations and Note 18—Segment and Geographic Information included in Item 8.—Financial Statements and Supplementary Data of this Form 10-K for further discussion of the Company's segment structure.
| 11 | 2020 Annual Report |
| (1) Non-GAAP measure. See Item 7.—Management’s Discussion and Analysis of Financial Condition and Results of Operations—SBU Performance Analysis—Non-GAAP Measures for reconciliation and definition. |
| 12 | 2020 Annual Report |
US and Utilities SBU
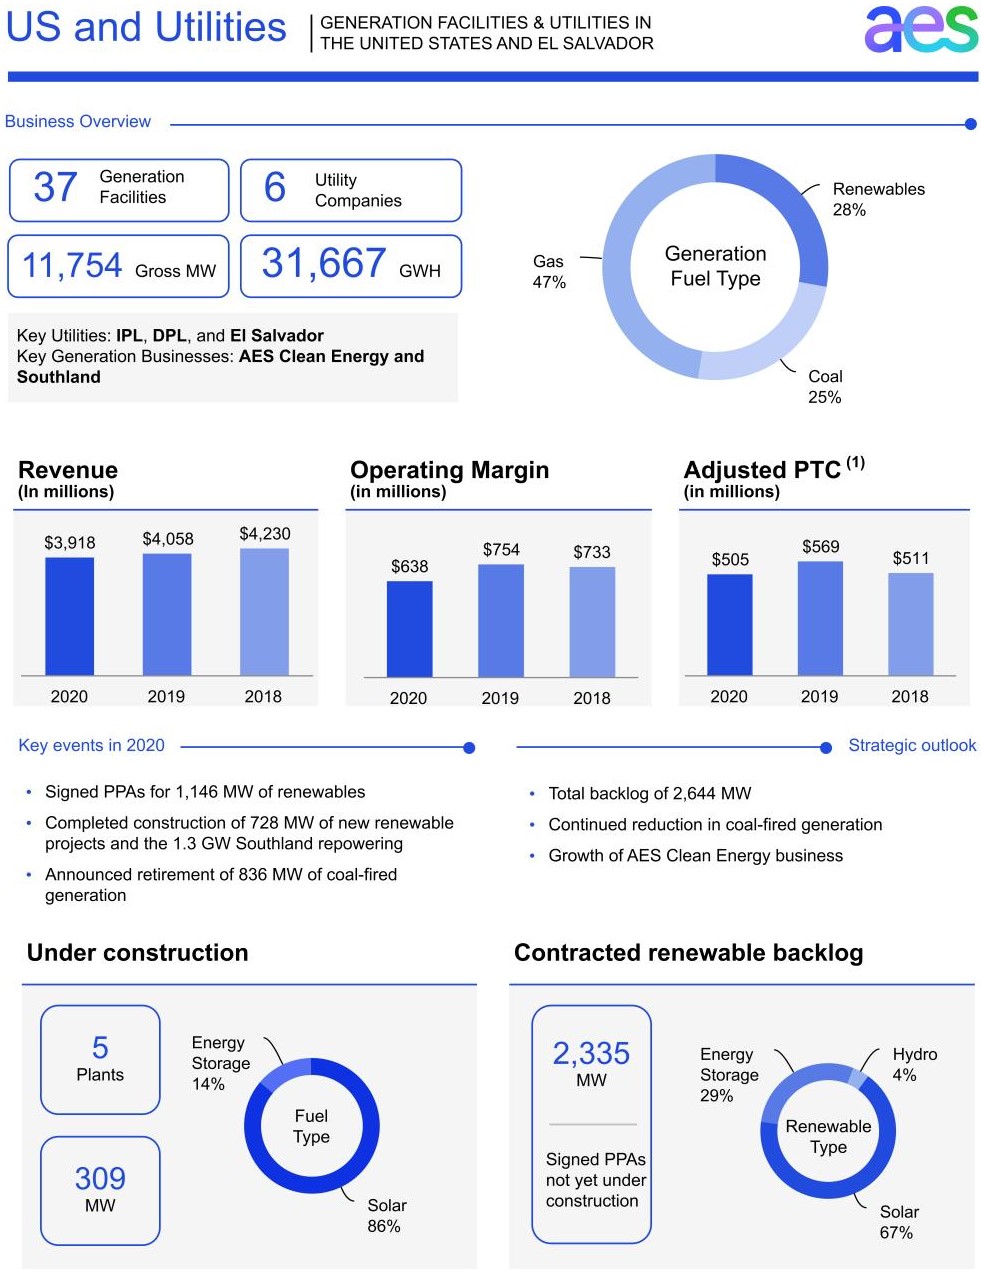
Our US and Utilities SBU has 37 generation facilities, two utilities in the United States, and four utilities in El Salvador.
Generation — Operating installed capacity of our US and Utilities SBU totals 11,754 MW. IPALCO (IPL's parent), DP&L, and DPL Inc. (DP&L's parent) are all SEC registrants, and as such, follow the public filing requirements of the Securities Exchange Act of 1934. The following table lists our US and Utilities SBU generation facilities:
| Business | Location | Fuel | Gross MW | AES Equity Interest | Year Acquired or Began Operation | Contract Expiration Date | Customer(s) | |||||||||||||||||||||||||||||||||||||
| Bosforo (1) | El Salvador | Solar | 100 | 50 | % | 2018-2019 | 2043-2044 | CAESS, EEO, CLESA, DEUSEM | ||||||||||||||||||||||||||||||||||||
| AES Nejapa | El Salvador | Landfill Gas | 6 | 100 | % | 2011 | 2035 | CAESS | ||||||||||||||||||||||||||||||||||||
| Opico | El Salvador | Solar | 4 | 100 | % | 2020 | 2040 | CLESA | ||||||||||||||||||||||||||||||||||||
| Moncagua | El Salvador | Solar | 3 | 100 | % | 2015 | 2035 | EEO | ||||||||||||||||||||||||||||||||||||
| El Salvador Subtotal | 113 | |||||||||||||||||||||||||||||||||||||||||||
| Southland—Alamitos | US-CA | Gas | 1,200 | 100 | % | 1998 | 2023 | Various | ||||||||||||||||||||||||||||||||||||
| AES Clean Energy (sPower OpCo A (1)) | US-Various | Solar | 1,101 | 26 | % | 2017-2019 | 2028-2046 | Various | ||||||||||||||||||||||||||||||||||||
| Southland—Redondo Beach | US-CA | Gas | 876 | 100 | % | 1998 | 2021 | Various | ||||||||||||||||||||||||||||||||||||
| Southland Energy—Alamitos (2) | US-CA | Gas | 650 | 65 | % | 2020 | 2040 | Southern California Edison | ||||||||||||||||||||||||||||||||||||
| Southland Energy—Huntington Beach(2) | US-CA | Gas | 649 | 65 | % | 2020 | 2040 | Southern California Edison | ||||||||||||||||||||||||||||||||||||
| AES Puerto Rico | US-PR | Coal | 524 | 100 | % | 2002 | 2027 | Puerto Rico Electric Power Authority | ||||||||||||||||||||||||||||||||||||
| AES Clean Energy (AES Distributed Energy) (3) | US-Various | Solar | 283 | 100 | % | 2015-2020 | 2029-2042 | Utility, Municipality, Education, Non-Profit | ||||||||||||||||||||||||||||||||||||
| Energy Storage | 39 | |||||||||||||||||||||||||||||||||||||||||||
| Southland—Huntington Beach | US-CA | Gas | 236 | 100 | % | 1998 | 2023 | Various | ||||||||||||||||||||||||||||||||||||
| Buffalo Gap II (3) | US-TX | Wind | 228 | 100 | % | 2007 | ||||||||||||||||||||||||||||||||||||||
| Hawaii (4) | US-HI | Coal | 206 | 100 | % | 1992 | 2022 | Hawaiian Electric Co. | ||||||||||||||||||||||||||||||||||||
| Warrior Run | US-MD | Coal | 205 | 100 | % | 2000 | 2030 | Potomac Edison | ||||||||||||||||||||||||||||||||||||
| Prevailing Winds (AES Clean Energy/sPower) | US-SD | Wind | 200 | 50 | % | 2020 | 2050 | Prevailing Winds | ||||||||||||||||||||||||||||||||||||
| Buffalo Gap III (3) | US-TX | Wind | 170 | 100 | % | 2008 | ||||||||||||||||||||||||||||||||||||||
| Highlander (AES Clean Energy/sPower) | US-VA | Solar | 165 | 50 | % | 2020 | 2035 | Apple, Akami, Etsy, Microsoft | ||||||||||||||||||||||||||||||||||||
| AES Clean Energy (sPower OpCo A (1)) | US-Various | Wind | 140 | 26 | % | 2017 | 2036 | Various | ||||||||||||||||||||||||||||||||||||
| AES Clean Energy (sPower OpCo B (1)) | US-Various | Solar | 126 | 50 | % | 2019 | 2039-2044 | Various | ||||||||||||||||||||||||||||||||||||
| Buffalo Gap I (3) | US-TX | Wind | 108 | 100 | % | 2006 | 2021 | Direct Energy | ||||||||||||||||||||||||||||||||||||
| Southland Energy—Alamitos Energy Center (2) | US-CA | Energy Storage | 100 | 65 | % | 2021 | 2041 | Southern California Edison | ||||||||||||||||||||||||||||||||||||
| East Line Solar (AES Clean Energy/sPower) | US-AZ | Solar | 100 | 50 | % | 2020 | 2045 | Salt River Project | ||||||||||||||||||||||||||||||||||||
| Laurel Mountain | US-WV | Wind | 98 | 100 | % | 2011 | ||||||||||||||||||||||||||||||||||||||
| Mountain View I & II | US-CA | Wind | 64 | 100 | % | 2008 | 2021 | Southern California Edison | ||||||||||||||||||||||||||||||||||||
| Mountain View IV | US-CA | Wind | 49 | 100 | % | 2012 | 2032 | Southern California Edison | ||||||||||||||||||||||||||||||||||||
| Lawa'i (AES Clean Energy/AES Distributed Energy (3)) | US-HI | Solar | 20 | 100 | % | 2018 | 2043 | Kaua'i Island Utility Cooperative | ||||||||||||||||||||||||||||||||||||
| Energy Storage | 20 | |||||||||||||||||||||||||||||||||||||||||||
| Kekaha (AES Clean Energy/AES Distributed Energy (3)) | US-HI | Solar | 14 | 100 | % | 2019 | 2045 | Kaua'i Island Utility Cooperative | ||||||||||||||||||||||||||||||||||||
| Energy Storage | 14 | |||||||||||||||||||||||||||||||||||||||||||
| Na Pua Makani | US-HI | Wind | 28 | 100 | % | 2020 | 2040 | HECO | ||||||||||||||||||||||||||||||||||||
| Ilumina | US-PR | Solar | 24 | 100 | % | 2012 | 2032 | Puerto Rico Electric Power Authority | ||||||||||||||||||||||||||||||||||||
| Laurel Mountain ES | US-WV | Energy Storage | 16 | 100 | % | 2011 | ||||||||||||||||||||||||||||||||||||||
| Southland Energy—AES Gilbert (Salt River) (2) | US-AZ | Energy Storage | 10 | 65 | % | 2019 | 2039 | Salt River Project Agricultural Improvement & Power District | ||||||||||||||||||||||||||||||||||||
| Warrior Run ES | US-MD | Energy Storage | 5 | 100 | % | 2016 | ||||||||||||||||||||||||||||||||||||||
| United States Subtotal | 7,668 | |||||||||||||||||||||||||||||||||||||||||||
| 7,781 |
(1)Unconsolidated entity, accounted for as an equity affiliate.
| 13 | 2020 Annual Report |
(2)AES is entitled to all earnings or losses until March 1, 2021, and any distributions related thereto.
(3)AES owns these assets together with third-party tax equity investors with variable ownership interests. The tax equity investors receive a portion of the economic attributes of the facilities, including tax attributes, that vary over the life of the projects. The proceeds from the issuance of tax equity are recorded as noncontrolling interest in the Company's Consolidated Balance Sheets.
(4)In November 2020, announced expected retirement in 2022.
Utilities — The following table lists our utilities and their generation facilities.
| Business | Location | Approximate Number of Customers Served as of 12/31/2020 | GWh Sold in 2020 | Fuel | Gross MW | AES Equity Interest | Year Acquired or Began Operation | |||||||||||||||||||||||||||||||||||||
| CAESS | El Salvador | 624,000 | 1,945 | 75 | % | 2000 | ||||||||||||||||||||||||||||||||||||||
| CLESA | El Salvador | 432,000 | 936 | 80 | % | 1998 | ||||||||||||||||||||||||||||||||||||||
| DEUSEM | El Salvador | 87,000 | 144 | 74 | % | 2000 | ||||||||||||||||||||||||||||||||||||||
| EEO | El Salvador | 330,000 | 615 | 89 | % | 2000 | ||||||||||||||||||||||||||||||||||||||
| El Salvador Subtotal | 1,473,000 | 3,640 | ||||||||||||||||||||||||||||||||||||||||||
| DPL (1) | US-OH | 531,000 | 13,468 | 100 | % | 2011 | ||||||||||||||||||||||||||||||||||||||
| IPL (2) | US-IN | 512,000 | 14,559 | Coal/Gas/Oil/Energy Storage | 3,973 | 70 | % | 2001 | ||||||||||||||||||||||||||||||||||||
| United States Subtotal | 1,043,000 | 28,027 | 3,973 | |||||||||||||||||||||||||||||||||||||||||
| 2,516,000 | 31,667 |
(1)DPL's GWh sold in 2020 represent DP&L's (DPL's subsidiary) total transmission and distribution sales. DPL's wholesale revenues and DP&L's SSO utility revenues, which are sales to utility customers who use DP&L to source their electricity through a competitive bid process, were 4,481 GWh in 2020. DPL's other primary subsidiary, AES Ohio Generation, LLC, owned an interest in Conesville Unit 4. This plant was shutdown in May 2020 and sold in June 2020. DP&L also owns a 4.9% equity ownership in OVEC, an electric generating company. OVEC has two plants in Cheshire, Ohio and Madison, Indiana with a combined generation capacity of approximately 2,109 MW. DP&L’s share of this generation is approximately 103 MW.
(2)CDPQ owns direct and indirect interests in IPALCO which total approximately 30%. AES owns 85% of AES US Investments and AES US Investments owns 82.35% of IPALCO. IPL plants: Georgetown, Harding Street, Petersburg and Eagle Valley. 20 MW of IPL total is considered a transmission asset. In December 2019, IPL announced it would be retiring Petersburg Unit 1 in June 2021 and Petersburg Unit 2 in June 2023, a total of 630 MW. IPL issued an all-source Request for Proposal in December 2019 in order to competitively procure replacement capacity.
Under construction — The following table lists our plants under construction in the US and Utilities SBU:
| Business | Location | Fuel | Gross MW | AES Equity Interest | Expected Date of Commercial Operations | |||||||||||||||||||||||||||
| AES Clean Energy (AES Distributed Energy) | US-Various | Solar | 77 | 100 | % | 1H 2021 | ||||||||||||||||||||||||||
| Energy Storage | 42 | |||||||||||||||||||||||||||||||
| Central Line (AES Clean Energy/sPower) | US-AZ | Solar | 100 | 50 | % | 2H 2021 | ||||||||||||||||||||||||||
| Clover Creek (AES Clean Energy/sPower) | US-UT | Solar | 80 | 50 | % | 2H 2021 | ||||||||||||||||||||||||||
| Cuscatlan Solar | El Salvador | Solar | 10 | 100 | % | 1H 2021 | ||||||||||||||||||||||||||
| 309 |
The majority of projects under construction have executed long-term PPAs or, as applicable, have been assigned tariffs through a regulatory process.
| 14 | 2020 Annual Report |
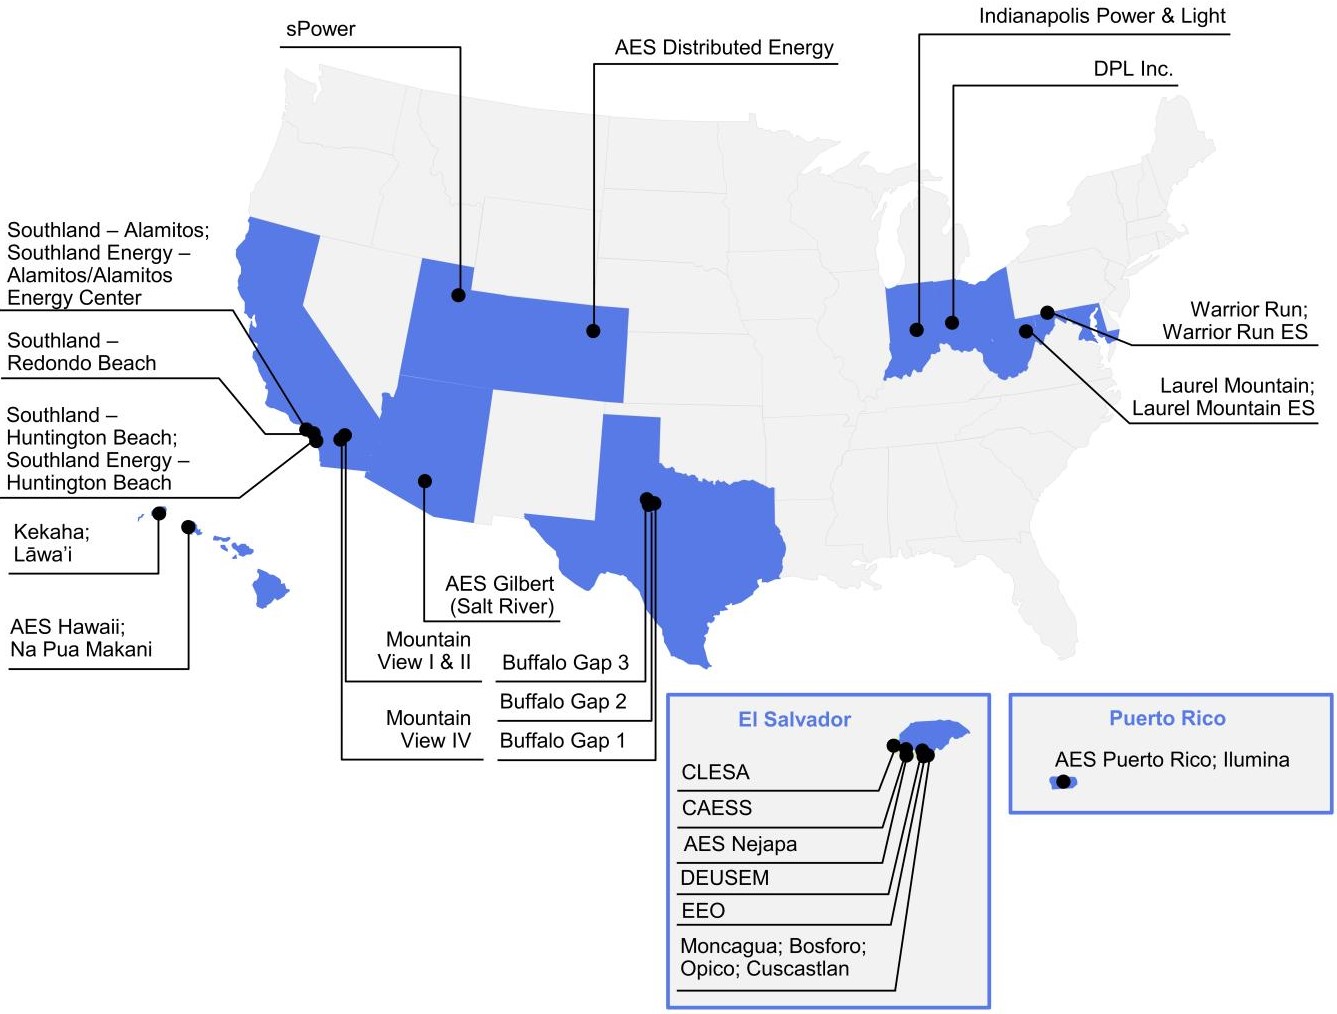
The following map illustrates the locations of our US and Utilities facilities:
US and Utilities Businesses
IPL
Business Description — IPALCO is a holding company whose principal subsidiary is IPL. IPL, which also does business as AES Indiana, is an integrated utility that is engaged primarily in generating, transmitting, distributing, and selling electric energy to retail customers in the city of Indianapolis and neighboring areas within the state of Indiana and is subject to regulatory authority—see Regulatory Framework and Market Structure below. IPL has an exclusive right to provide electric service to the customers in its service area, covering about 528 square miles with an estimated population of approximately 965,000 people. IPL owns and operates four generating stations, all within the state of Indiana. IPL’s largest generating station, Petersburg, is coal-fired, and IPL has plans to retire approximately 630 MW of coal-fired generation at Petersburg Units 1 and 2 in 2021 and 2023, respectively (see Integrated Resource Plan below). The second largest station, Harding Street, uses natural gas and fuel oil to power combustion turbines. In addition, IPL operates a 20 MW battery-based energy storage unit at Harding Street, which provides frequency response. The third station, Eagle Valley, is a CCGT natural gas plant. IPL took operational control and commenced commercial operations of this CCGT in April 2018. The fourth station, Georgetown, is a small peaking station that uses natural gas to power combustion turbines. In addition, IPL helps meet its customers' energy needs with long-term contracts for the purchase of 96 MW of solar-generated electricity and 300 MW of wind-generated electricity.
Key Financial Drivers — IPL's financial results are driven primarily by retail demand, weather, and maintenance costs. IPL's financial results are likely to be driven by many other factors as well, including, but not limited to:
- regulatory outcomes and impacts;
| 15 | 2020 Annual Report |
-
the passage of new legislation, implementation of regulations, or other changes in regulation; and
-
timely recovery of capital expenditures.
Regulatory Framework and Market Structure — IPL is subject to comprehensive regulation by the IURC with respect to its services and facilities, retail rates and charges, the issuance of long-term securities, and certain other matters. The regulatory authority of the IURC over IPL's business is typical of regulation generally imposed by state public utility commissions. The IURC sets tariff rates for electric service provided by IPL. The IURC considers all allowable costs for ratemaking purposes, including a fair return on assets used and useful to providing service to customers.
IPL's tariff rates for electric service to retail customers consist of basic rates and approved charges. In addition, IPL's rates include various adjustment mechanisms, including, but not limited to: (i) a rider to reflect changes in fuel and purchased power costs to meet IPL's retail load requirements, referred to as the Fuel Adjustment Charge, (ii) a rider to reflect changes in ongoing RTO costs, and (iii) a rider for the timely recovery of demand side management energy efficiency program costs, and (iv) riders to collect changes in capacity sales and wholesale sales margins above and below established annual benchmarks, referred to as the Capacity Adjustment and Off-System Sales Margin Adjustment, respectively. These components function somewhat independently of one another, but the overall structure of IPL's rates is subject to review at the time of any review of IPL's basic rates and charges. Additionally, IPL's rider recoveries are reviewed through recurring filings.
On October 31, 2018, the IURC issued an order approving an uncontested settlement agreement to increase IPL's annual revenues by $44 million, or 3% (the "2018 Base Rate Order"). This revenue increase primarily includes recovery through rates of costs associated with the CCGT at Eagle Valley, completed in the first half of 2018, and other construction projects. New base rates and charges became effective on December 5, 2018. The 2018 Base Rate Order also provides customers with approximately $50 million in benefits over a two-year period through a rate adjustment mechanism that began in March 2019.
IPL is one of many transmission system owner members in MISO, an RTO which maintains functional control over the combined transmission systems of its members and manages one of the largest energy and ancillary services markets in the U.S. MISO dispatches generation assets in economic order considering transmission constraints and other reliability issues to meet the total demand in the MISO region. IPL offers electricity in the MISO day-ahead and real-time markets.
Development Strategy — IPL's construction program is composed of capital expenditures necessary for prudent utility operations and compliance with environmental regulations, along with discretionary investments designed to replace aging equipment or improve overall performance.
Senate Enrolled Act 560, the Transmission, Distribution, and Storage System Improvement Charge ("TDSIC") statute, provides for cost recovery outside of a base rate proceeding for new or replacement electric and gas transmission, distribution, and storage projects that a public utility undertakes for the purposes of safety, reliability, system modernization, or economic development. Provisions of the TDSIC statute require that requests for recovery include a seven-year plan of eligible investments. Once a plan is approved by the IURC, eighty percent of eligible costs can be recovered using a periodic rate adjustment mechanism, referred to as a TDSIC mechanism. Recoverable costs include a return on, and of, the investment, including AFUDC, post-in-service carrying charges, operation and maintenance expenses, depreciation, and property taxes. The remaining twenty percent of recoverable costs are deferred for future recovery in the public utility’s next general rate case. The TDSIC mechanism is capped at an annual increase of two percent of total retail revenues.
On March 4, 2020, the IURC issued an order approving the projects in IPL's seven-year TDSIC Plan for eligible transmission, distribution, and storage system improvements totaling $1.2 billion from 2020 through 2027. On June 18, 2020, IPL filed its first annual TDSIC rate adjustment for a return on, and of, investments through March 31, 2020. On October 14, 2020, the IURC issued an order approving this TDSIC rate adjustment, which was reflected in rates effective November 2020.
Integrated Resource Plan — In December 2019, IPL filed its Integrated Resource Plan ("IRP"), which describes IPL's Preferred Resource Portfolio for meeting its generation capacity needs for serving its retail customers over the next several years. IPL's Preferred Resource Portfolio is IPL's reasonable least cost option and provides a cleaner and more diverse generation mix for customers. The IRP includes the retirement of 630 MW of coal-fired generation by 2023. Based on extensive modeling, IPL has determined that the cost of operating Petersburg Units 1 and 2 exceeds the value customers receive compared to alternative resources. Retirement of these units allows the company to cost-effectively diversify the portfolio and transition to lower cost and cleaner resources while maintaining a reliable system.
| 16 | 2020 Annual Report |
IPL issued an all-source Request for Proposal on December 20, 2019, in order to competitively procure replacement capacity by June 1, 2023, which is the first year IPL is expected to have a capacity shortfall. Modeling indicated that a combination of wind, solar, storage, and energy efficiency would be the lowest reasonable cost option for the replacement capacity. Proposals were received through February 28, 2020 and are currently being evaluated. On February 5, 2021, IPL announced an agreement to acquire a 195 MW solar project, subject to approval from the IURC.
DPL
Business Description — DPL is an energy holding company whose principal subsidiary is DP&L. DP&L, which also does business as AES Ohio, is a utility company that transmits and distributes electricity to retail customers in a 6,000 square mile area of West Central Ohio and is subject to regulatory authority—see Regulatory Framework and Market Structure below. DP&L has the exclusive right to provide transmission and distribution services to its customers, and procures retail standard service offer ("SSO") electric service on behalf of residential, commercial, industrial, and governmental customers through a competitive bid auction process. In previous years, AES Ohio Generation was also a primary subsidiary, but DPL has systematically exited this generation business. AES Ohio Generation completed the sale of its peaker assets in March 2018. In May 2018, AES Ohio Generation retired its Stuart and Killen facilities and completed the transfer of these facilities to a third party in December 2019. AES Ohio Generation's only remaining operating asset, Conesville Unit 4, was shut down in May 2020 and sold in June 2020.
Key Financial Drivers — Following the removal of the Decoupling Rider in December 2019, DPL's financial results are driven primarily by retail demand and weather. DPL's financial results are likely to be driven by other factors as well, including, but not limited to:
-
regulatory outcomes and impacts;
-
the passage of new legislation, implementation of regulations, or other changes in regulations; and
-
timely recovery of transmission and distribution expenditures.
Regulatory Framework and Market Structure — DP&L is regulated by the PUCO for its distribution services and facilities, retail rates and charges, reliability of service, compliance with renewable energy portfolio requirements, energy efficiency program requirements, and certain other matters. The PUCO maintains jurisdiction over the delivery of electricity, SSO, and other retail electric services.
Electric customers within Ohio are permitted to purchase power under contract from a Competitive Retail Electric Service ("CRES") provider or from their local utility under SSO rates. The SSO generation supply is provided by third parties through a competitive bid process. Ohio utilities have the exclusive right to provide transmission and distribution services in their state-certified territories. While Ohio allows customers to choose retail generation providers, DP&L is required to provide retail generation service at SSO rates to any customer that has not signed a contract with a CRES provider or as a provider of last resort in the event of a CRES provider default. SSO rates are subject to rules and regulations of the PUCO and are established through a competitive bid process for the supply of power to SSO customers.
DP&L's distribution rates are regulated by the PUCO and are established through a traditional cost-based rate-setting process. DP&L is permitted to recover its costs of providing distribution service as well as earn a regulated rate of return on assets, determined by the regulator, based on the utility's allowed regulated asset base, capital structure, and cost of capital. DP&L's retail rates include various adjustment mechanisms including, but not limited to, the timely recovery of costs incurred related to power purchased through the competitive bid process, participation in the PJM RTO, severe storm damage, and energy efficiency. DP&L's transmission rates are regulated by FERC.
DP&L is a member of PJM, an RTO that operates the transmission systems owned by utilities operating in all or parts of a multi-state region, including Ohio. PJM also administers the day-ahead and real-time energy markets, ancillary services market and forward capacity market for its members.
In September 2018, DP&L received an order from the PUCO establishing new base distribution rates, which became effective October 1, 2018. The order approved, without modification, a stipulation and recommendation previously filed by DP&L, along with various intervening parties, with the PUCO staff. The order established a revenue requirement of $248 million for DP&L's electric service base distribution rates, which reflected an increase to distribution revenues of $30 million per year. In addition, the order authorized DP&L to collect from customers costs related to qualified investments through a Distribution Investment Rider ("DIR"), changed the Decoupling Rider to reduce variability from the impact of weather and demand, partially resolved regulatory issues related to the TCJA, and authorized DP&L to defer certain vegetation management costs for future collection.
| 17 | 2020 Annual Report |
On November 30, 2020, DP&L filed a new Distribution Rate Case Application proposing a revenue increase of $121 million per year and incorporates DIR investments that were planned and approved in the last rate case but not yet included in distribution rates, other distribution investments since September 2015, investments necessitated by the tornados that occurred on Memorial Day in 2019, and other proposed increases. The outcome of this filing is unknown at this time.
In March 2020, DP&L filed an application for a formula-based rate for its transmission service, which was approved and made effective May 3, 2020. In December 2020, a unanimous settlement was reached regarding these rates and filed with the FERC, which would be an approximately $7 million annualized increase from the rates in effect prior to May 3, 2020. The uncontested settlement is expected to receive FERC approval in early 2021.
ESP Proceedings — Ohio law requires utilities to provide their customers a default generation service, known as an SSO, which can be in the form of an electric security plan ("ESP") or a market rate offer ("MRO"), submitted for approval to the PUCO. The PUCO previously approved DP&L’s ESP for a six-year period beginning on November 1, 2017 (“ESP 3”). ESP 3 established a Distribution Modernization Rider (“DMR”) with an initial three-year term to collect $105 million in revenue per year through October 2020 primarily to pay debt obligations at DPL and DP&L and position DP&L to modernize and/or maintain its transmission and distribution infrastructure.
In November 2019, the PUCO issued an order modifying the ESP 3 by removing the DMR. As a result, DP&L requested and the PUCO approved the request to revert to the ESP 1 rates, including authorizing the collection of a Rate Stability Charge ("RSC") of approximately $79 million per year, effective December 18, 2019. The order also disallowed the Regulatory Compliance Rider, Uncollectible Rider, DIR, and the Decoupling Rider. The PUCO order also required DP&L to conduct both an ESP v. MRO Test to validate that the ESP is more favorable in the aggregate than what would be experienced under an MRO, and a prospective SEET, both of which were filed with the PUCO on April 1, 2020. DP&L is also subject to an annual retrospective SEET. On October 23, 2020, DP&L entered into a Stipulation and Recommendation with the staff of the PUCO and certain other parties with respect to, among other matters, DP&L’s applications pending at the PUCO for (i) approval of DP&L’s plan to modernize its distribution grid (the “Smart Grid Plan”), (ii) findings that DP&L passed the SEET for 2018 and 2019, and (iii) findings that DP&L’s current electric security plan, ESP 1, satisfies the SEET and the more favorable in the aggregate (“MFA”) regulatory test. The settlement is subject to, and conditioned upon, approval by the PUCO. A hearing was conducted January 11 - 15, 2021 for consideration of this settlement. The settlement would provide, among other items, for the following:
-
Approval of the Smart Grid Plan outlined in the Smart Grid Plan application filed by DP&L with the PUCO, as modified by the terms of the settlement, including, subject to offsetting operational benefits and certain other conditions, a return on and recovery of up to $249 million of Smart Grid Plan Phase 1 capital investments and recovery of operational and maintenance expenses through DP&L’s existing Infrastructure Investment Rider for a term of four years, under an aggregate cap of approximately $268 million on the amount of such investments and expenses that is recoverable, and an acknowledgement that DP&L may file a subsequent application with the PUCO within three years seeking approvals for Phase 2 of the Smart Grid Plan;
-
A commitment by DP&L to invest in a Customer Information System and supporting technologies during Phase 1 of the Smart Grid Plan, with return on and of prudently incurred capital investments and operational and maintenance expenses, including deferred operational and maintenance expense amounts, in a future rate case;
-
A determination that ESP 1 satisfies the prospective SEET and the MFA regulatory test;
-
A recommendation by parties to the settlement that the PUCO also finds that DP&L satisfies the retrospective SEET for 2018 and 2019;
-
A commitment to file an application with the PUCO no later than October 1, 2023 for a new ESP that does not seek to implement certain non-bypassable charges, including those related to provider of last resort risks, stability, or financial integrity;
-
DP&L shareholder funding, in an aggregate amount of approximately $30 million over four years, for certain economic development discounts, incentives, and grants to certain commercial and industrial customers, including hospitals and manufacturers, assistance for low-income customers as well as the residents and businesses of the City of Dayton, and promotion of solar and resiliency development within DP&L’s service territory.
Certain parties which intervened in the ESP proceedings have filed petitions for rehearing of the recent PUCO ESP order, some of which seek to eliminate DP&L's RSC from its rates and others to re-implement ESP 3 without
| 18 | 2020 Annual Report |
the DMR. The ultimate outcome of these petitions is unknown and could have a material adverse effect on DP&L’s results of operations, financial condition and cash flows. The parties signing the above-referenced settlement have agreed to withdraw their respective petitions if the settlement is approved by the PUCO without material modification.
Separate from the ESP process, on January 23, 2020, DP&L filed with the PUCO requesting approval to defer its decoupling costs consistent with the methodology approved in its Distribution Rate Case. If approved, deferral would be effective December 18, 2019 and going forward would reduce impacts of weather, energy efficiency programs, and economic changes in customer demand.
Development Strategy — Planned construction projects primarily relate to new investments in and upgrades to DP&L's transmission and distribution system. Capital projects are subject to continuing review and are revised in light of changes in financial and economic conditions, load forecasts, legislative and regulatory developments, and changing environmental standards, among other factors.
DPL is projecting to spend an estimated $767 million on capital projects from 2021 through 2023, which includes expected spending under DP&L's Smart Grid Plan included in the Stipulation and Recommendation entered into on October 23, 2020 (see Regulatory Framework and Market Structure above) as well as new transmission projects. The Smart Grid Plan was initially filed with the PUCO in December 2018 proposing to invest $576 million in capital projects over 10 years and includes leveraging technologies to modernize and improve the sustainability of the grid, and enhancing customer experience and security, as well as to allow DP&L to leverage and integrate distributed energy resources into its grid, including community solar, energy storage, microgrids, and electric vehicle charging infrastructure. DPL expects to finance this construction with a combination of cash on hand, short-term financing, long-term debt, equity capital contributions, and cash flows from operations.
Non-renewable U.S. Generation
Business Description — In the U.S., we own a diversified generation portfolio. The principal markets and locations where we are engaged in the generation and supply of electricity (energy and capacity) are the California Independent System Operator ("CAISO"), PJM, Hawaii, and Puerto Rico. AES Southland, operating in the CAISO, is our most significant generation business.
Many of our non-renewable U.S. generation plants provide baseload operations and are required to maintain a guaranteed level of availability. Any change in availability has a direct impact on financial performance. Some plants are eligible for availability bonuses if they meet certain requirements. Coal and natural gas are used as the primary fuels. Coal prices are set by market factors internationally, while natural gas prices are generally set domestically. Price variations for these fuels can change the composition of generation costs and energy prices in our generation businesses.
Many of these generation businesses have entered into long-term PPAs with utilities or other offtakers. Some businesses with PPAs have mechanisms to recover fuel costs from the offtaker, including an energy payment partially based on the market price of fuel. When market price fluctuations in fuel are borne by the offtaker, revenue may change as fuel prices fluctuate, but the variable margin or profitability should remain consistent. These businesses often have an opportunity to increase or decrease profitability from payments under their PPAs depending on such items as plant efficiency and availability, heat rate, ability to buy coal at lower costs through AES' global sourcing program, and fuel flexibility.
Warrior Run is one of our non-renewable generation businesses in the U.S. that currently operate as a QF, as defined under the PURPA. This business entered into a long-term contract with an electric utility that had a mandatory obligation to purchase power from QFs at the utility's avoided cost (i.e. the likely costs for both energy and capital investment that would have been incurred by the purchasing utility if that utility had to provide its own generating capacity or purchase it from another source). To be a QF, a cogeneration facility must produce electricity and useful thermal energy for an industrial or commercial process or heating or cooling application in certain proportions to the facility's total energy output and meet certain efficiency standards. To be a QF, a small power production facility must generally use a renewable resource as its energy input and meet certain size criteria or be a cogeneration facility that simultaneously generates electricity and processes heat or steam.
Our non-QF generation businesses in the U.S. currently operate as Exempt Wholesale Generators as defined under the EPAct of 1992, amending the Public Utility Holding Company Act (“PUHCA”). These businesses, subject to approval of FERC, have the right to sell power at market-based rates, either directly to the wholesale market or to a third-party offtaker such as a power marketer or utility/industrial customer. Under the FPA and FERC's regulations, approval from FERC to sell wholesale power at market-based rates is generally dependent upon a showing to
| 19 | 2020 Annual Report |
FERC that the seller lacks market power in generation and transmission, that the seller and its affiliates cannot erect other barriers to market entry, and that there is no opportunity for abusive transactions involving regulated affiliates of the seller.
The U.S. wholesale electricity market consists of multiple distinct regional markets that are subject to both federal regulation, as implemented by FERC, and regional regulation as defined by rules designed and implemented by the RTOs, non-profit corporations that operate the regional transmission grid and maintain organized markets for electricity. These rules, for the most part, govern such items as the determination of the market mechanism for setting the system marginal price for energy and the establishment of guidelines and incentives for the addition of new capacity. See Item 1A.—Risk Factors for additional discussion on U.S. regulatory matters.
AES Southland
Business Description — AES Southland is one of the largest generation operators in California by aggregate installed capacity, with an installed gross capacity of 3,611 MW at the end of 2020. The five coastal power plants comprising AES Southland are in areas that are critical for local reliability and play an important role in integrating the increasing amounts of renewable generation resources in California. AES Southland is composed of three once-through cooling ("OTC") power plants, two combined cycle gas-fired generation facilities and an interconnected battery-based energy storage facility.
AES Huntington Beach, LLC, AES Alamitos, LLC, and AES Redondo Beach ("Southland OTC units") are contracted through Resource Adequacy Purchase Agreements (“RAPAs”). Under the RAPAs, as approved by the California Public Utilities Commission, these generating stations provide resource adequacy capacity, and have no obligation to produce or sell any energy to the RAPA counterparty. However, the generating stations are required to bid energy into the California ISO markets. Compensation under these RAPAs is dependent on the availability of the AES Southland units in the California ISO market. Failure to achieve the minimum availability target would result in an assessed penalty.
In November 2014, AES Southland was awarded 20-year contracts by Southern California Edison ("SCE") to provide 1,284 MW of combined cycle gas-fired generation and 100 MW of interconnected battery-based energy storage ("Southland Energy units"). The agreements for the combined cycle gas-fired generation were amended in 2019 and capacity was increased to 1,299 MW. The contracts are RAPAs with annual energy put options. If AES Southland exercises the annual put option, all capacity, energy and ancillary services will be sold to SCE in exchange for a fixed monthly fee that covers fixed operating cost, debt service, and return on capital. In addition, SCE will reimburse variable costs and provide the natural gas.
In April 2017, the California Energy Commission unanimously approved the licenses for the Southland Energy combined cycle projects at AES Alamitos and AES Huntington Beach. In June 2017, AES closed the financing of $2 billion, funded with a combination of non-recourse debt and AES equity. Construction of the combined cycle capacity began in 2017.
At the end of 2019, five of the twelve Southland OTC generation units were retired to support the construction efforts of the Southland Energy combined cycle gas-fired generation projects in anticipation of COD, which was reached in early February 2020. On January 23, 2020, the Statewide Advisory Committee on Cooling Water Intake Structures adopted a recommendation to present to the California State Water Resources Board ("SWRCB") to extend OTC compliance dates for the remaining Southland OTC units at AES Huntington Beach and AES Alamitos until December 31, 2023 and AES Redondo Beach until December 31, 2021. On September 1, 2020, in response to a request by the state's energy, utility, and grid operators and regulators, the SWRCB approved amendments to its OTC. The SWRCB OTC Policy previously required the shutdown and permanent retirement of all remaining Southland OTC generating units by December 31, 2020. See United States Environmental and Land-Use Legislation and Regulations—Cooling Water Intake for further discussion of AES Southland’s plans regarding the OTC Policy.
The construction of the Alamitos Energy Center, an interconnected battery-based energy storage facility, began in June 2019 and commercial operation of the energy storage capacity was achieved on January 1, 2021.
Key Financial Drivers — AES Southland's availability is one of the most important drivers of operations, along with market demand and prices for gas and electricity.
| 20 | 2020 Annual Report |
AES Hawaii
Business Description — AES Hawaii receives an energy payment from its offtaker under a PPA expiring in 2022, which is based on a fixed rate indexed to the Gross National Product Implicit Price Deflator. Since the energy payment is not directly linked to market prices for fuel, the risk arising from fluctuations in market prices for coal is borne by AES Hawaii. AES Hawaii has entered into fixed-price coal purchase commitments through 2021 and plans to seek additional fuel purchase commitments during 2021 to manage fuel price risk in 2022.
In July 2020, the Hawaii State Legislature passed Senate Bill 2629 which will prohibit AES Hawaii from generating electricity from coal after December 31, 2022. This will restrict the Company from contracting the asset beyond the expiration of its existing PPA, and as a result, AES plans to retire the AES Hawaii facility in 2022.
Key Financial Drivers — AES Hawaii's financial results are driven by fuel costs and outages. The Company has entered into long-term fuel contracts to mitigate the risks associated with fluctuating prices. In addition, major maintenance requiring units to be off-line is performed during periods when power demand is typically lower.
Puerto Rico
Business Description — AES Puerto Rico owns and operates a coal-fired cogeneration plant and a solar plant of 524 MW and 24 MW, respectively, representing approximately 8% of the installed capacity in Puerto Rico. Both plants are fully contracted through long-term PPAs with PREPA expiring in 2027 and 2032, respectively. AES Puerto Rico receives a capacity payment based on the plants' twelve month rolling average availability, receiving the full payment when the availability is 90% or higher. See Item 7.—Management's Discussion and Analysis of Financial Condition and Results of Operations—Key Trends and Uncertainties—Macroeconomic and Political—Puerto Rico for further discussion of the long-term PPAs with PREPA.
Key Financial Drivers — Financial results are driven by many factors, including, but not limited to, improved operational performance and plant availability.
Regulatory Framework and Market Structure — Puerto Rico has a single electric grid managed by PREPA, a state-owned entity that provides virtually all of the electric power consumed in Puerto Rico and generates, transmits, and distributes electricity to 1.5 million customers. The Puerto Rico Energy Bureau is the main regulatory body. The bureau approves wholesale and retail rates, sets efficiency and interconnection standards, and oversees PREPA's compliance with Puerto Rico's renewable portfolio standard.
Puerto Rico's electricity is 97% produced by thermal plants (43% from natural gas, 36% from petroleum, and 18% from coal).
AES Clean Energy
Business Description — AES manages the U.S. renewables portfolio, which comprises AES Distributed Energy, sPower and other renewable assets, as part of its broader investments in the U.S. On January 4, 2021, the sPower and AES Distributed Energy development platforms were merged to form AES Clean Energy Development, which will serve as the development vehicle for all future renewable projects in the U.S. sPower remains an AES unconsolidated affiliate after this merger. Collectively, AES Distributed Energy, sPower, AES Clean Energy Development, and the other renewable assets in the U.S. are referred to as AES Clean Energy.
Prior to the merger, both AES and sPower were recognized leaders in renewable development in the U.S. Together, AES Clean Energy is one of the top renewables growth platforms and the expanded team aims to solve our customers' energy challenges. AES Clean Energy offers its customers an expanded portfolio of innovative solutions based on cutting-edge technologies that are designed to accelerate their energy futures. Generation capacity of the systems owned and/or operated under AES Clean Energy is 2,983 MW across the U.S. with another 299 MW under construction. This capacity includes 2,066 MW of solar, 1,085 MW of wind, and 131 MW of energy storage.
A majority of solar projects under AES Clean Energy have been financed with tax equity structures. Under these tax equity structures, the tax equity investors receive a portion of the economic attributes of the facilities, including tax attributes, that vary over the life of the projects. Based on certain liquidation provisions of the tax equity structures, this could result in variability to earnings attributable to AES compared to the earnings reported at the facilities.
Key Financial Drivers — The financial results of AES Clean Energy are primarily driven by the efficient construction and operation of renewable energy facilities across the U.S. under long-term PPAs, through which the energy price on the entire production of these facilities is guaranteed. The financial results of renewable assets are
| 21 | 2020 Annual Report |
primarily driven by the amount of wind or solar resource at the facilities, availability of facilities, and growth in projects.
Laurel Mountain, Buffalo Gap II and Buffalo Gap III are exposed to the volatility of energy prices and their revenue may change materially as energy prices fluctuate in their respective markets of operations. Laurel Mountain also operates 16 MW of battery energy storage that is sold into the PJM market as regulation energy. For these projects, PJM and ERCOT power prices impact financial results.
Development Strategy — As states, communities, and organizations of all types make commitments and plan to reduce their carbon footprints, renewables are the fastest-growing source of electricity generation in the U.S. AES Clean Energy works with its customers to co-create and deliver the smarter, greener energy solutions that meet their needs, including 24/7 carbon-free energy. The merged renewables platform has brought together sPower's and AES' differentiated capabilities in solar, wind, and energy storage to accelerate customers' energy transitions.
AES Clean Energy has a renewable project backlog that includes 2,206 MW of projects for which long-term PPAs have been signed or, as applicable, tariffs have been assigned through a regulatory process. The budget for construction of the projects currently under construction and the contracted projects is over $3.9 billion. AES Clean Energy is actively developing new products and renewable sites to serve the current and future needs of its customers.
U.S. Environmental Regulation
For information on compliance with environmental regulations see Item 1.—United States Environmental and Land-Use Legislation and Regulations.
El Salvador
Business Description — AES El Salvador is the majority owner of four of the five distribution companies operating in El Salvador (CAESS, CLESA, EEO and DEUSEM). AES El Salvador's territory covers 77% of the country and accounted for 3,640 GWh of the wholesale market energy sales during 2020. AES El Salvador is also a 50% owner and operator of Bosforo, a 100 MW solar farm. The energy produced by this solar farm is fully contracted by AES' utilities in El Salvador.
In addition, AES El Salvador offers customers non-regulated services such as energy trading, electromechanical construction, O&M of electrical assets, EPC, pole rental, and tax collection for municipalities.
Key Financial Drivers — Financial results are driven by many factors, including, but not limited to:
-
improved operational performance;
-
variability in energy demand driven by weather; and
-
the impact of fuel oil prices on energy tariff prices, which affect cash flow due to a three-month delay in the pass-through of energy costs to the tariffs charged to customers.
Regulatory Framework and Market Structure — El Salvador's national electric market is composed of generation, distribution, transmission, and marketing businesses, a market and system operator, and regulatory agencies. The operation of the transmission system and the wholesale market is based on production costs with a marginal economic model that rewards efficiency and allows investors to have guaranteed profits, while end users receive affordable rates. The energy sector is governed by the General Electricity Law, which establishes two regulatory entities responsible for monitoring its compliance:
-
The National Energy Council is the highest authority on energy policy and strategy, and the coordinating body for the different energy sectors. One of its main objectives is to promote investment in non-conventional renewable sources to diversify the energy matrix.
-
The General Superintendence of Electricity and Telecommunications regulates the market and sets consumer prices, and, jointly with the distribution companies in El Salvador, developed the tariff calculation applicable from 2018 until 2022. The next tariff calculation is scheduled for 2022, and will be effective starting in 2023.
El Salvador has a national electric grid that interconnects directly with Guatemala and Honduras, allowing transactions with all Central American countries. The sector has approximately 1,799 MW of installed capacity, composed of thermal (40%), hydroelectric (31%), solar (11%), biomass (9%), and geothermal (9%) generation plants.
Development Strategy — In order to explore new business opportunities, AES El Salvador created AES
| 22 | 2020 Annual Report |
Soluciones, an LED public lighting service provider and the main commercial and industrial solar photovoltaic EPC provider in the country. AES Next is also the O&M services provider for the Bosforo project.
| 23 | 2020 Annual Report |
| (1) Non-GAAP measure. See Item 7.—Management’s Discussion and Analysis of Financial Condition and Results of Operations—SBU Performance Analysis—Non-GAAP Measures for reconciliation and definition. |
| 24 | 2020 Annual Report |
South America SBU
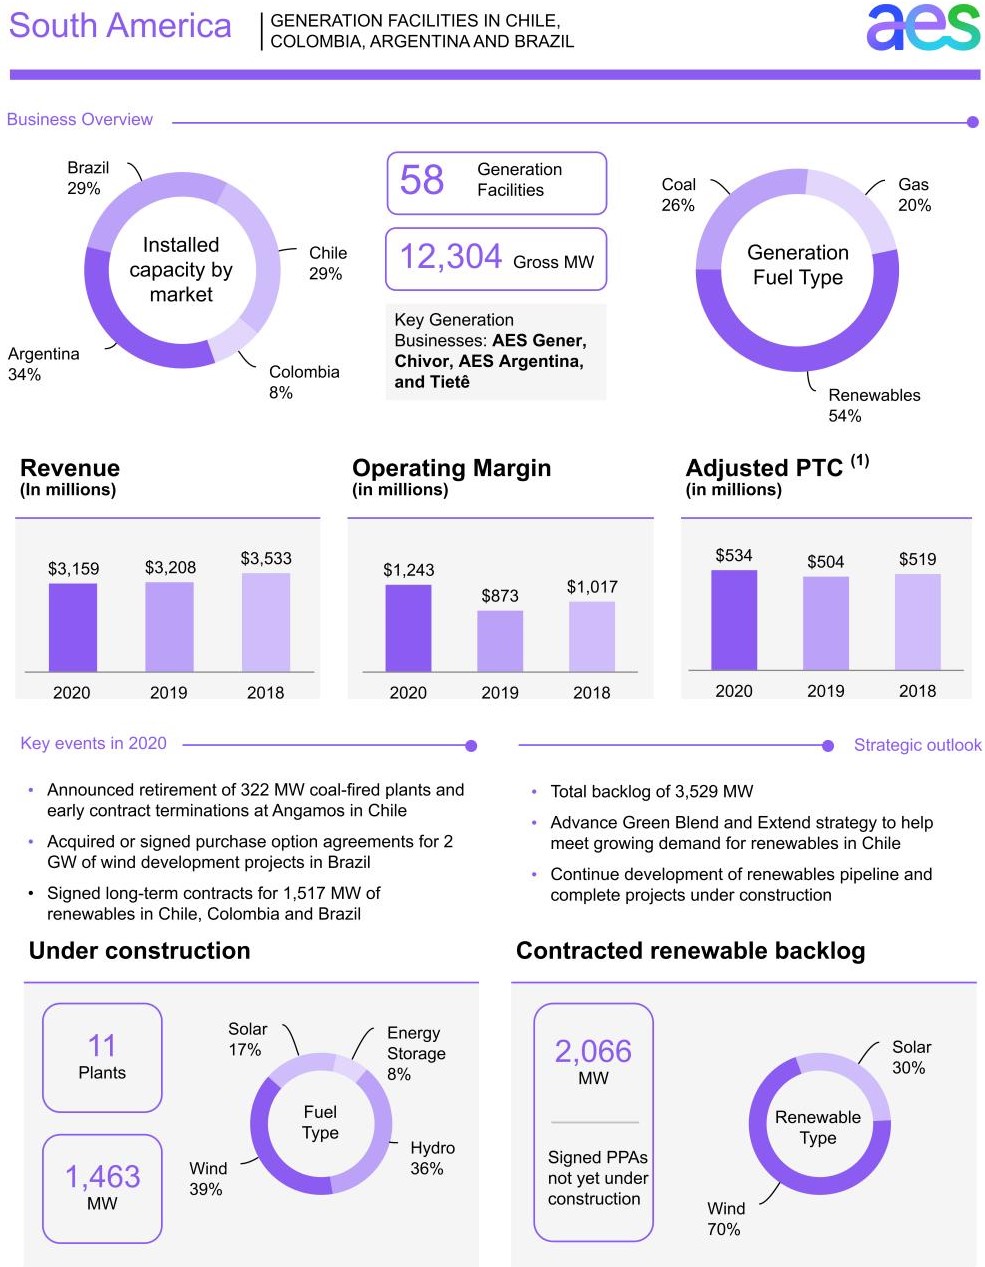
Our South America SBU has generation facilities in four countries — Chile, Colombia, Argentina and Brazil. AES Gener is a publicly traded company in Chile and owns all of our assets in Chile, AES Chivor in Colombia and TermoAndes in Argentina, as detailed below. AES has a 66.7% ownership interest in AES Gener and this business is consolidated in our financial statements. AES Brasil (the business formerly branded as AES Tietê) is a publicly traded company in Brazil. AES controls and consolidates AES Brasil through its 44% economic interest.
Operating installed capacity of our South America SBU totals 12,304 MW, of which 34%, 29%, 8%, and 29% are located in Argentina, Chile, Colombia and Brazil, respectively. The following table lists our South America SBU generation facilities:
| Business | Location | Fuel | Gross MW | AES Equity Interest | Year Acquired or Began Operation | Contract Expiration Date | Customer(s) | |||||||||||||||||||||||||||||||||||||
| Chivor | Colombia | Hydro | 1,000 | 67 | % | 2000 | 2020-2037 | Various | ||||||||||||||||||||||||||||||||||||
| Castilla | Colombia | Solar | 21 | 67 | % | 2019 | 2034 | Ecopetrol | ||||||||||||||||||||||||||||||||||||
| Tunjita | Colombia | Hydro | 20 | 67 | % | 2016 | ||||||||||||||||||||||||||||||||||||||
| Colombia Subtotal | 1,041 | |||||||||||||||||||||||||||||||||||||||||||
| Gener - Chile (1) | Chile | Coal/Hydro/Diesel/Solar/Wind/Biomass | 1,578 | 67 | % | 2000 | 2020-2040 | Various | ||||||||||||||||||||||||||||||||||||
| Guacolda (2) | Chile | Coal | 764 | 33 | % | 2000 | 2020-2032 | Various | ||||||||||||||||||||||||||||||||||||
| Electrica Angamos | Chile | Coal | 558 | 67 | % | 2011 | 2021 | Minera Escondida, Minera Spence, Quebrada Blanca | ||||||||||||||||||||||||||||||||||||
| Cochrane | Chile | Coal | 550 | 40 | % | 2016 | 2030-2037 | SQM, Sierra Gorda, Quebrada Blanca | ||||||||||||||||||||||||||||||||||||
| Cochrane ES | Chile | Energy Storage | 20 | 40 | % | 2016 | ||||||||||||||||||||||||||||||||||||||
| Electrica Angamos ES | Chile | Energy Storage | 20 | 67 | % | 2011 | ||||||||||||||||||||||||||||||||||||||
| Norgener ES (Los Andes) | Chile | Energy Storage | 12 | 67 | % | 2009 | ||||||||||||||||||||||||||||||||||||||
| Alfalfal Virtual Reservoir | Chile | Energy Storage | 10 | 67 | % | 2020 | ||||||||||||||||||||||||||||||||||||||
| Chile Subtotal | 3,512 | |||||||||||||||||||||||||||||||||||||||||||
| TermoAndes (3) | Argentina | Gas/Diesel | 643 | 67 | % | 2000 | 2020 | Various | ||||||||||||||||||||||||||||||||||||
| AES Gener Subtotal | 5,196 | |||||||||||||||||||||||||||||||||||||||||||
| Alicura | Argentina | Hydro | 1,050 | 100 | % | 2000 | ||||||||||||||||||||||||||||||||||||||
| Paraná-GT | Argentina | Gas/Diesel | 870 | 100 | % | 2001 | ||||||||||||||||||||||||||||||||||||||
| San Nicolás | Argentina | Coal/Gas/Oil/Energy Storage | 691 | 100 | % | 1993 | ||||||||||||||||||||||||||||||||||||||
| Guillermo Brown (4) | Argentina | Gas/Diesel | 576 | — | % | 2016 | ||||||||||||||||||||||||||||||||||||||
| Cabra Corral | Argentina | Hydro | 102 | 100 | % | 1995 | Various | |||||||||||||||||||||||||||||||||||||
| Vientos Bonaerenses | Argentina | Wind | 100 | 100 | % | 2020 | 2024-2040 | Various | ||||||||||||||||||||||||||||||||||||
| Vientos Neuquinos | Argentina | Wind | 100 | 100 | % | 2020 | 2024-2040 | Various | ||||||||||||||||||||||||||||||||||||
| Ullum | Argentina | Hydro | 45 | 100 | % | 1996 | Various | |||||||||||||||||||||||||||||||||||||
| Sarmiento | Argentina | Gas/Diesel | 33 | 100 | % | 1996 | ||||||||||||||||||||||||||||||||||||||
| El Tunal | Argentina | Hydro | 10 | 100 | % | 1995 | Various | |||||||||||||||||||||||||||||||||||||
| Argentina Subtotal | 3,577 | |||||||||||||||||||||||||||||||||||||||||||
| Tietê (5) | Brazil | Hydro | 2,658 | 44 | % | 1999 | 2029 | Various | ||||||||||||||||||||||||||||||||||||
| Alto Sertão II | Brazil | Wind | 386 | 44 | % | 2017 | 2033-2035 | Various | ||||||||||||||||||||||||||||||||||||
| Ventus | Brazil | Wind | 187 | 44 | % | 2020 | 2034 | Regulated Market | ||||||||||||||||||||||||||||||||||||
| Guaimbê | Brazil | Solar | 150 | 44 | % | 2018 | 2037 | CCEE | ||||||||||||||||||||||||||||||||||||
| AGV Solar | Brazil | Solar | 75 | 44 | % | 2019 | 2039 | Various | ||||||||||||||||||||||||||||||||||||
| Boa Hora | Brazil | Solar | 69 | 44 | % | 2019 | 2035 | CCEE | ||||||||||||||||||||||||||||||||||||
| Drogaria Araujo | Brazil | Solar | 5 | 44 | % | 2019 | 2029 | Drogaria Araujo | ||||||||||||||||||||||||||||||||||||
| Brasil Community Solar | Brazil | Solar | 1 | 44 | % | 2020 | ||||||||||||||||||||||||||||||||||||||
| AES Brasil Subtotal | 3,531 | |||||||||||||||||||||||||||||||||||||||||||
| 12,304 |
(1)Gener - Chile plants: Alfalfal, Andes Solar, Andes Solar 2a, Laguna Verde, Laja, Los Cururos, Maitenes, Norgener 1, Norgener 2, Queltehues, Ventanas 2, Ventanas 3, Ventanas 4 and Volcán. In December 2020, AES Gener requested the retirement of Ventanas 1 and 2. Ventanas 1 initiated strategic reserve mode and Ventanas 2 is waiting for approval.
(2)Guacolda is comprised of five coal-fired units under Guacolda Energia S.A., an unconsolidated entity for which the results of operations are reflected in Net equity in earnings of affiliates. The Company's ownership in Guacolda is held through AES Gener, a 67%-owned consolidated subsidiary. AES Gener owns 50% of Guacolda, resulting in an AES effective ownership in Guacolda of 34%.
| 25 | 2020 Annual Report |
(3)TermoAndes is located in Argentina, but is connected to both the SEN in Chile and the SADI in Argentina.
(4)AES operates this facility through management or O&M agreements and to date owns no equity interest in the business.
(5)Tietê hydro plants: Água Vermelha, Bariri, Barra Bonita, Caconde, Euclides da Cunha, Ibitinga, Limoeiro, Mogi-Guaçu, Nova Avanhandava, Promissão, Sao Joaquim and Sao Jose.
Under construction — The following table lists our plants under construction in the South America SBU:
| Business | Location | Fuel | Gross MW | AES Equity Interest | Expected Date of Commercial Operations | |||||||||||||||||||||||||||
| Tucano Phase 2 | Brazil | Wind | 167 | 44 | % | 2H 2022 | ||||||||||||||||||||||||||
| Tucano Phase 1 | Brazil | Wind | 155 | 44 | % | 2H 2022 | ||||||||||||||||||||||||||
| McDonalds | Brazil | Solar | 5 | 44 | % | 1H 2021 | ||||||||||||||||||||||||||
| Farmácias São João | Brazil | Solar | 3 | 44 | % | 1H 2021 | ||||||||||||||||||||||||||
| AES Brasil Subtotal | 330 | |||||||||||||||||||||||||||||||
| Alto Maipo (1) | Chile | Hydro | 531 | 62 | % | 2H 2021 | ||||||||||||||||||||||||||
| Los Olmos | Chile | Wind | 110 | 67 | % | 1H 2021 | ||||||||||||||||||||||||||
| Campo Lindo | Chile | Wind | 73 | 67 | % | 1H 2021 | ||||||||||||||||||||||||||
| Mesamávida | Chile | Wind | 68 | 67 | % | 2H 2021 | ||||||||||||||||||||||||||
| Andes Solar 2b | Chile | Solar | 180 | 67 | % | 2H 2021 | ||||||||||||||||||||||||||
| Energy Storage | 112 | |||||||||||||||||||||||||||||||
| Chile Subtotal | 1,074 | |||||||||||||||||||||||||||||||
| San Fernando | Colombia | Solar | 59 | 67 | % | 2H 2021 | ||||||||||||||||||||||||||
| Colombia Subtotal | 59 | |||||||||||||||||||||||||||||||
| 1,463 |
(1) Alto Maipo is the largest project in construction in the Chilean market. When completed, it will include 75 km of tunnels, two power houses and 17 km of transmission lines.
The majority of projects under construction have executed mid- to long-term PPAs.
In June 2018, the Company completed the sale of its entire 17% ownership interest in Eletropaulo, a distribution business in Brazil. Prior to its sale, Eletropaulo was accounted for as an equity method investment and its results of operations and financial position were reported as discontinued operations in the consolidated financial statements for all periods presented.
In September 2020, the Company completed the sale of its entire interest in AES Uruguaiana, a gas-fired combined cycle power plant located in Brazil.
| 26 | 2020 Annual Report |
The following map illustrates the location of our South America facilities:
South America Businesses
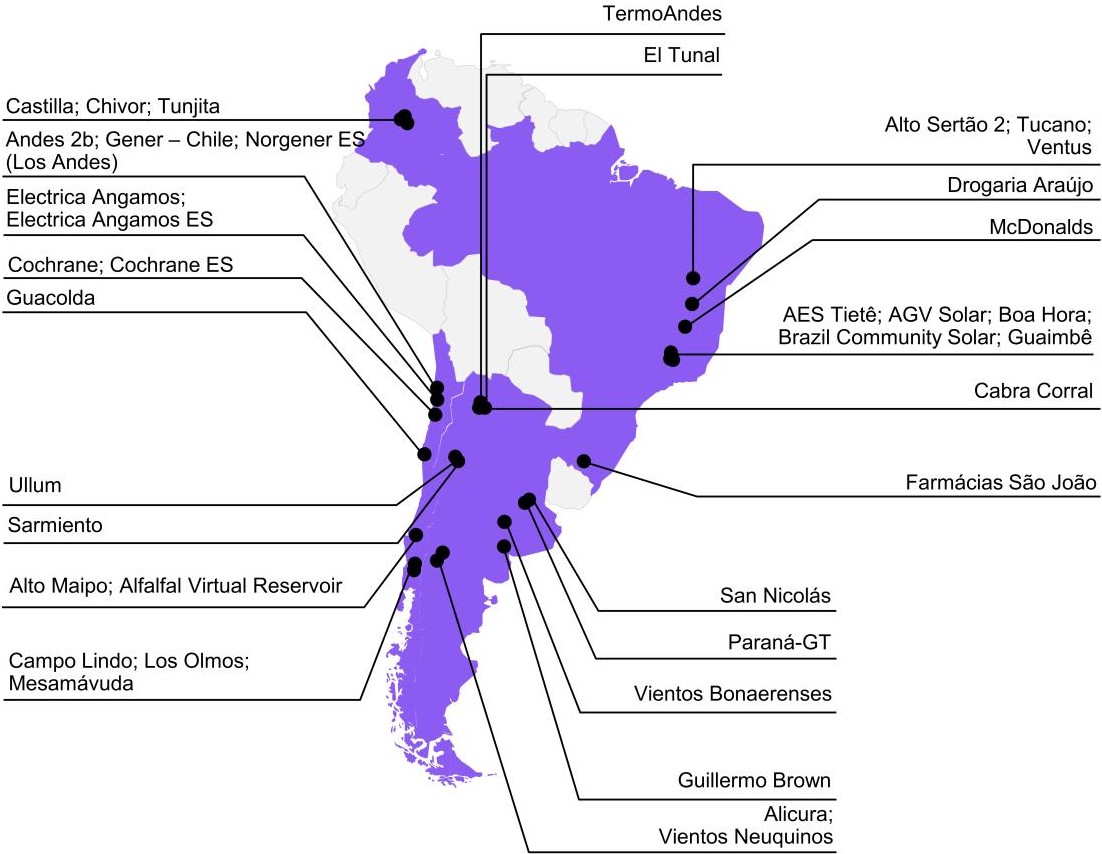
Chile
Business Description — In Chile, through AES Gener, we are engaged in the generation and supply of electricity (energy and capacity) in the SEN—see Regulatory Framework and Market Structure below. AES Gener is the second largest generation operator in Chile in terms of installed capacity with 3,450 MW, excluding energy storage, and has a market share of approximately 13% as of December 31, 2020.
AES Gener owns a diversified generation portfolio in Chile in terms of geography, technology, customers, and energy resources. AES Gener's generation plants are located near the principal electricity consumption centers, including Santiago, Valparaiso, and Antofagasta. AES Gener's diverse generation portfolio provides flexibility for the management of contractual obligations with regulated and unregulated customers, provides backup energy to the spot market and facilitates operations under a variety of market and hydrological conditions.
AES Gener's Green Blend and Extend strategy aims to reduce carbon intensity and incorporate renewable energy to extend our existing conventional PPAs. This strategy de-links our PPAs from legacy fossil resources, grows our renewable energy portfolio, and delivers a competitive, reliable energy solution. In line with the "green blend and extend" strategy, AES Gener has committed to not build additional coal-based power plants and to advance the development of new renewable projects, including the implementation of battery energy storage systems ("BESS") and other technological innovations that will provide greater flexibility and reliability to the system.
AES Gener currently has long-term contracts, with an average remaining term of approximately 9 years, with regulated distribution companies and unregulated customers, such as mining and industrial companies. In general,
| 27 | 2020 Annual Report |
these long-term contracts include pass-through mechanisms for fuel costs along with price indexations to U.S. Consumer Price Index ("CPI").
In addition to energy payments, AES Gener also receives capacity payments to compensate for availability during periods of peak demand. The grid operator, Coordinador Electrico Nacional ("CEN"), annually determines the capacity requirements for each power plant. The capacity price is fixed semiannually by the National Energy Commission and indexed to the CPI and other relevant indices.
Key Financial Drivers — Hedge strategy at AES Gener limits volatility to the underlying financial drivers. In addition, financial results are likely to be driven by many factors, including, but not limited to:
-
dry hydrology scenarios;
-
forced outages;
-
changes in current regulatory rulings altering the ability to pass through or recover certain costs;
-
fluctuations of the Chilean peso;
-
tax policy changes;
-
legislation promoting renewable energy and/or more restrictive regulations on thermal generation assets; and
-
market price risk when re-contracting.
Regulatory Framework and Market Structure — The Chilean electricity industry is divided into three business segments: generation, transmission, and distribution. Private companies operate in all three segments, and generators can enter into PPAs to sell energy to regulated and unregulated customers, as well as to other generators in the spot market.
Chile operates in a single power market, referred to as the SEN, which is managed by the grid operator CEN. The SEN has an installed capacity of 26,056 MW, and represents 99% of the installed generation capacity of the country.
CEN coordinates all generation and transmission companies in the SEN. CEN minimizes the operating costs of the electricity system, while maximizing service quality and reliability requirements. CEN dispatches plants in merit order based on their variable cost of production, allowing for electricity to be supplied at the lowest available cost. In the south-central region of the SEN, thermoelectric generation is required to fulfill demand not satisfied by hydroelectric, solar, and wind output and is critical to provide reliable and dependable electricity supply under dry hydrological conditions in the highest demand area of the SEN. In the northern region of the SEN, which includes the Atacama Desert, thermoelectric capacity represents the majority of installed capacity. The fuels used for thermoelectric generation, mainly coal, diesel, and LNG, are indexed to international prices. In 2020, the installed generation capacity in the Chilean market was composed of 48% thermoelectric, 27% hydroelectric, 13% solar, 10% wind, and 2% other fuel sources.
Hydroelectric plants represent a significant portion of the system's installed capacity. Precipitation and snow melt impact hydrological conditions in Chile. Rain occurs principally from June to August and snow melt occurs from September to December. These factors affect dispatch of the system's hydroelectric and thermoelectric generation plants, thereby influencing spot market prices.
The Ministry of Energy has primary responsibility for the Chilean electricity system directly or through the National Energy Commission and the Superintendency of Electricity and Fuels.
All generators can sell energy through contracts with regulated distribution companies or directly to unregulated customers. Unregulated customers are customers whose connected capacity is higher than 5 MW. Customers with connected capacity between 0.5 MW and 5.0 MW can opt for regulated or unregulated contracts for a minimum period of four years. By law, both regulated and unregulated customers are required to purchase all electricity under contracts. Generators may also sell energy to other power generation companies on a short-term basis at negotiated prices outside the spot market. Electricity prices in Chile are denominated in USD, although payments are made in Chilean pesos.
The Chilean government’s decarbonization plan includes the complete retirement of the SEN coal fleet by the end of 2040 and carbon neutrality by 2050. During the year, AES Gener announced its commitment to shut down its Ventanas 1 coal-fired plant in 2020 and its Ventanas 2 coal-fired plant in June 2022 or earlier, pending resolution of current transmission constraints, and to disconnect both plants from the SEN in 2025. On December 26, 2020, the
| 28 | 2020 Annual Report |
Ministry of Energy’s Supreme Decree Number 42 went into effect, allowing coal plants to enter into Strategic Reserve Status (“SRS”) and receive 60% of capacity payments for the 5-year period following its shutdown to remain connected as a backup in case of a system emergency. Following the issuance of this regulation and per the disconnection and termination agreement signed with the Chilean government in June 2019, the Ventanas 1 power plant was shut down on December 29, 2020 to enter into SRS.
Environmental Regulation — In March 2019, a new decontamination plan for the Ventanas region was approved. We are currently implementing the requirements defined by the plan which will impact our Ventanas and Guacolda businesses.
Chilean law requires all electricity generators to supply a certain portion of their total contractual obligations with non-conventional renewable energy ("NCREs"). Generation companies are able to meet this requirement by building NCRE generation capacity (wind, solar, biomass, geothermal, and small hydroelectric technology) or purchasing NCREs from qualified generators. Non-compliance with the NCRE requirements will result in fines. AES Gener currently fulfills the NCRE requirements by utilizing AES Gener's solar and biomass power plants and by purchasing NCREs from other generation companies. At present, AES Gener is in the process of negotiating additional NCRE supply contracts to meet future requirements.
Since 2017, emissions of particulate matter, SO2, NOX, and CO2 are monitored for plants with an installed capacity over 50 MW; these emissions are taxed. In the case of CO2, the tax is equivalent to $5 per ton emitted. Certain PPAs have clauses allowing the Company to pass the green tax costs to unregulated customers, while some distribution PPAs do not allow for the pass through of these costs.
Development Strategy — AES Gener is committed to reducing the coal intensity of the Chilean power grid and plans to increase the renewable energy capacity in its portfolio. As part of this commitment, and in addition to the 531 MW hydroelectric generation that Alto Maipo will deliver to the system, AES Gener purchased the 110 MW Los Cururos wind farm and its substation in northern Chile, and has finished construction on the 80 MW Andes 2a facility. Also under construction are the 110 MW Los Olmos wind farm, 66 MW Mesamávida wind farm, 73 MW Campo Lindo wind farm, and 180 MW Andes Solar 2b facility, which also includes 112 MW of BESS, to supply agreements with its main mining customers in execution of the new Green Blend and Extend strategy. In total, the pipeline currently has 4.4 GW under development at different stages and diversified geographically.
AES Gener executes its Green Blend and Extend strategy by integrating renewable energy sources into its portfolio, and by providing contracting options that contain a mix of both renewable and nonrenewable solutions.
Colombia
Business Description — We operate in Colombia through AES Chivor, a subsidiary of AES Gener, which owns a hydroelectric plant with an installed capacity of 1,000 MW and Tunjita, a 20 MW run-of-river hydroelectric plant, both located approximately 160 km east of Bogota, as well as Castilla, a 21 MW solar facility. AES Chivor’s installed capacity accounted for approximately 6% of system capacity at the end of 2020. AES Chivor is dependent on hydrological conditions, which influence generation and spot prices of non-contracted generation in Colombia.
AES Chivor's commercial strategy aims to execute contracts with commercial and industrial customers and bid in public tenders, mainly with distribution companies, in order to reduce margin volatility with proper portfolio risk management. The remaining energy generated by our portfolio is sold to the spot market, including ancillary services. Additionally, AES Chivor receives reliability payments for maintaining the plant's availability and generating firm energy during periods of power scarcity, such as adverse hydrological conditions, in order to prevent power shortages.
Key Financial Drivers — Hydrological conditions largely influence Chivor's power generation. Maintaining the appropriate contract level, while maximizing revenue through the sale of excess generation, is key to Chivor's results of operations. In addition to hydrology, financial results are driven by many factors, including, but not limited to:
-
forced outages;
-
fluctuations of the Colombian peso; and
-
spot market prices.
Regulatory Framework and Market Structure — Electricity supply in Colombia is concentrated in one main system, the SIN, which encompasses one-third of Colombia's territory, providing electricity to 97% of the country's population. The SIN's installed capacity, primarily hydroelectric (69%) and thermal (31%), totaled 17,473 MW as of
| 29 | 2020 Annual Report |
December 31, 2020. The marked seasonal variations in Colombia's hydrology result in price volatility in the short-term market. In 2020, 72% of total energy demand was supplied by hydroelectric plants.
The electricity sector in Colombia operates under a competitive market framework for the generation and sale of electricity, and a regulated framework for transmission and distribution of electricity. The distinct activities of the electricity sector are governed by Colombian laws and CREG, the Colombian regulating entity for energy and gas. Other government entities have a role in the electricity industry, including the Ministry of Mines and Energy, which defines the government's policy for the energy sector; the Public Utility Superintendency of Colombia, which is in charge of overseeing utility companies; and the Mining and Energy Planning Unit, which is in charge of expansion of the generation and transmission network.
The generation sector is organized on a competitive basis with companies selling their generation in the wholesale market at the short-term price or under bilateral contracts with other participants, including distribution companies, generators and traders, and unregulated customers at freely negotiated prices. The National Dispatch Center dispatches generators in merit order based on bid offers in order to ensure that demand will be satisfied by the lowest cost combination of available generating units.
Development Strategy — AES Colombia is committed to transform into a renewable growth platform by supporting its customers to diversify their energy supply and become more competitive. As part of this commitment, AES Colombia is developing a pipeline of 1.3 GW of solar and wind projects. Five projects (648 MW) of wind energy are located in La Guajira, one of the windiest spots on Earth, and two projects (255 MW) were awarded a 15-year PPA at the last renewable auction. One project (99 MW) of the Wind Cluster has Environmental License and the others are progressing smoothly in their development process. During 2020, AES Colombia was awarded the 61 MW San Fernando Solar project through a 15-year PPA with Ecopetrol and started construction in September. This solar project, along with the 21 MW Castilla project built in 2019 also with a PPA with Ecopetrol, has been fundamental in leading the renewable market in Colombia.
Argentina
Business Description — AES operates plants in Argentina totaling 4,220 MW, representing 10% of the country's total installed capacity. AES owns a diversified generation portfolio in Argentina in terms of geography, technology, and fuel source. AES Argentina's plants are placed in strategic locations within the country in order to provide energy to the spot market and customers, making use of wind, hydro, and thermal plants.
AES primarily sells its energy in the wholesale electricity market where prices are largely regulated. In 2020, approximately 90% of the energy was sold in the wholesale electricity market and 10% was sold under contract sales made by TermoAndes, Vientos Neuquinos, and Vientos Bonaerenses power plants.
Key Financial Drivers — Financial results are driven by many factors, including, but not limited to:
-
forced outages;
-
exposure to fluctuations of the Argentine peso;
-
changes in hydrology and wind resources;
-
timely collection of FONINVEMEM installments and outstanding receivables (see Regulatory Framework and Market Structure below); and
-
natural gas prices and availability for contracted generation at Termoandes.
Regulatory Framework and Market Structure — Argentina has one main power system, the SADI, which serves 96% of the country. As of December 31, 2020, the installed capacity of the SADI totaled 41,991 MW. The SADI's installed capacity is composed primarily of thermoelectric generation (61%) and hydroelectric generation (27%), as well as wind (6%), nuclear (4%), and solar (2%).
Thermoelectric generation in the SADI is primarily natural gas. However, scarcity of natural gas during winter periods (June to August) due to transport constraints result in the use of alternative fuels, such as oil and coal. The SADI is also highly reliant on hydroelectric plants. Hydrological conditions impact reservoir water levels and largely influence the dispatch of the system's hydroelectric and thermoelectric generation plants and, therefore, influence market costs. Precipitation in Argentina occurs principally from June to August.
The Argentine regulatory framework divides the electricity sector into generation, transmission, and distribution. The wholesale electric market is comprised of generation companies, transmission companies, distribution companies, and large customers who are permitted to trade electricity. Generation companies can sell
| 30 | 2020 Annual Report |
their output in the spot market or under PPAs. CAMMESA manages the electricity market and is responsible for dispatch coordination. The Electricity National Regulatory Agency is in charge of regulating public service activities and the Secretariat of Energy regulates system framework and grants concessions or authorizations for sector activities. In Argentina, there is a tolling scheme in which the regulator establishes prices for electricity and defines fuel reference prices. As a result, our businesses are particularly sensitive to changes in regulation.
The Argentine electric market is an "average cost" system. Generators are compensated for fixed costs and non-fuel variable costs, under prices denominated in Argentine pesos. CAMMESA is in charge of providing the natural gas and liquid fuels required by the generation companies, except for coal.
During 2020, the government has maintained prices to the end user, increasing subsidies and the system deficit. By December 2020, distribution companies recovered an average 55% of the total cost of the system.
AES Argentina contributed certain accounts receivable to fund the construction of new power plants under FONINVEMEM agreements. These receivables accrue interest and have been collected in monthly installments over 10 years after commercial operation date of the related plant took place. AES Argentina participated in the construction of three power plants under the FONINVEMEM structure, and in addition to the repayment of the accounts receivable contributed, AES Argentina will receive a pro rata ownership interest in each of these plants once the accounts receivables have been fully repaid. FONINVEMEM I and II installments were fully repaid in the first quarter of 2020 and the ownership interests in Termoeléctrica San Martín and Termoeléctrica Manuel Belgrano power plants are subject to agreement between the government and all generators that participated in the funds. FONINVEMEM III installments, related to Termoeléctrica Guillermo Brown which commenced operations in April 2016, are still being collected. See Item 7.—Management's Discussion and Analysis of Financial Condition and Results of Operations—Capital Resources and Liquidity—Long-Term Receivables and Note 7.—Financing Receivables in Item 8.—Financial Statements and Supplementary Data of this Form 10-K for further discussion of receivables in Argentina.
In 2019 and 2020, the Argentine peso devalued against the USD by approximately 37% and 29%, respectively, and Argentina’s economy continued to be highly inflationary. Since September 2019, currency controls have been established to govern the devaluation of the Argentine peso and keep Argentine central bank reserves at acceptable levels for the next government of Argentina.
Development Strategy — Currently, 800 MW of renewable greenfield projects are in early and mid stages of development. These projects could be used to participate in future private PPAs or public auctions. In addition, "behind the meter” and off-grid solutions are being developed for the industrial sector (mining), including solar power plants plus BESS.
Brazil
Business Description — AES Brasil (the business formerly branded as AES Tietê) has a portfolio of 12 hydroelectric power plants in the state of São Paulo with total installed capacity of 2,658 MW. These hydroelectric plants operate under a 30-year concession expiring in 2029.
Over the past three years, AES Brasil acquired and developed two solar power complexes in the state of São Paulo, which are fully contracted with 20-year PPAs and together account for 294 MW of installed capacity. AES Brasil represents approximately 12% of the total generation capacity in the state of São Paulo.
AES Brasil also owns Alto Sertão II, a wind complex located in the state of Bahia with an installed capacity of 386 MW and subject to 20-year PPAs expiring between 2033 and 2035, and in December 2020, also acquired the Ventus wind complex located in the State of Rio Grande do Norte with an installed capacity of 187 MW and subject to a 20-year PPA expiring in 2032.
In the second half of 2020, AES acquired an additional 19.8% ownership in AES Brasil. As of December 31, 2020, AES owns 44% of AES Brasil and is the controlling shareholder and manages and consolidates this business. As a result of the transaction, AES has also committed to transition the listing of AES Brasil's shares to the Novo Mercado, a listing segment of the Brazilian stock exchange with the highest standards of corporate governance. The transition to Novo Mercado is expected to occur in the first half of 2021.
In December 2020, AES Brasil entered into an agreement for the acquisition of the MS Wind and Santos Wind Complexes, located in the states of Rio Grande do Norte and Ceará, respectively. The complexes have been
| 31 | 2020 Annual Report |
operational since 2013 with 159 MW of installed capacity, fully sold in the regulated market for 20 years.
AES Brasil aims to contract most of its physical guarantee requirements and sell the remaining portion in the spot market. The commercial strategy is reassessed periodically according to changes in market conditions, hydrology, and other factors. AES Brasil generally sells available energy through medium-term bilateral contracts.
Key Financial Drivers — The electricity market in Brazil is highly dependent on hydroelectric generation, therefore electricity pricing is driven by hydrology. Plant availability is also a significant financial driver as in times of high hydrology, AES is more exposed to the spot market. AES Brasil's financial results are driven by many factors, including, but not limited to:
-
hydrology, impacting quantity of energy generated in the MRE (see Regulatory Framework and Market Structure below for further information);
-
growth in demand for energy;
-
market price risk when re-contracting;
-
asset management;
-
cost management; and
-
ability to execute on its growth strategy.
Regulatory Framework and Market Structure — In Brazil, the Ministry of Mines and Energy determines the maximum amount of energy a generation plant can sell, called physical guarantee, representing the long-term average expected energy production of the plant. Under current rules, physical guarantee energy can be sold to distribution companies through long-term regulated auctions or under unregulated bilateral contracts with large consumers or energy trading companies.
Brazil has installed capacity of 176 GW, composed of hydroelectric (62%), thermoelectric (25%), renewable (12%), and nuclear (1%) sources. Operation is centralized and controlled by the national operator, ONS, and regulated by the Brazilian National Electric Energy Agency ("ANEEL"). The ONS dispatches generators based on their marginal cost of production and on the risk of system rationing. Key variables for the dispatch decision are forecasted hydrological conditions, reservoir levels, electricity demand, fuel prices, and thermal generation availability.
In case of unfavorable hydrology, the ONS will reduce hydroelectric dispatch to preserve reservoir levels and increase dispatch of thermal plants to meet demand. The consequences of unfavorable hydrology are (i) higher energy spot prices due to higher energy production costs by thermal plants and (ii) the need for hydro plants to purchase energy in the spot market to fulfill their contractual obligations.
A mechanism known as the MRE was created under ONS to share hydrological risk across MRE hydro generators by using a generation scaling factor ("GSF") to adjust generators' physical guarantee during periods of hydrological scarcity. If the hydro plants generate less than the total MRE physical guarantee, the hydro generators may need to purchase energy in the short-term market. When total hydro generation is higher than the total MRE physical guarantee, the surplus is proportionally shared among its participants and they may sell the excess energy on the spot market.
In September 2020, Law 14.052/2020 published by ANEEL was approved by the President, establishing terms for compensation to MRE hydro generators for the incorrect application of the GSF mechanism from 2013 to 2018, which resulted in higher charges assessed to MRE hydro generators by the regulator. Under the law, potential compensation will be in the form of an offer for a concession extension for each hydro generator in exchange for full payment of billed GSF trade payables, the amount of which will be reduced in conjunction with the payment for a concession extension. See Key Trends and Uncertainties—Regulatory in Item 7.— Management’s Discussion and Analysis of Financial Condition and Results of Operations in this Form 10-K*.*
Development Strategy — AES Brasil's strategy is to grow by adding renewable capacity to its generation platform through acquisition or greenfield projects, to focus on client satisfaction and innovation to offer new products and energy solutions, and to be recognized for excellence in asset management.
In 2020, AES Brasil acquired the Tucano Project, a 582 MW greenfield wind power project in the state of Bahia, for which construction is scheduled to start in 2021 and when completed, will supply long-term PPAs. The first phase (155 MW) will be developed in 2021 through a joint venture with Unipar Carbocloro for a 20-year PPA starting in 2022. The second phase (167 MW) will be 100% developed by AES Brasil in 2021, for a 15-year PPA with Anglo American starting in 2022. AES Brasil is seeking other long-term PPAs to fulfill the remaining 260 MW.
| 32 | 2020 Annual Report |
In March 2020, AES Brasil signed two purchase option agreements for a total installed capacity up to 1,100 MW of Cajuína greenfield wind power project in the state of Rio Grande do Norte, which are being exercised as the company secures long-term PPAs. In August 2020, AES Brasil signed a Shareholder Purchase Agreement ("SPA") for the first phase, Santa Tereza, which has installed capacity of 420 MW. Closing is expected to occur in the first quarter of 2021. A Memorandum of Understanding was signed with Ferbasa for 80 MW energy supply over a period of 20 years, beginning in 2024. The SPA for the second phase, São Ricardo, which has installed capacity of 437 MW, was signed in February 2021. AES Brasil is seeking other long-term PPAs to fulfill the remaining 777 MW in phases 1 and 2.
Under the current terms of the 2018 legal agreement in connection with AES Brasil's concession with the state government, AES Brasil is required to increase its capacity in the state of São Paulo by an additional 81 MW by October 2024.
| 33 | 2020 Annual Report |
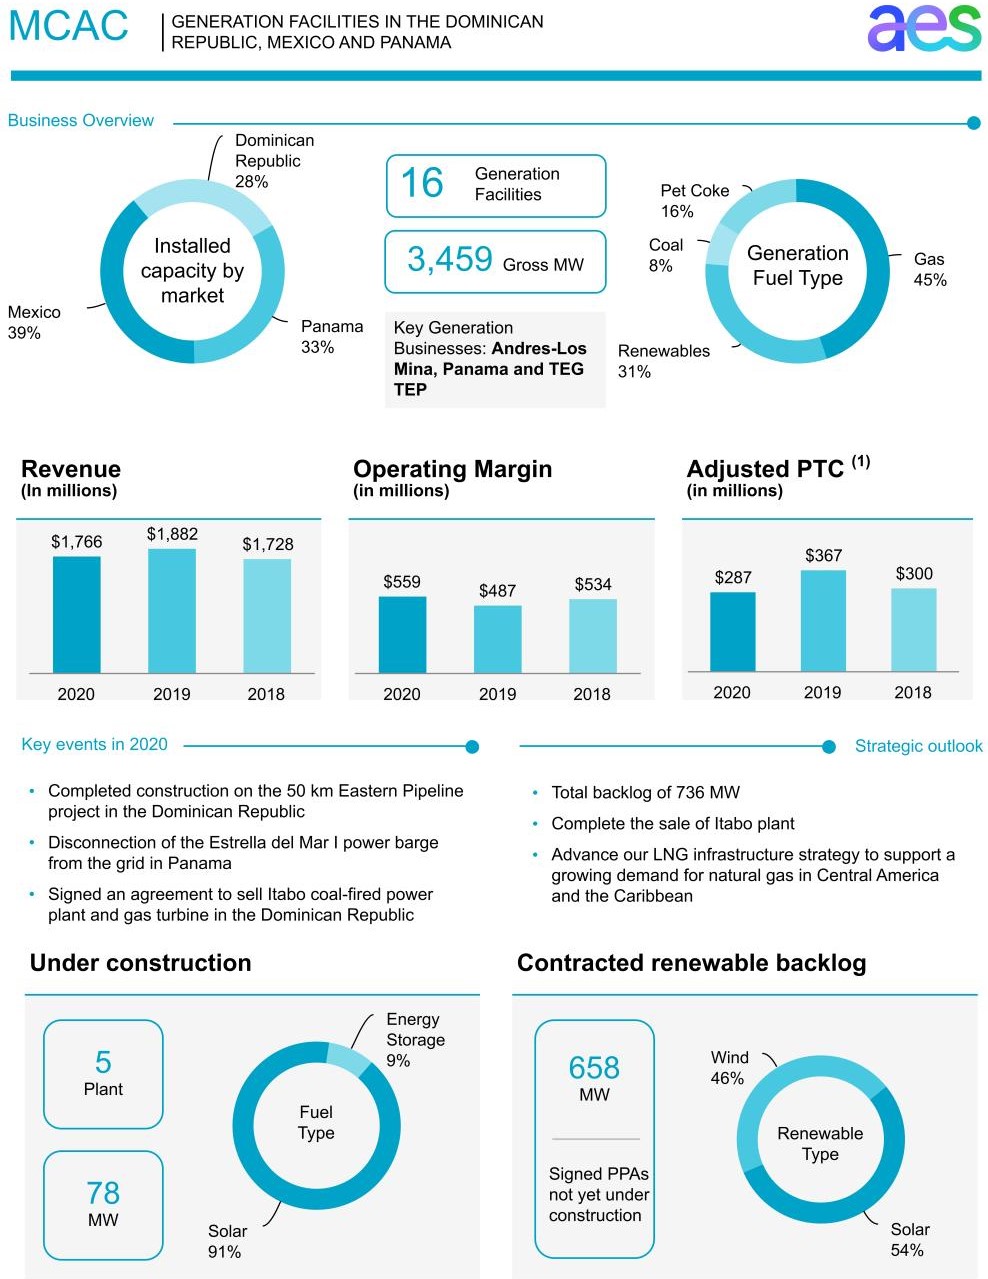
| (1) Non-GAAP measure. See Item 7.—Management’s Discussion and Analysis of Financial Condition and Results of Operations—SBU Performance Analysis—Non-GAAP Measures for reconciliation and definition. |
| 34 | 2020 Annual Report |
MCAC SBU
Our MCAC SBU has a portfolio of generation facilities, including renewable energy, in three countries, with a total capacity of 3,459 MW.
Generation — The following table lists our MCAC SBU generation facilities:
| Business | Location | Fuel | Gross MW | AES Equity Interest | Year Acquired or Began Operation | Contract Expiration Date | Customer(s) | |||||||||||||||||||||||||||||||||||||
| DPP (Los Mina) | Dominican Republic | Gas | 358 | 85 | % | 1996 | 2022 | Andres, CDEEE, Non-Regulated Users | ||||||||||||||||||||||||||||||||||||
| Andres (1) | Dominican Republic | Gas | 319 | 85 | % | 2003 | 2022 | Ede Norte, Ede Este, Ede Sur, Non-Regulated Users | ||||||||||||||||||||||||||||||||||||
| Itabo (2) | Dominican Republic | Coal | 260 | 43 | % | 2000 | 2022 | Ede Norte, Ede Este, Ede Sur, Non-Regulated Users | ||||||||||||||||||||||||||||||||||||
| Andres ES | Dominican Republic | Energy Storage | 10 | 85 | % | 2017 | ||||||||||||||||||||||||||||||||||||||
| Los Mina DPP ES | Dominican Republic | Energy Storage | 10 | 85 | % | 2017 | ||||||||||||||||||||||||||||||||||||||
| Dominican Republic Subtotal | 957 | |||||||||||||||||||||||||||||||||||||||||||
| Merida III | Mexico | Gas/Diesel | 505 | 75 | % | 2000 | 2025 | Comision Federal de Electricidad | ||||||||||||||||||||||||||||||||||||
| Mesa La Paz (3) | Mexico | Wind | 306 | 50 | % | 2019 | 2045 | Fuentes de Energia Peñoles | ||||||||||||||||||||||||||||||||||||
| Termoelectrica del Golfo (TEG) | Mexico | Pet Coke | 275 | 99 | % | 2007 | 2027 | CEMEX | ||||||||||||||||||||||||||||||||||||
| Termoelectrica del Penoles (TEP) | Mexico | Pet Coke | 275 | 99 | % | 2007 | 2027 | Peñoles | ||||||||||||||||||||||||||||||||||||
| Mexico Subtotal | 1,361 | |||||||||||||||||||||||||||||||||||||||||||
| Colon (4) | Panama | Gas | 381 | 50 | % | 2018 | 2028 | ENSA, Edemet, Edechi | ||||||||||||||||||||||||||||||||||||
| Bayano | Panama | Hydro | 260 | 49 | % | 1999 | 2030 | ENSA, Edemet, Edechi, Other | ||||||||||||||||||||||||||||||||||||
| Changuinola | Panama | Hydro | 223 | 90 | % | 2011 | 2030 | AES Panama | ||||||||||||||||||||||||||||||||||||
| Chiriqui-Esti | Panama | Hydro | 120 | 49 | % | 2003 | 2030 | ENSA, Edemet, Edechi, Other | ||||||||||||||||||||||||||||||||||||
| Penonome I | Panama | Wind | 55 | 49 | % | 2020 | 2023 | Altenergy | ||||||||||||||||||||||||||||||||||||
| Chiriqui-Los Valles | Panama | Hydro | 54 | 49 | % | 1999 | 2030 | ENSA, Edemet, Edechi, Other | ||||||||||||||||||||||||||||||||||||
| Chiriqui-La Estrella | Panama | Hydro | 48 | 49 | % | 1999 | 2030 | ENSA, Edemet, Edechi, Other | ||||||||||||||||||||||||||||||||||||
| Panama Subtotal | 1,141 | |||||||||||||||||||||||||||||||||||||||||||
| 3,459 |
(1)Plant also includes an adjacent regasification facility, as well as a 70 TBTU LNG storage tank.
(2)Entered into an agreement to sell 43% interest in the Itabo facility in June 2020.
(3)Unconsolidated entity, accounted for as an equity affiliate.
(4)Plant also includes an adjacent regasification facility, as well as an 80 TBTU LNG storage tank.
Under construction — The following table lists our plants under construction in the MCAC SBU:
| Business | Location | Fuel | Gross MW | AES Equity Interest | Expected Date of Commercial Operations | |||||||||||||||||||||||||||
| Bayasol | Dominican Republic | Solar | 50 | 85 | % | 1H 2021 | ||||||||||||||||||||||||||
| Itabo Energy Storage | Dominican Republic | Energy Storage | 7 | 43 | % | 2H 2021 | ||||||||||||||||||||||||||
| Dominican Republic Subtotal (1) | 57 | |||||||||||||||||||||||||||||||
| Pese Solar | Panama | Solar | 10 | 49 | % | 1H 2021 | ||||||||||||||||||||||||||
| Mayorca Solar | Panama | Solar | 10 | 49 | % | 1H 2021 | ||||||||||||||||||||||||||
| 5B Costa Norte | Panama | Solar | 1 | 100 | % | 1H 2021 | ||||||||||||||||||||||||||
| Panama Subtotal | 21 | |||||||||||||||||||||||||||||||
| 78 |
(1)A second 50 TBTU LNG storage tank is under construction and expected to come on-line in the first half of 2023.
| 35 | 2020 Annual Report |
The following map illustrates the location of our MCAC facilities:
MCAC Businesses
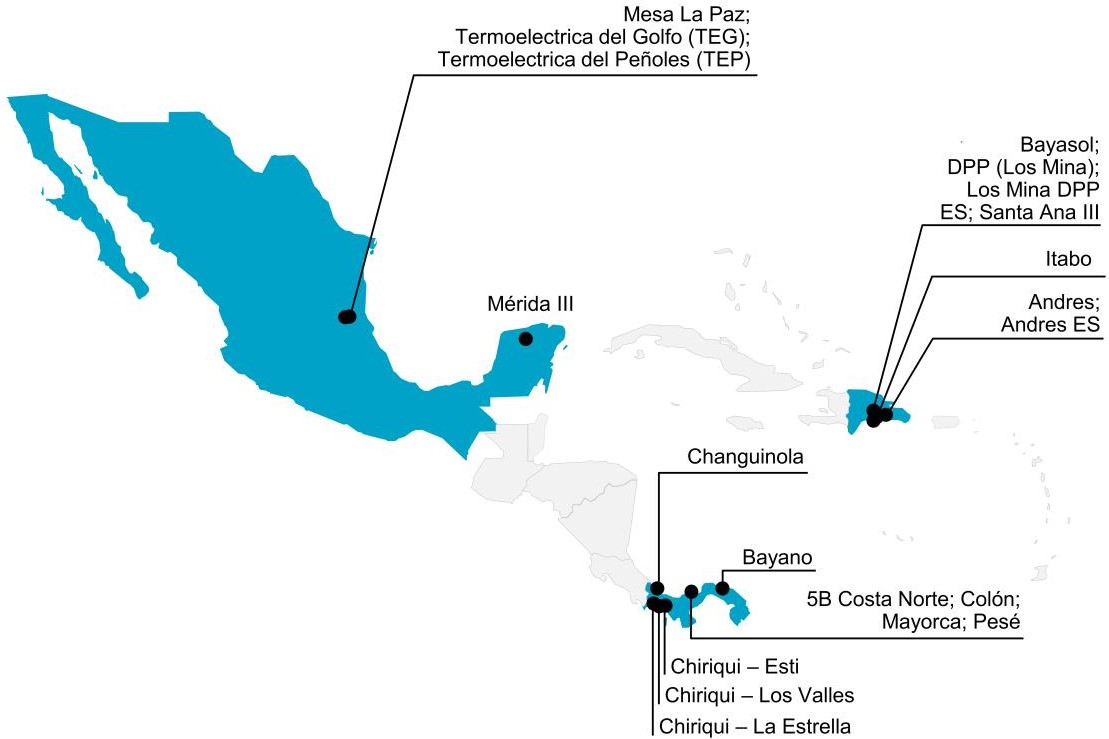
Dominican Republic
Business Description — AES Dominicana consists of three operating subsidiaries: Itabo, Andres, and Los Mina. With a total of 957 MW of installed capacity, AES provides 19% of the country's capacity and supplies approximately 29% of the country's energy demand via these generation facilities. 873 MW is predominantly contracted until 2022 with government-owned distribution companies and large customers.
AES has a strategic partnership with the Estrella and Linda Groups ("Estrella-Linda"), a consortium of two leading Dominican industrial groups that manage a diversified business portfolio.
Itabo is 42.5% owned by AES. Itabo owns and operates two thermal power generation units with a total of 260 MW of installed capacity. On June 29, 2020, AES executed a sale and purchase agreement to sell its entire ownership interest in Itabo. In February 2021, the sale was approved by the Superintendence of Electricity and is expected to close in the first quarter of 2021.
Andres and Los Mina are owned 85% by AES. Andres owns and operates a combined cycle natural gas turbine and an energy storage facility with combined generation capacity of 329 MW, as well as the only LNG import terminal in the country, with 160,000 cubic meters of storage capacity. Los Mina owns and operates a combined cycle with two natural gas turbines and an energy storage facility with combined generation capacity of 368 MW.
AES Dominicana has a long-term LNG purchase contract through 2023 for 33.6 trillion btu/year with a price linked to NYMEX Henry Hub. The LNG contract terms allow delivery to various markets in Latin America. These plants capitalize on the competitively-priced LNG contract by selling power where the market is dominated by fuel oil-based generation. Andres has a long-term contract to sell regasified LNG to industrial users within the Dominican Republic using compression technology to transport it within the country, thereby capturing demand from industrial and commercial customers.
| 36 | 2020 Annual Report |
Key Financial Drivers — Financial results are driven by many factors, including, but not limited to:
-
changes in spot prices due to fluctuations in commodity prices (since fuel is a pass-through cost under the PPAs, any variation in oil prices will impact spot sales for both Andres and Itabo);
-
contracting levels and the extent of capacity awarded; and
-
growth in domestic natural gas demand, supported by new infrastructure such as the Eastern Pipeline and second LNG tank.
Regulatory Framework and Market Structure — The Dominican Republic energy market is a decentralized industry consisting of generation, transmission, and distribution businesses. Generation companies can earn revenue through short- and long-term PPAs, ancillary services, and a competitive wholesale generation market. All generation, transmission, and distribution companies are subject to and regulated by the General Electricity Law.
Two main agencies are responsible for monitoring compliance with the General Electricity Law:
-
The National Energy Commission drafts and coordinates the legal framework and regulatory legislation. They propose and adopt policies and procedures to implement best practices, support the proper functioning and development of the energy sector, and promote investment.
-
The Superintendence of Electricity's main responsibilities include monitoring compliance with legal provisions, rules, and technical procedures governing generation, transmission, distribution, and commercialization of electricity. They monitor behavior in the electricity market in order to prevent monopolistic practices.
In addition to the two agencies responsible for monitoring compliance with the General Electricity Law, the Ministry of Industry and Commerce supervises commercial and industrial activities in the Dominican Republic as well as the fuels and natural gas commercialization to end users.
The Dominican Republic has one main interconnected system with 4,921 MW of installed capacity, composed of thermal (75%), hydroelectric (13%), wind (8%), and solar (4%).
Development Strategy — AES will continue to develop the commercialization of natural gas and incorporate partners directly in gas infrastructure projects. AES partnered with Energas in a joint venture which has been operating the 50 km Eastern Pipeline since February 2020. The joint venture is also developing a new LNG facility of 120,000 cubic meters, including additional storage, regasification, and truck loading capacity, for which construction is scheduled to start in 2021. This will allow AES to reach new customers who have converted, or are in the process of converting, to natural gas as a fuel source, and better operational flexibility.
Panama
Business Description — AES owns and operates five hydroelectric plants totaling 705 MW of generation capacity, a natural gas-fired power plant with 381 MW of generation capacity, and a wind farm of 55 MW, which collectively represent 30% of the total installed capacity in Panama. Furthermore, AES operates an LNG regasification facility, a 180,000 cubic meter storage tank, and a truck loading facility which reached commercial operations in December 2020.
The majority of our hydroelectric plants in Panama are based on run-of-the-river technology, with the exception of the 260 MW Bayano plant. Hydrological conditions have an important influence on profitability. Variations in hydrology can result in an excess or a shortfall in energy production relative to our contractual obligations. Hydro generation is generally in a shortfall position during the dry season from January through May, which is offset by thermal generation since its behavior is opposite and complementary to hydro generation.
Our hydro and thermal assets are mainly contracted through medium to long-term PPAs with distribution companies. A small volume of our hydro plants are contracted with unregulated users. Our hydro assets in Panama have PPAs with distribution companies expiring in December 2030 for a total contracted capacity of 383 MW. Our thermal asset in Panama has PPAs with distribution companies for a total contracted capacity of 350 MW expiring in August 2028.
Key Financial Drivers — Financial results are driven by many factors, including, but not limited to:
-
changes in hydrology, which impacts commodity prices and exposes the business to variability in the cost of replacement power;
-
fluctuations in commodity prices, mainly oil and natural gas, which affect the cost of thermal generation and spot prices;
| 37 | 2020 Annual Report |
-
constraints imposed by the capacity of transmission lines connecting the west side of the country with the load, keeping surplus power trapped during the rainy season; and
-
country demand as GDP growth is expected to remain strong over the short and medium term.
Regulatory Framework and Market Structure — The Panamanian power sector is composed of three distinct operating business units: generation, distribution, and transmission. Generators can enter into short-term and long-term PPAs with distributors or unregulated consumers. In addition, generators can enter into alternative supply contracts with each other. Outside of PPAs, generators may buy and sell energy in the short-term market. Generators can only contract up to their firm capacity.
Three main agencies are responsible for monitoring compliance with the General Electricity Law:
-
The National Secretary of Energy in Panama (SNE) has the responsibilities of planning, supervising, and controlling policies of the energy sector within Panama. The SNE proposes laws and regulations to the executive agencies that regulate the procurement of energy and hydrocarbons for the country.
-
The regulator of public services, known as the ASEP, is an autonomous agency of the government. ASEP is responsible for the control and oversight of public services, including electricity, the transmission and distribution of natural gas utilities, and the companies that provide such services.
-
The National Dispatch Center (CND) implements the economic dispatch of electricity in the wholesale market. The National Dispatch Center's objectives are to minimize the total cost of generation and maintain the reliability and security of the electric power system. Short-term power prices are determined on an hourly basis by the last dispatched generating unit. Physical generation of energy is determined by the National Dispatch Center regardless of contractual arrangements.
Panama's current total installed capacity is 3,854 MW, composed of hydroelectric (47%), thermal (41%), wind (7%), and solar (5%) generation.
Development Strategy — Given our LNG facility’s excess capacity in Panama, the company will develop natural gas supply solutions for third parties such as power generators and industrial and commercial customers. This strategy will support a growing demand for natural gas in the region and will contribute to AES' mission by reducing carbon dioxide emissions as a result of using LNG.
In addition to investing in LNG infrastructure, AES is investing in renewable projects within the region. This will increase complementary non-hydro renewable assets in the system and contribute to the reduction of hydrological risk in Panama.
Mexico
Business Description — AES has 1,361 MW of installed capacity in Mexico. The TEG and TEP pet coke-fired plants, located in Tamuin, San Luis Potosi, supply power to their offtakers under long-term PPAs expiring in 2027 with a 90% availability guarantee. TEG and TEP secure their fuel under a long-term contract.
Merida is a CCGT located on Mexico's Yucatan Peninsula. Merida sells power to the CFE under a capacity and energy based long-term PPA through 2025. Additionally, the plant purchases natural gas and diesel fuel under a long-term contract with one of the CFE’s subsidiaries, the cost of which is then passed through to the CFE under the terms of the PPA.
Mesa La Paz, a 306 MW wind project developed under a joint venture with Grupo Bal, achieved commercial operations in December 2019. Starting in April 2020, Mesa La Paz sells power under a long-term PPA expiring in 2045.
Key Financial Drivers — Financial results are driven by many factors, including, but not limited to:
-
fully contracting the companies, providing additional benefits from improved operational performance, including performance incentives and/or excess energy sales; and
-
changes in the methodology to calculate spot energy prices or Locational Marginal Prices, which impacts the excess energy sales to the CFE (see Regulatory Framework and Market Structure below) in (i) TEG and TEP under self-supply scheme, and (ii) Mesa La Paz under the New Market Rules.
| 38 | 2020 Annual Report |
Regulatory Framework and Market Structure — Mexico´s main electrical system is called the National Interconnected System (SIN), which geographically covers an area from Puerto Peñasco, Sonora to Cozumel, Quintana Roo. Mexico also has three isolated electrical systems: (1) the Baja California Interconnected System, which is interconnected with the WECC; (2) the Baja California Sur Interconnected System; and (3) the Mulegé Interconnected System, a very small electrical system. All three are isolated from the SIN and from each other. The Mexican power industry comprises the activities of generation, transmission, distribution, and commercialization segments, considering transmission and distribution to be exclusive state services.
In addition to the Ministry of Energy, three main agencies are responsible for regulating the market agents and their activities, monitoring compliance with the Electric Industry Law and the Market Rules, and the surveillance of operational compliance and management of the wholesale electricity market:
-
The Energy Regulatory Commission is responsible for the establishment of directives, orders, methodologies, and standards to regulate the electric and fuel markets, as well as granting permits.
-
The National Center for Energy Control, as an ISO, is responsible for managing the wholesale electricity market, transmission and distribution infrastructure, planning network developments, guaranteeing open access to network infrastructure, executing competitive mechanisms to cover regulated demand, and setting transmission charges.
-
The Electricity Federal Commission (CFE) owns the transmission and distribution grids and is also the country's basic supplier. CFE is the offtaker for IPP generators, and together with its own power units has more than 50% of the current generation market share.
Mexico has an installed capacity totaling 86 GW with a generation mix composed of thermal (65%), hydroelectric (15%), wind (8%), solar (7%), and other fuel sources (5%).
Development Strategy — AES has partnered with Grupo Bal in a joint venture to co-invest in power and related infrastructure projects in Mexico, focusing on renewable and natural gas generation.
| 39 | 2020 Annual Report |
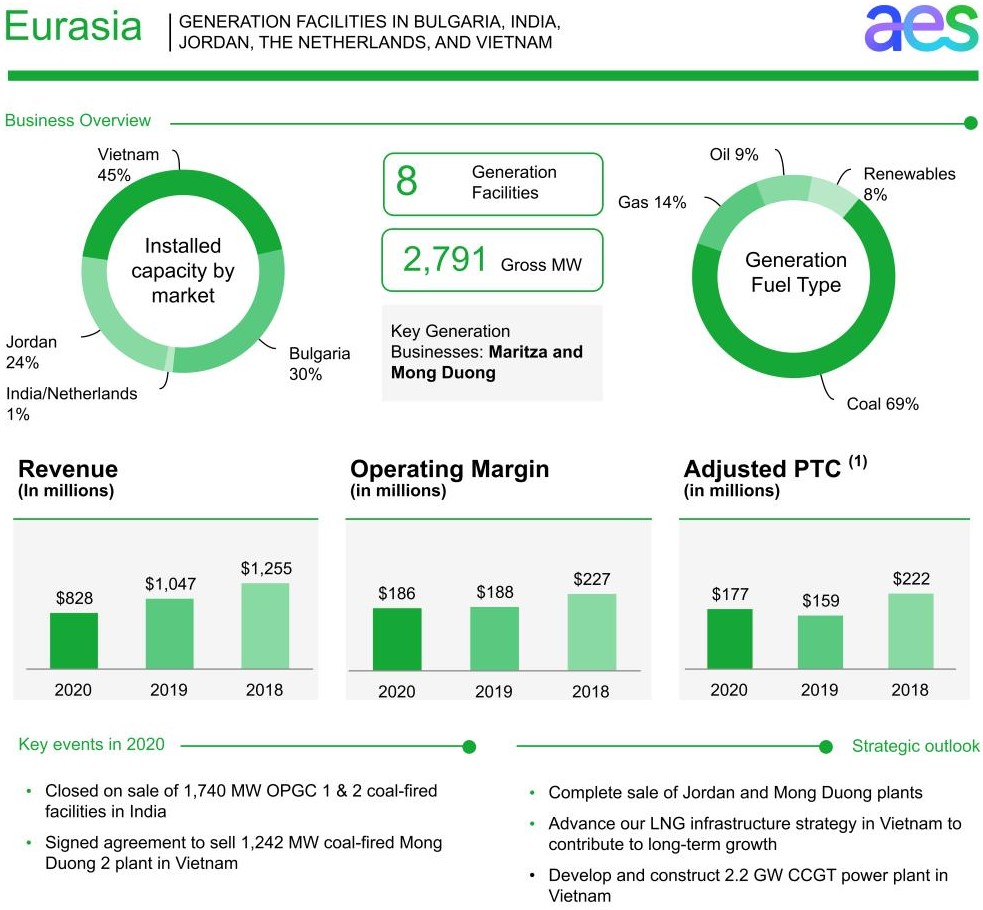
| (1) Non-GAAP measure. See Item 7.—Management’s Discussion and Analysis of Financial Condition and Results of Operations—SBU Performance Analysis—Non-GAAP Measures for reconciliation and definition. |
| 40 | 2020 Annual Report |
Eurasia SBU
Generation — Our Eurasia SBU has generation facilities in five countries with total operating installed capacity of 2,791 MW. The following table lists our Eurasia SBU generation facilities:
| Business | Location | Fuel | Gross MW | AES Equity Interest | Year Acquired or Began Operation | Contract Expiration Date | Customer(s) | |||||||||||||||||||||||||||||||||||||
| Maritza | Bulgaria | Coal | 690 | 100 | % | 2011 | 2026 | NEK | ||||||||||||||||||||||||||||||||||||
| St. Nikola | Bulgaria | Wind | 156 | 89 | % | 2010 | 2025 | Electricity Security Fund | ||||||||||||||||||||||||||||||||||||
| Bulgaria Subtotal | 846 | |||||||||||||||||||||||||||||||||||||||||||
| Delhi ES | India | Energy Storage | 10 | 60 | % | 2019 | ||||||||||||||||||||||||||||||||||||||
| India Subtotal | 10 | |||||||||||||||||||||||||||||||||||||||||||
| Amman East (1) | Jordan | Gas | 381 | 37 | % | 2009 | 2033 | National Electric Power Company | ||||||||||||||||||||||||||||||||||||
| IPP4 (1) | Jordan | Heavy Fuel Oil | 250 | 36 | % | 2014 | 2039 | National Electric Power Company | ||||||||||||||||||||||||||||||||||||
| AM Solar | Jordan | Solar | 52 | 36 | % | 2019 | 2039 | National Electric Power Company | ||||||||||||||||||||||||||||||||||||
| Jordan Subtotal | 683 | |||||||||||||||||||||||||||||||||||||||||||
| Netherlands ES | Netherlands | Energy Storage | 10 | 100 | % | 2015 | ||||||||||||||||||||||||||||||||||||||
| Netherlands Subtotal | 10 | |||||||||||||||||||||||||||||||||||||||||||
| Mong Duong 2 (2) | Vietnam | Coal | 1,242 | 51 | % | 2015 | 2040 | EVN | ||||||||||||||||||||||||||||||||||||
| Vietnam Subtotal | 1,242 | |||||||||||||||||||||||||||||||||||||||||||
| 2,791 |
(1)Entered into an agreement to sell 26% interest in these businesses in November 2020.
(2)Entered into an agreement to sell our entire interest in the Mong Duong 2 plant in December 2020.
In December 2020, the Company completed the sale of its entire 49% equity interest in the OPGC coal-fired generation facilities in India.
| 41 | 2020 Annual Report |
The following map illustrates the location of our Eurasia facilities:
Eurasia Businesses
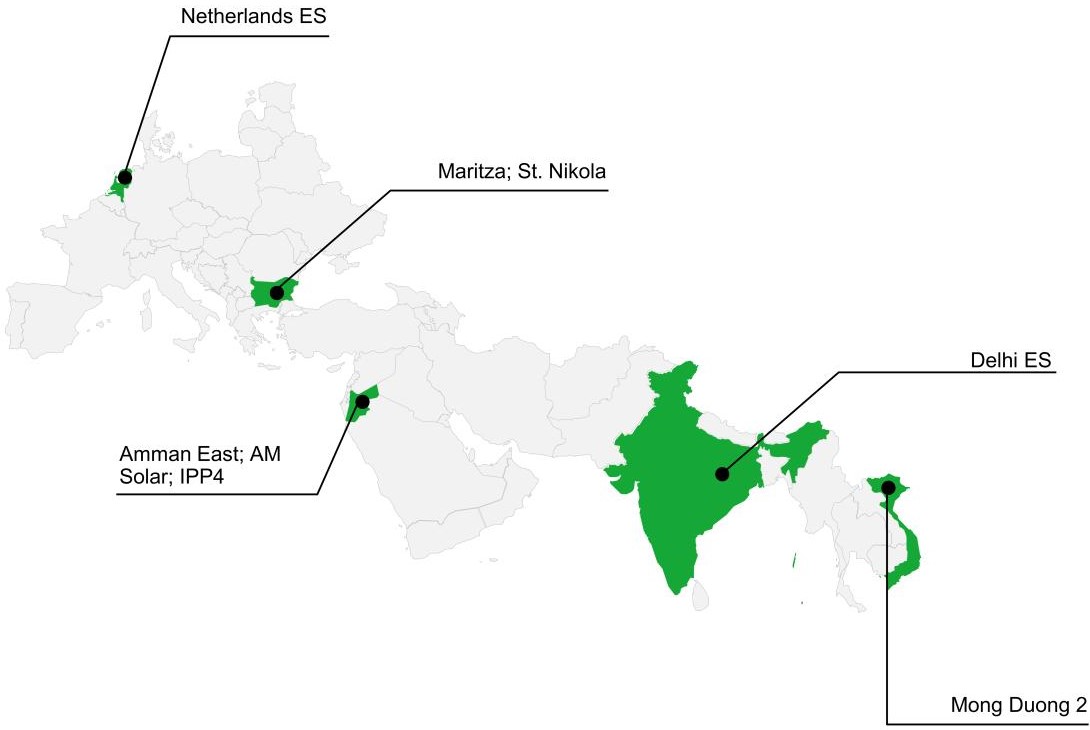
Vietnam
Business Description — Mong Duong 2 is a 1,242 MW gross coal-fired plant located in the Quang Ninh Province of Vietnam and was constructed under a BOT service concession agreement expiring in 2040. This is the first and largest coal-fired BOT plant using pulverized coal-fired boiler technology in Vietnam. The BOT company has a PPA with EVN and a Coal Supply Agreement with Vinacomin, both expiring in 2040.
On December 31, 2020, AES executed an agreement to sell its entire 51% interest in the Mong Duong 2 plant. The sale is expected to close in late 2021 or early 2022, subject to customary approvals, including from the Government of Vietnam and the minority partners in Mong Duong 2.
Key Financial Drivers — Financial results are driven by many factors, including, but not limited to, the operating performance and availability of the facility.
Regulatory Framework and Market Structure — The Ministry of Industry and Trade in Vietnam is primarily responsible for formulating a program to restructure the power industry, developing the electricity market, and promulgating electricity market regulations. The fuel supply is owned by the government through Vinacomin, a state-owned entity, and PetroVietnam.
The Vietnam power market is divided into three regions (North, Central, and South), with total installed capacity of approximately 54 GW. The fuel mix in Vietnam is composed primarily of hydropower at 37% and coal at 36%. EVN, the national utility, owns 53% of installed generation capacity.
The government is in the process of realigning EVN-owned companies into three different independent operations in order to create a competitive power market. The first stage of this realignment was the implementation of the Competitive Electricity Market, which has been in operation since 2012. The second stage was the introduction of the Electricity Wholesale Market, which has been in operation since the beginning of 2019. The third and final stage impacts the Electricity Retail Market, which will undergo similar reforms after 2022. BOT power
| 42 | 2020 Annual Report |
plants will not directly participate in the power market; alternatively, a single buyer will bid the tariff on the power pool on their behalf.
Development Strategy — In Vietnam, we continue to advance the development of our Son My LNG terminal project, which has a design capacity of up to 9.6 million metric tonnes per annum, and the Son My 2 CCGT project, which has a capacity of about 2,250 MW. In October 2019, we received formal approval as a government-mandated investor in the Son My LNG terminal project in partnership with PetroVietnam Gas and in October 2020, we signed the term sheet agreement with PetroVietnam Gas for the joint venture agreement. In September 2019, we received formal approval as the government-mandated investor with 100% equity ownership in the Son My 2 CCGT project and executed a statutory memorandum of understanding with Vietnam’s Ministry of Industry and Trade in November 2019 to continue developing the Son My 2 CCGT project under Vietnam’s Build-Operate-Transfer legal framework. The Son My 2 CCGT project will utilize the Son My LNG terminal project and be its anchor customer.
Bulgaria
Business Description — Our AES Maritza plant is a 690 MW lignite fuel thermal power plant. AES Maritza's entire power output is contracted with NEK, the state-owned public electricity supplier, independent energy producer, and trading company. Maritza is contracted under a 15-year PPA that expires in May 2026. AES Maritza has been collecting receivables from NEK in a timely manner since 2016. However, NEK's liquidity position remains subject to political conditions and regulatory changes in Bulgaria.
The DG Comp is reviewing NEK’s PPA with AES Maritza pursuant to the European Union’s state aid rules. AES Maritza believes that its PPA is legal and in compliance with all applicable laws. For additional details see Key Trends and Uncertainties in Item 7.— Management’s Discussion and Analysis of Financial Condition and Results of Operations in this Form 10-K*.*
AES also owns an 89% economic interest in the St. Nikola wind farm with 156 MW of installed capacity. The power output of St. Nikola is sold to customers operating on the liberalized electricity market and the plant receives additional revenue per the terms of an October 2018 Contract for Premium with the state-owned Electricity Security Fund.
Key Financial Drivers — Financial results are driven by many factors, including, but not limited to:
-
regulatory changes in the Bulgarian power market;
-
results of the DG Comp review;
-
availability and load factor of the operating units;
-
the level of wind resources for St. Nikola;
-
spot market price volatility beyond the level of compensation through the Contract for Premium for St. Nikola; and
-
NEK's ability to meet the payment terms of the PPA contract with Maritza.
Regulatory Framework and Market Structure — The electricity sector in Bulgaria allows both regulated and competitive segments. In its capacity as the public provider of electricity, NEK acts as a single buyer and seller for all regulated transactions on the market. Electricity outside the regulated market trades on one of the platforms of the Independent Bulgarian Electricity Exchange day-ahead market, intra-day market, or bilateral contracts market. Bulgaria is working with the European Commission on the implementation of a model that allows for a gradual phase-out of regulated energy prices.
Bulgaria’s power sector is supported by a diverse generation mix, universal access to the grid, and numerous cross-border connections with neighboring countries. In addition, it plays an important role in the energy balance in the Balkan region.
Bulgaria has 13 GW of installed capacity enabling the country to meet and exceed domestic demand and export energy. Installed capacity is primarily thermal (45%), hydro (25%), and nuclear (16%).
Environmental Regulation — In 2017, new EU environmental standards were enacted that regulate emissions from the combustion of solid fuels for large combustion plants, known as the Best Available Techniques Reference Document for Large Combustion Plants, which applies to AES Maritza. AES Maritza was granted a derogation with respect to these standards and a formal decision for the preliminary execution of that derogation was made by the Bulgarian environmental authorities in February 2021. A third-party appeal with respect to the derogation has been
| 43 | 2020 Annual Report |
made; however, while such appeal is considered, the preliminary execution of that derogation is in full force and effect.
In December 2019, the EU approved the European Green New Deal, a framework document that sets out how to make Europe climate-neutral by 2050. In response, in October 2020, Bulgaria submitted an updated version of the Integrated Energy and Climate Plan of the Republic of Bulgaria 2021-2030 ("IECP"), with national targets to contribute to the EU decarbonization targets, which does not include specific commitments to phase out coal plants before 2030. The IECP emphasizes the socio-economic importance of the indigenous coal industry in Bulgaria and the potential for indigenous coal to provide resources for electricity generation in the next 60 years while contributing to Bulgaria's energy and national security. There are currently no EU or Bulgarian regulations that limit the ability of AES Maritza to operate.
Jordan
Business Description — In Jordan, AES has a 37% controlling interest in Amman East, a 381 MW oil/gas-fired plant fully contracted with the national utility under a 25-year PPA expiring in 2033, a 36% controlling interest in the IPP4 plant, a 250 MW oil/gas-fired peaker plant fully contracted with the national utility until 2039, and a 36% controlling interest in a 52 MW solar plant fully contracted with the national utility under a 20-year PPA expiring in 2039. We consolidate the results in our operations as we have a controlling interest in these businesses.
On November 10, 2020, AES executed a sale and purchase agreement to sell approximately 26% effective ownership interest in both the Amman East and IPP4 plants. The sale is expected to close in the first half of 2021 subject to customary approvals, including lender consents.
Regulatory Framework and Market Structure — The Jordan electricity transmission market is a single-buyer model with the state-owned National Electric Power Company ("NEPCO") responsible for transmission. NEPCO generally enters into long-term PPAs with IPPs to fulfill energy procurement requests from distribution utilities. The sector is prioritizing renewable energy development, with 2,400 MW of renewable energy installed capacity expected by the end of 2021, 2,129 MW of which is already connected to the grid.
India
Development Strategy — India is a high-growth market for renewables and battery energy storage. AES owns and operates a test 10 MW BESS in Delhi city, located inside a substation of Tata Power Delhi Distribution Limited ("TPDDL"). The BESS is integrated with the TPDDL distribution system and provides various frequency regulation services. Discussions of the commercial opportunities with TPDDL are ongoing. Leveraging the Delhi BESS experience, we are approaching similar use case opportunities with other customers in India.
| 44 | 2020 Annual Report |
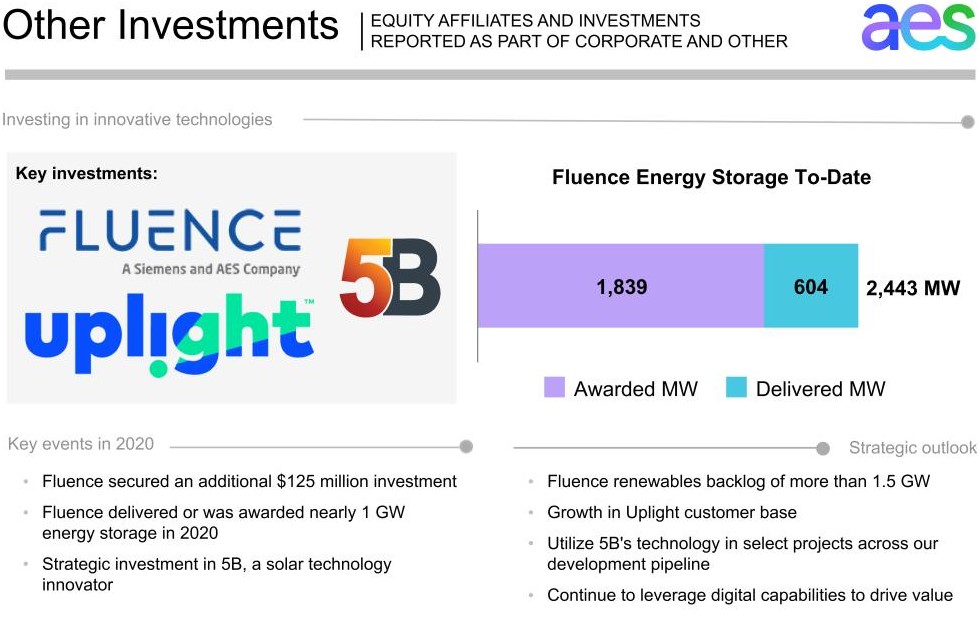
Other Investments
Fluence and Uplight are unconsolidated entities and their results are reported as Net equity in earnings of affiliates on our Consolidated Statements of Operations. 5B is a cost method investment and AES will record income only when it receives dividends from 5B.
Fluence
Business Description — Fluence, AES' joint venture with Siemens, is a global energy storage technology and services company aligned with the AES strategy of becoming less carbon intensive. Fluence represents the combination of two global leaders in utility-scale, battery-based energy storage, bringing together the AES Advancion and Siemens Siestorage platforms, the capabilities and expertise of the two partners, and the global sales presence of Siemens.
In December 2020, Fluence entered into an agreement with the QIA whereby QIA will invest $125 million in Fluence. Following the completion of the transaction, which is expected in the second quarter of 2021, AES and Siemens are expected to each own approximately 44% of Fluence.
Key Financial Drivers — Fluence's financial results are driven by the growth in its product revenue and an efficient cost structure that is expected to benefit from increased scale. Fluence’s pipeline of potential projects is global, with approximately 50% being located outside the U.S.
Regulatory Framework and Market Structure — The grid-connected energy storage sector is expanding rapidly with over 5 GW of projects publicly announced in 2020. By incorporating energy storage across the electric power network, utilities and communities around the world will optimize their infrastructure investments, increase network flexibility and resiliency, and accelerate cost-effective integration of renewable electricity generation. Fluence is positioned to be a leading participant in this growth, accounting for approximately 15% of the storage market across their target markets in 2020.
| 45 | 2020 Annual Report |
Uplight
Business Description — The Company holds an equity interest in Uplight as part of its digitization and growth strategy. Uplight offers a comprehensive digital platform for utility customer engagement. Uplight provides software and services to approximately 80 of the world’s leading electric and gas utilities, principally in the U.S., with the mission of motivating and enabling energy users and providers to transition to a clean energy ecosystem. Uplight's solutions form a unified, end-to-end customer energy experience system that delivers innovative energy efficiency, demand response, and clean energy solutions quickly. Utility and energy company leaders rely on Uplight and its customer-focused digital energy experiences to improve customer satisfaction, reduce service costs, increase revenue, and reduce carbon emissions.
Key Financial Drivers — Uplight's financial results are driven by the rate of growth of new customers and the extension of additional services to existing customers. Revenue growth primarily drives its financial results, given the relative significance of fixed operating costs.
Development Strategy — AES' collaboration with Uplight is designed to create value for Uplight, AES and their respective customers. IPL and DP&L have implemented Uplight's consumer engagement solutions in support of energy efficiency and demand response programs. AES and Uplight are now working together to develop mobile-enabled engagement, e-mobility and advanced consumer and industrial offerings, with plans for future deployment of the Uplight platform in Latin America.
5B
Business Description — The Company made a strategic investment in 5B, a solar technology innovator with the mission to accelerate the transformation of the world to a clean energy future. 5B's technology design enables solar projects to be installed up to three times faster, while allowing for up to two times more energy within the same footprint as traditional plants.
Key Financial Drivers — 5B is a cost method investment and AES will record income only when it receives dividends from 5B. 5B is in the beginning of its growth mode and is expanding its ecosystem for global reach.
Development Strategy — In addition to a large global market for third party projects, we believe there is an addressable market of nearly 5 GW across our development pipeline. AES expects to utilize this technology in conjunction with ongoing automation and digital initiatives to speed up delivery time and lower costs. 5B technology has been deployed at a 2 MW AES project in Panama and is expected to be deployed at a portion of the 180 MW Andes Solar 2b project to be constructed in Chile.
Environmental and Land-Use Regulations
The Company faces certain risks and uncertainties related to numerous environmental laws and regulations, including existing and potential GHG legislation or regulations, and actual or potential laws and regulations pertaining to water discharges, waste management (including disposal of coal combustion residuals), and certain air emissions, such as SO2, NOX, particulate matter, mercury, and other hazardous air pollutants. Such risks and uncertainties could result in increased capital expenditures or other compliance costs which could have a material adverse effect on certain of our U.S. or international subsidiaries, and our consolidated results of operations. For further information about these risks, see Item 1A.—Risk Factors—Our operations are subject to significant government regulation and could be adversely affected by changes in the law or regulatory schemes; Several of our businesses are subject to potentially significant remediation expenses, enforcement initiatives, private party lawsuits and reputational risk associated with CCR; Our businesses are subject to stringent environmental laws, rules and regulations; and Concerns about GHG emissions and the potential risks associated with climate change have led to increased regulation and other actions that could impact our businesses in this Form 10-K. For a discussion of the laws and regulations of individual countries within each SBU where our subsidiaries operate, see discussion within Item 1.—Business of this Form 10-K under the applicable SBUs.
Many of the countries in which the Company does business have laws and regulations relating to the siting, construction, permitting, ownership, operation, modification, repair and decommissioning of, and power sales from electric power generation or distribution assets. In addition, international projects funded by the International Finance Corporation, the private sector lending arm of the World Bank, or many other international lenders are subject to World Bank environmental standards or similar standards, which tend to be more stringent than local country standards. The Company often has used advanced generation technologies in order to minimize environmental impacts, such as combined fluidized bed boilers and advanced gas turbines, and environmental
| 46 | 2020 Annual Report |
control devices such as flue gas desulphurization for SO2 emissions and selective catalytic reduction for NOx emissions.
Environmental laws and regulations affecting electric power generation and distribution facilities are complex, change frequently, and have become more stringent over time. The Company has incurred and will continue to incur capital costs and other expenditures to comply with these environmental laws and regulations. The Company may be required to make significant capital or other expenditures to comply with these regulations. There can be no assurance that the businesses operated by the subsidiaries of the Company will be able to recover any of these compliance costs from their counterparties or customers such that the Company's consolidated results of operations, financial condition, and cash flows would not be materially affected.
Various licenses, permits, and approvals are required for our operations. Failure to comply with permits or approvals, or with environmental laws, can result in fines, penalties, capital expenditures, interruptions, or changes to our operations. Certain subsidiaries of the Company are subject to litigation or regulatory action relating to environmental permits or approvals. See Item 3.—Legal Proceedings in this Form 10-K for more detail with respect to environmental litigation and regulatory action.
United States Environmental and Land-Use Legislation and Regulations
In the United States, the CAA and various state laws and regulations regulate emissions of air pollutants, including SO2, NOX, particulate matter, GHGs, mercury, and other hazardous air pollutants. Certain applicable rules are discussed in further detail below.
CSAPR — CSAPR addresses the "good neighbor" provision of the CAA, which prohibits sources within each state from emitting any air pollutant in an amount which will contribute significantly to any other state’s nonattainment, or interference with maintenance of, any NAAQS. The CSAPR required significant reductions in SO2 and NOX emissions from power plants in many states in which subsidiaries of the Company operate. The Company is required to comply with the CSAPR in several states, including Ohio, Indiana, and Maryland. The CSAPR is implemented, in part, through a market-based program under which compliance may be achievable through the acquisition and use of emissions allowances created by the EPA. The Company complies with CSAPR through operation of existing controls and purchases of allowances on the open market, as needed.
On October 26, 2016, the EPA published a final rule to update the CSAPR to address the 2008 ozone NAAQS ("CSAPR Update Rule"). The CSAPR Update Rule finds that NOX ozone season emissions in 22 states (including Indiana, Maryland, and Ohio) affect the ability of downwind states to attain and maintain the 2008 ozone NAAQS, and, accordingly, the EPA issued federal implementation plans that both updated existing CSAPR NOX ozone season emission budgets for electric generating units within these states and implemented these budgets through modifications to the CSAPR NOX ozone season allowance trading program. Implementation started in the 2017 ozone season (May-September 2017). Affected facilities began to receive fewer ozone season NOX allowances in 2017, resulting in the need to purchase additional allowances. Additionally, on September 13, 2019, the D.C. Circuit remanded a portion of the CSAPR Update Rule to the EPA. On October 30, 2020, the EPA issued a proposed rule addressing 21 states’ (including Maryland and Indiana) outstanding “good neighbor” obligations with respect of the 2008 ozone NAAQS. The proposed rule could result in affected facilities receiving fewer ozone season NOX allowances as soon as the 2021 ozone season. While the Company's additional CSAPR compliance costs to date have been immaterial, the future availability of and cost to purchase allowances to meet the emission reduction requirements is uncertain at this time, but it could be material if certain facilities will need to purchase additional allowances based on reduced allocations.
New Source Review ("NSR") — The NSR requirements under the CAA impose certain requirements on major emission sources, such as electric generating stations, if changes are made to the sources that result in a significant increase in air emissions. Certain projects, including power plant modifications, are excluded from these NSR requirements, if they meet the routine maintenance, repair and replacement ("RMRR") exclusion of the CAA. There is ongoing uncertainty, and significant litigation, regarding which projects fall within the RMRR exclusion. Over the past several years, the EPA has filed suits against coal-fired power plant owners and issued NOVs to a number of power plant owners alleging NSR violations. See Item 3.—Legal Proceedings in this Form 10-K for more detail with respect to environmental litigation and regulatory action, including an NOV issued by the EPA against IPL concerning NSR and prevention of significant deterioration issues under the CAA.
If NSR requirements are imposed on any of the power plants owned by the Company's subsidiaries, the results could have a material adverse impact on the Company's business, financial condition, and results of operations.
| 47 | 2020 Annual Report |
Regional Haze Rule — The EPA's "Regional Haze Rule" is intended to reduce haze and protect visibility in designated federal areas, and sets guidelines for determining the best available retrofit technology ("BART") at affected plants and how to demonstrate "reasonable progress" toward eliminating man-made haze by 2064. The Regional Haze Rule required states to consider five factors when establishing BART for sources, including the availability of emission controls, the cost of the controls, and the effect of reducing emission on visibility in Class I areas (including wilderness areas, national parks, and similar areas). The statute would require compliance within five years after the EPA approves the relevant SIP or issues a federal implementation plan, although individual states may impose more stringent compliance schedules. In September 2017, the EPA published a final rule affirming the continued validity of the EPA's previous determination allowing states to rely on the CSAPR to satisfy BART requirements. All of the Company’s facilities that are subject to BART comply by meeting the requirements of CSAPR.
The second phase of the Regional Haze Rule began in 2019. States must submit regional haze plans for this second implementation period in 2021 to demonstrate reasonable progress towards reducing visibility impairment in Class I areas. States may need to require additional emissions controls for visibility impairing pollutants, including on BART sources, during the second implementation period. We currently cannot predict the impact of this second implementation period, if any, on any of our Company’s U.S. subsidiaries.
NAAQS — Under the CAA, the EPA sets NAAQS for six principal pollutants considered harmful to public health and the environment, including ozone, particulate matter, NOX, and SO2, which result from coal combustion. Areas meeting the NAAQS are designated "attainment areas" while those that do not meet the NAAQS are considered "nonattainment areas." Each state must develop a plan to bring nonattainment areas into compliance with the NAAQS, which may include imposing operating limits on individual plants. The EPA is required to review NAAQS at five-year intervals.
Based on the current and potential future ambient air standards, certain of the states in which the Company's subsidiaries operate have determined or will be required to determine whether certain areas within such states meet the NAAQS. Some of these states may be required to modify their State Implementation Plans to detail how the states will attain or maintain their attainment status. As part of this process, it is possible that the applicable state environmental regulatory agency or the EPA may require reductions of emissions from our generating stations to reach attainment status for ozone, fine particulate matter, NOX, or SO2. The compliance costs of the Company's U.S. subsidiaries could be material.
Beginning January 1, 2017, IPL Petersburg has been required to meet reduced SO2 limits established in a final rule published by IDEM in 2015 in accordance with a new one-hour SO2 NAAQS of 75 parts per billion. Improvements to the existing flue gas desulfurization systems at IPL’s Petersburg station were required to meet the emission limits imposed by the rule. The IURC approved IPL’s request for NAAQS SO2 compliance at its Petersburg generation station with 80% of qualifying costs recovered through a rate adjustment mechanism and the remainder recorded as a regulatory asset for recovery in a subsequent rate case. The approved capital cost of the NAAQS SO2 compliance plan is approximately $29 million. On August 17, 2020, the EPA approved the reduced SO2 limits as part of a revised Indiana State Implementation Plan concluding that Indiana has appropriately demonstrated that the plan provides for attainment of the 2010 SO2 NAAQS.
Greenhouse Gas Emissions — In January 2011, the EPA began regulating GHG emissions from certain stationary sources, including a pre-construction permitting program for certain new construction or major modifications, known as the PSD. If future modifications to our U.S.-based businesses' sources become subject to PSD for other pollutants, it may trigger GHG BACT requirements and the cost of compliance with such requirements may be material.
On October 23, 2015, the EPA's rule establishing NSPS for new electric generating units became effective, establishing CO2 emissions standards for newly constructed coal-fueled electric generating plants, which reflects the partial capture and storage of CO2 emissions from the plants. The EPA also promulgated NSPS applicable to modified and reconstructed electric generating units, which will serve as a floor for future BACT determinations for such units. The NSPS could have an impact on the Company's plans to construct and/or modify or reconstruct electric generating units in some locations. On December 20, 2018, the EPA published proposed revisions to the final NSPS for new, modified, and reconstructed coal-fired electric utility steam generating units proposing that the best system of emissions reduction for these units is highly efficient generation that would be equivalent to supercritical steam conditions for larger units and sub-critical steam conditions for smaller units, and not partial carbon capture and sequestration, as was finalized in the 2015 final NSPS. The EPA did not include revisions for natural-gas combined cycle or simple cycle units in the December 20, 2018 proposal. Challenges to the GHG NSPS
| 48 | 2020 Annual Report |
are being held in abeyance at this time.
On August 31, 2018, the EPA published in the Federal Register proposed Emission Guidelines for Greenhouse Gas Emissions from Existing Electric Utility Generating Units, known as the Affordable Clean Energy (ACE) Rule. On July 8, 2019, the EPA published the final ACE Rule along with associated revisions to implementing regulations. The final ACE Rule established CO2 emission rules for existing power plants under CAA Section 111(d) and replaced the EPA's 2015 Clean Power Plan Rule (CPP). In accordance with the ACE Rule, the EPA determined that heat rate improvement measures are the best system of emissions reductions for existing coal-fired electric generating units. The final rule requires states, including Indiana and Maryland, develop a State Plan to establish CO2 emission limits for designated facilities, including IPL Petersburg's and AES Warrior Run's coal-fired electric generating units. States have three years to develop their plans under the rule. On February 19, 2020, Indiana published a First Notice for the Indiana ACE Rule indicating that IDEM intends to determine the best system of emissions reductions and CO2 standards for affected units. Impacts remain largely uncertain because Indiana's State Plan has not yet been developed. On January 19, 2021, the D.C. Circuit vacated and remanded to the EPA the ACE Rule, although the parties have an opportunity to request a rehearing at the D.C. Circuit or seek a review of the decision by the U.S. Supreme Court. The impact of this decision remains uncertain.
On November 4, 2020, the U.S. withdrawal from the Paris Agreement became effective. However, on January 20, 2021, President Biden signed and submitted an instrument for the U.S. to rejoin the Paris Agreement effective February 19, 2021. As such, there is some uncertainty with respect to the impact of GHG rules on IPL. The GHG BACT requirements will not apply at least until we construct a new major source or make a major modification of an existing major source, and the NSPS will not require us to comply with an emissions standard until we construct a new electric generating unit. We do not have any planned major modifications of an existing source or plans to construct a new major source at this time which are expected to be subject to these regulations. Furthermore, the EPA, states, and other utilities are still evaluating potential impacts of the GHG regulations in our industry. In light of these uncertainties, we cannot predict the impact of the EPA’s current and future GHG regulations on our consolidated results of operations, cash flows, and financial condition, but it could be material.
Due to the future uncertainty of these regulations and associated litigation, we cannot at this time determine the impact on our operations or consolidated financial results, but we believe the cost to comply with the ACE Rule, should it be upheld and implemented in its current or a substantially similar form, could be material. The GHG NSPS remains in effect at this time, and, absent further action from the EPA that rescinds or substantively revises the NSPS, it could impact any Company plans to construct and/or modify or reconstruct electric generating units in some locations, which may have a material impact on our business, financial condition, or results of operations.
Cooling Water Intake — The Company's facilities are subject to a variety of rules governing water use and discharge. In particular, the Company's U.S. facilities are subject to the CWA Section 316(b) rule issued by the EPA that seeks to protect fish and other aquatic organisms by requiring existing steam electric generating facilities to utilize the best technology available ("BTA") for cooling water intake structures. On August 15, 2014, the EPA published its final standards based on CWA Section 316(b) which require certain subject facilities to choose among seven BTA options to reduce fish impingement. In addition, certain facilities must conduct studies to assist permitting authorities to determine whether and what site-specific controls, if any, are required to reduce entrainment of aquatic organisms. It is possible that this decision-making process, which includes permitting and public input, could result in the need to install closed-cycle cooling systems (closed-cycle cooling towers), or other technology. Finally, the standards require that new units added to an existing facility to increase generation capacity are required to reduce both impingement and entrainment. It is not yet possible to predict the total impacts of this final rule at this time, including any challenges to such final rule and the outcome of any such challenges. However, if additional capital expenditures are necessary, they could be material.
AES Southland's current plan is to comply with the SWRCB OTC Policy by shutting down and permanently retiring all existing generating units at AES Alamitos, AES Huntington Beach, and AES Redondo Beach that utilize OTC by the compliance dates included in the OTC Policy. New air-cooled combined cycle gas turbine generators and battery energy storage systems will be constructed at the AES Alamitos and AES Huntington Beach generating stations, and there is currently no plan to replace the OTC generating units at the AES Redondo Beach generating station. The execution of the implementation plan for compliance with the SWRCB's OTC Policy is entirely dependent on the Company's ability to execute on long-term PPAs to support project financing of the replacement generating units at AES Alamitos and AES Huntington Beach. The SWRCB reviews the implementation plan and latest information on OTC generating unit retirement dates and new generation availability to evaluate the impact on electrical system reliability and OTC compliance dates for specific units.
| 49 | 2020 Annual Report |
The Company’s California subsidiaries have signed 20-year term PPAs with Southern California Edison for the new generating capacity, which have been approved by the California Public Utilities Commission. Construction of new generating capacity began in June 2017 at AES Huntington Beach and July 2017 at AES Alamitos. The new air-cooled combined cycle gas turbine generators were constructed at the AES Alamitos and AES Huntington Beach generating stations. Certain OTC units were required to be retired in 2019 to provide interconnection capacity and/or emissions credits prior to startup of the new generating units, and the remaining AES OTC generating units in California will be shutdown and permanently retired by the OTC Policy compliance dates for these units. On January 23, 2020, the Statewide Advisory Committee on Cooling Water Intake Structures adopted a recommendation to present to the SWRCB to extend the OTC compliance dates for AES Huntington Beach and AES Alamitos until December 31, 2023 and AES Redondo Beach until December 31, 2021. On September 1, 2020, in response to a request by the state’s energy, utility, and grid operators and regulators, the SWRCB approved amendments to its OTC Policy. The SWRCB OTC Policy previously required the shutdown and permanent retirement of all remaining OTC generating units at AES Alamitos, AES Huntington Beach, and AES Redondo Beach by December 31, 2020. The amendment extends the deadline for shutdown and retirement of AES Alamitos and AES Huntington Beach’s remaining OTC generating units to December 31, 2023 and extends the deadline for shutdown and retirement of AES Redondo Beach’s remaining OTC generating units to December 31, 2021 (the “AES Redondo Beach Extension”). In October 2020, the cities of Redondo Beach and Hermosa Beach filed a state court lawsuit challenging the AES Redondo Beach Extension. The outcome of the lawsuit is unclear. The respective facilities’ NPDES permits have been revised to allow the remaining OTC generating units at AES Alamitos, AES Huntington Beach, and AES Redondo Beach to continue operation beyond December 31, 2020 and in accordance with the amended OTC Policy.
Power plants are required to comply with the more stringent of state or federal requirements. At present, the California state requirements are more stringent and have earlier compliance dates than the federal EPA requirements, and are therefore applicable to the Company's California assets.
Challenges to the federal EPA's rule were filed and consolidated in the U.S. Court of Appeals for the Second Circuit, although implementation of the rule was not stayed while the challenges proceeded. On July 23, 2018, the U.S. Court of Appeals for the Second Circuit upheld the rule. The Second Circuit later denied a petition by environmental groups for rehearing. The Company anticipates that compliance with CWA Section 316(b) regulations and associated costs could have a material impact on our consolidated financial condition or results of operations.
Water Discharges — On June 29, 2015, the EPA and the U.S. Army Corps of Engineers ("the agencies") published a final rule defining federal jurisdiction over waters of the U.S. This rule, which initially became effective on August 28, 2015, could expand or otherwise change the number and types of waters or features subject to federal permitting. However, the agencies engaged in a two-step process to repeal the 2015 "Waters of the U.S." rule and replace it with a newly promulgated rule called the "Navigable Waters Protection" rule. The agencies completed the first step on October 22, 2019 by publishing the final rule repealing the 2015 “Waters of the U.S.” rule. In step two, the agencies issued a revised definition of waters of the U.S. on December 11, 2018 and released the prepublication version of the final "Navigable Waters Protection" rule on April 21, 2020. It is too early to determine whether the newly promulgated "Navigable Waters Protection" rule may have a material impact on our business, financial condition, or results of operations.
Certain of the Company's U.S.-based businesses are subject to NPDES permits that regulate specific industrial waste water and storm water discharges to the waters of the U.S. under the CWA. On August 28, 2012, the IDEM issued NPDES permits that set new water quality-based effluent discharge limits for the IPL Harding Street and Petersburg facilities with full compliance ultimately required by September 29, 2017. The deadline for Petersburg to commission a portion of the treatment system was subsequently extended to April 11, 2018.
On November 3, 2015, the EPA published its final ELG rule to reduce toxic pollutants discharged into waters of the U.S. by steam-electric power plants through technology applications. These effluent limitations for existing and new sources include dry handling of fly ash, closed-loop or dry handling of bottom ash and more stringent effluent limitations for flue gas desulfurization wastewater. The required compliance timelines for existing sources was to be established between November 1, 2018 and December 31, 2023. On September 18, 2017, the EPA published a final rule delaying certain compliance dates of the ELG rule for two years while it administratively reconsiders the rule. IPL Petersburg has installed a dry bottom ash handling system in response to the CCR rule and wastewater treatment systems in response to the NPDES permits in advance of the ELG compliance date. Other U.S. businesses already include dry handling of fly ash and bottom ash and do not generate flue gas desulfurization wastewater. On April 12, 2019, the U.S. Court of Appeals for the Fifth Circuit vacated and remanded portions of the
| 50 | 2020 Annual Report |
EPA's 2015 ELG Rule related to legacy wastewaters and combustions residual leachate. On October 13, 2020, the EPA published final revisions to the 2015 ELG Rule related to flue gas desulfurization wastewater and bottom ash transport water, but did not address the portions of the ELG rule that were remanded by the U.S. Court of Appeals for the Fifth Circuit. Petitions have been filed for judicial review of the final revisions. It is too early to determine whether the outcome of the decision or current or future revisions to the ELG rule might have a material impact on our business, financial condition, and results of operations.
On April 23, 2020, the U.S. Supreme Court issued a decision in the Hawaii Wildlife Fund v. County of Maui case related to whether a CWA permit is required when pollutants originate from a point source but are conveyed to navigable waters through a nonpoint source, such as groundwater. The Court held that discharges to groundwater require a permit if the addition of the pollutants through groundwater is the functional equivalent of a direct discharge from the point source into navigable waters. On December 10, 2020, the EPA published a Notice of Availability of draft guidance memorandum addressing how the Supreme Court’s decision applies to NPDES permits. We are reviewing this decision and the EPA's draft guidance and it is too early to determine whether this decision may have a material impact on our business, financial condition, or results of operations.
Selenium Rule — In June 2016, the EPA published the final national chronic aquatic life criterion for the pollutant selenium in fresh water. NPDES permits may be updated to include selenium water quality-based effluent limits based on a site-specific evaluation process, which includes determining if there is a reasonable potential to exceed the revised final selenium water quality standards for the specific receiving water body utilizing actual and/or project discharge information for the generating facilities. As a result, it is not yet possible to predict the total impacts of this final rule at this time, including any challenges to such final rule and the outcome of any such challenges. However, if additional capital expenditures are necessary, they could be material. IPL would seek recovery of these capital expenditures; however, there is no guarantee it would be successful in this regard.
Waste Management — On October 19, 2015, an EPA rule regulating CCR under the Resource Conservation and Recovery Act as nonhazardous solid waste became effective. The rule established nationally applicable minimum criteria for the disposal of CCR in new and currently operating landfills and surface impoundments, including location restrictions, design and operating criteria, groundwater monitoring, corrective action and closure requirements, and post-closure care. The primary enforcement mechanisms under this regulation would be actions commenced by the states and private lawsuits. On December 16, 2016, the Water Infrastructure Improvements for the Nation Act ("WIN Act") was signed into law. This includes provisions to implement the CCR rule through a state permitting program, or if the state chooses not to participate, a possible federal permit program. If this rule is finalized before Indiana or Puerto Rico establishes a state-level CCR permit program, AES CCR units in those locations could eventually be required to apply for a federal CCR permit from EPA. The EPA has indicated that it will implement a phased approach to amending the CCR Rule. On November 12, 2020, the EPA published its final Part B Rule, and indicated that it would address the issue of beneficial use of CCR for closure of ash ponds that are subject to forced closure in a separate and future rulemaking. This future rulemaking could impact IPL Petersburg plant’s ability to use CCR for closure of ash ponds. On August 28, 2020, the EPA published final amendments to the CCR Rule titled "A Holistic Approach to Closure Part A: Deadline to Initiate Closure," which amends certain regulatory provisions that govern CCR.
The CCR rule, current or proposed amendments to the CCR rule, the results of groundwater monitoring data, or the outcome of CCR-related litigation could have a material impact on our business, financial condition, and results of operations. IPL would seek recovery of any resulting expenditures; however, there is no guarantee we would be successful in this regard.
On January 2, 2020, Puerto Rico Senate Bill 1221 was signed by the Puerto Rico Governor into law and became effective as Act 5-2020. Act 5-2020 prohibits the disposal and unencapsulated beneficial use of CCR, places restrictions on storage of CCR in Puerto Rico, and requires the Puerto Rico Department of Natural and Environmental Resources to develop implementation regulations. As such, it is not yet possible to determine whether this might have a material impact on our business, financial condition, and results of operations.
Comprehensive Environmental Response, Compensation and Liability Act of 1980 — This act, also known as "Superfund," may be the source of claims against certain of the Company's U.S. subsidiaries from time to time. There is ongoing litigation at a site known as the South Dayton Landfill where a group of companies already recognized as potentially responsible parties ("PRPs") have sued DP&L and other unrelated entities seeking a contribution toward the costs of assessment and remediation. DP&L is actively opposing such claims. In 2003, DP&L received notice that the EPA considers DP&L to be a PRP at the Tremont City landfill Superfund site. The EPA has taken no further action with respect to DP&L since 2003 regarding the Tremont City landfill. On October 16,
| 51 | 2020 Annual Report |
2019, DP&L received a special notice that the EPA considers DP&L, along with other parties, to be a PRP for the clean-up of hazardous substances at a third-party landfill known as the Tremont City Barrel Site, located near Dayton, Ohio. The Company is unable to determine whether there will be any liability, or the size of any liability that may ultimately be assessed against DP&L at these three sites, but any such liability could be material to DP&L.
Biden Administration Actions Affecting Environmental Regulations — On January 20, 2021, President Biden issued an Executive Order ("EO") titled “Protecting Public Health and the Environment and Restoring Science to Tackle the Climate Crisis” directing agencies to, among other tasks, review regulations issued under the prior Administration to determine whether they should be suspended, revoked, or revised. As provided for by the EO, the EPA submitted a letter to the DOJ seeking to obtain abeyances or stays of proceedings in pending litigation that seeks review of regulations promulgated during the Trump Administration. The Biden Administration also issued a Memorandum titled “Regulatory Freeze Pending Review” directing agencies to refrain from proposing or issuing any rules until the Biden Administration has reviewed and approved those rules. These actions may have an impact on regulations that may affect our business, financial condition, or results of operations.
International Environmental Regulations
For a discussion of the material environmental regulations applicable to the Company's businesses located outside of the U.S., see Environmental Regulation under the discussion of the various countries in which the Company's subsidiaries operate in Item 1.—Business, under the applicable SBUs.
Customers
We sell to a wide variety of customers. No individual customer accounted for 10% or more of our 2020 total revenue. In our generation business, we own and/or operate power plants to generate and sell power to wholesale customers such as utilities and other intermediaries. Our utilities sell to end-user customers in the residential, commercial, industrial, and governmental sectors in a defined service area.
Human Capital Management
At AES, our people are instrumental to helping us meet the world’s energy needs. Supporting our people is a foundational value for AES. All of our actions are grounded in the shared values that shape AES’ culture: Safety First, Highest Standards, and All Together. The AES Corporation is led and managed by our Chief Executive Officer and the Executive Leadership Team with the guidance and oversight of our Board of Directors.
As of December 31, 2020, the Company and its subsidiaries had approximately 8,200 full time/permanent employees. The following chart lists our full time/permanent employees by SBU:
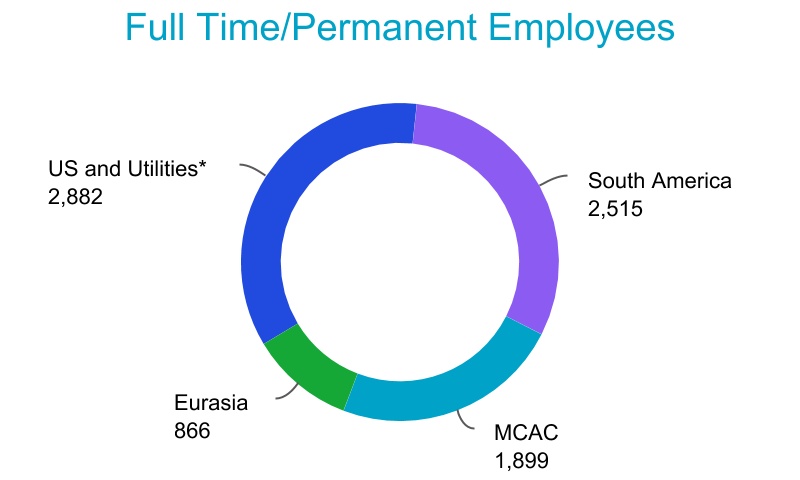
- On January 4, 2021, the merger of sPower as part of AES Clean Energy was completed and approximately 200 additional full time/permanent employees joined AES Clean Energy as part of the US and Utilities SBU.
As of December 31, 2020, approximately 45% of our U.S. employees were subject to collective bargaining agreements. Collective bargaining agreements between us and these labor unions expire at various dates ranging from 2021 to 2023. In addition, certain employees in non-U.S. locations were subject to collective bargaining
| 52 | 2020 Annual Report |
agreements, representing approximately 65% of the non-U.S. workforce. Management believes that the Company's employee relations are favorable.
Safety
At AES, safety is one of our core values. Conducting safe operations at our facilities around the world, so that each person can return home safely, is the cornerstone of our daily activities and decisions. Safety efforts are led by our Chief Operating Officer and supported by safety committees that operate at the local site level. Hazards in the workplace are actively identified and management tracks incidents so remedial actions can be taken to improve workplace safety.
AES has established a Safety Management System (“SMS”) Global Safety Standard that applies to all AES employees, as well as contractors working in AES facilities and construction projects. The SMS requires continuous safety performance monitoring, risk assessment, and performance of periodic integrated environmental, health, and safety audits. The SMS provides a consistent framework for all AES operational businesses and construction projects to set expectations for risk identification and reduction, measure performance, and drive continuous improvements. The SMS standard is consistent with the OHSAS 18001/ISO 45001 standard, and during 2020 approximately 62% of our locations have elected to formally certify their SMS to the OHSAS 18001/ISO 45001 international standard. AES calculates lost time incident (“LTI”) rates for our employees and contractors based on OSHA standards, based on 200,000 labor hours, which equates to 100 workers who work 40 hours per week and 50 weeks per year. In 2020, there was a 37% decrease in LTI cases. In 2020, AES’ LTI Rate was 0.084 for AES People, 0.046 for operational contractors, and 0.069 for construction contractors. In 2020, the Company had one work-related fatality.
In response to the COVID-19 pandemic, we implemented significant changes that we determined were in the best interest of our employees, as well as the communities in which we operate. This includes having employees work from home to the extent they were able, while implementing additional safety measures for employees continuing critical on-site work.
Talent
We believe AES’ success depends on its ability to attract, develop, and retain key personnel. The skills, experience, and industry knowledge of key employees significantly benefit our operations and performance. We have a comprehensive approach to managing our talent and developing our leaders in order to ensure our people have the right skills for today and tomorrow, whether that requires us to build new business models or leverage leading technologies.
We emphasize employee development and training. To empower employees, we provide a range of development programs and opportunities, skills, and resources they need to be successful by focusing on experience and exposure, as well as formal programs including our ACE Academy for Talent Development and our Trainee Program.
At AES, we believe that our individual differences make us stronger. Our Diversity and Inclusion Program is led by our Diversity and Inclusion Officer. Governance and standards are guided by the Chief Human Resources Officer, with input from members of the Executive Leadership Team.
Compensation
AES’ executive compensation philosophy emphasizes pay-for-performance. Our incentive plans are designed to reward strong performance, with greater compensation paid when performance exceeds expectations and less compensation paid when performance falls below expectations. We invest significant time and resources to ensure our compensation programs are competitive and reward the performance of our people. Every year, AES people who are not part of a collective bargaining agreement are eligible for an annual merit-based salary increase. In addition, individuals are eligible for a salary increase if they receive a significant promotion. For non-collectively bargained employees at certain levels in the organization, we offer annual incentives (bonus) and long-term compensation to reinforce the alignment between AES' employees and AES.
| 53 | 2020 Annual Report |
Executive Officers
The following individuals are our executive officers:
Bernerd Da Santos*,* 57 years old, has served as Executive Vice President and Chief Operating Officer since December 2017. Previously, Mr. Da Santos held several positions at AES, including Chief Operating Officer and Senior Vice President from 2014 to 2017, Chief Financial Officer, Global Finance Operations from 2012 to 2014, Chief Financial Officer of Global Utilities from 2011 to 2012, Chief Financial Officer of Latin America and Africa from 2009 to 2011, Chief Financial Officer of Latin America from 2007 to 2009, Managing Director of Finance for Latin America from 2005 to 2007, and VP and Controller of La Electricidad de Caracas ("EDC") (Venezuela). Prior to joining AES in 2000, Mr. Da Santos held a number of financial leadership positions at EDC. Mr. Da Santos is a member of the boards of AES Gener, Companhia Brasiliana de Energia, AES Tietê Energia, Compañia de Alumbrado Electrico de San Salvador, Empresa Electrica de Oriente, Compañia de Alumbrado Electrico de Santa Ana, Indianapolis Power & Light, IPALCO, AES Distributed Energy, and AES Mong Duong Power Company Limited. Mr. Da Santos holds a bachelor's degree with Cum Laude distinction in Business Administration and Public Administration from Universidad José Maria Vargas, a bachelor's degree with Cum Laude distinction in Business Management and Finance, and an MBA with Cum Laude distinction from Universidad José Maria Vargas.
Paul L. Freedman, 50 years old, has served as Executive Vice President, General Counsel and Corporate Secretary since February 2021. Prior to assuming his current position, Mr. Freedman was Senior Vice President and General Counsel from February 2018, Corporate Secretary from October 2018, Chief of Staff to the Chief Executive Officer from April 2016 to February 2018, Assistant General Counsel from 2014 to 2016, General Counsel, North America Generation, from 2011 to 2014, Senior Corporate Counsel from 2010 to 2011, and Counsel 2007 to 2010. Mr. Freedman is a member of the Boards of IPALCO, AES U.S. Investments, DP&L, the Business Council for International Understanding, and the Coalition for Integrity. Prior to joining AES, Mr. Freedman was Chief Counsel for credit programs at the U.S. Agency for International Development and he previously worked as an associate at the law firms of White & Case and Freshfields. Mr. Freedman received a B.A. from Columbia University and a J.D. from the Georgetown University Law Center.
Andrés R. Gluski*,* 63 years old, has been President, Chief Executive Officer and a member of our Board of Directors since September 2011 and is a member of the Innovation and Technology Committee. Prior to assuming his current position, Mr. Gluski served as Executive Vice President and Chief Operating Officer of the Company since March 2007. Prior to becoming the Chief Operating Officer of AES, Mr. Gluski was Executive Vice President and the Regional President of Latin America from 2006 to 2007. Mr. Gluski was Senior Vice President for the Caribbean and Central America from 2003 to 2006, Chief Executive Officer of EDC from 2002 to 2003 and Chief Executive Officer of AES Gener (Chile) in 2001. Prior to joining AES in 2000, Mr. Gluski was Executive Vice President and Chief Financial Officer of EDC, Executive Vice President of Banco de Venezuela (Grupo Santander), Vice President for Santander Investment, and Executive Vice President and Chief Financial Officer of CANTV (subsidiary of GTE). Mr. Gluski has also worked with the International Monetary Fund in the Treasury and Latin American Departments and served as Director General of the Ministry of Finance of Venezuela. From 2013 to 2016, Mr. Gluski served on President Obama's Export Council. Mr. Gluski is a member of the Board of Waste Management and Fluence. Mr. Gluski is also Chairman of the Americas Society/Council of the Americas. Mr. Gluski is a magna cum laude graduate of Wake Forest University and holds an M.A. and a Ph.D. in Economics from the University of Virginia.
Lisa Krueger, 57 years old, has served as Executive Vice President and President, US and Utilities SBU since February 2021. Prior to assuming her current position, Ms. Krueger was Senior Vice President and President of the US and Utilities SBU from September 2018. Prior to joining AES, Ms. Krueger served as an energy consultant from July 2017 to August 2018, Chief Commercial Officer of Cogentrix Energy Power Management, LLC, the portfolio management company of Carlyle Power Partners, from January 2017 to June 2017, and President and Chief Executive Officer of Essential Power, LLC from March 2014 to June 2017. Ms. Krueger also served as Vice President, Sustainable Development of First Solar, one of the world’s largest photovoltaic manufacturers and system integrators, where she led the development and implementation of various domestic and internal strategic plans focused on market and business development and served as the President of First Solar Electric. Prior to First Solar, Ms. Krueger held a variety of executive level positions with Dynegy, Inc., including Vice President, Enterprise Risk Control, Vice President, Northeast Commercial Operations, Vice President, Origination and Retail Operations, and Vice President, Environmental, Health & Safety. Ms. Krueger is the Executive Chair of the Boards of IPALCO, Indianapolis Power & Light and Dayton Power & Light and Chair of the Board of AES Southland Energy, AES Clean Energy and AES U.S. Investments. She also held a variety of leadership roles at Illinois Power, including positions
| 54 | 2020 Annual Report |
in transmission planning and system operations, generation planning and system operations, and environmental, health & safety. Ms. Krueger has a Bachelor of Science degree in Chemical Engineering from the Missouri University of Science and Technology and an MBA from the Jones Graduate School of Business at Rice University.
Tish Mendoza, 45 years old, has served as Executive Vice President and Chief Human Resources Officer since February 2021. Prior to assuming her current position, Ms. Mendoza was Senior Vice President, Global Human Resources and Internal Communications and Chief Human Resources Officer from 2015, Vice President of Human Resources, Global Utilities from 2011 to 2012 and Vice President of Global Compensation, Benefits and HRIS, including Executive Compensation, from 2008 to 2011, and acted in the same capacity as the Director of the function from 2006 to 2008. Ms. Mendoza is a member of the boards of AES Chivor S.A., DP&L, AES Distributed Energy, and Uplight and sits on AES' compensation and benefits committees. Prior to joining AES, Ms. Mendoza was Vice President of Human Resources for a product company in the Treasury Services division of JP Morgan Chase and Vice President of Human Resources and Compensation and Benefits at Vastera, Inc, a former technology and managed services company. Ms. Mendoza earned certificates in Leadership and Human Resource Management, and a bachelor's degree in Business Administration and Human Resources.
Gustavo Pimenta, 42 years old, has served as Executive Vice President and Chief Financial Officer since January 2019. Prior to assuming his current position, Mr. Pimenta served as Deputy Chief Financial Officer from February 2018 to December 2018, Chief Financial Officer for the MCAC SBU from December 2014 to February 2018 and as Chief Financial Officer of AES Brazil from 2013 to December 2014. Prior to joining AES in 2009, Mr. Pimenta held various positions at Citigroup, including Vice President of Strategy and M&A in London and New York City. Mr. Pimenta is a member of the boards of J.M. Huber Corporation, IPALCO, AES Gener, AES Clean Energy, and AES U.S. Investments. Mr. Pimenta received a Bachelor’s degree in Economics from Universidade Federal de Minas Gerais and a Master’s degree in Economics and Finance from Fundação Getulio Vargas. He also participated in development programs in Finance, Strategy and Risk Management at New York University, University of Virginia’s Darden School of Business and Georgetown University.
How to Contact AES and Sources of Other Information
Our principal offices are located at 4300 Wilson Boulevard, Arlington, Virginia 22203. Our telephone number is (703) 522-1315. Our website address is http://www.aes.com. Our annual reports on Form 10-K, quarterly reports on Form 10-Q and current reports on Form 8-K and any amendments to such reports filed pursuant to Section 13(a) or Section 15(d) of the Securities Exchange Act of 1934 (the "Exchange Act") are posted on our website. After the reports are filed with, or furnished to the SEC, they are available from us free of charge. Material contained on our website is not part of and is not incorporated by reference in this Form 10-K. The SEC maintains an internet website that contains the reports, proxy and information statements and other information that we file electronically with the SEC at www.sec.gov.
Our CEO and our CFO have provided certifications to the SEC as required by Section 302 of the Sarbanes-Oxley Act of 2002. These certifications are included as exhibits to this Annual Report on Form 10-K.
Our CEO provided a certification pursuant to Section 303A of the New York Stock Exchange Listed Company Manual on May 4, 2020.
Our Code of Business Conduct ("Code of Conduct") and Corporate Governance Guidelines have been adopted by our Board of Directors. The Code of Conduct is intended to govern, as a requirement of employment, the actions of everyone who works at AES, including employees of our subsidiaries and affiliates. Our Ethics and Compliance Department provides training, information, and certification programs for AES employees related to the Code of Conduct. The Ethics and Compliance Department also has programs in place to prevent and detect criminal conduct, promote an organizational culture that encourages ethical behavior and a commitment to compliance with the law, and to monitor and enforce AES policies on corruption, bribery, money laundering and associations with terrorists groups. The Code of Conduct and the Corporate Governance Guidelines are located in their entirety on our website. Any person may obtain a copy of the Code of Conduct or the Corporate Governance Guidelines without charge by making a written request to: Corporate Secretary, The AES Corporation, 4300 Wilson Boulevard, Arlington, VA 22203. If any amendments to, or waivers from, the Code of Conduct or the Corporate Governance Guidelines are made, we will disclose such amendments or waivers on our website.
Previous: Cover and table of contents · Next: Item 1A. RISK FACTORS