 filings.tools
Item 5. MARKET FOR REGISTRANT'S COMMON EQUITY, RELATED STOCKHOLDER MATTERS AND ISSUER
5K characters. Original on sec.gov ·
Item 5. MARKET FOR REGISTRANT'S COMMON EQUITY, RELATED STOCKHOLDER MATTERS AND ISSUER
PURCHASES OF EQUITY SECURITIES
Market Information
Aflac Incorporated's common stock is principally traded on the New York Stock Exchange under the symbol AFL. Until the beginning of October 2019, Aflac Incorporated's stock was also listed on the Tokyo Stock Exchange under designator 8686.
Holders
As of February 12, 2020, there were 86,223 holders of record of the Company's common stock.
Stock Performance Graph
The following graph compares the five-year performance of the Company's common stock to the Standard & Poor's 500 Index (S&P 500) and the Standard & Poor's Life and Health Insurance Index (S&P Life and Health). The Standard & Poor's Life and Health Insurance Index includes: Aflac Incorporated, Globe Life Inc., Lincoln National Corporation, MetLife Inc., Principal Financial Group Inc., Prudential Financial Inc. and Unum Group.
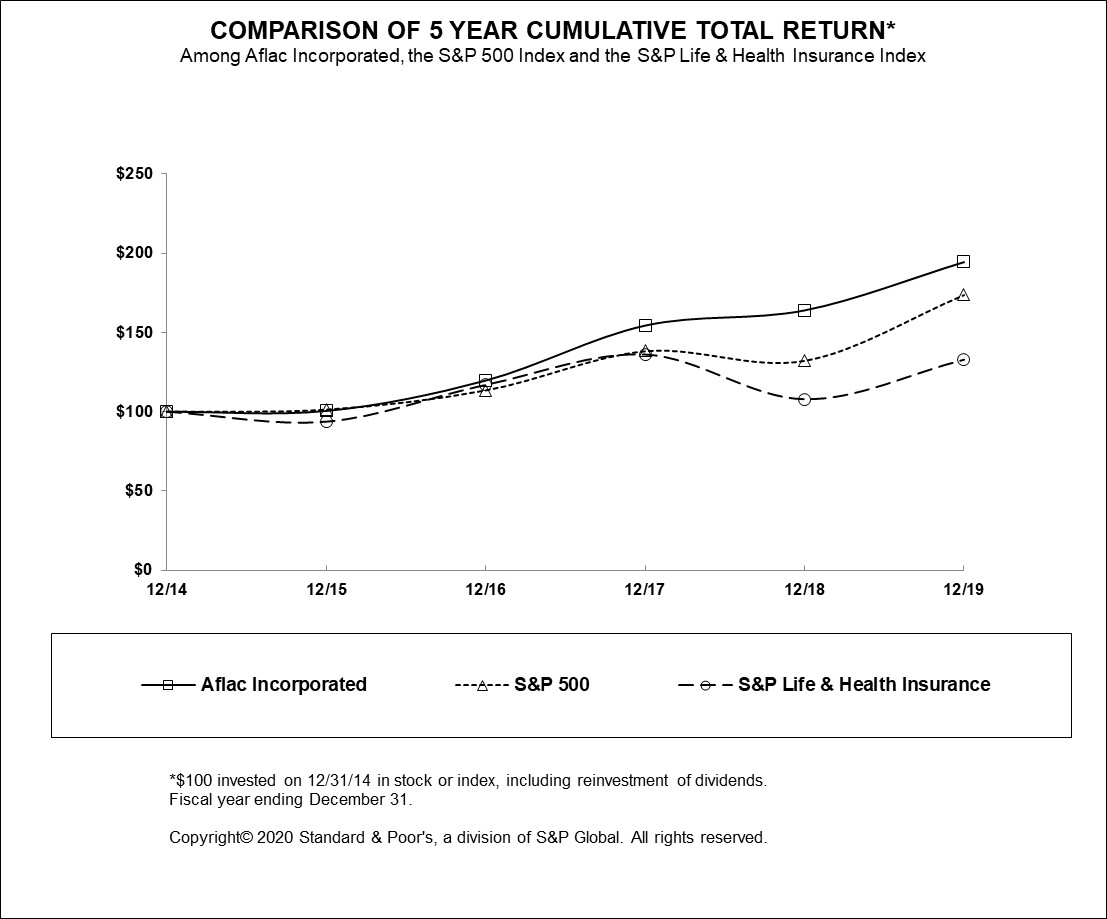
Performance Graphic Index
December 31,
| 2014 | 2015 | 2016 | 2017 | 2018 | 2019 | ||||||||||||
| Aflac Incorporated | 100.00 | 100.52 | 119.73 | 154.45 | 164.04 | 194.48 | |||||||||||
| S&P 500 | 100.00 | 101.38 | 113.51 | 138.29 | 132.23 | 173.86 | |||||||||||
| S&P Life & Health Insurance | 100.00 | 93.69 | 116.98 | 136.20 | 107.91 | 132.92 |
Copyright© 2020 Standard & Poor’s, a division of S&P Global. All rights reserved.
Issuer Purchases of Equity Securities
During the year ended December 31, 2019, the Company repurchased shares of Aflac common stock as follows:
| Period | Total Number of Shares Purchased | Average Price Paid Per Share | Total Number of Shares Purchased as Part of Publicly Announced Plans or Programs | Maximum Number of Shares that May Yet Be Purchased Under the Plans or Programs | |||||||||||||||||
| January 1 - January 31 | 4,465,400 | $ | 46.44 | 4,465,400 | 64,582,487 | ||||||||||||||||
| February 1 - February 28 | 4,170,417 | 48.65 | 3,624,583 | 60,957,904 | |||||||||||||||||
| March 1 - March 31 | 2,162,830 | 49.50 | 2,147,500 | 58,810,404 | |||||||||||||||||
| April 1 - April 30 | 2,177,000 | 49.21 | 2,177,000 | 56,633,404 | |||||||||||||||||
| May 1 - May 31 | 2,813,277 | 50.99 | 2,812,850 | 53,820,554 | |||||||||||||||||
| June 1 - June 30 | 1,964,259 | 54.44 | 1,952,000 | 51,868,554 | |||||||||||||||||
| July 1 - July 31 | 1,360,017 | 54.33 | 1,360,017 | 50,508,537 | |||||||||||||||||
| August 1 - August 31 | 2,491,225 | 51.22 | 2,483,400 | 48,025,137 | |||||||||||||||||
| September 1 - September 30 | 2,111,075 | 51.81 | 2,103,600 | 45,921,537 | |||||||||||||||||
| October 1 - October 31 | 2,476,152 | 52.43 | 2,476,100 | 43,445,437 | |||||||||||||||||
| November 1 - November 30 | 1,938,000 | 54.03 | 1,938,000 | 41,507,437 | |||||||||||||||||
| December 1 - December 31 | 4,456,463 | 52.92 | 4,453,824 | 37,053,613 | |||||||||||||||||
| Total | 32,586,115 | (1) | $ | 50.82 | 31,994,274 | 37,053,613 |
(1)During the year ended December 31, 2019, 591,841 shares were purchased in connection with income tax withholding obligations related to the vesting of restricted-share-based awards during the period.
As of December 31, 2019, a remaining balance of 37.1 million shares of the Company's common stock was available for purchase under share repurchase authorizations by its Board of Directors.
Previous: Item 4. MINE SAFETY DISCLOSURES · Next: Item 6. SELECTED FINANCIAL DATA