 filings.tools
Assurant 10-K 2016-12-31
Filed 2017-02-14. 22 sections, 712K characters. Original on sec.gov · Markdown · JSON
Cover and table of contents
10-K 1 aiz1231201610k.htm 10-K
UNITED STATES
SECURITIES AND EXCHANGE COMMISSION
WASHINGTON, DC 20549
| FORM 10-K |
| x | ANNUAL REPORT PURSUANT TO SECTION 13 OR 15(d) OF THE SECURITIES EXCHANGE ACT OF 1934 |
For the fiscal year ended December 31, 2016
OR
| ¨ | TRANSITION REPORT PURSUANT TO SECTION 13 OR 15(d) OF THE SECURITIES EXCHANGE ACT OF 1934 |
For the transition period from to
Commission file number 001-31978
| Assurant, Inc. (Exact name of registrant as specified in its charter) |
| Delaware | 39-1126612 | |
| (State or Other Jurisdiction of Incorporation or Organization) | (I.R.S. Employer Identification No.) | |
| 28 Liberty Street, 41st Floor New York, New York | 10005 | |
| (Address of Principal Executive Offices) | (Zip Code) |
Registrant’s telephone number, including area code:
(212) 859-7000
Securities registered pursuant to Section 12(b) of the Act:
| Title of Each Class | Name of Each Exchange on Which Registered | |
| Common Stock, $0.01 Par Value | New York Stock Exchange |
Securities registered pursuant to Section 12(g) of the Act:
None
Indicate by check mark if the registrant is a well-known seasoned issuer, as defined in Rule 405 of the Securities Act. Yes x No ¨
Indicate by check mark if the registrant is not required to file reports pursuant to Section 13 or Section 15(d) of the Act. Yes ¨ No x
Note – Checking the box above will not relieve any registrant required to file reports pursuant to Section 13 or 15(d) of the Exchange Act from their obligations under those Sections.
Indicate by check mark whether the registrant (1) has filed all reports required to be filed by Section 13 or 15(d) of the Securities Exchange Act of 1934 during the preceding 12 months (or for such shorter period that the registrant was required to file such reports), and (2) has been subject to such filing requirements for the past 90 days. Yes x No ¨
Indicate by check mark whether the registrant has submitted electronically and posted on its corporate Website, if any, every Interactive Data File required to be submitted and posted pursuant to Rule 405 of Regulation S-T (§ 232.405 of this chapter) during the preceding 12 months (or for such shorter period that the registrant was required to submit and post such files). Yes x No ¨
Indicate by check mark if disclosure of delinquent filers pursuant to Item 405 of Regulation S-K (§ 229.405 of this chapter) is not contained herein, and will not be contained, to the best of the registrant’s knowledge, in definitive proxy or information statements incorporated by reference in Part III of this Form 10-K or any amendment to this Form 10-K. x
Indicate by check mark whether the registrant is a large accelerated filer, an accelerated filer, a non-accelerated filer, or smaller reporting company. See the definitions of “large accelerated filer,” “accelerated filer” and “smaller reporting company” in Rule 12b-2 of the Exchange Act. (Check one):
| x | Large accelerated filer | ¨ | Accelerated filer | ¨ | Non-accelerated filer | ¨ | Smaller reporting company | ||||||
| (Do not check if a smaller reporting company) |
Indicate by check mark whether the registrant is a shell company (as defined in Rule 12b-2 of the Act). Yes ¨ No x
The aggregate market value of the Common Stock held by non-affiliates of the registrant was $5,196 million at June 30, 2016 based on the closing sale price of $86.31 per share for the common stock on such date as traded on the New York Stock Exchange.
The number of shares of the registrant’s Common Stock outstanding at February 9, 2017 was 55,636,312.
Documents Incorporated by Reference
Certain information contained in the definitive proxy statement for the annual meeting of stockholders to be held on May 11, 2017 (2017 Proxy Statement) is incorporated by reference into Part III hereof.
ASSURANT, INC.
ANNUAL REPORT ON FORM 10-K
For the Fiscal Year Ended December 31, 2016
TABLE OF CONTENTS
Amounts are presented in United States of America (“U.S.”) dollars and all amounts are in thousands, except for number of shares, per share amounts, registered holders, number of employees, beneficial owners, number of securities in an unrealized loss position and number of loans.
FORWARD-LOOKING STATEMENTS
Some statements under “Business,” “Management’s Discussion and Analysis of Financial Condition and Results of Operations” and elsewhere in this Annual Report on Form 10-K (this "Report"), particularly those anticipating future financial performance, business prospects, growth and operating strategies and similar matters, are forward-looking statements within the meaning of the U.S. Private Securities Litigation Reform Act of 1995. You can identify these statements by the use of words such as “will,” “may,” “anticipates,” “expects,” “estimates,” “projects,” “intends,” “plans,” “believes,” “targets,” “forecasts,” “potential,” “approximately,” or the negative version of those words and other words and terms with a similar meaning. Any forward-looking statements contained in this report are based upon our historical performance and on current plans, estimates and expectations. The inclusion of this forward looking information should not be regarded as a representation by us or any other person that the future plans, estimates or expectations contemplated by us will be achieved. Our actual results might differ materially from those projected in the forward-looking statements. Assurant, Inc. ("the Company" or "Assurant") undertakes no obligation to update or review any forward-looking statement, whether as a result of new information, future events or other developments. For a discussion of the risk factors that could affect our actual results, please refer to “Critical Factors Affecting Results” in Item 7 and “Risk Factors” in Item 1A of this Report.
PART I
Unless the context otherwise requires, references to the terms “Assurant,” the “Company,” “we,” “us” and “our” refer to our consolidated operations.
Item 1. Business
Assurant, Inc. was incorporated as a Delaware corporation in 2004.
Assurant is a global provider of risk management solutions in the housing and lifestyle markets, protecting where people live and the goods they buy. Assurant operates in North America, Latin America, Europe and Asia through three operating segments: Global Housing, Global Lifestyle, and Global Preneed. Assurant partners with clients who are leaders in their industries to provide consumers a diverse range of protection products and services. Through its Global Housing segment, Assurant provides lender-placed homeowners, manufactured housing and flood insurance; renters insurance and related products (also referred to as our “multi-family housing” business); and field services, valuation services and other property risk management services (also referred to as our “mortgage solutions” business). Through its Global Lifestyle segment, Assurant provides mobile device protection products and related services and extended service products and related services for consumer electronics and appliances (also referred to as our “global connected living” business); vehicle protection services; and credit insurance. Global Preneed provides pre-funded funeral insurance and annuity products.
Our Competitive Strengths
Our financial strength and our core capabilities across our businesses create competitive advantages that we believe allow us to support our clients and our profitable growth over the long-term.
Our financial strength. We believe we have a strong balance sheet with a low leverage ratio. As of December 31, 2016, we had $29,709,128 in assets and our debt to total capital was 20.7%. In addition, our Global Housing, Global Lifestyle and Global Preneed segments generate significant amounts of cash flow, which provides us flexibility to make appropriate investments in strategic capabilities, as well as in partnerships with our clients.
Client and consumer insights support product innovation. During our long business tenure, we have developed a comprehensive understanding of our clients and the consumer markets we serve. We seek to leverage consumer insights, together with deep market knowledge and capabilities, to anticipate and identify the specific needs of our clients and consumers they serve. We intend to continue to capitalize on our client and consumer insights to introduce new and innovative products and services and to adapt those products and services to address emerging issues.
Value chain integration. We own or manage multiple pieces of the value chain, which enables us to create products and service offerings based on specific client needs and provide a more seamless experience for consumers. Offering end-to-end solutions allows us to adapt more quickly and efficiently to client and consumer needs. Visibility across the value chain helps us collect and share insights to improve the consumer experience and our offerings.
Our Strategy for Profitable Growth
Assurant’s vision is to be the premier provider of risk management solutions in our addressable markets within the housing and lifestyle markets globally. To achieve this vision, we are undergoing a multi-year transformation to position ourselves for long-term profitable growth by:
Growing our portfolio of market leading businesses. We leverage our competitive strengths to focus on niche businesses where we can maintain or reach market leading positions and achieve attractive returns. We periodically assess our business portfolio to ensure we align resources with the best opportunities within the housing and lifestyle markets and, currently, we have identified connected living, mortgage solutions and multi-family housing as key businesses targeted for growth. We are focused on growing our businesses by continuing to invest in niche capabilities, further expanding our offerings and diversifying our distribution channels.
Providing integrated risk management offerings. We are expanding our offerings beyond our risk-based businesses to fee-based services along the lifecycle of our core products. As we adapt our business portfolio to respond to client and consumer needs, our mix of business is shifting towards more fee-based capital-light service offerings. In 2016, fee-based, capital-light businesses accounted for $3,220,349, or 52%, of net earned premiums, fees and other income for Global Housing, Global Lifestyle and Global Preneed, compared to 50% in 2015. As we grow our integrated offerings, this business mix shift will diversify our revenue and earnings; and we expect it will also provide attractive returns over time.
Implementing a more agile and efficient operating model. The implementation of our global operating model, including a more integrated organizational structure across our global operations, should achieve efficiencies to support our profitable growth long-term. We are reorganizing our global business operating structure to increase competitive agility and deliver
superior customer experience and centralizing key support functions to reduce overall expenditures over time and benefit from economies of scale.
Deploying our capital strategically. We deploy capital to invest in and grow our businesses, repurchase shares and pay dividends. Our approach to mergers, acquisitions and other growth opportunities reflects our prudent and disciplined approach to managing our capital. We target new business and capabilities that complements or supports our business model, which is focused on expanding capabilities and distribution in targeted growth businesses globally.
2016 Highlights
Assurant made significant progress in executing its multi-year transformation in 2016. As part of its business portfolio realignment to focus on specialty housing and lifestyle protection products and services, the Company substantially exited the health insurance market and sold its employee benefits business to Sun Life Assurance Company of Canada ("Sun Life"), a subsidiary of Sun Life Financial Inc. See Note 4 and Note 5, respectively, to the Consolidated Financial Statements included elsewhere in this Report for more information. The Company also made select acquisitions within the housing and lifestyle markets in 2016 to broaden its capabilities and fee-based capital-light service offerings. In July 2016, the Company acquired American Title, Inc., a leader in title and valuation services for home equity lenders, and in March 2016, the Company acquired certain renewal rights to a National Flood Insurance Program block of business. In addition, in December 2016, the Company entered into a definitive agreement to purchase Green Tree Insurance Agency, Inc. which sells housing protection products, including voluntary homeowners and manufactured housing policies, and other insurance products. The transaction closed in February 2017.
In addition, the Company implemented a new global organizational structure for its business operations and key support functions and will continue to cascade those changes down the organization in 2017. We created a new Chief Operating Officer ("COO") role responsible for overseeing the operations of Assurant’s business lines worldwide. This evolving operating structure should improve coordination and execution across the global housing and lifestyle markets. We also implemented global organizational structures for human resources, communications, marketing, strategy and procurement. We created a Chief Technology Officer role to lead technology strategy and align IT with business objectives across our global enterprise and a Chief Risk Officer ("CRO") role to enhance and expand our global risk management framework. Within finance, our newly appointed Chief Financial Officer ("CFO") is leading the integration of the Company’s global finance and accounting organization, asset management and tax functions to more closely align with our operational and risk functions within our global operating model.
Seg
Showing the first 8K of 62K characters. Open the full section
Item 1A. Risk Factors
Certain factors may have a material adverse effect on our business, financial condition and results of operations and you should carefully consider them. It is not possible to predict or identify all such factors.
Risks Related to Our Company
Our revenues and profits may decline if we are unable to maintain relationships with significant clients, distributors and other parties important to the success of our business, or renew contracts with them on favorable terms, or if those parties face financial, reputational or regulatory issues.
The success of our business depends largely on our relationships and contractual arrangements with significant clients-including mortgage servicers, lenders, mobile device carriers, retailers, OEMs and others-and with agents and other parties. Many of these arrangements are exclusive and some rely on preferred provider or similar relationships. If our key clients, intermediaries or other parties terminate important business arrangements with us, or renew contracts on terms less favorable to us, our cash flows, results of operations and financial condition could be materially adversely affected. In addition, each of our Global Lifestyle, Global Housing and Global Preneed segments receives a substantial portion of its revenue from a few clients. A reduction in business with or the loss of one or more of our significant clients could have a material adverse effect on the results of operations and cash flows of individual segments or of the Company. Examples of important business arrangements include, at Global Lifestyle, relationships with mobile device carriers, retailers, OEMs and financial and other institutions through which we distribute our products and services. At Global Preneed, we have an exclusive distribution relationship with SCI relating to the distribution of our preneed insurance policies. At Global Housing, we have exclusive and non-exclusive relationships with certain mortgage lenders and manufactured housing lenders and property managers, and in turn we are eligible to insure properties securing loans guaranteed by or sold to government-sponsored entities and serviced by the mortgage loan servicers with whom we do business. In addition, the transfer by mortgage servicer clients of loan portfolios to other carriers or the participation by other carriers in insuring lender-placed insurance risks that we have historically insured could materially reduce our revenues and profits from this business.
We are also subject to the risk that clients, distributors and other parties may face financial difficulties, reputational issues, problems with respect to their own products and services or regulatory restrictions or compliance issues that may lead to a decrease in or cessation of sales of our products and services. Moreover, if one or more of our clients or distributors, for example in the wireless and related markets, consolidate or align themselves with other companies, we may lose significant business, resulting in material decreases in revenues and profits.
General economic, financial market and political conditions may materially adversely affect our results of operations and financial condition and conditions in the markets in which we operate may negatively affect the results of our business segments.
General economic, financial market and political disruptions could have a material adverse effect on our results of operations and financial condition. Limited availability of credit, deteriorations of the global mortgage and real estate markets, declines in consumer confidence and consumer spending, increases in prices or in the rate of inflation, periods of high unemployment, persistently low or rapidly increasing interest rates, or disruptive geopolitical events could contribute to increased volatility and diminished expectations for the economy and the financial markets, including the market for our stock. These conditions could also affect all of our business segments. Specifically, during periods of economic downturn:
| • | individuals and businesses may (i) choose not to purchase our insurance products, warranties and other products and services, (ii) terminate existing policies or contracts or permit them to lapse, and (iii) choose to reduce the amount of coverage they purchase; |
| • | clients are more likely to experience financial distress or declare bankruptcy or liquidation which could have an adverse impact on the remittance of premiums from such clients as well as the collection of receivables from such clients for items such as unearned premiums; |
| • | claims on certain specialized insurance products tend to rise; |
| • | there is a higher loss ratio on credit card and installment loan insurance due to rising unemployment and disability levels; |
| • | there is an increased risk of fraudulent insurance claims; and |
| • | substantial decreases in loan availability and origination could reduce the demand for credit insurance that we write or debt cancellation or debt deferment products that we administer, and on the placement of hazard insurance under our lender-placed insurance programs. |
General inflationary pressures may affect repair and replacement costs on our real and personal property lines, increasing the costs of paying claims. Inflationary pressures may also affect the costs associated with our preneed insurance policies, particularly those that are guaranteed to grow with the CPI. Conversely, deflationary pressures may affect the pricing of our products and services.
Additionally, continued uncertainty surrounding the U.S. Federal Reserve’s monetary policy and the new administration could adversely affect the U.S. and global economy.
Furthermore, conditions in the housing and lifestyle markets in which we operate, such as the wireless market, including the introduction of new products or technologies or promotional programs, electronics and appliances retail markets, automobile sales market, and the housing and mortgage markets may also have a material adverse effect on our business segments by impacting the demand and pricing for our products and services, the costs of paying claims or otherwise.
Our actual claims losses may exceed our reserves for claims, requiring us to establish additional reserves or to incur additional expense for settling unreserved liabilities, which could materially affect our results of operations, profitability and capital.
We maintain reserves to cover our estimated ultimate exposure for claims and claim adjustment expenses with respect to reported claims and incurred but not reported claims (“IBNR”) as of the end of each accounting period. Whether calculated under GAAP, Statutory Accounting Principles (“SAP”) or accounting principles applicable in foreign jurisdictions, reserves are estimates. Reserving is inherently a matter of judgment; our ultimate liabilities could exceed reserves for a variety of reasons, including changes in macroeconomic factors (such as unemployment and interest rates), case development and other factors. From time to time, we also adjust our reserves, and may adjust our reserving methodology, as these factors and our claims experience changes. Reserve development, changes in our reserving methodology and paid losses exceeding corresponding reserves could have a material adverse effect on our results of operations. Please see “Item 7 - Management’s Discussion & Analysis - Critical Accounting Policies & Estimates - Reserves” for additional detail on our reserves.
We may be unable to accurately predict and price for claims and other costs, which could reduce our profitability.
Our profitability could vary depending on our ability to predict and price for claims and other costs including, but not limited to, the frequency and severity of property claims. This ability could be
Showing the first 8K of 81K characters. Open the full section
Item 1B. Unresolved Staff Comments
None.
Item 2. Properties
We own eight properties, including three buildings whose locations serve as headquarters for our operating segments, two buildings that serve as operation centers for Global Housing and one building that serves as a claims training center for Global Housing. Global Lifestyle and Global Housing share headquarters buildings located in Miami, Florida and Atlanta, Georgia. Global Housing has operations centers located in Florence, South Carolina and Springfield, Ohio. Global Preneed has a headquarters building in Rapid City, South Dakota. We also own buildings in Kansas City, Missouri and Milwaukee, Wisconsin that used to be the headquarters of businesses sold or placed into runoff. We lease office space for various offices and service centers located throughout the U.S. and internationally, including our New York, New York corporate office and our data center in Woodbury, Minnesota. Our leases have terms ranging from month-to-month to twenty years. We believe that our owned and leased properties are adequate for our current business operations.
Item 3. Legal Proceedings
The Company is involved in litigation in the ordinary course of business, both as a defendant and as a plaintiff and may from time to time be subject to a variety of legal and regulatory actions relating to our current and past business operations, including regulatory examinations, investigations and inquiries. See Note 25 to the Consolidated Financial Statements for a description of certain matters, which description is incorporated herein by reference. Although the Company cannot predict the outcome of any litigation, regulatory examinations or investigations, it is possible that the outcome of such matters could have a material adverse effect on the Company’s consolidated results of operations or cash flows for an individual reporting period. However, based on currently available information, management does not believe that any pending matter is likely to have a material adverse effect, individually or in the aggregate, on the Company’s financial condition.
Item 4. Mine Safety Disclosures
Not applicable.
PART II
Item 5. Market for Registrant’s Common Equity, Related Stockholder Matters and Issuer Purchases of Equity Securities
Stock Performance Graph
The following chart compares the total stockholder returns (stock price increase plus dividends paid) on our common stock from December 31, 2011 through December 31, 2016 with the total stockholder returns for the S&P 400 MidCap Index and the S&P 500 Index, as the broad equity market indexes, and the S&P 400 Multi-line Insurance Index and the S&P 500 Multi-line Insurance Index, as the published industry indexes. The graph assumes that the value of the investment in the common stock and each index was $100 on December 31, 2011 and that all dividends were reinvested.
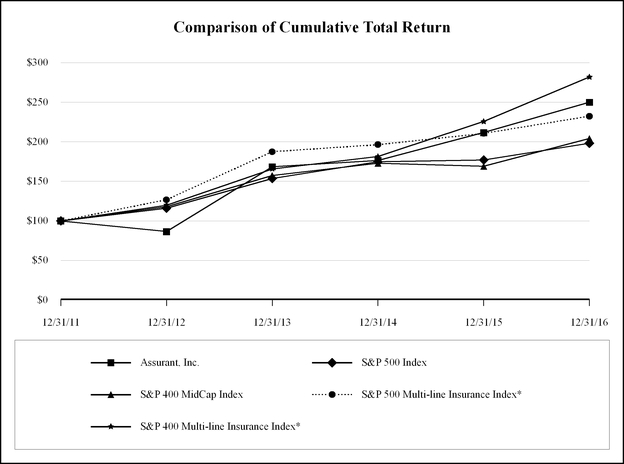
Total Values/Return to Stockholders
(Includes reinvestment of dividends)
| Base Period 12/31/11 | INDEXED VALUES Years Ending | ||||||||||||||||||||
| Company / Index | 12/31/12 | 12/31/13 | 12/31/14 | 12/31/15 | 12/31/16 | ||||||||||||||||
| Assurant, Inc. | $100 | $ | 86.44 | $ | 168.42 | $ | 176.42 | $ | 211.58 | $ | 249.97 | ||||||||||
| S&P 500 Index | 100 | 116.00 | 153.57 | 174.60 | 177.01 | 198.18 | |||||||||||||||
| S&P 400 MidCap Index | 100 | 117.88 | 157.37 | 172.74 | 168.98 | 204.03 | |||||||||||||||
| S&P 500 Multi-line Insurance Index* | 100 | 126.70 | 187.39 | 196.32 | 210.54 | 232.17 | |||||||||||||||
| S&P 400 Multi-line Insurance Index* | 100 | 119.90 | 165.71 | 181.24 | 225.59 | 281.75 | |||||||||||||||
| ANNUAL RETURN PERCENTAGE Years Ending | |||||||||||||||||||||
| Company / Index | 12/31/12 | 12/31/13 | 12/31/14 | 12/31/15 | 12/31/16 | ||||||||||||||||
| Assurant, Inc. | (13.56 | )% | 94.85 | % | 4.75 | % | 19.93 | % | 18.14 | % | |||||||||||
| S&P 500 Index | 16.00 | 32.39 | 13.69 | 1.38 | 11.96 | ||||||||||||||||
| S&P 400 MidCap Index | 17.88 | 33.50 | 9.77 | (2.18 | ) | 20.74 | |||||||||||||||
| S&P 500 Multi-line Insurance Index* | 26.70 | 47.90 | 4.77 | 7.24 | 10.27 | ||||||||||||||||
| S&P 400 Multi-line Insurance Index* | 19.90 | 38.21 | 9.37 | 24.47 | 24.90 |
| * | S&P 400 Multi-line Insurance Index is comprised of mid-cap companies, while the S&P 500 Multi-line Insurance Index is comprised of large-cap companies. |
Common Stock Price
Our common stock is listed on the NYSE under the symbol “AIZ.” The following table sets forth the high and low intraday sales prices per share of our common stock as reported by the NYSE and dividends per share of common stock declared by our Board of Directors for the periods indicated.
| Year Ended December 31, 2016 | High | Low | Dividends | ||||||||
| First Quarter | $ | 81.31 | $ | 66.23 | $ | 0.50 | |||||
| Second Quarter | $ | 88.67 | $ | 77.09 | $ | 0.50 | |||||
| Third Quarter | $ | 92.25 | $ | 83.01 | $ | 0.50 | |||||
| Fourth Quarter | $ | 93.74 | $ | 78.72 | $ | 0.53 | |||||
| Year Ended December 31, 2015 | High | Low | Dividends | ||||||||
| First Quarter | $ | 67.77 | $ | 60.22 | $ | 0.27 | |||||
| Second Quarter | $ | 68.87 | $ | 59.86 | $ | 0.30 | |||||
| Third Quarter | $ | 79.60 | $ | 68.14 | $ | 0.30 | |||||
| Fourth Quarter | $ | 86.81 | $ | 78.25 | $ | 0.50 |
Holders
On February 9, 2017, there were approximately 194 registered holders of record of our common stock. The closing price of our common stock on the NYSE on February 9, 2017 was $91.36.
Please see Item 12 of this Report for information about securities authorized for issuance under our equity compensation plans.
Shares Repurchased
| Period in 2016 | Total Number of Shares Purchased | Average Price Paid Per Share | Total Number of Shares Purchased as Part of Publicly Announced Programs (1) | Approximate Dollar Value of Shares that May Yet be Repurchased Under the Programs (1) | |||||||||
| January 1 – January 31 | 1,147,337 | $ | 78.44 | 1,147,337 | $ | 862,125 | |||||||
| February 1 – February 28 | 869,898 | 70.69 | 869,898 | 800,645 | |||||||||
| March 1 – March 31 | 1,405,025 | 76.12 | 1,405,025 | 693,717 | |||||||||
| Total first quarter | 3,422,260 | 75.52 | 3,422,260 | 693,717 | |||||||||
| April 1 – April 30 | 1,033,098 | 79.90 | 1,033,098 | 611,195 | |||||||||
| May 1 – May 31 | 845,869 | 87.01 | 845,869 | 537,609 | |||||||||
| June 1 – June 30 | 439,031 | 84.75 | 439,031 | 500,406 | |||||||||
| Total second quarter | 2,317,998 | 83.41 | 2,317,998 | 500,406 | |||||||||
| July 1 – July 31 | 485,725 | 86.61 | 485,725 | 458,345 | |||||||||
| August 1 – August 31 | 1,177,372 | 85.92 | 1,177,372 | 357,213 | |||||||||
| September 1 – September 30 | 1,028,006 | 89.92 | 1,028,006 | 264,798 | |||||||||
| Total third quarter | 2,691,103 | 87.57 | 2,691,103 | 264,798 | |||||||||
| October 1 – October 31 | 1,065,648 | 86.96 | 1,065,648 | 172,147 | |||||||||
| November 1 – November 30 | 539,943 | 83.79 | 539,943 | 726,918 | |||||||||
| December 1 – December 31 | 481,600 | 91.38 | 481,600 | 682,920 | |||||||||
| Total fourth quarter | 2,087,191 | 87.16 | 2,087,191 | 682,920 | |||||||||
| Total January 1 through December 31 | 10,518,552 | $ | 82.65 | 10,518,552 | $ | 682,920 |
| (1) | Shares purchased pursuant to the November 14, 2016 publicly announced share repurchase authorization of up to $600,000 of outstanding common stock. |
Dividend Policy
On January 13, 2017, our Board of Directors declared a quarterly dividend of $0.53 per common share payable on March 20, 2017 to stockholders of record as of February 27, 2017. We paid dividends of $0.53 per common share on December 12, 2016, and $0.50 on September 13, 2016, June 14, 2016 and March 14, 2016. We paid dividends of $0.30 per common share on December 14, 2015, September 15, 2015 and June 9, 2015, and $0.27 per common share on March 9, 2015. Any determination to pay future dividends will be at the discretion of our Board of Directors and will be dependent upon: our subsidiaries’ payment of dividends and/or other statutorily permissible payments to us; our results of operations and cash flows; our financial position and capital requirements; general business conditions; any legal, tax, regulatory and contractual restrictions on the payment of dividends; and any other factors our Board of Directors deems relevant.
Assurant, Inc. is a holding company and, therefore, its ability to pay dividends, service its debt and meet its other obligations depends primarily on the ability of its regulated U.S. domiciled insurance subsidiaries to pay dividends and make other statutorily permissible payments to the holding company. Our insurance subsidiaries are subject to significant regulatory and contractual restrictions limiting their ability to declare and pay dividends. See “Item 1A – Risk Factors – Risks Relating to Our Company – The inability of our subsidiaries to pay sufficient dividends to the holding company could prevent us from meeting our obligations and paying future stockholder dividends.” For the calendar year 2017, the maximum amount of dividends our regulated U.S. domiciled insurance subsidiaries could pay us, under applicable laws and regulations without prior regulatory approval, is approximately $319,000. Dividends or returns of capital paid by our subsidiaries, net of infusions and excluding amounts used or set aside for acquisitions, was approximately $1,653,000 in 2016.
We may seek approval of regulators to pay dividends in excess of any amounts that would be permitted without such approval. However, there can be no assurance that we would obtain such approval if sought.
Payments of dividends on shares of common stock are subject to the preferential rights of preferred stock that our Board of Directors may create from time to time. There is no preferred stock issued and outstanding as of December 31, 2016. For more information regarding restrictions on the payment of dividends by us and our insurance subsidiaries, including those pursuant to the terms of our revolving credit facilities, see “Item 7 – Management’s Discussion and Analysis of Financial Condition and Results of Operations – Liquidity and Capital Resources.”
In addition, our $400,000 revolving credit facility restricts payments of dividends if an event of default under the facility has occurred or if a proposed dividend payment would cause an event of default under the facility.
Item 6. Selected Financial Data
Assurant, Inc.
Five-Year Summary of Selected Financial Data
| As of and for the years ended December 31, | |||||||||||||||||||
| 2016 | 2015 | 2014 | 2013 | 2012 | |||||||||||||||
| Consolidated Statement of Operations Data: | |||||||||||||||||||
| Revenues | |||||||||||||||||||
| Net earned premiums (1) | $ | 5,007,364 | $ | 8,350,997 | $ | 8,632,142 | $ | 7,759,796 | $ | 7,236,984 | |||||||||
| Fees and other income | 1,422,464 | 1,303,466 | 1,033,805 | 586,730 | 475,392 | ||||||||||||||
| Net investment income | 515,678 | 626,217 | 656,429 | 650,296 | 713,128 | ||||||||||||||
| Net realized gains on investments (2) | 162,183 | 31,826 | 60,783 | 34,525 | 64,353 | ||||||||||||||
| Amortization of deferred gains and gains on disposal of businesses | 394,513 | 12,988 | (1,506 | ) | 16,310 | 18,413 | |||||||||||||
| Gain on pension plan curtailment | 29,578 | — | — | — | — | ||||||||||||||
| Total revenues | 7,531,780 | 10,325,494 | 10,381,653 | 9,047,657 | 8,508,270 | ||||||||||||||
| Benefits, losses and expenses | |||||||||||||||||||
| Policyholder benefits (3) | 1,808,472 | 4,742,535 | 4,405,333 | 3,675,532 | 3,655,404 | ||||||||||||||
| Amortization of deferred acquisition costs and value of businesses acquired | 1,351,314 | 1,402,573 | 1,485,558 | 1,470,287 | 1,403,215 | ||||||||||||||
| Underwriting, general and administrative expenses | 3,442,756 | 3,924,089 | 3,688,230 | 3,034,404 | 2,631,594 | ||||||||||||||
| Interest expense | 57,619 | 55,116 | 58,395 | 77,735 | 60,306 | ||||||||||||||
| Loss on extinguishment of debt | 23,031 | — | — | — | — | ||||||||||||||
| Total benefits, losses and expenses | 6,683,192 | 10,124,313 | 9,637,516 | 8,257,958 | 7,750,519 | ||||||||||||||
| Income before provision for income taxes | 848,588 | 201,181 | 744,137 | 789,699 | 757,751 | ||||||||||||||
| Provision for income taxes | 283,238 | 59,626 | 273,230 | 300,792 | 274,046 | ||||||||||||||
| Net income | $ | 565,350 | $ | 141,555 | $ | 470,907 | $ | 488,907 | $ | 483,705 | |||||||||
| Earnings per share: | |||||||||||||||||||
| Basic | $ | 9.23 | $ | 2.08 | $ | 6.52 | $ | 6.38 | $ | 5.74 | |||||||||
| Diluted | $ | 9.13 | $ | 2.05 | $ | 6.44 | $ | 6.30 | $ | 5.67 | |||||||||
| Dividends per share | $ | 2.03 | $ | 1.37 | $ | 1.06 | $ | 0.96 | $ | 0.81 | |||||||||
| Share data: | |||||||||||||||||||
| Weighted average shares outstanding used in basic per share calculations | 61,261,288 | 68,163,825 | 72,181,447 | 76,648,688 | 84,276,427 | ||||||||||||||
| Plus: Dilutive securities | 673,486 | 853,384 | 970,563 | 1,006,076 | 1,030,638 | ||||||||||||||
| Weighted average shares used in diluted per share calculations | 61,934,774 | 69,017,209 | 73,152,010 | 77,654,764 | 85,307,065 | ||||||||||||||
| Selected Consolidated Balance Sheet Data: | |||||||||||||||||||
| Cash and cash equivalents and investments | $ | 12,511,047 | $ | 14,283,077 | $ | 15,450,108 | $ | 15,961,199 | $ | 15,885,722 | |||||||||
| Total assets | $ | 29,709,128 | $ | 30,036,402 | $ | 31,554,881 | $ | 29,706,273 | $ | 28,942,565 | |||||||||
| Policy liabilities (4) | $ | 20,040,660 | $ | 19,787,133 | $ | 19,711,953 | $ | 18,698,615 | $ | 18,666,355 | |||||||||
| Debt | $ | 1,067,020 | $ | 1,164,656 | $ | 1,163,494 | $ | 1,629,702 | $ | 968,357 | |||||||||
| Total stockholders’ equity | $ | 4,098,100 | $ | 4,523,967 | $ | 5,181,307 | $ | 4,833,479 | $ | 5,185,366 | |||||||||
| Per share data: | |||||||||||||||||||
| Total book value per basic share (5) | $ | 72.33 | $ | 67.92 | $ | 73.73 | $ | 66.23 | $ | 64.93 |
| (1) | The decline in 2016 primarily relates to the Assurant Health wind-down and the sale of our Assurant Employee Benefits segment. |
| (2) | Included in net realized gains are other-than-temporary impairments of $6,874, $5,024, $30, $4,387 and $1,843 for 2016, 2015, 2014, 2013 and 2012, respectively. |
| (3) | The decline in 2016 primarily relates to lower losses from Assurant Health and only two months of results of AEB prior to its sale. 2016 includes $157,437 of reportable catastrophe losses primarily related to Hurricane Matthew and flooding. 2015 includes higher loss experience and adverse claim development on 2015 individual major medical policies. During 2012, we incurred losses of $250,206, net of reinsurance, mainly associated with Superstorm Sandy. Reportable catastrophe losses include only individual catastrophic events that generated losses to the Company in excess of $5,000, pre-tax and net of reinsurance. |
| (4) | Policy liabilities include future policy benefits and expenses, unearned premiums and claims and benefits payable. |
| (5) | Total stockholders’ equity divided by the basic shares outstanding for book value per basic share calculation. At December 31, 2016, 2015, 2014, 2013, and 2012 there were 56,660,642, 66,606,258, 70,276,896, 72,982,023 and 79,866,858 shares, respectively, outstanding. |
Item 7. Management’s Discussion and Analysis of Financial Condition and Results of Operations.
The following discussion and analysis of our financial condition and results of operations should be read in conjunction with our Consolidated Financial Statements and accompanying notes which appear elsewhere in this Report. It contains forward-looking statements that involve risks and uncertainties. Our actual results may differ materially from those anticipated in these forward-looking statements as a result of various factors, including those discussed below and elsewhere in this Report, particularly under the headings “Item 1A – Risk Factors” and “Forward-Looking Statements.”
General
We report our results through five segments: Global Housing, Global Lifestyle, Global Preneed, Total Corporate and Other and Assurant Employee Benefits. Total Corporate and Other includes Corporate and Other activities of the holding company, financing and interest expenses, net realized gains (losses) on investments and interest income earned from short-term investments held. Corporate and Other also includes the amortization of deferred gains and gains associated with the sales of FFG, LTC and Assurant Employee Benefits, through reinsurance agreements and other unusual and infrequent items as described below. Additionally, the Total Corporate and Other segment includes amounts related to the runoff of the Assurant Health business. As Assurant Health was a reportable segment in prior years, these amounts are disclosed for comparability purposes. In addition, Assurant Employee Benefits was a separate reportable segment in 2016 and primarily includes the results of operations for the periods prior to its sale on March 1, 2016.
The following discussion covers the twelve months ended December 31, 2016 (“Twelve Months 2016”), twelve months ended December 31, 2015 (“Twelve Months 2015”) and twelve months ended December 31, 2014 (“Twelve Months 2014”). Please see the discussion that follows, for each of these segments, for a more detailed analysis of the fluctuations.
Executive Summary
The Company made significant progress in executing its multi-year transformation in 2016. As part of its portfolio realignment to focus on specialty housing and lifestyle protection products and services, the Company has substantially exited the health insurance market and completed the sale, mainly through a series of reinsurance transactions, of its Assurant Employee Benefits segment to Sun Life Assurance Company of Canada, a subsidiary of Sun Life Financial Inc. (“Sun Life”). For more information on the sale, see Note 5 to the Consolidated Financial Statements included elsewhere in this Report.
Consolidated net income increased $423,795, or 299%, to $565,350 for Twelve Months 2016 from $141,555 for Twelve Months 2015. The increase was primarily related to lower losses and exit-related charges from the wind down of the Assurant Health runoff operations, a $247,991 (after-tax) increase in amortization of deferred gains and gains on disposal of businesses and an additional $84,732 (after-tax) in net realized gains on investments. The increase in amortization of deferred gains and gains on disposal of businesses and net realized gains on investments both primarily relate to the sale of the Assurant Employee Benefits segment. These items were partially offset by higher reportable catastrophe losses and the ongoing declines in lender-placed insurance in our Global Housing segment.
Global Housing net income decreased $119,039, or 39%, to $188,666 for Twelve Months 2016 from $307,705 for Twelve Months 2015. The decrease is primarily due to an $83,060 (after-tax) increase in reportable catastrophe losses and the ongoing declines in our lender-placed homeowners insurance business, including a decline in real-estate owned business and the previously disclosed loss of client business. This decline was partially offset by savings realized from expense initiatives.
Net earned premiums and fees decreased $161,445 to $2,288,801 for Twelve Months 2016 compared with Twelve Months 2015, primarily due to lower placement and premium rates in the lender-placed insurance business and the loss of client business mentioned above. The decrease was partially offset by growth in our multi-family housing and mortgage solutions businesses. The multi-family housing revenue increase was primarily due to a higher volume of renters’ policies sold through our affinity channels and increased penetration rates across our property management network, while the mortgage solutions businesses revenue increase was primarily due to the July 2016 acquisition of American Title, Inc., a leader in title and valuation services for home equity lenders.
For 2017, we anticipate Global Housing net income, excluding catastrophe losses, and net earned premiums, fees and other income to decline compared with 2016 as our lender-placed insurance business moves closer to a normalized, steady state. We also expect revenue growth in our multi-family housing and mortgage solutions businesses to continue and overall, we believe these offerings will account for a larger portion of this segment’s earnings as we expand market share. Additional expense savings from initiatives implemented across Global Housing are also expected.
Global Lifestyle net income increased $1,421, or 1%, to $154,425 for Twelve Months 2016 from $153,004 for Twelve Months 2015. The increase was primarily due to an increased net tax benefit related to a redemption of shares in our international structure and better mobile business performance globally. These items were partly offset by the loss of a domestic tablet program and lower contributions from legacy extended service contracts from North American retailers and our credit insurance business.
Twelve Months 2016 net earned premiums, fees and other income increased $72,151 to $3,706,167 compared with Twelve Months 2015 primarily due to an increase in mobile programs and subscribers partially offset by declines in business from certain North American retailers, the loss of a domestic tablet program and foreign currency exchange volatility.
In 2017, we expect Global Lifestyle net income to increase from 2016 driven primarily by improved mobile and vehicle protection business results and expense savings initiatives. These items will be partially offset by declines from credit insurance business and legacy North American retail clients. Net earned premiums, fees and other income are expected to decline in 2017 compared with 2016, primarily due to a change in program structure at a large service contract client. This program structure change will have no impact on net income. Excluding this program structure change, net earned premiums, fees and other income are expected to increase due to growth globally in our mobile and vehicle protection businesses. Foreign exchange volatility and variability in the mobile market will impact results.
Global Preneed net income decreased $1,875, or 4%, to $42,304 for Twelve Months 2016 from $44,179 for Twelve Months 2015. This decrease was primarily due to an adjustment related to the amortization of deferred acquisition costs and policyholder benefits for an older block of policies, partially offset by higher investment income from real estate joint venture partnerships. Twelve Months 2016 net earned premiums, fees and other income increased $3,838 to $171,279 compared with Twelve Months 2015 primarily due to premium from policies written in previous years.
In 2017, we expect Global Preneed net income and fees and other income to increase compared with 2016 due to sales growth across North America and operational efficiencies.
Critical Factors Affecting Results
Our results depend on the appropriateness of our product pricing, underwriting and the accuracy of our methodology for the establishment of reserves for future policyholder benefits and claims, returns on and values of invested assets, our ability to manage our expenses and achieve expense savings and catastrophe losse
Showing the first 8K of 128K characters. Open the full section
Item 7A. Quantitative and Qualitative Disclosures About Market Risk
As a provider of insurance products, effective risk management is fundamental to our ability to protect both our customers’ and stockholders’ interests. We are exposed to potential loss from various market risks, in particular interest rate risk and credit risk. Additionally, we are exposed to inflation risk and to a lesser extent foreign currency risk.
Interest rate risk is the possibility that the fair value of liabilities will change more or less than the market value of investments in response to changes in interest rates, including changes in investment yields and changes in spreads due to credit risks and other factors.
Credit risk is the possibility that counterparties may not be able to meet payment obligations when they become due. We assume counterparty credit risk in many forms. A counterparty is any person or entity from which cash or other forms of consideration are expected to extinguish a liability or obligation to us. Primarily, our credit risk exposure is concentrated in our fixed maturity investment portfolio and, to a lesser extent, in our reinsurance recoverables.
Inflation risk is the possibility that a change in domestic price levels produces an adverse effect on earnings. This typically happens when either invested assets or liabilities, but not both is indexed to inflation.
Foreign exchange risk is the possibility that changes in exchange rates produce an adverse effect on earnings and equity when measured in domestic currency. This risk is largest when assets backing liabilities payable in one currency are invested in
financial instruments of another currency. Our general principle is to invest in assets that match the currency in which we expect the liabilities to be paid.
Interest Rate Risk
Interest rate risk arises as we invest substantial funds in interest-sensitive fixed income assets, such as fixed maturity securities, mortgage-backed and asset-backed securities and commercial mortgage loans, primarily in the U.S. and Canada. There are two forms of interest rate risk – price risk and reinvestment risk. Price risk occurs when fluctuations in interest rates have a direct impact on the market valuation of these investments. As interest rates rise, the market value of these investments falls, and conversely, as interest rates fall, the market value of these investments rise. Reinvestment risk is primarily associated with the need to reinvest cash flows (primarily coupons and maturities) in an unfavorable lower interest rate environment. In addition, for securities with embedded options such as callable bonds, mortgage-backed securities, and certain asset-backed securities, reinvestment risk occurs when fluctuations in interest rates have a direct impact on expected cash flows. As interest rates fall, an increase in prepayments on these assets results in earlier than expected receipt of cash flows forcing us to reinvest the proceeds in an unfavorable lower interest rate environment. Conversely, as interest rates rise, a decrease in prepayments on these assets results in later than expected receipt of cash flows forcing us to forgo reinvesting in a favorable higher interest rate environment.
We manage interest rate risk by selecting investments with characteristics such as duration, yield, currency and liquidity tailored to the anticipated cash outflow characteristics of our insurance and reinsurance liabilities.
Our group long-term disability and group term life waiver of premium reserves are also sensitive to interest rates. These reserves are discounted to the valuation date at the valuation interest rate. The valuation interest rate is determined by taking into consideration actual and expected earned rates on our asset portfolio.
The interest rate sensitivity relating to price risk of our fixed maturity securities is assessed using hypothetical scenarios that assume several positive and negative parallel shifts of the yield curves. We have assumed that the U.S. and Canadian yield curve shifts are of equal direction and magnitude. The individual securities are repriced under each scenario using a valuation model. For investments such as callable bonds and mortgage-backed and asset-backed securities, a prepayment model is used in conjunction with a valuation model. Our actual experience may differ from the results noted below particularly due to assumptions utilized or if events occur that were not included in the methodology. The following tables summarize the results of this analysis for bonds, mortgage-backed and asset-backed securities held in our investment portfolio as of the dates indicated:
| Interest Rate Movement Analysis of Market Value of Fixed Maturity Securities Investment Portfolio | ||||||||||||||||||||
| As of December 31, 2016 | ||||||||||||||||||||
| -100 | -50 | 0 | 50 | 100 | ||||||||||||||||
| Total market value | $ | 10,324,782 | $ | 9,939,945 | $ | 9,572,145 | $ | 9,222,920 | $ | 8,892,266 | ||||||||||
| % Change in market value from base case | 7.86 | % | 3.84 | % | — | % | (3.65 | )% | (7.10 | )% | ||||||||||
| $ Change in market value from base case | $ | 752,637 | $ | 367,800 | $ | — | $ | (349,225 | ) | $ | (679,879 | ) | ||||||||
| As of December 31, 2015 | ||||||||||||||||||||
| -100 | -50 | 0 | 50 | 100 | ||||||||||||||||
| Total market value | $ | 11,022,546 | $ | 10,612,411 | $ | 10,215,328 | $9,837,247 | $ | 9,479,005 | |||||||||||
| % Change in market value from base case | 7.90 | % | 3.89 | % | — | % | (3.70 | )% | (7.21 | )% | ||||||||||
| $ Change in market value from base case | $ | 807,218 | $ | 397,083 | $ | — | $ | (378,081 | ) | $ | (736,323 | ) |
The interest rate sensitivity relating to reinvestment risk of our fixed maturity securities is assessed using hypothetical scenarios that assume purchases in the primary market and considers the effects of interest rates on sales. The effects of embedded options including call or put features are not considered. Our actual results may differ from the results noted below particularly due to assumptions utilized or if events occur that were not included in the methodology.
The following tables summarize the results of this analysis on our reported portfolio yield as of the dates indicated:
| Interest Rate Movement Analysis of Portfolio Yield of Fixed Maturity Securities Investment Portfolio | ||||||||||||||
| As of December 31, 2016 | ||||||||||||||
| -100 | -50 | 0 | 50 | 100 | ||||||||||
| Portfolio yield* | 4.40 | % | 4.48 | % | 4.57 | % | 4.66 | % | 4.74 | % | ||||
| Basis point change in portfolio yield | (0.17 | )% | (0.09 | )% | — | % | 0.09 | % | 0.17 | % | ||||
| As of December 31, 2015 | ||||||||||||||
| -100 | -50 | 0 | 50 | 100 | ||||||||||
| Portfolio yield* | 4.91 | % | 4.97 | % | 5.03 | % | 5.09 | % | 5.15 | % | ||||
| Basis point change in portfolio yield | (0.12 | )% | (0.06 | )% | — | % | 0.06 | % | 0.12 | % |
- Includes investment income from real estate joint venture partnerships.
Credit Risk
We have exposure to credit risk primarily from customers, as a holder of fixed maturity securities and by entering into reinsurance cessions.
Our risk management strategy and investment policy is to invest in debt instruments of high credit quality issuers and to limit the amount of credit exposure with respect to any one issuer. We attempt to limit our credit exposure by imposing fixed maturity portfolio limits on individual issuers based upon credit quality. Currently our portfolio limits are 1.5% for issuers rated AA- and above, 1% for issuers rated A- to A+, 0.75% for issuers rated BBB- to BBB+, 0.38% for issuers rated BB- to BB+ and 0.25% for issuers rated B and below. These portfolio limits are further reduced for certain issuers with whom we have credit exposure on reinsurance agreements. We use the lower of Moody’s or S&P’s ratings to determine an issuer’s rating.
The following table presents our fixed maturity investment portfolio by ratings of the nationally recognized securities rating organizations as of the dates indicated:
| December 31, 2016 | December 31, 2015 | ||||||||||||
| Rating | Fair Value | Percentage of Total | Fair Value | Percentage of Total | |||||||||
| Aaa/Aa/A | $ | 6,000,734 | 63 | % | $ | 6,326,800 | 62 | % | |||||
| Baa | 2,903,843 | 30 | % | 3,309,719 | 32 | % | |||||||
| Ba | 435,202 | 5 | % | 389,349 | 4 | % | |||||||
| B and lower | 232,366 | 2 | % | 189,460 | 2 | % | |||||||
| Total | $ | 9,572,145 | 100 | % | $ | 10,215,328 | 100 | % |
We are also exposed to the credit risk of our reinsurers. When we reinsure, we are still liable to our insureds regardless of whether we get reimbursed by our reinsurer. As part of our overall risk and capacity management strategy, we purchase reinsurance for certain risks underwritten by our various business segments as described above under “Item 7 – Management’s Discussion and Analysis of Financial Condition and Results of Operations – Reinsurance.”
We had $9,083,207 and $7,470,403 of reinsurance recoverables as of December 31, 2016 and 2015, respectively, the majority of which are protected from credit risk by various types of risk mitigation mechanisms such as trusts, letters of credit or by withholding the assets in a modified coinsurance or co-funds-withheld arrangement. For example, reserves of $1,079,414, as of December 31, 2016, relating to a coinsurance agreement with Sun Life, and reserves of $1,032,387 and $4,183,190 as of December 31, 2016 and $1,053,496 and $3,553,560 as of December 31, 2015, relating to coinsurance arrangements with The Hartford and John Hancock (a subsidiary of Manulife Financial Corporation), respectively, related to sales of businesses are backed by trusts. If the value of the assets in these trusts falls below the value of the associated liabilities, Sun Life, The Hartford and John Hancock, as the case may be, will be required to put more assets in the trusts. We may be dependent on the financial condition of Sun Life, The Hartford and John Hancock, whose A.M. Best ratings are currently A+, A- and A+, respectively. A.M. Best currently maintains a stable outlook on the financial strength ratings of Sun Life, The Hartford and John Hancock. For recoverables that are not protected by these mechanisms, we are dependent solely on the credit of the reinsurer. See “Item 1A – Risk Factors – Risks Related to Our Company – Reinsurance may not be available or adequate to protect us against losses, and we are subject to the credit risk of reinsurers” and “– We have sold businesses through
reinsurance that could again become our direct financial and administrative responsibility if the purchasing companies were to become insolvent.” A majority of our reinsurance exposure has been ceded to companies rated A- or better by A.M. Best.
Inflation Risk
Inflation risk arises as we invest in assets, which are not indexed to the level of inflation, whereas the corresponding liabilities are indexed to the level of inflation. Approximately 5% of Assurant preneed insurance policies, with reserves of $240,231 and $254,083 as of December 31, 2016 and 2015, respectively, have death benefits that are guaranteed to grow with the CPI. In times of rapidly rising inflation, the credited death benefit growth on these liabilities increases relative to the investment income earned on the nominal assets resulting in an adverse impact on earnings. We have partially mitigated this risk by purchasing derivative contracts with payments tied to the CPI. See “– Derivatives.”
In addition, we have inflation risk in our individual and small employer group health insurance businesses to the extent that medical costs increase with inflation, and we have not been able to increase premiums to keep pace with inflation.
Foreign Exchange Risk
We are exposed to foreign exchange risk arising from our international operations, mainly in Canada. We also have foreign exchange risk exposure to the British pound, Brazilian Real, Euro, Mexican Peso and Argentine Peso. Total invested assets denominated in currencies other than the Canadian dollar were approximately 2% of our total invested assets at December 31, 2016 and 2015, respectively.
Foreign exchange risk is mitigated by matching our liabilities under insurance policies that are payable in foreign currencies with investments that are denominated in such currency. We have entered into forward contracts to hedge certain exposures denominated in the Euro and British pound.
The foreign exchange risk sensitivity of our fixed maturity securities denominated in Canadian dollars, whose balance was $1,563,129 and $1,413,580 of the total as of December 31, 2016 and 2015, respectively, on our entire fixed maturity portfolio is summarized in the following tables:
| Foreign Exchange Movement Analysis of Market Value of Fixed Maturity Securities Assets | ||||||||||||||||||||
| As of December 31, 2016 | ||||||||||||||||||||
| Foreign exchange spot rate at December 31, 2016, US Dollar to Canadian Dollar | -10% | -5% | 0 | 5% | 10% | |||||||||||||||
| Total market value | $ | 9,415,840 | $ | 9,493,993 | $ | 9,572,145 | $ | 9,650,297 | $ | 9,728,450 | ||||||||||
| % change of market value from base case | (1.63 | )% | (0.82 | )% | — | % | 0.82 | % | 1.63 | % | ||||||||||
| $ change of market value from base case | $ | (156,305 | ) | $ | (78,152 | ) | $ | — | $ | 78,152 | $ | 156,305 | ||||||||
| As of December 31, 2015 | ||||||||||||||||||||
| Foreign exchange spot rate at December 31, 2015, US Dollar to Canadian Dollar | -10% | -5% | 0 | 5% | 10% | |||||||||||||||
| Total market value | $ | 10,073,975 | $ | 10,144,651 | $ | 10,215,328 | $ | 10,286,005 | $ | 10,356,681 | ||||||||||
| % change of market value from base case | (1.38 | )% | (0.69 | )% | — | % | 0.69 | % | 1.38 | % | ||||||||||
| $ change of market value from base case | $ | (141,353 | ) | $ | (70,677 | ) | $ | — | $ | 70,677 | $ | 141,353 |
The foreign exchange risk sensitivity of our consolidated net income is assessed using hypothetical test scenarios that assume earnings in Canadian dollars are recognized evenly throughout a period. Our actual results may differ from the results noted below particularly due to assumptions utilized or if events occur that were not included in the methodology. For more information on this risk, please see “Item 1A – Risk Factors-Risks Related to Our Company.” Fluctuations in the exchange rate of the U.S. dollar and other foreign currencies may materially and adversely affect our results of operations. The following tables summarize the results of this analysis on our reported net income as of the dates indicated:
| Foreign Exchange Movement Analysis of Net Income | ||||||||||||||||||||
| As of December 31, 2016 | ||||||||||||||||||||
| Foreign exchange daily average rate for the year ended December 31, 2016, US Dollar to Canadian Dollar | -10% | -5% | 0 | 5% | 10% | |||||||||||||||
| Net Income | $ | 563,351 | $ | 564,350 | $ | 565,350 | $ | 566,350 | $ | 567,349 | ||||||||||
| % change of net income from base case | (0.35 | )% | (0.18 | )% | — | % | 0.18 | % | 0.35 | % | ||||||||||
| $ change of net income from base case | $ | (1,999 | ) | $ | (1,000 | ) | $ | — | $ | 1,000 | $ | 1,999 | ||||||||
| As of December 31, 2015 | ||||||||||||||||||||
| Foreign exchange daily average rate for the year ended December 31, 2015, US Dollar to Canadian Dollar | -10% | -5% | 0 | 5% | 10% | |||||||||||||||
| Net income | $ | 138,360 | $ | 139,957 | $ | 141,555 | $ | 143,153 | $ | 144,750 | ||||||||||
| % change of net income from base case | (2.26 | )% | (1.13 | )% | — | % | 1.13 | % | 2.26 | % | ||||||||||
| $ change of net income from base case | $ | (3,195 | ) | $ | (1,598 | ) | $ | — | $ | 1,598 | $ | 3,195 |
Derivatives
Derivatives are financial instruments whose values are derived from interest rates, foreign exchange rates, financial indices or the prices of securities or commodities. Derivative financial instruments may be exchange-traded or contracted in the over-the-counter market and include swaps, futures, options and forward contracts.
Under insurance statutes, our insurance companies may use derivative financial instruments to hedge actual or anticipated changes in their assets or liabilities, to replicate cash market instruments or for certain income-generating activities. These statutes generally prohibit the use of derivatives for speculative purposes. We generally do not use derivative financial instruments.
We have purchased contracts to cap the inflation risk exposure inherent in some of our preneed insurance policies.
In accordance with the guidance on embedded derivatives, we have bifurcated the modified coinsurance agreement with The Hartford into its debt host and embedded derivative (total return swap) and recorded the embedded derivative at fair value in the consolidated balance sheets. The invested assets related to this modified coinsurance agreement are included in other investments in the consolidated balance sheets.
Item 8. Financial Statements and Supplementary Data
The Consolidated Financial Statements and Financial Statement Schedules in Part IV, Item 15(a) 1 and 2 of this Report are incorporated by reference into this Item 8.
Item 9. Changes in and Disagreements with Accountants on Accounting and Financial Disclosure
There have been no disagreements with accountants on accounting and financial disclosure.
Item 9A. Controls and Procedures
Evaluation of Disclosure Controls and Procedures
The Company’s Chief Executive Officer and Chief Financial Officer have evaluated the effectiveness of the Company’s disclosure controls and procedures pursuant to Rule 13a-15(e) or 15d-15(e) under the Securities Exchange Act of 1934, as amended (the “Exchange Act”) as of December 31, 2016. They have concluded that the Company’s disclosure controls and procedures are effective, and provide reasonable assurance that information the Company is required to disclose in its reports under the Exchange Act is recorded, processed, summarized and reported accurately. They also have concluded that information that the Company is required to disclose is accumulated and communicated to the Company’s management as appropriate to allow timely decisions regarding required disclosure.
Management’s Annual Report on Internal Control Over Financial Reporting
The management of the Company is responsible for establishing and maintaining adequate internal control over financial reporting for the Company as defined in Rule 13a-15(f) or 15d-15(f) under the Exchange Act.
A company’s internal control over financial reporting is a process designed to provide reasonable assurance regarding the reliability of financial reporting and the preparation of financial statements for external purposes in accordance with accounting
principles generally accepted in the U.S. A company’s internal control over financial reporting includes policies and procedures that (1) pertain to the maintenance of records that in reasonable detail accurately and fairly reflect the transactions and dispositions of the assets of the company; (2) provide reasonable assurance that transactions are recorded as necessary to permit preparation of financial statements in accordance with accounting principles generally accepted in the U.S., and that receipts and expenditures of the company are being made only in accordance with authorizations of management and directors of the company; and (3) provide reasonable assurance regarding prevention or timely detection of unauthorized acquisition, use or disposition of the company’s assets that could have a material effect on the financial statements. Because of its inherent limitations, internal control over financial reporting may not prevent or detect misstatements. Also, projections of any evaluation of effectiveness to future periods are subject to the risk that controls may become inadequate because of changes in conditions, or that the degree of compliance with the policies or procedures may deteriorate.
The Company’s management assessed its internal control over financial reporting as of December 31, 2016 using criteria established in Internal Control – Integrated Framework (2013) issued by the Committee of Sponsoring Organizations of the Treadway Commission (COSO).
Management, including the Company’s Chief Executive Officer and its Chief Financial Officer, based on their evaluation of the Company’s internal control over financial reporting (as defined in Exchange Act Rule 13a-15(f) or 15d-15(f)), have concluded that the Company’s internal control over financial reporting was effective as of December 31, 2016.
The effectiveness of the Company’s internal control over financial reporting as of December 31, 2016 has been audited by PricewaterhouseCoopers LLP, an independent registered public accounting firm, as stated in their report which appears herein.
Changes in Internal Control Over Financial Reporting
There have been no changes in the Company’s internal control over financial reporting that occurred during the Company’s fourth fiscal quarter in 2016 that have materially affected, or are reasonably likely to materially affect, the Company’s internal control over financial reporting.
Item 9B. Other Information
None.
PART III
Item 10. Directors, Executive Officers and Corporate Governance
The information regarding executive officers in our upcoming 2017 Proxy Statement (“2017 Proxy Statement”) under the caption “Executive Officers” is incorporated herein by reference. The information regarding directors in the 2017 Proxy Statement, under the caption “Election of Directors” in “Proposal One” is incorporated herein by reference. The information regarding compliance with Section 16(a) of the Exchange Act in the 2017 Proxy Statement, under the caption “Section 16(a) Beneficial Ownership Reporting Compliance” is incorporated herein by reference. The information regarding the Nominating and Corporate Governance Committee and the Audit Committee in the 2017 Proxy Statement under the captions “Nominating and Corporate Governance Committee” and “Audit Committee” in “Corporate Governance” is incorporated herein by reference.
Code of Ethics
The Assurant Code of Ethics applies to all directors, officers and employees of Assurant, including the principal executive officer, principal financial officer and principal accounting officer. The Code of Ethics and our Corporate Governance Guidelines are posted in the “Corporate Governance” subsection of the “Investor Relations” section of our website at www.assurant.com, which is not incorporated by reference herein. We intend to post any amendments to or waivers from the Code of Ethics that apply to our executive officers or directors on our website.
Item 11. Executive Compensation
The information in the 2017 Proxy Statement under the captions “Compensation Discussion and Analysis,” “Compensation of Named Executive Officers” and “Compensation of Directors” is incorporated herein by reference. The information in the 2017 Proxy Statement regarding the Compensation Committee under the captions “Compensation Committee,” “Compensation Committee Interlocks and Insider Participation” and “Compensation Committee Report” in “Corporate Governance” is incorporated herein by reference.
Item 12. Security Ownership of Certain Beneficial Owners and Management and Related Stockholder Matters
The information in the 2017 Proxy Statement under the captions “Equity Compensation Plan Information,” “Security Ownership of Certain Beneficial Owners” and “Security Ownership of Directors and Executive Officers” is incorporated herein by reference.
Item 13. Certain Relationships and Related Transactions, and Director Independence
The information in the 2017 Proxy Statement under the captions “Transactions with Related Persons” and “Director Independence” in “Corporate Governance” is incorporated herein by reference.
Item 14. Principal Accounting Fees and Services
The information in the 2017 Proxy Statement under the caption “Fees of Principal Accountants” in “Audit Committee Matters” is incorporated herein by reference.
PART IV
Item 15. Exhibits and Financial Statement Schedules
(a)1. Consolidated Financial Statements
The following Consolidated Financial Statements of Assurant, Inc., incorporated by reference into Item 8, are attached hereto:
(a)2. Consolidated Financial Statement Schedules
The following Consolidated Financial Statement Schedules of Assurant, Inc. are attached hereto:
| Schedule I – Summary of Investments other than Investments in Related Parties |
| Schedule II – Parent Only Condensed Financial Statements |
| Schedule III – Supplementary Insurance Information |
| Schedule IV – Reinsurance |
| Schedule V – Valuation and Qualifying Accounts |
| * | All other schedules are omitted because they are not applicable, not required, or the information is included in the financial statements or the notes thereto. |
(a)3. Exhibits
Pursuant to the rules and regulations of the SEC, the Company has filed or incorporated by reference certain agreements as exhibits to this Annual Report on Form 10-K. These agreements may contain representations and warranties by the parties. These representations and warranties have been made solely for the benefit of the other party or parties to such agreements and (i) may have been qualified by disclosures made to such other party or parties, (ii) were made only as of the date of such agreements or such other date(s) as may be specified in such agreements and are subject to more recent developments, which may not be fully reflected in the Company’s public disclosure, (iii) may reflect the allocation of risk among the parties to such agreements and (iv) may apply materiality standards different from what may be viewed as material to investors. Accordingly, these representations and warranties may not describe the Company’s actual state of affairs at the date hereof and should not be relied upon.
The following exhibits either (a) are filed with this report or (b) have previously been filed with the SEC and are incorporated herein by reference to those prior filings. Exhibits are available upon request at the investor relations section of our website, located at www.assurant.com.
| Exhibit Number | Exhibit Description | |
| 2.1 | Master Transaction Agreement, dated as of September 9, 2015, by and between Assurant, Inc. and Sun Life Assurance Company of Canada (incorporated by reference to Exhibit 2.1 to the Registrant’s Current Report on Form 8-K, originally filed on September 10, 2015). | |
| 3.1 | Restated Certificate of Incorporation of the Registrant (incorporated by reference from Exhibit 3.1 to the Registrant’s Form 10-Q, originally filed on August 5, 2010). |
| 3.2 | Amended and Restated By-Laws of the Registrant (incorporated by reference from Exhibit 3.1 to the Registrant’s Form 8-K, originally filed on May 17, 2011). | |
| 4.1 | Specimen Common Stock Certificate (incorporated by reference from Exhibit 4.1 to the Registrant’s Registration Statement on Form S-1/A (File No. 333-109984) and amendments thereto, originally filed on January 13, 2004). | |
| 4.2 | Senior Debt Indenture, dated as of February 18, 2004, between Assurant, Inc. and U.S. Bank National Association, successor to SunTrust Bank, as trustee (incorporated by reference from Exhibit 10.27 to the Registrant’s Form 10-K, originally filed on March 30, 2004). | |
| 4.3 | Indenture, dated as of March 28, 2013, between Assurant, Inc. and U.S. Bank National Association, as trustee (incorporated by reference from Exhibit 4.1 to the Registrant’s Form 8-K, originally filed on March 28, 2013). | |
| 4.4 | Pursuant to Item 601(b)(4)(iii) of Regulation S-K, the Registrant hereby agrees to furnish to the SEC, upon request, a copy of any other instrument defining the rights of holders of long-term debt of the Registrant and its subsidiaries. | |
| 10.1 | Assurant, Inc. Amended and Restated Directors Compensation Plan, effective as of January 1, 2013 (incorporated by reference from Exhibit 10.1 to the Registrants Form 10-K, originally filed on February 20, 2013).* | |
| 10.2 | Assurant, Inc. Amended and Restated Directors Compensation Plan, effective as of May 13, 2016 (incorporated by reference from Exhibit 10.6 to the Registrant’s Form 10-Q, originally filed on August 2, 2016). * | |
| 10.3 | Form of Assurant, Inc. Restricted Stock Unit Award Agreement for Time-based Awards for Directors, effective as of January 1, 2013 (incorporated by reference from Exhibit 10.2 to the Registrants Form 10-K, originally filed on February 20, 2013).* | |
| 10.4 | Form of Assurant, Inc. Restricted Stock Unit Award Agreement for Time-based Awards for Directors, effective as of January 1, 2013 (incorporated by reference from Exhibit 10.3 to the Registrants Form 10-K, originally filed on February 20, 2013).* | |
| 10.5 | Amended and Restated Assurant, Inc. Long Term Equity Incentive Plan, effective as of January 1, 2012 (incorporated by reference from Exhibit 10.15 to the Registrant’s Form 10-K, originally filed on February 23, 2012).* | |
| 10.6 | Form of Assurant, Inc. Restricted Stock Unit Award Agreement for Time-based Awards under the Assurant, Inc. Long Term Equity Incentive Plan (incorporated by reference from Exhibit 10.1 to the Registrant’s Form 8-K, originally filed on March 16, 2009).* | |
| 10.7 | Form of Restricted Stock Unit Award Agreement for Time-based Awards under the Assurant, Inc. Long Term Equity Incentive Plan, dated May 10, 2016 (incorporated by reference from Exhibit 10.2 to the Registrant’s Form 10-Q, originally filed on August 2, 2016). * | |
| 10.8 | Restricted Stock Unit Award Agreement for Time-based Awards under the Assurant, Inc. Long Term Equity Incentive Plan, dated July 18, 2016, by and between Assurant, Inc. and Richard Dziadzio (incorporated by reference from Exhibit 10.4 to the Registrant’s Form 10-Q, originally filed on August 2, 2016). * | |
| 10.9 | Form of Assurant, Inc. Restricted Stock Unit Award Agreement for Time-based Awards under the Assurant, Inc. Long Term Equity Incentive Plan, effective March 10, 2016. (incorporated by reference from Exhibit 10.3 to the Registrant’s Form 10-Q, originally filed on May 3, 2016)* | |
| 10.10 | Form of Assurant, Inc. Restricted Stock Unit Award Agreement for Performance-based Awards under the Assurant, Inc. Long Term Equity Incentive Plan (incorporated by reference from Exhibit 10.20 to the Registrant’s Form 10-K, originally filed on February 23, 2012).* | |
| 10.11 | Form of Assurant, Inc. Restricted Stock Unit Award Agreement for Performance-based Awards under the Assurant, Inc. Long Term Equity Incentive Plan, effective March 10, 2016. (incorporated by reference from Exhibit 10.4 to the Registrant’s Form 10-Q, originally filed on May 3, 2016) * | |
| 10.12 | Form of Assurant, Inc. Restricted Stock Unit Award Agreement for Performance-based Awards under the Assurant, Inc. Long Term Equity Incentive Plan for the Management Committee, effective March 10, 2016 (incorporated by reference from Exhibit 10.5 to the Registrant’s Form 10-Q, originally filed on May 3, 2016). * | |
| 10.13 | Amended and Restated Assurant, Inc. Executive Short Term Incentive Plan, effective as of January 1, 2012 (incorporated by reference from Exhibit 10.23 to the Registrant’s Form 10-K, originally filed on February 23, 2012).* | |
| 10.14 | Amended and Restated Assurant Deferred Compensation Plan (incorporated by reference from Exhibit 10.33 to the Registrant’s Form 10-K, originally filed on March 3, 2008).* | |
| 10.15 | Amendment No. 1 to the Amended and Restated Assurant Deferred Compensation Plan, effective as of January 1, 2012 (incorporated by reference from Exhibit 10.28 to the Registrant’s Form 10-K, originally filed on February 23, 2012).* |
| 10.16 | Amendment No. 2 to the Amended and Restated Assurant Deferred Compensation Plan, effective as of December 3, 2013 (incorporated by reference from Exhibit 10.31 to the Registrant's Form 10-K, originally filed on February 18, 2014).* | |
| 10.17 | Amended and Restated Supplemental Executive Retirement Plan (incorporated by reference from Exhibit 10.5 to the Registrant’s Form 10-K, originally filed on March 3, 2008).* | |
| 10.18 | Amendment No. 1 to the Amended and Restated Supplemental Executive Retirement Plan, effective as of January 1, 2009 (incorporated by reference from Exhibit 10.6 to the Registrant’s Form 10-K, originally filed on February 27, 2009).* | |
| 10.19 | Amendment No. 2 to the Amended and Restated Supplemental Executive Retirement Plan, effective as of January 1, 2010 (incorporated by reference from Exhibit 10.7 to the Registrant’s Form 10-K, originally filed on February 23, 2011).* | |
| 10.20 | Amendment No. 3 to the Amended and Restated Supplemental Executive Retirement Plan, effective as of February 29, 2016. (incorporated by reference from Exhibit 10.2 to the Registrant’s Form 10-Q, originally filed on May 3, 2016)* | |
| 10.21 | Assurant Executive Pension Plan, amended and restated effective as of January 1, 2009 (incorporated by reference from Exhibit 10.15 to the Registrant’s Form 10-K, originally filed on February 27, 2009).* | |
| 10.22 | Amendment No. 1 to the Assurant Executive Pension Plan, effective as of January 1, 2009 (incorporated by reference from Exhibit 10.33 to the Registrant’s Form 10-K, originally filed on February 23, 2012).* | |
| 10.23 | Amendment No. 2 to the Assurant Executive Pension Plan, effective as of January 1, 2010 (incorporated by reference from Exhibit 10.34 to the Registrant’s Form 10-K, originally filed on February 23, 2012).* | |
| 10.24 | Amendment No. 3 to the Assurant Executive Pension Plan, effective as of December 31, 2013 (incorporated by reference from Exhibit 10.38 to the Registrant's Form 10-K, originally filed on February 18, 2014).* | |
| 10.25 | Amendment No. 4 to the Assurant Executive Pension Plan, effective as of February 29, 2016. (incorporated by reference from Exhibit 10.1 to the Registrant’s Form 10-Q, originally filed on May 3, 2016) * | |
| 10.26 | Assurant Executive 401(k) Plan, Amended and Restated Effective as of January 1, 2014 (incorporated by reference from Exhibit 10.1 to the Registrant’s Form 10-Q, originally filed on April 29, 2014).* | |
| 10.27 | Amendment No.1 to the Assurant Executive 401(k) Plan, Amended and Restated, effective as of March 1, 2016.* | |
| 10.28 | Form of Assurant, Inc. Change of Control Employment Agreement, dated as of January 1, 2009 (incorporated by reference from Exhibit 10.17 to the Registrant’s Form 10-K, originally filed on February 27, 2009).* | |
| 10.29 | Form of Assurant, Inc. Change of Control Employment Agreement, dated as of January 1, 2009 (incorporated by reference from Exhibit 10.18 to the Registrant’s Form 10-K, originally filed on February 27, 2009).* | |
| 10.30 | Form of Assurant, Inc. Change of Control Employment Agreement for Divisional Officers, dated as of January 1, 2009 (incorporated by reference from Exhibit 10.19 to the Registrant’s Form 10-K, originally filed on February 27, 2009).* | |
| 10.31 | Form of Amendment to Assurant, Inc. Change of Control Employment Agreement, effective as of February 1, 2010 (incorporated by reference from Exhibit 10.1 to the Registrant’s Form 8-K, originally filed on February 1, 2010).* | |
| 10.32 | Form of Assurant, Inc. Change in Control Agreement, dated May 13, 2016 (incorporated by reference from Exhibit 10.5 to the Registrant’s Form 10-Q, originally filed on August 2, 2016). * | |
| 10.33 | American Security Insurance Company Investment Plan Document (incorporated by reference from Exhibit 10.34 to the Registrant’s Form 10-K, originally filed on March 3, 2008)*. | |
| 10.34 | Credit Agreement, dated as of September 16, 2014, among Assurant, Inc., the lenders party thereto, JP Morgan Chase Bank, N.A., as administrative agent, and Wells Fargo Bank, National Association, as syndication agent (incorporated by reference from Exhibit 10.1 to the Registrant’s Form 10-Q, originally filed on November 4, 2014). | |
| 10.35 | Amendment No. 1, dated March 5, 2015, to the Credit Agreement, dated as of September 16, 2014, among Assurant, Inc., the lenders party thereto, JP Morgan Chase Bank, N.A., as administrative agent, and Wells Fargo Bank, National Association, as syndication agent (incorporated by reference from Exhibit 10.1 to the Registrant’s Form 10-Q, originally filed on May 6, 2015). | |
| 10.36 | Amendment No. 2, dated as of October 4, 2016, to the Credit Agreement, dated as of September 16, 2014, among Assurant, Inc., the lenders party thereto, JP Morgan Chase Bank, N.A., as administrative agent, and Wells Fargo Bank, National Association, as syndication agent (incorporated by reference from Exhibit 10.1 to the Registrant’s Form 10-Q, originally filed on November 1 , 2016) |
| 10.37 | Employment Letter Agreement, dated April 21, 2008, by and between Assurant, Inc. and Bart Schwartz (incorporated by reference from Exhibit 10.38 to the Registrant’s Form 10-K, originally filed on February 25, 2010).* | |
| 10.38 | Letter Agreement, dated October 11, 2010, by and between Assurant, Inc. and Alan Colberg (incorporated by reference from Exhibit 10.38 to the Registrant’s Form 10-K, originally filed on February 23, 2011).* | |
| 10.39 | Employment Letter Agreement, dated March 8, 2016, by and between Assurant, Inc. and Ajay Waghray (incorporated by reference from Exhibit 10.1 to the Registrant’s Form 10-Q, originally filed on August 2, 2016). * | |
| 10.40 | Employment Letter Agreement, dated April 26, 2016, by and between Assurant, Inc. and Richard Dziadzio (incorporated by reference from Exhibit 10.3 to the Registrant’s Form 10-Q, originally filed on August 2, 2016). * | |
| 10.41 | Consulting Agreement, dated January 6, 2015, by and between Assurant, Inc. and John S. Roberts. (incorporated by reference from Exhibit 10.53 to the Registrant’s Form 10-K, originally filed on February 19, 2015) * | |
| 10.42 | Retirement Agreement, dated June 29, 2016, by and between Assurant, Inc. and S. Craig Lemasters (incorporated by reference from Exhibit 10.7 to the Registrant’s Form 10-Q, originally filed on August 2, 2016). * | |
| 12.1 | Computation of Ratio of Consolidated Earnings to Fixed Charges as of December 31, 2016. | |
| 12.2 | Computation of Other Ratios as of December 31, 2016. | |
| 21.1 | Subsidiaries of the Registrant. | |
| 23.1 | Consent of PricewaterhouseCoopers LLP. | |
| 24.1 | Power of Attorney. | |
| 31.1 | Rule 13a-14(a)/15d-14(a) Certification of Principal Executive Officer. | |
| 31.2 | Rule 13a-14(a)/15d-14(a) Certification of Principal Financial Officer. | |
| 32.1 | Certification of Chief Executive Officer of Assurant, Inc. pursuant to 18 U.S.C. Section 1350, as adopted pursuant to Section 906 of the Sarbanes-Oxley Act of 2002. | |
| 32.2 | Certification of Chief Financial Officer of Assurant, Inc. pursuant to 18 U.S.C. Section 1350, as adopted pursuant to Section 906 of the Sarbanes-Oxley Act of 2002. | |
| 101 | The following materials from the Company’s Annual Report on Form 10-K for the year ended December 31, 2016, formatted in XBRL (Extensible Business Reporting Language): (i) the Consolidated Balance Sheets, (ii) the Consolidated Statements of Operations, (iii) the Consolidated Statements of Comprehensive Income, (iv) the Consolidated Statements of Changes in Stockholders’ Equity, (v) the Consolidated Statements of Cash Flows, and (vi) Notes to Consolidated Financial Statements. |
*Management contract or compensatory plan
Item 16. Form 10-K Summary
Not applicable.
SIGNATURES
Pursuant to the requirements of Section 13 or 15(d) of the Securities Exchange Act of 1934, as amended, the registrant has duly caused this Report to be signed on its behalf by the undersigned, thereunto duly authorized on February 14, 2017.
| ASSURANT, INC. | ||
| By: | /S/ ALAN B. COLBERG | |
| Name: | Alan B. Colberg | |
| Title: | Chief Executive Officer |
Pursuant to the requirements of the Securities Exchange Act of 1934, as amended, this Report has been signed below by the following persons on behalf of the registrant in the capacities indicated on February 14, 2017.
| Signature | Title | |
| /S/ ALAN B. COLBERG | President, Chief Executive Officer and Director (Principal Executive Officer) | |
| Alan B. Colberg | ||
| /S/ RICHARD S. DZIADZIO | Executive Vice President, Chief Financial Officer and Treasurer (Principal Financial Officer) | |
| Richard S. Dziadzio | ||
| /S/ JOHN A. SONDEJ | Senior Vice President and Controller (Principal Accounting Officer) | |
| John A. Sondej | ||
| * | Non-Executive Board Chair | |
| Elaine D. Rosen | ||
| * | Director | |
| Howard L. Carver | ||
| * | Director | |
| Juan N. Cento | ||
| * | Director | |
| Elyse Douglas | ||
| * | Director | |
| Lawrence V. Jackson | ||
| * | Director | |
| Charles J. Koch | ||
| * | Director | |
| Jean-Paul L. Montupet | ||
| * | Director | |
| Paul J. Reilly | ||
| * | Director | |
| Robert W. Stein |
| *By: | /S/ RICHARD S. DZIADZIO | |
| Name: | Richard S. Dziadzio | |
| Attorney-in-Fact |
Report of Independent Registered Public Accounting Firm
To the Board of Directors and Stockholders of Assurant, Inc.:
In our opinion, the consolidated financial statements listed in the index appearing under Item 15(a)1 present fairly, in all material respects, the financial position of Assurant, Inc. and its subsidiaries at December 31, 2016 and 2015, and the results of their operations and their cash flows for each of the three years in the period ended December 31, 2016 in conformity with accounting principles generally accepted in the United States of America. In addition, in our opinion, the financial statement schedules listed in the index appearing under Item 15(a)2 present fairly, in all material respects, the information set forth therein when read in conjunction with the related consolidated financial statements. Also in our opinion, the Company maintained, in all material respects, effective internal control over financial reporting as of December 31, 2016, based on criteria established in Internal Control – Integrated Framework (2013) issued by the Committee of Sponsoring Organizations of the Treadway Commission (COSO). The Company’s management is responsible for these financial statements and financial statement schedules, for maintaining effective internal control over financial reporting and for its assessment of the effectiveness of internal control over financial reporting, included in Management’s Annual Report on Internal Control Over Financial Reporting, appearing under Item 9A. Our responsibility is to express opinions on these financial statements, on the financial statement schedules, and on the Company’s internal control over financial reporting based on our integrated audits. We conducted our audits in accordance with the standards of the Public Company Accounting Oversight Board (United States). Those standards require that we plan and perform the audits to obtain reasonable assurance about whether the financial statements are free of material misstatement and whether effective internal control over financial reporting was maintained in all material respects. Our audits of the financial statements included examining, on a test basis, evidence supporting the amounts and disclosures in the financial statements, assessing the accounting principles used and significant estimates made by management, and evaluating the overall financial statement presentation. Our audit of internal control over financial reporting included obtaining an understanding of internal control over financial reporting, assessing the risk that a material weakness exists, and testing and evaluating the design and operating effectiveness of internal control based on the assessed risk. Our audits also included performing such other procedures as we considered necessary in the circumstances. We believe that our audits provide a reasonable basis for our opinions.
A company’s internal control over financial reporting is a process designed to provide reasonable assurance regarding the reliability of financial reporting and the preparation of financial statements for external purposes in accordance with generally accepted accounting principles. A company’s internal control over financial reporting includes those policies and procedures that (i) pertain to the maintenance of records that, in reasonable detail, accurately and fairly reflect the transactions and dispositions of the assets of the company; (ii) provide reasonable assurance that transactions are recorded as necessary to permit preparation of financial statements in accordance with generally accepted accounting principles, and that receipts and expenditures of the company are being made only in accordance with authorizations of management and directors of the company; and (iii) provide reasonable assurance regarding prevention or timely detection of unauthorized acquisition, use, or disposition of the company’s assets that could have a material effect on the financial statements.
Because of its inherent limitations, internal control over financial reporting may not prevent or detect misstatements. Also, projections of any evaluation of effectiveness to future periods are subject to the risk that controls may become inadequate because of changes in conditions, or that the degree of compliance with the policies or procedures may deteriorate.
/s/ PricewaterhouseCoopers LLP
New York, New York
February 14, 2017
F-1
Assurant, Inc.
Consolidated Balance Sheets
At December 31, 2016 and 2015
| December 31, | |||||||
| 2016 | 2015 | ||||||
| (in thousands except number of shares and per share amounts) | |||||||
| Assets | |||||||
| Investments: | |||||||
| Fixed maturity securities available for sale, at fair value (amortized cost – $8,870,837 in 2016 and $9,470,795 in 2015) | $ | 9,572,145 | $ | 10,215,328 | |||
| Equity securities available for sale, at fair value (cost – $381,831 in 2016 and $450,563 in 2015) | 421,361 | 500,057 | |||||
| Commercial mortgage loans on real estate, at amortized cost | 624,033 | 1,151,256 | |||||
| Policy loans | 38,533 | 43,858 | |||||
| Short-term investments | 227,740 | 508,950 | |||||
| Other investments | 595,264 | 575,323 | |||||
| Total investments | 11,479,076 | 12,994,772 | |||||
| Cash and cash equivalents | 1,031,971 | 1,288,305 | |||||
| Premiums and accounts receivable, net | 1,217,969 | 1,260,717 | |||||
| Reinsurance recoverables | 9,083,207 | 7,470,403 | |||||
| Accrued investment income | 110,075 | 129,743 | |||||
| Deferred acquisition costs | 3,267,394 | 3,150,934 | |||||
| Property and equipment, at cost less accumulated depreciation | 343,572 | 298,414 | |||||
| Tax receivable | 20,462 | 24,176 | |||||
| Goodwill | 830,956 | 833,512 | |||||
| Value of business acquired | 32,165 | 41,154 | |||||
| Other intangible assets |
Showing the first 8K of 369K characters. Open the full section