 filings.tools
Item 5. Market for the Registrant’s Common Equity, Related Stockholder Matters and Issuer Purchases of Equity Securities.
3K characters. Original on sec.gov · Markdown
Item 5. Market for the Registrant’s Common Equity, Related Stockholder Matters and Issuer Purchases of Equity Securities.
Our common stock trades on the New York Stock Exchange (“NYSE”) under the symbol “ALB.” The following table sets forth on a per share basis the high and low sales prices for our common stock for the periods indicated, as reported on the NYSE composite transactions reporting system, and the dividends declared per share on our common stock.
| Common Stock Price Range | Dividends Declared Per Share of Common Stock | ||||||||||
| High | Low | ||||||||||
| 2016 | |||||||||||
| First Quarter | $ | 64.33 | $ | 45.78 | $ | 0.305 | |||||
| Second Quarter | $ | 84.99 | $ | 63.40 | $ | 0.305 | |||||
| Third Quarter | $ | 87.29 | $ | 75.11 | $ | 0.305 | |||||
| Fourth Quarter | $ | 92.24 | $ | 76.32 | $ | 0.305 | |||||
| 2017 | |||||||||||
| First Quarter | $ | 107.56 | $ | 86.98 | $ | 0.32 | |||||
| Second Quarter | $ | 116.64 | $ | 103.42 | $ | 0.32 | |||||
| Third Quarter | $ | 137.48 | $ | 105.34 | $ | 0.32 | |||||
| Fourth Quarter | $ | 144.99 | $ | 126.31 | $ | 0.32 |
There were 110,638,449 shares of common stock held by 2,532 shareholders of record as of February 20, 2018. On February 23, 2018, we declared a dividend of $0.335 per share of common stock, payable April 2, 2018. We expect to continue to declare and pay dividends to our shareholders in the future, however, dividends are declared solely at the discretion of our Board of Directors and there is no guarantee that the Board of Directors will continue to declare dividends in the future.
The information required by Item 201(d) of Regulation S-K is contained in our definitive Proxy Statement for our 2018 Annual Meeting of Shareholders to be filed with the SEC pursuant to Regulation 14A under the Exchange Act, or the Proxy Statement, and is incorporated herein by reference.
| Albemarle Corporation and Subsidiaries | ||
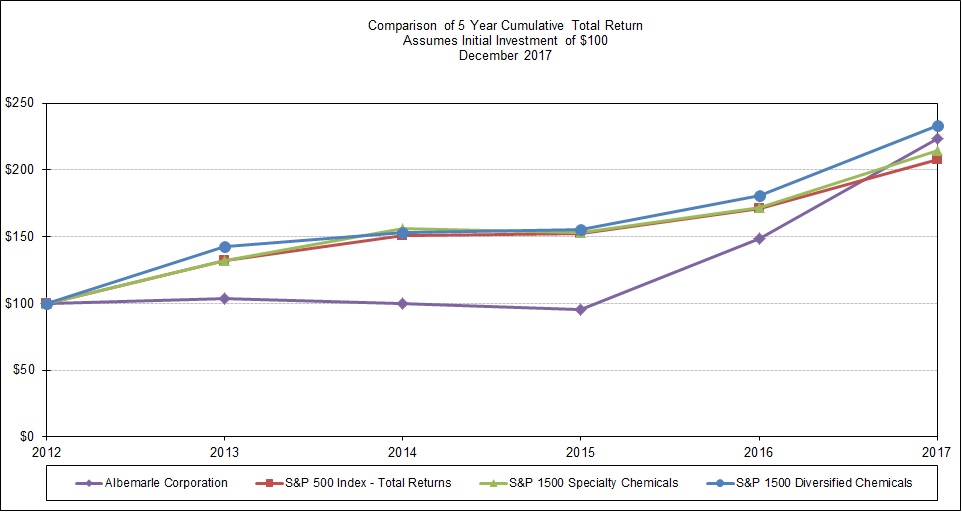
Stock Performance Graph
The graph below shows the cumulative total shareholder return assuming the investment of $100 in our common stock on December 31, 2012 and the reinvestment of all dividends thereafter. The information contained in the graph below is furnished and therefore not to be considered “filed” with the SEC, and is not incorporated by reference into any document that incorporates this Annual Report on Form 10-K by reference.
Previous: Item 4. Mine Safety Disclosures. · Next: Item 6. Selected Financial Data.