 filings.tools
Item 5. MARKET FOR REGISTRANT’S COMMON EQUITY, RELATED STOCKHOLDER MATTERS AND ISSUER PURCHASES OF EQUITY SECURITIES
4K characters. Original on sec.gov ·
Item 5. MARKET FOR REGISTRANT’S COMMON EQUITY, RELATED STOCKHOLDER MATTERS AND ISSUER PURCHASES OF EQUITY SECURITIES
Price Range of Common Stock
Our common stock is quoted on the NASDAQ Global Select Market under the symbol “ALGN.” The following table sets forth the range of high and low per share sales prices as reported for each period indicated:
| High | Low | ||||||
| Year Ended December 31, 2015: | |||||||
| Fourth quarter | $ | 68.48 | $ | 54.69 | |||
| Third quarter | $ | 66.53 | $ | 52.01 | |||
| Second quarter | $ | 64.99 | $ | 51.65 | |||
| First quarter | $ | 64.75 | $ | 51.77 | |||
| Year Ended December 31, 2014: | |||||||
| Fourth quarter | $ | 57.72 | $ | 43.27 | |||
| Third quarter | $ | 57.79 | $ | 51.29 | |||
| Second quarter | $ | 57.50 | $ | 47.22 | |||
| First quarter | $ | 65.10 | $ | 50.37 |
On February 19, 2016, the closing price of our common stock on the NASDAQ Global Market was $63.29 per share. As of February 19, 2016 there were approximately 101 holders of record of our common stock. Because the majority of our shares of outstanding common stock are held by brokers and other institutions on behalf of stockholders, we are unable to estimate the total number of stockholders represented by these record holders.
We have never declared or paid any cash dividends on our common stock. We currently intend to retain any future earnings to fund the development and growth of our business and do not anticipate paying any cash dividends in the foreseeable future.
Performance Graph
Notwithstanding any statement to the contrary in any of our previous or future filings with the SEC, the following information relating to the price performance of our common stock shall not be deemed “filed” with the SEC or “Soliciting Material” under the Securities Exchange Act of 1934, as amended, or subject to Regulation 14A or 14C, or to liabilities of Section 18 of the Exchange Act except to the extent we specifically request that such information be treated as soliciting material or to the extent we specifically incorporate this information by reference.
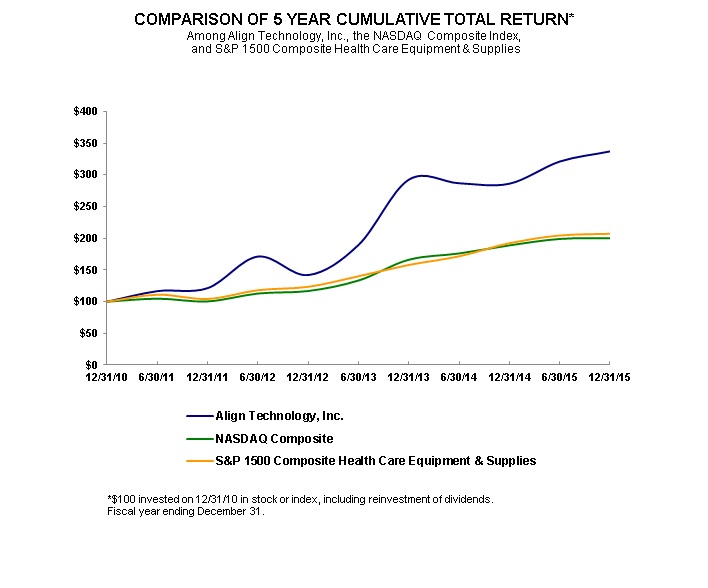
The graph below matches our cumulative 5-year total shareholder return on common stock with the cumulative total returns of the NASDAQ Composite index, and the S&P 1500 Composite Health Care Equipment & Supplies index. The graph tracks the performance of a $100 investment in our common stock, in the peer group, and the index (with the reinvestment of all dividends) from December 31, 2010 to December 31, 2015.
UNREGISTERED SALES OF EQUITY SECURITIES AND USE OF PROCEEDS
Following is a summary of stock repurchases for the three months ended December 31, 2015:
| Period | Total Number of Shares Repurchased | Average Price Paid per Share | Total Number of Shares Repurchased as Part of Publicly Announced Program (1) | Approximate Dollar Value of Shares that May Yet Be Repurchased Under the Program (1) | ||||||||||
| October 1, 2015 through October 31, 2015 | 103,000 | $ | 59.97 | 103,000 | $ | 104,989,100 | ||||||||
| November 1, 2015 through November 30, 2015 | 75,875 | $ | 66.04 | 75,875 | $ | 99,978,175 | ||||||||
| December 1, 2015 through December 31, 2015 | — | $ | — | — | $ | 99,978,175 |
(1) On April 23, 2014, we announced that our Board of Directors had authorized a stock repurchase program pursuant to which we may purchase up to $300.0 million of our common stock over three years, with $100.0 million of that amount authorized to be purchased during each twelve month period. Any purchases under this stock repurchase program may be made, from time-to-time, pursuant to open market purchases (including pursuant to Rule 10b5-1 plans), privately-negotiated transactions, accelerated stock repurchases, block trades or derivative contracts or otherwise in accordance with applicable federal securities laws, including Rule 10b-18 of the Securities Exchange Act of 1934.
As of December 31, 2015, we have approximately $100 million remaining under the April 2014 stock repurchase program. We expect to finance future stock repurchases with current cash on hand.
Previous: Item 4. MINE SAFETY DISCLOSURES · Next: Item 6. SELECTED CONSOLIDATED FINANCIAL DATA