 filings.tools
Item 7. MANAGEMENT’S DISCUSSION AND ANALYSIS OF FINANCIAL CONDITION AND RESULTS OF OPERATIONS
77K characters. Original on sec.gov · Markdown
Item 7. MANAGEMENT’S DISCUSSION AND ANALYSIS OF FINANCIAL CONDITION AND RESULTS OF OPERATIONS
The following discussion and analysis of our financial condition and results of operations should be read together with “Selected Consolidated Financial Data” and our consolidated financial statements and related notes included elsewhere in this Annual Report on Form 10-K.
Overview
Our goal is to establish Invisalign clear aligners as the standard method for treating malocclusion and to establish the iTero intraoral scanner as the preferred scanning device for 3D digital scans, ultimately driving increased product adoption by dental professionals. We intend to achieve this by continued focus and execution of our strategic growth drivers set forth in the Business Strategy section in our Annual Report on Form 10-K.
The successful execution of our business strategy and our results in 2015 and beyond may be affected by a number of other factors including:
| • | Additional Aligners at No Charge. In July 2015, we launched a new product policy called "Additional Aligners at No Charge" that addresses one of our customers' top complaints. Previously, we charged customers for additional aligners ordered beyond those covered by the initial treatment plan. With this product policy change, we no longer distinguish between mid-course corrections and case refinements and allow doctors to order additional aligners to address either treatment need at no charge, subject to certain requirements. These changes were effective for all new Invisalign Full, Teen, and Assist treatments shipped worldwide after July 18, 2015 as well as any open Invisalign Full, Teen and Assist cases as of that date. |
Based on this new product policy, beginning in the third quarter of 2015, we deferred more revenue as a result of providing free additional aligners for eligible treatments. Additionally, since we grandfathered over 1 million open cases, we will recognize lower revenues as additional aligners are shipped. We expect lower amounts of revenue to be recognized for at least the next two years until these cases complete. In the fourth quarter of 2015, the new product policy decreased Clear Aligner net revenues by approximately $7.0 million and reduced operating margin by 2.2% and diluted earnings per share by $0.07 per share. We expect a decrease in Clear Aligner net revenues by approximately $7.0 million to $8.0 million in the first quarter of 2016, and by approximately $25.0 million to $30.0 million in fiscal year 2016. While this product policy change will impact the timing of our revenue recognition, we believe this policy change will result in a significant improvement in customer satisfaction and loyalty, and ultimately increase Invisalign utilization and volume over time.
| • | New Products, Feature Enhancements and Technology Innovation. Product innovation drives greater treatment predictability and clinical applicability, and ease of use for our customers, which supports adoption of Invisalign in their practices. Increasing applicability and treating more complex cases requires that we move away from individual features to more comprehensive solutions so that Invisalign providers can more predictably treat the whole case, such as with Invisalign G5 for deep bite treatment, Invisalign G6 for premolar extraction and ClinCheck Pro, the next generation Invisalign treatment software tool, designed to provide more precise control over final tooth position and to help Invisalign providers achieve their treatment goals. In addition, we began shipping the next generation iTero Element Intraoral Scanner in September 2015 and expect to ramp up our production over the next few quarters accordingly; however, if we are unable to scale production of our iTero Element scanner to meet customer demand, our financial results may be negatively impacted. We believe that over the long-term, clinical solutions and treatment tools will increase adoption of Invisalign and increase sales of our intraoral scanners; however, it is difficult to predict the rate of adoption which may vary by region and channel. |
| • | Invisalign Adoption. Our goal is to establish Invisalign as the treatment of choice for treating malocclusion ultimately driving increased product adoption and frequency of use by dental professionals, also known as "utilization rates." Our quarterly utilization rates for the previous 9 quarters are as follows: |
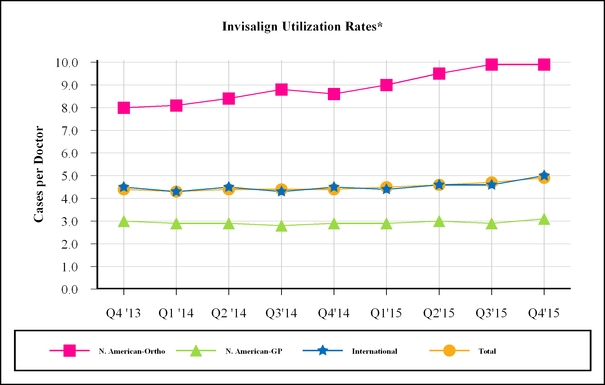
- Invisalign Utilization rates = # of cases shipped divided by # of doctors cases were shipped to
Total utilization in the fourth quarter of 2015 increased to 4.9 cases per doctor compared to 4.4 in the fourth quarter of 2014. Utilization among our North American orthodontist customers reached an all time high of 9.9 cases per doctor in the fourth quarter of 2015 compared to 8.6 in the fourth quarter of 2014. International doctor utilization increased to 5.0 cases in the fourth quarter of 2015 from 4.5 in the fourth quarter of 2014. North American GP doctor utilization increased to 3.1 cases in the fourth quarter of 2015 from 2.9 in the fourth quarter of 2014. The increase in North America orthodontist utilization reflects improvements in product and technology, which continues to strengthen our doctors’ clinical confidence in the use of Invisalign such that they now utilize Invisalign more often and on more complex cases, including their teenage patients. Increased International utilization reflects growth in both the EMEA and Asia Pacific regions driven by go-to-market and sales coverage investments, improving clinical education and support as well as ongoing technology innovation. We expect that over the long-term our utilization rates will gradually improve as a result of advancements in product and technology, which continue to strengthen our doctors’ clinical confidence in the use of Invisalign, however, we expect that our utilization rates may fluctuate from period to period due to a variety of factors, including seasonal trends in our business along with adoption rates of new products and features.
| • | Number of new Invisalign doctors trained. We continue to expand our Invisalign customer base through the training of new doctors. In 2015, Invisalign growth was driven primarily by increased utilization across all regions as well as by the continued expansion of our customer base as we trained a total of 9,795 new Invisalign doctors, of which 56% were trained internationally. |
| • | International Clear Aligner Growth. We will continue to focus our efforts towards increasing adoption of our products by dental professionals in our direct international markets. International volume for 2015 increased 32.5% driven primarily by strong performance in the Asia Pacific region as well as growth in Europe. In 2016, we are continuing to expand in our existing markets through targeted investments in sales coverage and professional marketing and education programs, along with consumer marketing in selected country markets. We expect international revenues to continue to grow at a faster rate than North America for the foreseeable future due to our continued investment in international market expansion, the size of the market opportunity, and our relatively low market penetration in this region. As our international revenues have increased from $219.7 million in 2014 to $250.1 million in 2015, we are increasingly subject to fluctuations in foreign currency exchange rates relative to the U.S. dollar. Although we have historically accepted the exposure to exchange rate movements without using derivative financial instruments to manage risk, in the third quarter of 2015 we initiated a foreign currency economic hedging program to mitigate |
the foreign currency risk in countries where we have significant monetary assets and liabilities denominated in currencies other than the functional currency. The impact from these forward contracts was not material to our financial statements for the year ended December 31, 2015.
In addition, as we plan for further international expansion over the next several years, we must provide better support to our customers in these regions and be geographically closer to their practices. Accordingly, we intend to make further investments in our manufacturing over the next few years to enhance our regional capabilities.
| • | Establish Regional Order Acquisition and Treatment Planning facilities: We intend to establish additional Order Acquisition and Treatment Planning facilities closer to our International customers in order to improve our operational efficiency and provide doctors with a great experience to further improve their confidence in using Invisalign to treat more patients, more often. If demand for our product in 2016 exceeds our current expectations, or if the timing of receipt of case product orders during a given quarter is different from our expectations, we may not be able to fulfill orders in a timely manner, which may negatively impact our financial results and overall business. Conversely, if demand decreases or if we fail to forecast demand accurately, we could be required to record excess capacity charges, which would lower our gross margin. |
| • | Operating Expenses. We expect operating expenses to increase in 2016 compared to 2015 due in part to: |
| ◦ | investments in international expansion in new country markets such as India and Korea; |
| ◦ | the increase in sales and customer support resources; and |
| ◦ | product and technology innovation to address such things as treatment times, indications unique to teens, and predictability. |
We believe that these investments will position us to increase our revenue and continue to grow our market share.
Results of Operations
Net revenues by Reportable Segment Comparison for Year Ended December 31, 2015, 2014 and 2013:
We group our operations into two reportable segments: Clear Aligner segment and Scanner segment.
| • | Our Clear Aligner segment consists of our Invisalign system which includes Invisalign Full, Teen and Assist ("Full Products"), Express/Lite ("Express Products"),Vivera retainers, along with our training and ancillary products for treating malocclusion. |
| • | Our Scanner segment consists of intra-oral scanning systems and additional services available with the intra-oral scanners that provide digital alternatives to the traditional cast models. This segment includes our iTero scanner and OrthoCAD services. |
Net revenues for our Clear Aligner segment by region and our Scanner segment for the year ended December 31, 2015, 2014 and 2013 is as follows (in millions):
| Year Ended | Year Ended | ||||||||||||||||||||||||||||
| December 31, 2015 | December 31, 2014 | Change | December 31, 2014 | December 31, 2013 | Change | ||||||||||||||||||||||||
| Clear Aligner Revenues: | |||||||||||||||||||||||||||||
| North America | $ | 498.7 | $ | 446.6 | $ | 52.1 | 11.7 | % | $ | 446.6 | $ | 408.2 | $ | 38.4 | 9.4 | % | |||||||||||||
| International | 250.1 | 219.7 | 30.4 | 13.8 | % | 219.7 | 161.7 | 58.0 | 35.9 | % | |||||||||||||||||||
| Invisalign non-case net revenues | 51.4 | 46.2 | 5.2 | 11.3 | % | 46.2 | 44.7 | 1.5 | 3.4 | % | |||||||||||||||||||
| Total Clear Aligner net revenues | $ | 800.2 | $ | 712.5 | $ | 87.7 | 12.3 | % | $ | 712.5 | $ | 614.6 | $ | 97.9 | 15.9 | % | |||||||||||||
| Total Scanner net revenues | $ | 45.3 | $ | 49.1 | $ | (3.8 | ) | (7.7 | )% | $ | 49.1 | $ | 45.6 | $ | 3.5 | 7.7 | % | ||||||||||||
| Total net revenues | $ | 845.5 | $ | 761.6 | $ | 83.9 | 11.0 | % | $ | 761.6 | $ | 660.2 | $ | 101.4 | 15.4 | % |
Changes and percentages are based on actual values. Certain tables may not sum or recalculate due to rounding.
Clear Aligner Case Volume by Region
Case volume data which represents Invisalign case shipments by region, for the year ended December 31, 2015, 2014 and 2013 is as follows (in millions):
| Year Ended | Year Ended | ||||||||||||||||||||||
| Region | December 31, 2015 | December 31, 2014 | Change | December 31, 2014 | December 31, 2013 | Change | |||||||||||||||||
| North American Invisalign | 398.4 | 338.5 | 59.9 | 17.7 | % | 338.5 | 313.9 | 24.6 | 7.8 | % | |||||||||||||
| International Invisalign | 184.8 | 139.5 | 45.3 | 32.5 | % | 139.5 | 108.5 | 31.0 | 28.6 | % | |||||||||||||
| Total Invisalign case volume | 583.2 | 478.0 | 105.2 | 22.0 | % | 478.0 | 422.4 | 55.6 | 13.2 | % | |||||||||||||
Changes and percentages are based on actual values. Certain tables may not sum or recalculate due to rounding.
Fiscal Year 2015 compared to Fiscal Year 2014
Total net revenues increased by $83.9 million in 2015 as compared to 2014 primarily as a result of Invisalign case volume growth across all regions and products as well as increased Invisalign non-case revenue.
Clear Aligner - North America
Clear Aligner North America net revenues increased by $52.1 million in 2015 compared to 2014 primarily due to Invisalign case volume growth of approximately $79.0 million across all channels and products. These increases were offset in part by lower average selling prices ("ASP"), which decreased net revenues by $26.9 million. The decrease in ASP was primarily as a result of higher net revenue deferrals of $16.0 million, which includes the impact of our new additional aligner product policy launched in July 2015 of $8.9 million and the impact of higher promotional discounts in 2015 as compared to 2014 of $11.7 million. These decreases in ASP were offset in part by the price increase on our Full Products, effective April 1, 2015.
Clear Aligner - International
Clear Aligner international net revenues increased by $30.4 million in 2015 compared to 2014 primarily driven by Invisalign case volume growth of $71.5 million across all products. This was partially offset by lower ASP which decreased net revenues by approximately $41.1 million. The decrease in ASP was primarily as a result of the unfavorable impact from foreign exchange rates primarily due to the weakening of the Euro compared to the U.S. dollar in 2015 compared to 2014 of $34.5 million, and to a lesser extent higher net revenue deferrals of $7.8 million which includes the impact of our new additional aligner product policy launched in July 2015 of $4.7 million, as well as higher promotional discounts of $6.3 million in 2015 compared to 2014. These decreases were partially offset by an increase in ASP as we transitioned to direct sales in certain Asia Pacific countries and Europe, Middle East and Africa regions, as well as the price increase on our Full Products effective July 1, 2015.
Clear Aligner - Invisalign Non-Case
Invisalign non-case net revenues, consisting of training fees and ancillary product revenues, increased by $5.2 million in 2015 as compared to 2014 primarily due to increased Vivera volume both in North America and International.
Scanner
Scanner net revenues decreased by $3.8 million in 2015 compared to 2014 primarily due to a decrease in scanner revenue, offset in part by a slight increase in services revenue. In March 2015, we announced our next generation scanner which began shipping in September 2015. Net revenues declined in 2015 primarily due to fewer scanners recognized and permanent price reductions on our previous generation scanner. The increase in services revenue was primarily due to an increase in the volume of CAD/CAM services resulting from a larger installed base of scanners.
Fiscal Year 2014 compared to Fiscal Year 2013
Total net revenues increased by $101.4 million in 2014 as compared to 2013 primarily as a result of Invisalign case volume growth across all regions and products as well as increased Invisalign non-case revenue.
Clear Aligner - North America
Clear Aligner North America net revenues increased by $38.4 million in 2014 compared to 2013 primarily due to Invisalign case volume growth of approximately $32.1 million across all channels and products, and, to a lesser extent, higher ASP which contributed approximately $6.3 million to the increase in net revenues. The increase in ASP was primarily a result of increased mid-course correction revenue from higher usage as well as a product mix shift towards higher priced Invisalign products in 2014 compared to 2013. This increase was offset in part by higher promotional discounts in 2014 as compared to 2013.
Clear Aligner - International
Clear Aligner international net revenues increased by $58.0 million in 2014 compared to 2013 primarily driven by Invisalign case volume growth of $46.2 million along with higher ASP which contributed approximately $11.8 million to the increase in net revenues. The increase in ASP was primarily due to the impact from acquiring our distributor in the Asia Pacific region on April 30, 2013 when we began recognizing direct sales of Invisalign products sold in that region at our full ASP rather than the discounted ASP under the distributor agreement, as well as the price increases which were effective July 2013 along with a favorable impact from foreign exchange rates. Foreign exchange rates had a favorable impact on revenues in 2014 as compared to 2013, despite the weakening of the Euro to the U.S. dollar in the last six months of 2014.
Clear Aligner - Invisalign Non-Case
Invisalign non-case net revenues, consisting of training fees and ancillary product revenues, increased by $1.5 million in 2014 as compared to 2013 primarily due to the consolidation of our Vivera product shipments in North America from four shipments per year to one shipment along with increased Vivera volume both in North America and international.
Scanner
Scanner net revenues increased by 7.7%, in 2014 compared to 2013 due to an increase in both services revenue as well as scanner revenue.
The increase in services revenue was primarily due to an increase in the volume of CAD/CAM services resulting from a larger installed base of scanners. The increase in scanner revenue was primarily due to an increase in the number of scanners recognized offset in part by lower scanner ASP as a result of promotional discounts as well as permanent price reductions. The increase was partially offset as 2013 had higher net revenues due to the release of $1.4 million of revenue previously reserved for the iTero upgrade program which was completed in the first quarter of 2013.
Cost of net revenues and gross profit (in millions):
| Year Ended | Year Ended | ||||||||||||||||||||||
| December 31, 2015 | December 31, 2014 | Change | December 31, 2014 | December 31, 2013 | Change | ||||||||||||||||||
| Clear Aligner | |||||||||||||||||||||||
| Cost of net revenues | $ | 172.0 | $ | 149.7 | $ | 22.3 | $ | 149.7 | $ | 129.8 | $ | 19.9 | |||||||||||
| % of net segment revenues | 21.5 | % | 21.0 | % | 21.0 | % | 21.1 | % | |||||||||||||||
| Gross profit | $ | 628.2 | $ | 562.9 | $ | 65.3 | $ | 562.9 | $ | 484.8 | $ | 78.1 | |||||||||||
| Gross margin % | 78.5 | % | 79.0 | % | 79.0 | % | 78.9 | % | |||||||||||||||
| Scanner | |||||||||||||||||||||||
| Cost of net revenues | $ | 33.4 | $ | 33.6 | $ | (0.2 | ) | $ | 33.6 | $ | 32.3 | $ | 1.3 | ||||||||||
| % of net segment revenues | 73.7 | % | 68.3 | % | 68.3 | % | 70.9 | % | |||||||||||||||
| Gross profit | $ | 11.9 | $ | 15.6 | $ | (3.7 | ) | $ | 15.6 | $ | 13.3 | $ | 2.3 | ||||||||||
| Gross margin % | 26.3 | % | 31.7 | % | 31.7 | % | 29.1 | % | |||||||||||||||
| Total cost of net revenues | $ | 205.4 | $ | 183.2 | $ | 22.2 | $ | 183.2 | $ | 162.1 | $ | 21.1 | |||||||||||
| % of net revenues | 24.3 | % | 24.1 | % | 24.1 | % | 24.6 | % | |||||||||||||||
| Gross profit | $ | 640.1 | $ | 578.4 | $ | 61.7 | $ | 578.4 | $ | 498.1 | $ | 80.3 | |||||||||||
| Gross margin % | 75.7 | % | 75.9 | % | 75.9 | % | 75.4 | % |
Changes and percentages are based on actual values. Certain tables may not sum or recalculate due to rounding.
Cost of net revenues for our Clear Aligner and Scanner segments includes salaries for staff involved in the production process, the cost of materials, packaging, shipping costs, depreciation on capital equipment used in the production process, amortization of acquired intangible assets from Cadent, training costs and stock-based compensation.
Fiscal Year 2015 compared to Fiscal Year 2014
Clear Aligner
The gross margin percentage declined in 2015 compared to 2014 due to lower ASP which was partially offset by lower costs per unit.
Scanner
The gross margin percentage decreased in 2015 compared to 2014 due to lower ASP from permanent price reductions on our previous generation scanner and higher manufacturing costs from lower production volumes and higher inventory reserves. This was partially offset by a product mix shift to the lower cost Element scanner which commenced shipping in September.
Fiscal Year 2014 compared to Fiscal Year 2013
Clear Aligner
The gross margin percentage improved slightly in 2014 compared to 2013 due to higher ASP. The ASP improvement was mostly offset by increased manufacturing costs in 2014 when compared to 2013 which benefited from an out of period adjustment (see Note 1 in the financial statements).
Scanner
The gross margin percentage increased in 2014 compared to 2013 due to increased absorption of manufacturing spend from higher production volumes, lower product costs due to product mix and lower inventory reserves. These were partially offset by a lower ASP as a result of price reductions.
Selling, general and administrative (in millions):
| Year Ended | Year Ended | ||||||||||||||||||||||
| December 31, 2015 | December 31, 2014 | Change | December 31, 2014 | December 31, 2013 | Change | ||||||||||||||||||
| Selling, general and administrative | $ | 390.2 | $ | 332.1 | $ | 58.1 | $ | 332.1 | $ | 292.8 | $ | 39.3 | |||||||||||
| % of net revenues | 46.2 | % | 43.6 | % | 43.6 | % | 44.3 | % |
Changes and percentages are based on actual values. Certain tables may not sum or recalculate due to rounding.
Selling, general and administrative expense includes personnel-related costs including payroll, commissions and stock-based compensation for our sales force, marketing and administration in addition to media and advertising expenses, clinical education, trade shows and industry events, product marketing, outside consulting services, legal expenses, depreciation and amortization expense, the medical device excise tax ("MDET") and allocations of corporate overhead expenses including facilities and IT.
Selling, general and administrative expense increased in 2015 compared to 2014 primarily due to higher compensation related costs of $50.1 million as a result of increased headcount, which led to higher salaries, stock based compensation and commissions. In addition, consulting costs increased by $9.7 million primarily due to our enterprise resource planning ("ERP") project. Partially offsetting these increases was the MDET refund of $6.8 million received in the first quarter of 2015.
Selling, general and administrative expense increased in 2014 compared to 2013 primarily due to higher compensation costs of $24.1 million due to increased headcount, including the additional headcount from the acquisition of our APAC distributor and stock based compensation. In addition, we incurred higher advertising and marketing expenses as a result of increased advertising production and marketing campaigns combined with higher costs for trade shows and our Europe and APAC Summits as well as
increases in consulting expenses and credit card processing fees. These increases were offset by lower MDET of $6.8 million as our aligners were no longer subject to the excise tax in 2014 as well as lower outside litigation costs. In March 2014, the IRS informed us that our aligners are not subject to the MDET, which we had been paying and expensing in selling, general and administrative expense in the Consolidated Statements of Operations since January 1, 2013.
Research and development (in millions):
| Year Ended | Year Ended | ||||||||||||||||||||||
| December 31, 2015 | December 31, 2014 | Change | December 31, 2014 | December 31, 2013 | Change | ||||||||||||||||||
| Research and development | $ | 61.2 | $ | 52.8 | $ | 8.4 | $ | 52.8 | $ | 44.1 | $ | 8.7 | |||||||||||
| % of net revenues | 7.2 | % | 6.9 | % | 6.9 | % | 6.7 | % |
Changes and percentages are based on actual values. Certain tables may not sum or recalculate due to rounding.
Research and development expense includes the personnel-related costs and outside consulting expenses associated with the research and development of new products and enhancements to existing products, corporate allocations, facility and facility related costs and stock-based compensation expense.
Research and development expense increased during 2015 compared to 2014 primarily as a result of our investment in obstructive sleep apnea which was terminated in the third quarter of 2015. While we continue to believe that the opportunities in the obstructive sleep apnea market are potentially interesting, we have decided to remain focused on our core business and organic growth opportunities.
Research and development expense increased during 2014 compared to 2013 almost entirely due to higher compensation costs as a result of higher bonuses, stock-based compensation and salaries primarily due to additional headcount.
Impairment of goodwill (in millions):
| Year Ended | Year Ended | ||||||||||||||||||||||
| December 31, 2015 | December 31, 2014 | Change | December 31, 2014 | December 31, 2013 | Change | ||||||||||||||||||
| Impairment of goodwill | $ | — | $ | — | $ | — | $ | — | $ | 40.7 | $ | (40.7 | ) | ||||||||||
| % of net revenues | — | % | — | % | — | % | 6.2 | % |
Changes and percentages are based on actual values. Certain tables may not sum or recalculate due to rounding.
There was no charge for impairment of goodwill recorded in the years ended December 31, 2015 or 2014.
During the first quarter of 2013, we determined that the goodwill for our Scanner reporting unit should be tested for impairment as a result of changes in the competitive environment for intra-oral scanners which caused us to lower our expectations for growth and profitability for our Scanner reporting unit. As a result of our analysis, we recorded a goodwill impairment charge of $40.7 million, none of which was deductible for tax purposes. Refer to Note 5 "Goodwill and Intangible Assets" of our consolidated financial statements for details of the impairment analysis.
Impairment of long-lived assets (in millions):
| Year Ended | Year Ended | ||||||||||||||||||||||
| December 31, 2015 | December 31, 2014 | Change | December 31, 2014 | December 31, 2013 | Change | ||||||||||||||||||
| Impairment of long-lived assets | $ | — | $ | — | $ | — | $ | — | $ | 26.3 | $ | (26.3 | ) | ||||||||||
| % of net revenues | — | % | — | % | — | % | 4.0 | % |
Changes and percentages are based on actual values. Certain tables may not sum or recalculate due to rounding.
There was no charge for impairment of long-lived assets recorded in the year ended December 31, 2015 or 2014.
The impairment of our long-lived assets in 2013 was the result of changes in the competitive environment for intra-oral scanners which caused us to lower our expectations for growth and profitability for our Scanner reporting unit. As a result, we determined that the carrying value of the long-lived assets was not recoverable and therefore recorded an impairment charge of $26.3 million. Refer to Note 5 "Goodwill and Intangible Assets" of our consolidated financial statements for details of the impairment analysis.
Interest and Other income (expense), net (in millions):
| Year Ended | Year Ended | ||||||||||||||||||||||
| December 31, 2015 | December 31, 2014 | Change | December 31, 2014 | December 31, 2013 | Change | ||||||||||||||||||
| Interest and other income (expense), net | $ | (2.5 | ) | $ | (3.2 | ) | $ | 0.7 | $ | (3.2 | ) | $ | (1.3 | ) | $ | (1.9 | ) |
Interest and other income (expense), net, includes foreign currency translation gains and losses, interest income earned on cash, cash equivalents and investment balances and other miscellaneous charges.
Interest and Other income (expense), net, in 2015 increased mainly due to higher interest income on higher balances of cash, cash equivalents and investments offset in part by higher foreign exchange losses primarily due to the strengthening of the U.S. dollar to the Euro and Australian dollar.
Interest and Other income (expense), net, in 2014 decreased due to higher foreign exchange losses primarily as a result of the weakening of the Euro to the U.S. dollar offset slightly by increased interest income earned on higher balances of cash, cash equivalents and investments.
Provision for income taxes (in millions):
| Year Ended | Year Ended | ||||||||||||||||||||||
| December 31, 2015 | December 31, 2014 | Change | December 31, 2014 | December 31, 2013 | Change | ||||||||||||||||||
| Provision for income taxes | $ | 42.1 | $ | 44.5 | $ | (2.4 | ) | $ | 44.5 | $ | 28.8 | $ | 15.7 | ||||||||||
| Effective tax rates | 22.6 | % | 23.4 | % | 23.4 | % | 31.0 | % |
Changes and percentages are based on actual values. Certain tables may not sum or recalculate due to rounding.
Our provision for income taxes was $42.1 million, $44.5 million and $28.8 million for the year ended December 31, 2015, 2014 and 2013, respectively. This represents effective tax rates of 22.6%, 23.4% and 31.0%, respectively. Our effective tax rates in these fiscal years differ from the statutory federal income tax rate of 35% due to certain foreign earnings, primarily from Costa Rica, which are subject to a lower tax rate. The decrease in the effective rate for the year ended December 31, 2015 compared to 2014 is mainly due to an additional $1.8 million tax adjustment recorded in 2014 which related to prior periods. The effective tax rate for the year ended December 31, 2013 also reflects a non-deductible goodwill impairment charge of $40.7 million.
As of December 31, 2015, approximately $359.8 million of undistributed earnings from non-U.S. operations held by our foreign subsidiaries are designated as indefinitely reinvested outside the U.S. Accordingly, no additional U.S. income taxes or additional foreign withholding taxes have been provided thereon. We have sufficient cash reserves in the U.S. and do not intend to repatriate our foreign earnings. We intend to use the undistributed earnings for local operating expansions and to meet local operating working capital needs. If these earnings were distributed in the form of dividends or otherwise, or if the shares of the relevant foreign subsidiaries were sold or otherwise transferred, we would be subject to additional U.S. income taxes subject to an adjustment for foreign tax credits and foreign withholding taxes. Determination of the amount of unrecognized deferred tax liability related to these earnings is not practicable.
We assess the likelihood that we will be able to realize our deferred tax assets quarterly. Should there be a change in our ability to realize our deferred tax assets, our tax provision would increase in the period in which we determine that it is more likely than not that we cannot realize our deferred tax assets. We consider all available evidence, both positive and negative, including historical levels of income, expectations and risks associated with estimates of future taxable income and ongoing prudent and feasible tax planning strategies in assessing the need for a valuation allowance. If it is more likely than not that we do not expect to realize our deferred tax assets, we will increase our provision for taxes by recording a valuation allowance against the deferred tax assets that we estimate will not ultimately be realizable. The available positive evidence at December 31, 2015 included historical operating profits, a projection of future income and other objectively verifiable evidence. As of December 31, 2015, we
believed, except for the items noted in the subsequent paragraph, that is was more likely than not that the amount of deferred tax assets recorded on the balance sheet will be realized.
As of December 31, 2015, we maintained a valuation allowance of $31.7 million against our deferred tax assets which primarily relate to Israel operating loss carryforwards and Australia capital loss carryforwards. These net operating and capital loss carryforwards would result in an income tax benefit if we were to conclude it is more likely than not that the related deferred tax assets will be realized. The valuation allowance decreased from December 31, 2014 by $0.8 million due to the decrease of foreign tax rate which resulted in lower tax impact on net operating and capital loss carryforwards. We are currently evaluating an internal restructuring which may result in a future reassessment of our need for a valuation allowance against these deferred tax assets. As a result it is possible that we may realize a tax benefit which may have a material impact on the financial statements within the next twelve months.
As of December 31, 2015, we have California net operating loss carryforwards of approximately $20.5 million, which, if not used, will begin to expire in 2016. In the event of a change in ownership, as defined under federal and state tax laws, our net operating loss and tax credit carryforwards may be subject to annual limitations. The annual limitations may result in the expiration of the net operating loss and tax credit carryforwards before utilization. As of December 31, 2015, we had California research credit carryforwards of approximately $3.9 million that can be carried forward indefinitely.
We account for uncertain tax positions pursuant to authoritative guidance based on a two-step approach to recognize and measure uncertain tax positions taken or expected to be taken in a tax return. We first determine whether it is more likely than not that a tax position will be sustained upon audit based on its technical merits. If a tax position meets the more-likely-than-not recognition threshold it is then measured to determine the amount of benefit to recognize in the financial statements. The tax position is measured as the largest amount of benefit that is more than 50 percent likely to be realized upon ultimate settlement. We adjust our uncertain tax positions due to changing facts and circumstances, such as the closing of a tax audit, or refinement of estimates due to new information. To the extent the final outcome of these matters is different than the amounts recorded, such differences will impact our tax provision in our Consolidated Statements of Operations in the period in which such determination is made.
Our total gross unrecognized tax benefits, excluding interest, was $39.4 million and $33.1 million as of December 31, 2015 and 2014, respectively, all of which would impact our effective tax rate if recognized. We have elected to recognize interest and penalties related to unrecognized tax benefits as a component of income taxes. The accrued interest as of December 31, 2015 was $0.7 million. We do not expect any significant changes to the amount of unrecognized tax benefit within the next twelve months.
In November 2015, the Financial Accounting Standards Board ("FASB") issued Accounting Standards Update ("ASU") 2015-17, Income Taxes (Topic 740), to simplify the presentation of deferred income taxes. Under the new standard, both deferred tax liabilities and assets are required to be classified as noncurrent in a classified balance sheet. ASU 2015-17 will become effective for fiscal years, and the interim periods within those years, beginning after December 15, 2016, with early adoption permitted. The new guidance has been adopted on a prospective basis by the Company for the year ended December 31, 2015, thus resulting in the reclassification of $30.1 million of current deferred tax assets to noncurrent on the accompanying Consolidated Balance Sheet. The prior reporting period was not retrospectively adjusted. The adoption of this guidance had no impact on our Consolidated Statements of Operations or Consolidated Statements of Comprehensive Income.
We file U.S. federal, U.S. state, and non-U.S. income tax returns. Our major tax jurisdictions are U.S. federal and the State of California. For U.S. federal and state tax returns, we are no longer subject to tax examinations for years before 2000. With few exceptions, we are no longer subject to examination by foreign tax authorities for years before 2007. Our subsidiary in Israel is under audit by the local tax authorities for calendar years 2006 through 2012. We are currently under audit by the California Franchise Tax Board for fiscal year 2011, 2012 and 2013.
In June 2009, the Costa Rica Ministry of Foreign Trade, an agency of the Government of Costa Rica, granted a twelve year extension of certain income tax incentives, which were previously granted in 2002. The incentive tax rates will expire in various years beginning in 2017. Under these incentives, all of the income in Costa Rica during these twelve year incentive periods is subject to reduced rate of Costa Rica income tax. In order to receive the benefit of these incentives, we must hire specified numbers of employees and maintain certain minimum levels of fixed asset investment in Costa Rica. If we do not fulfill these conditions for any reason, our incentive could lapse, and our income in Costa Rica would be subject to taxation at higher rates, which could have a negative impact on our operating results. The Costa Rica corporate income tax rate that would apply, absent the incentives, is 30% for 2015, 2014 and 2013. As a result of these incentives, our income taxes were reduced by $32.7 million, $32.5 million and $27.7 million for the year ended December 31, 2015, 2014 and 2013, respectively, representing a benefit to diluted net income per share of $0.40, $0.40 and $0.34 in 2015, 2014 and 2013, respectively.
Liquidity and Capital Resources
We fund our operations from product sales. As of December 31, 2015 and 2014, we had the following cash and cash equivalents, and short-term and long-term investments (in thousands):
| Year Ended December 31, | |||||||
| 2015 | 2014 | ||||||
| Cash and cash equivalents | $ | 167,714 | $ | 199,871 | |||
| Short-term investments | 359,581 | 254,787 | |||||
| Long-term investments | 151,370 | 147,892 | |||||
| Total | $ | 678,665 | $ | 602,550 |
Cash flows (in thousands):
| Year Ended December 31, | |||||||||||
| 2015 | 2014 | 2013 | |||||||||
| Net cash flow provided by (used in): | |||||||||||
| Operating activities | $ | 237,997 | $ | 226,899 | $ | 185,976 | |||||
| Investing activities | (166,361 | ) | (201,627 | ) | (210,734 | ) | |||||
| Financing activities | (100,786 | ) | (66,420 | ) | (38,171 | ) | |||||
| Effects of exchange rate changes on cash and cash equivalents | (3,007 | ) | (1,934 | ) | (504 | ) | |||||
| Net decrease in cash and cash equivalents | $ | (32,157 | ) | $ | (43,082 | ) | $ | (63,433 | ) |
As of December 31, 2015, we had $678.7 million in cash, cash equivalents, and short-term and long-term marketable securities. Cash equivalents and marketable securities are comprised of money market funds and highly liquid debt instruments which primarily include commercial paper, corporate bonds, U.S. dollar denominated foreign corporate bonds, U.S. government agency bonds, municipal bonds and asset-backed securities. Other uses of cash include our stock repurchase program, which is described below.
As of December 31, 2015, approximately $442.5 million of cash, cash equivalents and short-term and long-term marketable securities was held by our foreign subsidiaries. Amounts held by foreign subsidiaries are generally subject to U.S. income taxation on repatriation to the U.S. The costs to repatriate our foreign earnings to the U.S. would likely be material; however, our intent is to permanently reinvest our earnings from foreign operations, and our current plans do not require us to repatriate them to fund our U.S. operations as we generate sufficient domestic operating cash flow and have access to external funding under our current revolving line of credit.
Operating Activities
For the year ended December 31, 2015, cash flows from operations of $238.0 million resulted primarily from our net income of approximately $144.0 million as well as the following:
Significant non-cash activities
| • | Stock-based compensation was $52.9 million related to our equity incentive compensation granted to employees and directors. |
| • | Depreciation and amortization of $18.0 million related to our fixed assets and acquired intangible assets. |
| • | Excess tax benefits from our share-based compensation arrangements of $10.4 million. |
Significant changes in working capital
| • | An increase of $41.9 million in deferred revenues corresponding to higher product sales along with the increased deferrals as a result of the change to our new additional aligner product policy in July 2015, |
| • | an increase of $19.5 million in accrued and other long-term liabilities primarily due to an increase in income tax payable along with other accruals due to timing of payment, and |
| • | an increase of $40.8 million in accounts receivable which is a result of the increase in net revenues. |
For the year ended December 31, 2014, cash flows from operations of $226.9 million resulted primarily from our net income of approximately $145.8 million as well as the following:
Significant non-cash activities
| • | Stock-based compensation was $39.8 million related to our equity incentive compensation granted to employees and directors. |
| • | Deferred taxes of $25.5 million primarily due to the utilization of deferred tax assets. |
| • | Excess tax benefits from our share-based compensation arrangements of $21.4 million. |
| • | Depreciation and amortization of $17.9 million related to our fixed assets and acquired intangible assets. |
Significant changes in working capital
| • | An increase of $27.2 million in accounts receivable which is a result of the increase in net revenues, |
| • | an increase of $22.7 million in accrued and other long-term liabilities primarily due to an increase in income tax payable along with other accruals due to timing of payment, and |
| • | an increase of $15.8 million in deferred revenues corresponding to the increases in revenues. |
For the year ended December 31, 2013, cash flows from operations of $186.0 million resulted primarily from our net income of approximately $64.3 million as well as the following:
Significant non-cash activities
| • | Impairment of goodwill related to our Scanner reporting unit was $40.7 million. |
| • | Impairment of long-lived assets related to our Scanner reporting unit was $26.3 million. |
| • | Excess tax benefits from our share-based compensation arrangements of $27.1 million. |
| • | Stock-based compensation was $26.4 million related to our equity incentive compensation granted to employees and directors. |
| • | Depreciation and amortization of $16.8 million related to our fixed assets and acquired intangible assets. |
| • | Deferred taxes of $21.2 million primarily due to the utilization of deferred tax assets. |
Significant changes in working capital
| • | An increase of $12.0 million in accounts receivable due to the increase in net revenues, |
| • | an increase of $9.7 million in accrued and other long-term liabilities due to compensation and bonuses accruals along with higher sales rebates, and |
| • | an increase of $14.9 million in deferred revenue primarily due to higher product sales along with additional deferrals as a result of our mid-course correction policy change in June 2013. |
Investing Activities
Net cash used in investing activities was $166.4 million for the year ended December 31, 2015, which primarily consisted of purchases of marketable securities of $447.1 million and property, plant and equipment purchases of $53.5 million for additional manufacturing capacity and infrastructure including a project to implement a new enterprise resource planning system which we started in late 2014. These uses were partially offset by $334.1 million of maturities and sales of our marketable securities.
For 2016, we expect to invest $55.0 million to $65.0 million on capital expenditures primarily for additional manufacturing capacity and to establish order acquisition and treatment planning facility and our ERP implementation. Although we believe our current investment portfolio has little risk of impairment, we cannot predict future market conditions or market liquidity and can provide no assurance that our investment portfolio will remain unimpaired.
Net cash used in investing activities was $201.6 million for the year ended December 31, 2014, which primarily consisted of purchases of marketable securities of $437.2 million and property, plant and equipment purchases of $24.1 million. These uses were partially offset by $259.8 million of maturities and sales of our marketable securities.
Net cash used in investing activities was $210.7 million for the year ended December 31, 2013, which primarily consisted of our purchase of marketable securities of $303.9 million and property and equipment purchases of $19.4 million along with $7.7 million for the acquisition of our Asia Pacific distributor in April 2013. These uses were partially offset by $122.7 million of maturities and sales of our marketable securities.
Financing Activities
Net cash used by financing activities was $100.8 million for the year ended December 31, 2015 resulting from repurchases of our common stock of $101.8 million (Refer to Note 10 "Common Stock Repurchase Program", of the Notes to consolidated financial statements for details of the stock repurchase program) and $20.7 million of payroll taxes paid for our employees' vesting of restricted stock units ("RSUs") through share withholdings, partially off-set by proceeds from issuance of common stock of $11.3 million and $10.4 million from excess tax benefit from our share-based compensation arrangements.
Net cash used by financing activities was $66.4 million for the year ended December 31, 2014 resulting from repurchases of our common stock of $98.2 million and $7.6 million of payroll taxes paid for our employees' vesting of RSUs through share withholdings, partially off-set by proceeds from issuance of common stock of $18.0 million and $21.4 million from excess tax benefit from our share-based compensation arrangements.
Net cash used by financing activities was $38.2 million for the year ended December 31, 2013 resulting from repurchases of our common stock of $95.1 million and $4.4 million of payroll taxes paid for our employees' vesting of restricted stock units through share withholdings, partially off-set by proceeds from issuance of common stock of $34.2 million and $27.1 million from excess tax benefit from our share-based compensation arrangements.
Net proceeds from the issuance of our common stock related to the exercise of employee stock options have historically been a significant component of our liquidity; however, in 2006, we began granting RSUs which, unlike stock options, do not generate cash from exercises. As a result, we will continue to generate less cash from the proceeds of the sale of our common stock in future periods. In addition, because restricted stock units are taxable to the individuals when they vest, the number of shares we issue to each of our employees will be net of applicable withholding taxes which will be paid by us on their behalf. During 2015, 2014 and 2013, we paid $20.7 million, $7.6 million and $4.4 million, respectively, for taxes related to RSUs that vested during the periods. The cash paid for taxes related to RSUs in 2015 increased in comparison to 2014 due to the Company changing its policy in mid 2014 to pay for employees' payroll taxes related to their vesting RSUs instead of requiring employees to sell to cover for their payroll taxes.
Stock Repurchase
On April 23, 2014, we announced that our Board of Directors had authorized a stock repurchase program pursuant to which we may purchase up to $300.0 million of our common stock over three years, with $100.0 million of that amount authorized to be purchased during each twelve month period. Any purchases under this stock repurchase program may be made, from time-to-time, pursuant to open market purchases (including pursuant to Rule 10b5-1 plans), privately-negotiated transactions, accelerated stock repurchases, block trades or derivative contracts or otherwise in accordance with applicable federal securities laws, including Rule 10b-18 of the Securities Exchange Act of 1934.
As part of our $300.0 million stock repurchase program, we entered into an accelerated share repurchase agreement ("ASR") with Goldman, Sachs & Co. on April 28, 2014 to repurchase $70.0 million of our common stock. We paid $70.0 million on April 29, 2014 and received an initial delivery of approximately 1.0 million shares. The ASR was completed on July 29, 2014 with a final delivery of approximately 0.4 million shares. We received a total of approximately 1.4 million shares under the ASR for an average purchase price per share of $51.46, which all shares were retired. The final number of shares repurchased was based on our volume-weighted average stock price during the term of the transaction, less an agreed upon discount. During 2014, we repurchased on the open market approximately 0.6 million shares of our common stock at an average price of $50.93 per share, including commissions, for an aggregate purchase price of approximately $28.2 million. All repurchased shares were retired.
In January 2015, our Board of Directors authorized the repurchase of the next $100.0 million under the repurchase program which we anticipate completing within twelve months. On April 28, 2015, we entered into an accelerated stock repurchase agreement ("2015 ASR") to repurchase $70.0 million of our common stock. The 2015 ASR was completed on July 23, 2015. We received a total of approximately 1.2 million shares for an average share price of $60.52 under the 2015 ASR, which were all retired. The
final number of shares repurchased was based on our volume-weighted average stock price during the term of the transaction, less an agreed upon discount. In addition, during the year ended December 31, 2015, we repurchased on the open market approximately 0.5 million shares of our common stock at an average price of $58.89 per share, including commissions, for an aggregate purchase price of $31.8 million. All repurchased shares were retired. As of December 31, 2015, we have approximately $100.0 million remaining under the April 2014 stock repurchase program. We expect to finance future stock repurchases with current cash on hand.
Credit Facility
On March 22, 2013, we entered into a credit facility for a $50.0 million revolving line of credit, with a $10.0 million letter of credit sublimit, and has a maturity date on March 22, 2016. (Refer to Note 7 "Credit Facility", of the Notes to consolidated financial statements for details of the credit facility).
Contractual Obligations/Off Balance Sheet Arrangements
The impact that our contractual obligations as of December 31, 2015 are expected to have on our liquidity and cash flows in future periods is as follows (in thousands):
| Payments Due by Period | |||||||||||||||||||
| Total | Less than 1 Year | 1-3 Years | 3-5 Years | More than 5 Years | |||||||||||||||
| Operating lease obligations | $ | 19,750 | $ | 10,236 | $ | 8,553 | $ | 853 | $ | 108 | |||||||||
| Unconditional purchase obligations | 74,569 | 74,569 | — | — | — | ||||||||||||||
| Total contractual cash obligations | $ | 94,319 | $ | 84,805 | $ | 8,553 | $ | 853 | $ | 108 |
Our contractual obligations table above excludes approximately $40.1 million of non-current uncertain tax benefits which are included in other long-term obligations and deferred tax assets on our balance sheet as of December 31, 2015. We have not included this amount because we cannot make a reasonably reliable estimate regarding the timing of settlements with taxing authorities, if any.
We had no off-balance sheet arrangements as defined in Regulation S-K Item 303(a) (4) as of December 31, 2015.
We believe that our current cash and cash equivalents and marketable debt securities combined with our positive cash flows from operations will be sufficient to fund our operations for at least the next 12 months. If we are unable to generate adequate operating cash flows, we may need to seek additional sources of capital through equity or debt financing, collaborative or other arrangements with other companies, bank financing and other sources in order to realize our objectives and to continue our operations. There can be no assurance that we will be able to obtain additional debt or equity financing on terms acceptable to us, or at all. If adequate funds are not available, we may need to make business decisions that could adversely affect our operating results such as modifications to our pricing policy, business structure or operations. Accordingly, the failure to obtain sufficient funds on acceptable terms when needed could have a material adverse effect on our business, results of operations and financial condition.
Indemnification Provisions
In the normal course of business to facilitate transactions in our services and products, we indemnify customers, vendors, lessors, and other parties with respect to certain matters, including, but not limited to, services to be provided by us and intellectual property infringement claims made by third parties. In addition, we have entered into indemnification agreements with our directors and certain of our officers that will require us, among other things, to indemnify them against certain liabilities that may arise by reason of their status or service as directors or officers. Several of these agreements limit the time within which an indemnification claim can be made and the amount of the claim.
It is not possible to make a reasonable estimate of the maximum potential amount under these indemnification agreements due to the unique facts and circumstances involved in each particular agreement. Additionally, we have a limited history of prior indemnification claims and the payments we have made under such agreements have not had a material adverse effect on our results of operations, cash flows, or financial position. However, to the extent that valid indemnification claims arise in the future, future payments by us could be significant and could have a material adverse effect on our results of operations or cash flows in a particular period. As of December 31, 2015, we did not have any material indemnification claims that were probable or reasonably possible.
Critical Accounting Policies and Estimates
Management’s discussion and analysis of our financial condition and results of operations is based upon our consolidated financial statements, which have been prepared in accordance with accounting principles generally accepted in the United States of America. The preparation of financial statements requires management to make estimates and judgments that affect the reported amounts of assets and liabilities, revenues and expenses and disclosures at the date of the financial statements. We evaluate our estimates on an on-going basis, including those related to revenue recognition, stock-based compensation, goodwill and finite-lived assets and related impairment, and income taxes. We use authoritative pronouncements, historical experience and other assumptions as the basis for making estimates. Actual results could differ from those estimates.
We believe the following critical accounting policies and estimates affect our more significant judgments used in the preparation of our consolidated financial statements. For further information on all of our significant accounting policies, see Note 1 "Summary of Significant Accounting Policies", of the Notes to consolidated financial statements under Item 8.
Revenue Recognition
We enter into sales arrangements that may consist of multiple deliverables of our products and services where certain elements of the sales arrangement are not delivered in one reporting period. We measure and allocate revenue according to the accounting guidance for multiple-deliverable revenue arrangements in Accounting Standards Update (“ASU”) 2009-13, Multiple-Deliverable Revenue Arrangements-a consensus of the Financial Accounting Standard Board (“FASB”) Emerging Issues Task Force.
Each element within a multiple-element arrangement is accounted for as a separate unit of accounting provided the following criteria are met: the delivered products or services have value to the customer on a standalone basis; and for an arrangement that includes a general right of return relative to the delivered products or services, delivery or performance of the undelivered product or service is considered probable and is substantially controlled by us. We consider a deliverable to have standalone value if the product or service is sold separately by us or another vendor or could be resold by the customer. Further, our revenue arrangements generally do not include a general right of return relative to the delivered products. The arrangement consideration is then allocated to each element, delivered or undelivered, based on the relative selling price of each unit of accounting based first on vendor-specific objective evidence (“VSOE”) if it exists, second on third-party evidence (“TPE”) if it exists, or on best estimated selling price (“BESP”) if neither VSOE nor TPE exist (a description as to how we determine VSOE, TPE, and BESP is provided below).
| • | VSOE - In most instances, this applies to products and services that are sold separately in stand-alone arrangements. We determine VSOE based on pricing and discounting practices for the specific product or service when sold separately, considering geographical, customer, and other economic or marketing variables, as well as renewal rates or stand-alone prices for the service element(s). |
| • | TPE - If we cannot establish VSOE of selling price for a specific product or service included in a multiple-element arrangement, we use third-party evidence of selling price. We determine TPE based on sales of comparable amount of similar products or service offered by multiple third parties considering the degree of customization and similarity of product or service sold. |
| • | BESP - The best estimated selling price represents the price at which we would sell a product or service if it were sold on a stand-alone basis. When VSOE or TPE do not exist for all elements, we determine BESP for the arrangement element based on sales, cost and margin analysis, as well as other inputs based on our pricing practices. Adjustments for other market and Company-specific factors are made as deemed necessary in determining BESP. We regularly review our estimates of selling price and maintain internal controls over the establishment and update of these estimates. |
Judgment is required to properly identify the accounting units of the multiple deliverable transactions, to determine the best estimated selling price for each accounting unit, and to determine the manner in which revenue should be allocated among the accounting units. Further, while changes in the allocation of the best estimated selling price between the accounting units will not affect the amount of total revenue recognized for a particular arrangement, any material changes in these allocations could impact the timing of revenue recognition, which could have a material effect on our financial position and results of operations.
Clear Aligner
We enter into arrangements (“treatment plans”) that involve multiple future product deliverables. Invisalign Full, Invisalign Teen, and Invisalign Assist products include optional Additional Aligners at no charge for a period of up to five years after initial shipment. Invisalign Teen also includes up to six optional replacement aligners in the price of the product and may be ordered by the dental professional any time throughout treatment. Invisalign Lite includes one optional case refinement in the price of the
product. Case refinement is a finishing tool used to adjust a patient's teeth to the desired final position and may be elected by the dental professional at any time during treatment, however, it is generally ordered in the last stages of orthodontic treatment.
We determined that our treatment plans, except Invisalign Assist with progress tracking, comprise the following deliverables which also represent separate units of accounting: single-batched aligners, additional aligners, case refinement, and replacement aligners. We allocate revenue for each treatment plan based on each unit's relative selling price based on BESP and recognize the revenue upon the delivery of each unit in the treatment plan.
For Invisalign Assist with the progress tracking feature, aligners and services are provided to the dental professional every nine stages (“a batch”). We are able to reliably estimate the number of batches which are expected to be shipped for each case based upon our historical experience. The amounts allocated to this deliverable are recognized on a prorated basis as each batch is shipped.
Scanners and Services
We sell intra-oral scanners and CAD/CAM services through both our direct sales force and distribution partners. The intra-oral scanner sales price includes one year of warranty, and unlimited scanning services. The customer may, for additional fees, also select extended warranty and unlimited scanning services for periods beyond the initial year. When intra-oral scanners are sold with an unlimited scanning service agreement and/or extended warranty, we allocate revenue based on each element's relative selling price.We estimate the selling price of each element, as if it is sold on a stand-alone basis, taking into consideration historical prices as well as our discounting strategies.
Stock-based Compensation Expense
We recognize stock-based compensation cost for only those shares ultimately expected to vest on a straight-line basis over the requisite service period of the award. We use the Black-Scholes option pricing model to determine the fair value of stock options and employee stock purchase plan shares. We estimate the fair value of market-performance based restricted stock units using a Monte Carlo simulation model which requires the input of assumptions, including expected term, stock price volatility and the risk-free rate of return. In addition, judgment is required in estimating the number of stock-based awards that are expected to be forfeited. Forfeitures are estimated based on historical experience at the time of grant and revised, if necessary, in subsequent periods if actual forfeitures differ from those estimates. The assumptions used in calculating the fair value of share-based payment awards represent management’s best estimates, but these estimates involve inherent uncertainties and the application of management’s judgment. As a result, if factors change and we use different assumptions, our stock-based compensation expense could be materially different in the future.
Goodwill and finite-lived acquired intangible assets
Goodwill represents the excess of the purchase price paid over the fair value of tangible and identifiable intangible net assets acquired in business combinations and is allocated to the reporting units based on relative synergies generated.
Our intangible assets primarily consist of intangible assets acquired as part of acquisitions and are amortized using the straight-line method over their estimated useful lives, reflecting the period in which the economic benefits of the assets are expected to be realized.
Impairment of goodwill, finite-lived acquired intangible assets and long-lived assets
Goodwill
We evaluate goodwill for impairment at least annually on November 30th or more frequently if indicators are present, an event occurs or circumstances changes that suggest an impairment may exist and that it would more likely than not reduce the fair value of a reporting unit below its carrying amount. The allocation of goodwill to the respective reporting unit is based on relative synergies generated as a result of an acquisition.
We perform an initial assessment of qualitative factors to determine whether the existence of events and circumstances leads to a determination that it is more likely than not that the fair value of a reporting unit is less than its carrying amount. In performing the qualitative assessment, we identify and consider the significance of relevant key factors, events, and circumstances that affect the fair value of our reporting units. These factors include external factors such as macroeconomic, industry, and market conditions, as well as entity-specific factors, such as our actual and planned financial performance. We also give consideration to the difference
between the reporting unit fair value and carrying value as of the most recent date a fair value measurement was performed. If, after assessing the totality of relevant events and circumstances, we determine that it is more likely than not that the fair value of the reporting unit exceeds its carrying value and there is no indication of impairment, no further testing is performed; however, if we conclude otherwise, the first step of the two-step impairment test is performed by estimating the fair value of the reporting unit and comparing it with its carrying value, including goodwill. Refer to Note 5 "Goodwill and Intangible Assets" of Notes to consolidated financial statements for details of the impairment analysis.
Finite-lived intangible assets and long-lived assets
We evaluate long-lived assets (including finite-lived intangible assets) for impairment whenever events or changes in circumstances indicate that the carrying amount of an asset group may not be recoverable. An asset or asset group is considered impaired if its carrying amount exceeds the future undiscounted net cash flows the asset or asset group is expected to generate. If an asset or asset group is considered to be impaired, the impairment to be recognized is calculated as the amount by which the carrying amount of the asset or asset group exceeds its fair market value. Our estimates of future cash flows attributable to our long-lived assets require significant judgment based on our historical and anticipated results and are subject to many factors. Factors we consider important which could trigger an impairment review include significant negative industry or economic trends, significant loss of customers and changes in the competitive environment. The estimation of fair value utilizing a discounted cash flow approach includes numerous uncertainties which require our significant judgment when making assumptions of expected growth rates and the selection of discount rates, as well as assumptions regarding general economic and business conditions, and the structure that would yield the highest economic value, among other factors. Refer to Note 5 "Goodwill and Intangible Assets" of Notes to consolidated financial statements for details of the impairment analysis.
Accounting for Income Taxes
We make certain estimates and judgments in determining income tax expense for financial statement purposes. These estimates and judgments occur in the calculation of certain tax assets and liabilities, which arise from differences in the timing of recognition of revenue and expense for tax and financial statement purposes.
As part of the process of preparing our consolidated financial statements, we are required to estimate our income taxes in each of the jurisdictions in which we operate. This process involves us estimating our current tax exposure under the applicable tax laws and assessing temporary differences resulting from differing treatment of items for tax and accounting purposes. These differences result in deferred tax assets and liabilities, which are included in our Consolidated Balance Sheets.
We account for uncertainty in income taxes pursuant to authoritative guidance based on a two-step approach to recognize and measure uncertain tax positions taken or expected to be taken in a tax return. The first step is to determine if the weight of available evidence indicates that it is more likely than not that the tax position will be sustained on audit based on its technical merits, including resolution of any related appeals or litigation processes. The second step is to measure the tax benefit as the largest amount that is more than 50% likely to be realized upon ultimate settlement. We adjust reserves for our uncertain tax positions due to changing facts and circumstances, such as the closing of a tax audit, or refinement of estimates due to new information. To the extent that the final outcome of these matters is different than the amounts recorded, such differences will impact our tax provision in our Consolidated Statements of Operations in the period in which such determination is made.
We assess the likelihood that we will be able to realize our deferred tax assets. Should there be a change in our ability to realize our deferred tax assets, our tax provision would increase in the period in which we determine that it is more likely than not that we cannot realize our deferred tax assets. We consider all available evidence, both positive and negative, including historical levels of income, expectations and risks associated with estimates of future taxable income and ongoing prudent and feasible tax planning strategies in assessing the need for a valuation allowance. If it is more likely than not that we will not realize our deferred tax assets, we will increase our provision for taxes by recording a valuation allowance against the deferred tax assets that we estimate will not ultimately be realized.
Recent Accounting Pronouncements
See Note 1 “Summary of Significant Accounting Policies” in the Notes to consolidated financial statements in Item 8 for a full description of recent accounting pronouncements, including the expected dates of adoption and estimated effects on results of operations and financial condition, which is incorporated herein.
Previous: Item 6. SELECTED CONSOLIDATED FINANCIAL DATA · Next: Item 7A. QUANTITATIVE AND QUALITATIVE DISCLOSURES ABOUT MARKET RISK