 filings.tools
Align Technology 10-K 2023-12-31
Filed 2024-02-28. 23 sections, 479K characters. Original on sec.gov · Markdown · JSON
Cover and table of contents
UNITED STATES
SECURITIES AND EXCHANGE COMMISSION
Washington, D.C. 20549
FORM 10-K
(Mark One)
| ☒ | ANNUAL REPORT PURSUANT TO SECTION 13 OR 15(d) OF THE SECURITIES EXCHANGE ACT OF 1934 |
For the fiscal year ended December 31, 2023
or
| ☐ | TRANSITION REPORT PURSUANT TO SECTION 13 OR 15(d) OF THE SECURITIES EXCHANGE ACT OF 1934 |
For the transition period from to
Commission file number: 000-32259
ALIGN TECHNOLOGY, INC.
(Exact name of registrant as specified in its charter)
| Delaware | 94-3267295 | ||||
| (State or other jurisdiction of incorporation or organization) | (I.R.S. Employer Identification Number) |
410 North Scottsdale Road, Suite 1300
Tempe, Arizona 85288
(Address of principal executive offices, including zip code)
(602) 742-2000
(Registrant’s telephone number, including area code)
Securities registered pursuant to Section 12(b) of the Act:
| Title of each class | Trading Symbol(s) | Name of each exchange on which registered | ||||||
| Common Stock, $0.0001 par value | ALGN | The NASDAQ Stock Market LLC | ||||||
| (NASDAQ Global Select Market) |
Securities registered pursuant to Section 12(g) of the Act: None
Indicate by check mark if the registrant is a well-known seasoned issuer, as defined in Rule 405 of the Securities Act. Yes ☒ No ☐
Indicate by check mark if the registrant is not required to file reports pursuant to Section 13 or Section 15(d) of the Exchange Act. Yes ☐ No ☒
Indicate by check mark whether the registrant (1) has filed all reports required to be filed by Section 13 or 15(d) of the Securities Exchange Act of 1934 during the preceding 12 months (or for such shorter period that the registrant was required to file such reports), and (2) has been subject to such filing requirements for the past 90 days. Yes ☒ No ☐
Indicate by check mark whether the registrant has submitted electronically every Interactive Data File required to be submitted pursuant to Rule 405 of Regulation S-T (§232.405 of this chapter) during the preceding 12 months (or for such shorter period that the registrant was required to submit such files). Yes ☒ No ☐
Indicate by check mark whether the registrant is a large accelerated filer, an accelerated filer, a non-accelerated filer, a smaller reporting company, or an emerging growth company. See definitions of “large accelerated filer,” “accelerated filer,” “smaller reporting company,” and “emerging growth company” in Rule 12b-2 of the Exchange Act. (Check one):
| Large accelerated filer | ☒ | Accelerated filer | ☐ | ||||||||
| Non-accelerated filer | ☐ | Smaller reporting company | ☐ | ||||||||
| Emerging growth company | ☐ | ||||||||||
| If an emerging growth company, indicate by check mark if the registrant has elected not to use the extended transition period for complying with any new or revised financial accounting standards provided pursuant to Section 13(a) of the Securities Act. ☐ |
Indicate by check mark whether the Registrant has filed a report on and attestation to its management’s assessment of the effectiveness of its internal control over financial reporting under Section 404(b) of the Sarbanes-Oxley Act (15 U.S.C. 7262(b)) by the registered public accounting firm that prepared or issued its audit report. ☒
If securities are registered pursuant to Section 12(b) of the Act, indicate by check mark whether the financial statements of the registrant included in the filing reflect the correction of an error to previously issued financial statements. ☐
Indicate by check mark whether any of those error corrections are restatements that required a recovery analysis of incentive-based compensation received by any of the registrant’s executive officers during the relevant recovery period pursuant to §240.10D-1(b). ☐
Indicate by check mark whether the registrant is a shell company (as defined in Rule 12b-2 of the Exchange Act). Yes ☐ No ☒
The aggregate market value of the registrant’s common stock held by non-affiliates of the registrant was approximately $13.7 billion as of June 30, 2023 based on the closing sale price of the registrant’s common stock on the NASDAQ Global Market on such date. Shares held by persons who may be deemed affiliates have been excluded. This determination of affiliate status is not necessarily a conclusive determination for other purposes.
On February 22, 2024, 75,104,132 shares of the registrant’s common stock were outstanding.
DOCUMENTS INCORPORATED BY REFERENCE
Portions of the registrant’s definitive Proxy Statement relating to its 2024 Annual Stockholders’ Meeting to be filed pursuant to Regulation 14A within 120 days after the registrant’s fiscal year end of December 31, 2023 are incorporated by reference into Part III of this Annual Report on Form 10-K.
ALIGN TECHNOLOGY, INC.
FORM 10-K
For the Year Ended December 31, 2023
TABLE OF CONTENTS
| Page | ||||||||
| PART I | 3 | |||||||
| Item 1. | Business | 3 | ||||||
| Information about our Executive Officers | 20 | |||||||
| Item 1A. | Risk Factors | 20 | ||||||
| Item 1B. | Unresolved Staff Comments | 35 | ||||||
| Item 1C. | Cybersecurity | 35 | ||||||
| Item 2. | Properties | 36 | ||||||
| Item 3. | Legal Proceedings | 36 | ||||||
| Item 4. | Mine Safety Disclosures | 36 | ||||||
| PART II | 37 | |||||||
| Item 5. | Market for Registrant’s Common Equity, Related Stockholder Matters and Issuer Purchases of Equity Securities | 37 | ||||||
| Item 6. | [Reserved] | 38 | ||||||
| Item 7. | Management’s Discussion and Analysis of Financial Condition and Results of Operations | 38 | ||||||
| Item 7A. | [Quantitative and Qualitative Disclosures About Market Risk](#i417aa79b4 |
Showing the first 8K of 102K characters. Open the full section
Item 1A. Risk Factors.
The Company’s business, reputation, results of operations, financial condition and stock price can be affected by a number of factors, whether currently known or unknown, including those described below. When any one or more of these risks materialize from time to time, the Company’s business, reputation, results of operations, financial condition and stock price can be materially and adversely affected. The risks below are not the only ones we face. Because of the following factors, as well as other factors affecting the Company’s results of operations and financial condition, past financial performance should not be considered to be a reliable indicator of future performance, and investors should not use historical trends to anticipate results or trends in future periods. Therefore, you should review this section carefully, as well as our consolidated financial statements and notes thereto and other information appearing in this Annual Report on Form 10-K, for important information regarding these and other risks that may affect us. Additionally, you should consider these risk factors in connection with evaluating the forward-looking statements contained in this report.
Macroeconomic and External Risks
Our operations and financial performance depend on global and regional economic conditions. Inflation, fluctuations in currency exchange rates, changes in consumer confidence and demand, and general economic weakness and threats, or actual recessions, have and could in the future materially affect our business, results of operations, and financial condition.
Macroeconomic conditions impact consumer confidence and discretionary spending, which can adversely affect demand for our products. Consumer spending habits are affected by, among other things, inflation, fluctuations in currency exchange rates, general economic weakness, threats or actual recessions, pandemics, wars and military actions, employment levels, wages, debt obligations, discretionary income, interest rates, volatility in capital, and consumer confidence and perceptions of
current and future economic conditions. Macroeconomic conditions can, among other things, reduce or shift spending away from elective procedures, drive patients to pursue less costly orthodontic treatments, decrease the number of orthodontic case starts, reduce patient traffic in dentists’ offices or reduce demand for dental services generally. Further, decreased demand for dental services can cause dentists and labs to postpone investments in capital equipment, such as intraoral scanners and CAD/CAM equipment and software. The declines in, or uncertain economic outlooks for, the U.S., Chinese, European and certain other international economies have and may continue to adversely affect consumer and dental practice spending. Increases in the cost of fuel and energy, food and other essential items as well as higher interest rates have and may continue to reduce consumers' disposable income, which could cause a decrease in discretionary spending for products like ours. Further, we cannot predict the impact of efforts by central banks and federal, state and local governments to combat inflation, which could result in an economic recession or have an adverse impact on consumer spending may for a prolonged period of time.
Inflation continues to adversely impact spending and trade activities, causing unpredictable impacts on global and regional economies. Higher inflation has also increased domestic and international shipping costs, raw material prices, and labor rates, which has adversely impacted the costs of producing, procuring and shipping our products. Our ability to recover these cost increases through price increases may continue to lag, resulting in downward pressure on our operating results. Attempts to offset cost increases with price increases may reduce sales, increase customer dissatisfaction or otherwise harm our reputation. Any of these events could materially affect our business and operating results.
We have significant international operations and sales and we are exposed to fluctuations in foreign currencies that have adversely impacted our business or results of operations. Although the U.S. dollar is our reporting currency, a large portion of our expenses, net revenues and net income are generated in foreign currencies. While we utilize forward contracts to moderate the impact of exchange rate fluctuations on certain assets and liabilities, our hedging strategies may not be successful, and currency exchange rate fluctuations have and may continue to materially adversely effect our operating results and cash flows. In addition, our foreign currency exposure on assets, liabilities and cash flows that we do not hedge have and could in the future materially impact our financial results in periods when the U.S. dollar significantly fluctuates in relation to foreign currencies.
Our business could be impacted by geopolitical events, trade and other international disputes, war, and terrorism, or major public health crises**.**
Political events, trade and other international disputes, war and terrorism, or major public health crises have and could in the future harm or disrupt international commerce and the global economy and could materially effect our business as well as our customers, suppliers, contract manufacturers, distributors, and other business partners. Such risks include supply chain and trade disruptions, tariffs, trade sanctions or restrictions, boycotts, reduced consumer spending, government shut downs, or cyberattacks, energy shortages or power outages, energy rationing that adversely impacts our manufacturing facilities, rising fuel or rising costs of producing, procuring and shipping our products, constraints, volatility or disruption in the financial markets, deaths or injuries to our employees, restrictions and shortages of food, water, shelter, and medical supplies, telecommunications failures or destruction of property.
Tariffs, such as those on Chinese goods, and responses to the tariffs may increase the cost of our products and the components and raw materials used to make them. Increased costs could adversely impact our gross margin and reduce demand for our products. Countries may also adopt other measures, such as controls on the import or export of goods, technology or data, that would adversely impact our operations and supply chains or limit our ability to offer products and services. These measures could require us to take various actions, including changing suppliers or restructuring business relationships. Complying with new or changed trade restrictions is expensive, time-consuming and disruptive to our operations. Such restrictions can be announced with little or no advance notice and we may be unable to effectively mitigate any adverse impacts.
Political events, trade and other international disputes, war, terrorism, or major public health crises involving key commercial, development or manufacturing markets such as China, Mexico, Israel, Europe, or other countries have and could again materially impact our international operations. The impact to us, our employees and customers would be uncertain, particularly if emergency circumstances, armed conflicts or an escalation in political instability or violence, or viral out-breaks disrupt our product development, data or information exchange, payroll or banking operations, product or materials shipping by us or our suppliers. Our internation operations would also be impacted by other unanticipated business disruptions, interruptions and limitations in telecommunication services or critical systems or applications reliant on a stable and uninterrupted communications infrastructure.
Military conflicts and global pandemics have materially adversely impacted our global economies. For example, our commercial operations in Russia were impacted by the conflict in Ukraine and we were affected by the COVID-19 pa
Showing the first 8K of 89K characters. Open the full section
Item 1B. Unresolved Staff Comments.
None.
Item 1C. Cybersecurity.
We have implemented a cross-departmental approach to managing cybersecurity risk, which includes seeking input from our employees, management, third-party vendors, the Audit Committee of the Board of Directors (the “Audit Committee”), and the Board of Directors. We devote significant resources to cybersecurity and risk management processes to adapt to the changing cybersecurity landscape and respond to emerging threats in a timely and effective manner. We regularly assess the threat landscape and take a holistic view of cybersecurity risks, with a layered cybersecurity strategy based on prevention, detection and response. To more effectively address cybersecurity threats, we have a dedicated Chief Information Security Officer (“CISO”) who is responsible for leading enterprise-wide information security strategy, policy, process, and technology. Our current CISO has 20+ years of information security and risk management experience and holds a Certified Information Systems Security Professional (CISSP) certification. Our CISO regularly briefs our Audit Committee on our cybersecurity and information security program and cybersecurity incidents deemed to pose a risk of a critical business impact or reputational harm. Our cybersecurity risk management program leverages the National Institute of Standards and Technology (NIST) framework, which organizes cybersecurity risks into five categories: identify, protect, detect, respond and recover. Our information security team, comprised of employees with an expertise in cybersecurity and information technology, regularly assess the threat landscape and take a holistic view of cybersecurity risks, with a layered cybersecurity strategy based on prevention, detection, and response.
Our information security program includes, among other things, cybersecurity incident response, vulnerability management, antivirus and malware protection, technology compliance and risk management, encryption, identity and access management, application security, and security monitoring. The program also has an information security awareness program, which includes annual training regarding our acceptable use and information classification and handling policies, regular phishing campaigns complemented by additional employee training as appropriate, and communications and companion trainings to keep our users informed on current events.
The information security program’s ultimate goal is preventing cybersecurity incidents to the extent feasible, while simultaneously increasing our system resilience to minimize the business impact should an incident occur. In the event of an identified cybersecurity incident, we have developed a detailed cybersecurity incident response process, which outlines the steps to be followed from incident detection, analysis, containment, eradication, recovery, and notification, including notifying functional areas (e.g. information technology, legal, finance, operations, privacy), as well as senior leadership and the Audit Committee, as appropriate. For critical cybersecurity incidents, processes have been established for our legal team to determine the materiality of each incident.
Our information security team engages third-party services to conduct evaluations of our security controls, including penetration testing and independent audits. Annually, an external auditor conducts a System and Organization Controls (“SOC”) type 2 audit covering the security principle for systems supporting our products.
Our assessment of risks associated with the use of third-party vendors is part of our overall cybersecurity risk management framework. If a third-party vendor is unable to provide a SOC 1 or SOC 2 report, our information security team takes additional steps to assess their cybersecurity preparedness and our initiation or continued engagement with them. Additionally, third-party vendors are required to include security and privacy addendums to our contracts where applicable and are reassessed periodically as necessary depending on the risk level that has been assigned to the third-party vendor. Our legal team also requires that our third-party vendors report cybersecurity incidents to us so the impact of the incident on us can be assessed.
Our Audit Committee is responsible for reviewing cybersecurity risks and our cybersecurity program. It oversees and reviews our cybersecurity and other information technology risks, controls, policies, and procedures. Our information security team annually performs a cybersecurity enterprise risk assessment and presents the results to management and the Audit Committee. The Audit Committee periodically reports on its review of cybersecurity risks and our cybersecurity program to our Board of Directors. In 2023, our CISO or his team met with the Audit Committee four times to discuss cybersecurity risks and threats.
We have not identified any risks from known cybersecurity threats, including as a result of any prior cybersecurity incidents, that have materially affected or are reasonably likely to materially affect us, including our operations, business strategy, results of operations, or financial condition. Notwithstanding the approach we take to cybersecurity, we may not successfully prevent or mitigate cybersecurity incidents that could have a material adverse effect on us. While we maintain cybersecurity insurance, the costs related to cybersecurity threats or disruptions may not be covered or, if covered, fully insured. See Item 1A. “Risk Factors” for a discussion of cybersecurity risks.
Item 2. Properties.
We occupy several leased and owned facilities. As of December 31, 2023, the significant facilities occupied were as follows:
| Location | Lease/Own | Primary Use | ||||||||||||
| Tempe, Arizona, U.S.A. | Lease | Office for corporate headquarters | ||||||||||||
| San Jose, California, U.S.A. | Own | Office for research & development and administrative personnel | ||||||||||||
| Raleigh, North Carolina, U.S.A. | Own | Office for Americas regional headquarters | ||||||||||||
| Belen, Heredia, Costa Rica | Own | Office for administrative personnel, treatment personnel, and customer care | ||||||||||||
| La Lima, Cartago, Costa Rica | Own | Office for administrative personnel, treatment personnel, and customer care | ||||||||||||
| Wroclaw, Poland | Lease and Own | Manufacturing and office for treatment and administrative personnel | ||||||||||||
| Petah Tikva, Israel | Lease and Own | Manufacturing and office for research & development and administrative personnel | ||||||||||||
| Rotkreuz, Switzerland | Lease | Office for EMEA regional headquarters | ||||||||||||
| Juarez, Mexico | Own | Manufacturing and office for administrative personnel | ||||||||||||
| Ziyang, China | Own | Manufacturing and office for administrative personnel | ||||||||||||
We believe our existing facilities are in good operating condition and are suitable for the conduct of our business. The facilities noted above are used mostly by all our reportable segments.
Item 3. Legal Proceedings.
For a discussion of legal proceedings, refer to Note 7 "Legal Proceedings" of the Notes to Consolidated Financial Statements in Part II, Item 8 of this Form 10-K.
Item 4. Mine Safety Disclosures.
Not applicable.
PART II
Item 5. Market for Registrant’s Common Equity, Related Stockholder Matters and Issuer Purchases of Equity Securities.
Market Information
Our common stock is traded on the NASDAQ Global Market under the symbol ALGN. As of February 22, 2024, there were approximately 52 holders of record of our common stock. Because the majority of our shares of outstanding common stock are held by brokers and other institutions on behalf of stockholders, we are unable to estimate the total number of stockholders represented by these record holders.
Performance Graph
Notwithstanding any statement to the contrary in any of our previous or future filings with the SEC, the following information relating to the price performance of our common stock shall not be deemed “filed” with the SEC or “Soliciting Material” under the Securities Exchange Act of 1934, as amended, or subject to Regulation 14A or 14C, or to liabilities of Section 18 of the Exchange Act except to the extent we specifically request that such information be treated as soliciting material or to the extent we specifically incorporate this information by reference.
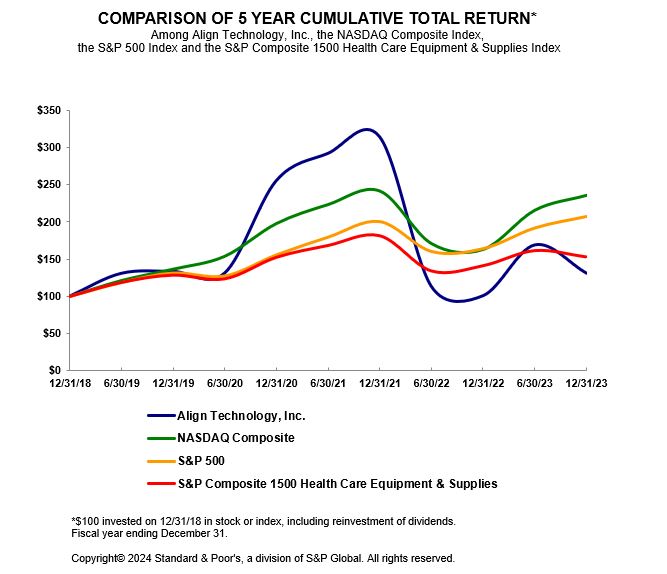
The graph below matches our cumulative 5-year total stockholder return on common stock with the cumulative total returns of the NASDAQ Composite index, the S&P 500 index and the S&P 1500 Composite Health Care Equipment & Supplies index. The graph tracks the performance of a $100 investment in our common stock and each index (with the reinvestment of all dividends) from December 31, 2018 to December 31, 2023.
Unregistered Sales of Equity Securities
None.
Purchases of Equity Securities by the Issuer and Affiliated Purchasers
The following table summarizes the stock repurchase activity for the three months ended December 31, 2023:
| Period | Total Number of Shares Purchased | Average Price Paid per Share | Total Number of Shares Purchased as Part of Publicly Announced Programs | Approximate Dollar Value of Shares that May Yet Be Purchased Under the Programs**(1)** | ||||||||||||||||||||||
| October 1, 2023 through October 31, 2023 | 1,049,538 | $ | 190.56 | 1,049,538 | $ | 750,000,000 | ||||||||||||||||||||
| November 1, 2023 through November 30, 2023 | 283,335 | $ | 206.89 | 283,335 | $ | 691,380,496 | ||||||||||||||||||||
| December 1, 2023 through December 31, 2023 | 182,183 | $ | 227.14 | 182,183 | $ | 650,000,000 | ||||||||||||||||||||
| Total | 1,515,056 | 1,515,056 |
1 January 2023 Repurchase Program. In January 2023, we announced that our Board of Directors had authorized a plan to repurchase up to $1,000,000,000 of our common stock. See Note 10 “Common Stock Repurchase Programs” of the Notes to Consolidated Financial Statements for details on the January 2023 Repurchase Program.
Item 6. [Reserved]
Item 7. Management’s Discussion and Analysis of Financial Condition and Results of Operations.
The following discussion and analysis of our financial condition and results of operations should be read together with our consolidated financial statements and related notes included elsewhere in this Annual Report on Form 10-K.
A discussion regarding our financial condition and results of operations for fiscal 2023 compared to fiscal 2022 is presented under Results of Operations of this Form 10-K. Discussions regarding our financial condition and results of operations for fiscal 2022 compared to 2021 have been omitted from this Annual Report on Form 10-K, but can be found in "Item 7. Management's Discussion and Analysis of Financial Condition and Results of Operations" in our Annual Report on Form 10-K for the fiscal year ended December 31, 2022, filed with the SEC on February 27, 2023, which is available without charge on the SEC's website at www.sec.gov and on our investor relations website at investor.aligntech.com.
Executive Overview of Results
Trends and Uncertainties
Our business strategic priorities focus on four principal pillars for growth: (i) international expansion; (ii) GP dentist treatment; (iii) patient demand; and (iv) orthodontic utilization. Our growth strategy depends on our ability to facilitate the digital transformation of dentistry happening around the world, our continuous focus on innovation, and expansion to meet and exceed evolving customer expectations as the array of products and services available to them increases.
We strive to deliver on each of our strategic growth drivers through a variety of interrelated enterprise-wide efforts including:
-
Continuing penetration and adoption of Invisalign products, intraoral scanners and CAD/CAM solutions in international markets by investing in manufacturing operations, research and development, clinical treatment planning, sales and marketing and building our quality and regulatory capabilities in existing and emerging markets globally. For instance, in 2022, we opened a new aligner fabrication facility in Wroclaw, Poland as a part of our strategy to bring operational facilities closer to customers to serve them more quickly and respond to their needs more effectively as well as new treatment planning operations in targeted regional geographies. We have also diversified our research and development activities throughout Europe, which has created a longer term, more stable environment for consistent hiring, retention and innovation in a variety of high technology sectors. We are in over 100 markets and have 13 fabrication and treatment locations throughout the world.
-
Targeting growth opportunities with international orthodontists and GP customers, particularly with adopters of digital dentistry platforms by tailoring our sales and marketing strategies, manufacturing operations and resources around the unique needs of each customer channel. As we continue growing, we intend to opportunistically expand our research, development, manufacturing, treatment planning, and sales and marketing operations to meet local and regional demand thoughtfully and deliberately. Over the longer-term, we expect international revenues to grow faster than Americas' revenues as a result of growing international demand, our continued investment in international market expansion, the size of the market opportunities and our relatively low market penetration in these regions.
-
Building confidence within the GP and orthodontic communities through training and education efforts to increase their adoption and utilization of digital dental practice transformation and clear aligner treatment. We continue to expand our clear aligner customer base by educating new doctors on the benefits of digital dentistry through the Invisalign system. We furthermore demonstrate to GPs and orthodontists how the iTero portfolio of intraoral scanners and CAD/CAM restorative services and workflows can increase revenues and profitability for their dental practices by enhancing patient experiences and creating operational practice efficiencies.
-
Investing in research and development that allows us to innovate, develop and bring to market products and solutions that deliver the ever-increasing clinical precision and predictability that doctors expect with the speed and convenience their patients require.
-
Creating demand and enabling patient conversion through targeted investments in advertising and public relations through social media, influencers and other forms of digital communications to encourage treatment by Invisalign trained doctors. We believe that well-designed, targeted sales and marketing promotions that build on our strong brand awareness allow us to differentiate our products and solutions from traditional and emerging competitors. To increase awareness and educate young adults, parents and teens about the benefits of the Invisalign brand, in 2023 we continued to invest in and create campaigns across markets in media platforms such as TikTok, Instagram, YouTube, SnapChat, WeChat, and Douyin. We expect to make further investments to create additional demand for Invisalign system treatment driving more consumers to dental professionals for those treatments.
-
Pursuing new product lines that complement our doctor-prescribed principal products currently available in certain e-commerce and retail channels in the U.S. Similarly, in 2023, we continued our focus on our doctor subscription plan and grew our underpenetrated share of the retainer business through strategic marketing campaigns focused on driving adoption and increasing market share in the U.S., Canada, Iberia and the Nordics.
-
Increasing global orthodontic utilization rates as doctors’ clinical confidence in the efficacy and predictability of the Invisalign system increases with advancements in products and technology and as patients and doctors demand treatments that emphasize convenience and safety through fewer visits and less invasive and quicker treatments. In addition, the teenage and younger market makes up about 70% of the approximately 22 million total annual global orthodontic case starts. We continue to emphasize the benefits of the Invisalign system for teenage and younger patient treatments through education, training and sales and marketing programs. In 2023, we had record shipments to teenage and younger patients. We expect utilization rates to continue to rise. However, our utilization rates will fluctuate from period to period due to a variety of factors, which may include seasonal trends in our business, consumer demand due to macroeconomic factors, and adoption rates for new products and features.
Macroeconomic Challenges and Military Conflict in Ukraine and the Middle East
Our revenues are susceptible to fluctuations caused by macroeconomic conditions, inflation, changes to currency exchange rates, rising interest rates, actual and threatened wars and military actions, threats of or actual recessions, supply chain challenges, market volatility, and other factors, each of which impacts customer confidence, consumer sentiment and demand. Many of these same factors also impact our costs and those of our suppliers through higher raw material prices, transportation costs, labor costs, supply and distribution operations. In 2023, we believe that sales of our products were primarily harmed by macroeconomic conditions that ultimately adversely impacted disposable income and consumer demand. In particular, dental practices and industry research firms reported deteriorating orthodontic trends for the third and fourth quarters of 2023, including decreased patient visits and increased patient appointment cancellations, along with fewer case starts overall, especially among adult patients. The impact of declining demand varied by time and region, making operational results uncertain and difficult to predict.
Additionally, many of our international operations are denominated in currencies other than the U.S. dollar. In 2023, the macroeconomic slowing or contraction resulted in foreign exchange volatility causing the U.S dollar to strengthen against other currencies. This negatively impacted our financial condition and results of operation compared to 2022. Foreign exchange
volatility and the subsequent strengthening or weakening of the U.S dollar against other currencies remains uncertain and unpredictable.
Moreover, military conflicts increase the unpredictability of the volatile macroeconomic conditions. While the military conflict between Russia and Ukraine did not materially impact our 2023 financial condition and results of operations, we expect the conflict will continue to create market uncertainties and dampen consumer sentiment and demand, particularly in Europe.
Similarly, the recent conflict in the Middle East may further exacerbate general and regional macroeconomic instability, particularly if fighting is prolonged, it spreads to other locations, creates shipping and logistical challenges or cost increases, or leads to sanctions or boycotts. Our iTero business is headquartered in Israel and the timing and cost of shipping our products has been impacted. Additionally, we have employees and consultants in Israel that have been called for military service and they may be unavailable for an unknown period of time. The conflict may continue to spread to other areas which may further impact our business. We continue to monitor the potential for violence and military actions that may directly or indirectly impact our personnel, manufacturing, supply chain, and sales.
Changing Product Preferences
As the markets for clear aligners and digital processes and workflows used to transform the practice of dentistry continue to mature, we anticipate customer and patient expectations and demands will evolve. We expect to meet customer demands with innovative treatment options that include more choices to address a wider scope of treatment goals and budgets based on our existing and new products. This may result in larger and unpredictable variations in geographic and product mix and selling prices with uncertain implications on our financial statements and business operations.
We strive to manage the challenges from the trends and uncertainties, including the macroeconomic conditions, military conflict and the evolution of our target markets, by focusing on improving our operations, building flexibility and efficiencies in our processes, adjusting our business models to changing circumstances and offering products that meet market demand. Specifically, we are managing cost impacts through pricing actions, implementing cost saving measures and slowing hiring. We also continue to innovate and introduce new and enhanced products that augment our doctor customer and patient experiences.
For instance, in the first quarter of 2023, we successfully launched the Invisalign Comprehensive 3in3 product. The 3in3 configuration offers doctors Invisalign Comprehensive treatment with a three-year treatment expiration date and three additional clear aligners included prior to the treatment expiration date. We anticipate adoption of the Invisalign Comprehensive 3in3 product will continue to increase in 2024. The 3in3 product allows us to recognize more revenue up front but is offered at a lower price as compared to our traditional Invisalign comprehensive product that has a five-year treatment expiration date with unlimited additional clear aligner prior to the treatment end date.
Further discussion of the impact of these challenges on our business may be found in Part I, Item 1A of this Annual Report on Form 10-K under the heading “Risk Factors.”
Key Financial and Operating Metrics
We measure our performance against these strategic priorities by the achievement of key financial and operating metrics. For the year ended December 31, 2023, our business operations reflect the following:
◦Revenues of $3,862.3 million, an increase of 3.4% year-over-year;
◦Clear Aligner revenues of $3,199.3 million, an increase of 4.1% year-over-year;
*▪*Americas Clear Aligner case revenues of $1,463.0 million, a decrease of 0.6% year-over-year;
▪International Clear Aligner case revenues of $1,449.5 million, an increase of 7.4% year-over-year;
▪Clear Aligner volume increase of 0.4% year-over-year and Clear Aligner volume increase for teenage patients of 7.8% year-over-year;
◦Imaging Systems and CAD/CAM Services revenues of $662.9 million, an increase of 0.1% year-over-year;
*◦*Income from operations of $643.3 million and operating margin of 16.7%;
◦Effective tax rate of 30.6%;
◦Net income of $445.1 million with diluted net income per share of $5.81;
◦Cash, cash equivalents and marketable securities of $980.8 million as of December 31, 2023;
◦Operating cash flow of $785.8 million;
◦Capital expenditures of $177.7 million, predominantly related to purchases of property, plant and equipment; and
◦Number of employees was 21,610 as of December 31, 2023, a decrease of 6.7% year-over-year.
Other Statistical Data and Trends
-
As of December 31, 2023, 17 million people worldwide have been treated with our Invisalign system. Management measures these results by comparing to the millions of people who can benefit from straighter teeth and uses this data to target opportunities to expand the market for orthodontics by educating consumers about the benefits of straighter teeth using the Invisalign system.
-
For the fourth quarter of 2023, total Invisalign cases submitted with a digital scanner in the Americas increased to 95.1%, up from 92.7%* in the fourth quarter of 2022 and international scans increased to 88.1%, up from 86.8% in the fourth quarter of 2022. For the fourth quarter of 2023, 98.0% of Invisalign cases submitted by North American orthodontists were submitted digitally.
-
The total utilization rate in 2023 was 19.1 cases per doctor compared to 19.3* cases per doctor in 2022 and 20.9* cases per doctor in 2021. Our utilization rates have declined in 2023 due to the macroeconomic conditions and other factors as described in the Trends and Uncertainties section above. In general, we expect utilization rates to rise over time although they are likely to fluctuate from period to period.
-
North America: The utilization rate among our North American orthodontist customers was 94.5 cases per doctor in 2023 compared to 94.9* cases per doctor in 2022 and 99.7* cases per doctor in 2021 and the utilization rate among our North American GP customers was 14.0 cases per doctor in 2023 compared to 13.9 cases per doctor in 2022 and 14.3 cases per doctor in 2021.
-
International: International doctor utilization rate was 16.3 cases per doctor in 2023 compared to 16.2 cases per doctor in 2022 and 17.5 cases per doctor in 2021*.*
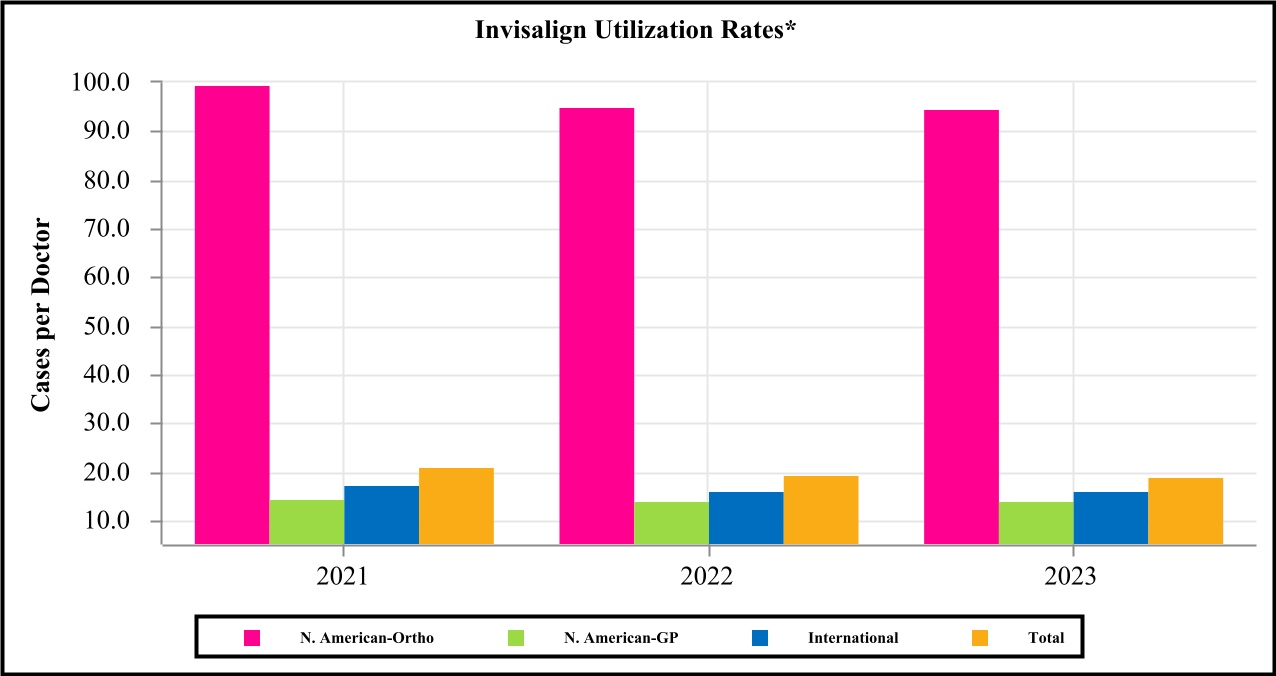
***** Invisalign utilization rates are calculated by the number of cases shipped divided by the number of doctors to whom cases were shipped. Our International region includes Europe, Middle East and Africa (“EMEA”) and Asia Pacific (“APAC”). Latin America (“LATAM”) is excluded from the International region based on its immateriality to the year; however is included in the Total utilization.
During the third quarter of 2023, we began including Touch Up case revenues in Americas and/or International net revenues that were previously included in Non-Case revenues and have recast business metrics for the periods presented above accordingly.
Results of Operations
Net Revenues by Reportable Segment
We group our operations into two reportable segments: Clear Aligner segment and Systems and Services segment.
-
Our Clear Aligner segment consists of Comprehensive Products, Non-Comprehensive Products and Non-Case revenues as defined below:
-
Comprehensive Products include, but are not limited to, Invisalign Comprehensive and Invisalign First.
-
Non-Comprehensive Products include, but are not limited to, Invisalign Moderate, Lite and Express packages and Invisalign Go and Invisalign Go Plus.
-
We also offer in the U.S., Canada, and EMEA, a Doctor Subscription Program which is our monthly subscription-based clear aligner program. The program allows doctors the flexibility to order retainers and low-stage “touch-up” clear aligners within their subscribed tier and is designed for a segment of experienced Invisalign trained doctors who are currently not regularly using our retainers or low-stage aligners. The low-stage aligners, the Touch up product, are included as a Non-Comprehensive Product.
-
Non-Case products include, but are not limited to, retention products including retention aligners ordered through the Doctor Subscription Program, Invisalign training, adjusting tools used by dental professionals during the course of treatment and Invisalign Accessory Products that are complementary to our doctor-prescribed principal products such as aligner cases (clamshells), teeth whitening products, cleaning solutions (crystals, foam and other material) and other oral health products available in certain commerce channels in select markets.
-
Our Systems and Services segment consists of our iTero intraoral scanning systems, which includes a single hardware platform and restorative or orthodontic software options. Our services include subscription software, disposables, rentals, leases, pay per scan services, as well as exocad’s CAD/CAM software solutions that integrate workflows to dental labs and dental practices.
Net revenues for our Clear Aligner and Systems and Services segments by region for the year ended December 31, 2023, 2022 and 2021 are as follows (in millions):
| Year Ended December 31, | Year Ended December 31, | |||||||||||||||||||||||||||||||||||||||||||||||||
| Net Revenues | 2023 | 2022 | Change | 2022 | 2021 | Change | ||||||||||||||||||||||||||||||||||||||||||||
| Clear Aligner revenues: | ||||||||||||||||||||||||||||||||||||||||||||||||||
| Americas | $ | 1,463.0 | $ | 1,471.9 | $ | (9.0) | (0.6) | % | $ | 1,471.9 | $ | 1,548.8 | $ | (76.9) | (5.0) | % | ||||||||||||||||||||||||||||||||||
| International | 1,449.5 | 1,349.0 | 100.5 | 7.4 | % | 1,349.0 | 1,498.7 | (149.7) | (10.0) | % | ||||||||||||||||||||||||||||||||||||||||
| Non-case | 286.9 | 251.7 | 35.2 | 14.0 | % | 251.7 | 199.6 | 52.1 | 26.1 | % | ||||||||||||||||||||||||||||||||||||||||
| Total Clear Aligner net revenues | $ | 3,199.3 | $ | 3,072.6 | $ | 126.7 | 4.1 | % | $ | 3,072.6 | $ | 3,247.1 | $ | (174.5) | (5.4) | % | ||||||||||||||||||||||||||||||||||
| Systems and Services net revenues | 662.9 | 662.1 | 0.9 | 0.1 | % | 662.1 | 705.5 | (43.5) | (6.2) | % | ||||||||||||||||||||||||||||||||||||||||
| Total net revenues | $ | 3,862.3 | $ | 3,734.6 | $ | 127.6 | 3.4 | % | $ | 3,734.6 | $ | 3,952.6 | $ | (217.9) | (5.5) | % |
During 2023, we began including Touch Up case revenues in Americas and/or International net revenues. Touch Up case revenues were previously recorded in Non-case revenues. We have recast the year ended December 31, 2022 and 2021 to reflect this change. Amount and percentage changes are based on recast amounts. Certain tables may not sum or recalculate due to rounding.
Clear Aligner Case Volume
Case volume data which represents Clear Aligner case shipments for the year ended December 31, 2023, 2022 and 2021 is as follows (in thousands):
| Year Ended December 31, | Year Ended December 31, | |||||||||||||||||||||||||||||||||||||||||||||||||
| 2023 | 2022 | Change | 2022 | 2021 | Change | |||||||||||||||||||||||||||||||||||||||||||||
| Total case volume | 2,408.5 | 2,398.4 | 10.2 | 0.4 | % | 2,398.4 | 2,559.6 | (161.3) | (6.3) | % |
During 2023, we began including Touch Up case revenues in Americas and/or International net revenues. Touch Up case revenues were previously recorded in Non-case revenues. We have recast the year ended December 31, 2022 and 2021 to reflect this change. Amount and percentage changes are based recast amounts. Certain tables may not sum or recalculate due to rounding.
Total net revenues increased by $127.6 million in 2023 as compared to 2022, primarily due to an increase in Clear Aligner average selling price (“ASP”), an increase in Clear Aligner non-case revenue and higher Systems and Services services mix, partially offset by a decrease in both scanner volumes and ASP’s.
Clear Aligner - Americas
Americas net revenues decreased by $9.0 million in 2023 as compared to 2022, primarily due to a 2.1% decrease in case volumes, resulting in a reduction of net revenues of $31.4 million, partially offset by a $22.4 million increase due to higher ASP. Higher ASP includes price increases which increased net revenues by $68.6 million along with higher additional aligners which increased net revenues by $43.9 million. The increases in ASP were partially offset by higher promotional discounts which decreased net revenues by $44.3 million, a product mix shift to lower priced products which reduced net revenues by $37.6 million and higher sales credits which lowered net revenues $11.5 million.
Clear Aligner - International
International net revenues increased by $100.5 million in 2023 as compared to 2022 due to a 3.5% increase in case volumes, resulting in an increase of net revenues by $46.9 million, and higher ASP increasing net revenues by $53.6 million. Higher ASP was largely due to higher additional aligners increasing net revenues by $100.8 million and price increases on most products which increased net revenues by $96.9 million. The increases in ASP were partially offset by a product mix shift to lower priced products reducing net revenues by $68.2 million, higher promotional discounts which reduced net revenues by $52.5 million, and unfavorable foreign exchange rates which decreased net revenues by $27.2 million.
Clear Aligner - Non-Case
Non-case net revenues increased by $35.2 million in 2023 compared to 2022 mainly due to increased volume of Vivera retainers across all regions which includes retention aligners ordered through our Doctor Subscription Program.
Systems and Services
Systems and Services net revenues decreased by $0.9 million in 2023 as compared to 2022 primarily due to a lower number of scanners sold which lowered net revenues by $26.1 million and lower scanner ASP which reduced net revenues by $23.9 million. The decrease in scanner net revenues was mostly offset by higher service revenues of $31.8 million and other revenues which increased $19.1 million primarily due to revenue from sales of certified pre-owned scanners, CAD/CAM software, and scanner rentals.
Cost of net revenues and gross profit (in millions):
| Year Ended December 31, | Year Ended December 31, | |||||||||||||||||||||||||||||||||||||
| 2023 | 2022 | Change | 2022 | 2021 | Change | |||||||||||||||||||||||||||||||||
| Clear Aligner | ||||||||||||||||||||||||||||||||||||||
| Cost of net revenues | $ | 911.3 | $ | 844.4 | $ | 66.9 | $ | 844.4 | $ | 772.7 | $ | 71.7 | ||||||||||||||||||||||||||
| % of net segment revenues | 28.5 | % | 27.5 | % | 27.5 | % | 23.8 | % | ||||||||||||||||||||||||||||||
| Gross profit | $ | 2,288.0 | $ | 2,228.2 | $ | 59.9 | $ | 2,228.2 | $ | 2,474.4 | $ | (246.2) | ||||||||||||||||||||||||||
| Gross margin % | 71.5 | % | 72.5 | % | 72.5 | % | 76.2 | % | ||||||||||||||||||||||||||||||
| Systems and Services | ||||||||||||||||||||||||||||||||||||||
| Cost of net revenues | $ | 244.1 | $ | 256.4 | $ | (12.3) | $ | 256.4 | $ | 244.5 | $ | 11.9 | ||||||||||||||||||||||||||
| % of net segment revenues | 36.8 | % | 38.7 | % | 38.7 | % | 34.7 | % | ||||||||||||||||||||||||||||||
| Gross profit | $ | 418.8 | $ | 405.6 | $ | 13.2 | $ | 405.6 | $ | 461.0 | $ | (55.4) | ||||||||||||||||||||||||||
| Gross margin % | 63.2 | % | 61.3 | % | 61.3 | % | 65.3 | % | ||||||||||||||||||||||||||||||
| Total cost of net revenues | $ | 1,155.4 | $ | 1,100.9 | $ | 54.5 | $ | 1,100.9 | $ | 1,017.2 | $ | 83.6 | ||||||||||||||||||||||||||
| % of net revenues | 29.9 | % | 29.5 | % | 29.5 | % | 25.7 | % | ||||||||||||||||||||||||||||||
| Gross profit | $ | 2,706.9 | $ | 2,633.8 | $ | 73.1 | $ | 2,633.8 | $ | 2,935.4 | $ | (301.6) | ||||||||||||||||||||||||||
| Gross margin % | 70.1 | % | 70.5 | % | 70.5 | % | 74.3 | % |
Changes and percentages are based on actual values. Certain tables may not sum or recalculate due to rounding.
Cost of net revenues includes personnel-related costs including payroll and stock-based compensation for staff involved in the production process, the cost of materials, packaging, freight and shipping related costs, depreciation on capital equipment and facilities used in the production process, amortization of acquired intangible assets and training costs.
Clear Aligner
The gross margin percentage decreased in 2023 as compared to 2022 primarily due to a increased manufacturing spend offset by higher ASP.
Systems and Services
The gross margin percentage increased in 2023 as compared to 2022 primarily due to lower purchase price variance and higher service revenue mix, partially offset by lower ASP.
Selling, general and administrative (in millions):
| Year Ended December 31, | Year Ended December 31, | |||||||||||||||||||||||||||||||||||||
| 2023 | 2022 | Change | 2022 | 2021 | Change | |||||||||||||||||||||||||||||||||
| Selling, general and administrative | $ | 1,703.4 | $ | 1,674.5 | $ | 28.9 | $ | 1,674.5 | $ | 1,708.6 | $ | (34.2) | ||||||||||||||||||||||||||
| % of net revenues | 44.1 | % | 44.8 | % | 44.8 | % | 43.2 | % |
Changes and percentages are based on actual values. Certain tables may not sum or recalculate due to rounding.
Selling, general and administrative expense generally includes personnel-related costs, including payroll, stock-based compensation and commissions for our sales force, marketing and advertising expenses including media, market research, marketing materials, clinical education, trade shows and industry events, legal and outside service costs, equipment, software and maintenance costs, depreciation and amortization expense and allocations of corporate overhead expenses including facilities and Information Technology (“IT”).
Selling, general and administrative expense increased in 2023 compared to 2022 primarily due to higher employee costs, including higher salaries expense, fringe benefits, stock-based compensation and bonus, offset by lower advertising and marketing and outside service provider costs.
Research and development (in millions):
| Year Ended December 31, | Year Ended December 31, | |||||||||||||||||||||||||||||||||||||
| 2023 | 2022 | Change | 2022 | 2021 | Change | |||||||||||||||||||||||||||||||||
| Research and development | $ | 346.8 | $ | 305.3 | $ | 41.6 | $ | 305.3 | $ | 250.3 | $ | 54.9 | ||||||||||||||||||||||||||
| % of net revenues | 9.0 | % | 8.2 | % | 8.2 | % | 6.3 | % |
Changes and percentages are based on actual values. Certain tables may not sum or recalculate due to rounding.
Research and development expense generally includes personnel-related costs, including payroll and stock-based compensation, outside service costs associated with the research and development of new products and enhancements to existing products, software, equipment, material and maintenance costs, depreciation and amortization expense and allocations of corporate overhead expenses including facilities and IT.
Research and development expense increased in 2023 compared to 2022 primarily due to higher employee costs, including higher salaries expense, fringe benefits, stock-based compensation and bonus as we continue to focus our investments in innovation and research.
Restructuring and other charges (in millions):
| Year Ended December 31, | Year Ended December 31, | |||||||||||||||||||||||||||||||||||||
| 2023 | 2022 | Change | 2022 | 2021 | Change | |||||||||||||||||||||||||||||||||
| Restructuring and other charges | $ | 13.3 | $ | 11.5 | $ | 1.9 | $ | 11.5 | $ | — | $ | 11.5 | ||||||||||||||||||||||||||
| % of net revenues | 0.3 | % | 0.3 | % | 0.3 | % | — | % |
Changes and percentages are based on actual values. Certain tables may not sum or recalculate due to rounding.
Restructuring and other charges incurred during 2023 was primarily related to post employment benefits, including employee severance.
Income from operations (in millions):
| Year Ended December 31, | Year Ended December 31, | |||||||||||||||||||||||||||||||||||||
| 2023 | 2022 | Change | 2022 | 2021 | Change | |||||||||||||||||||||||||||||||||
| Clear Aligner | ||||||||||||||||||||||||||||||||||||||
| Income from operations | $ | 1,182.3 | $ | 1,134.4 | $ | 47.8 | $ | 1,134.4 | $ | 1,325.9 | $ | (191.4) | ||||||||||||||||||||||||||
| Operating margin % | 37.0 | % | 36.9 | % | 36.9 | % | 40.8 | % | ||||||||||||||||||||||||||||||
| Systems and Services | ||||||||||||||||||||||||||||||||||||||
| Income from operations | $ | 191.4 | $ | 179.8 | $ | 11.6 | $ | 179.8 | $ | 259.1 | $ | (79.4) | ||||||||||||||||||||||||||
| Operating margin % | 28.9 | % | 27.2 | % | 27.2 | % | 36.7 | % | ||||||||||||||||||||||||||||||
| Total income from operations 1 | $ | 643.3 | $ | 642.6 | $ | 0.7 | $ | 642.6 | $ | 976.4 | $ | (333.8) | ||||||||||||||||||||||||||
| Operating margin % | 16.7 | % | 17.2 | % | 17.2 | % | 24.7 | % |
Changes and percentages are based on actual values. Certain tables may not sum or recalculate due to rounding.
1 Refer to Note 15 “Segments and Geographical Information” of the Notes to Consolidated Financial Statements for details on unallocated corporate expenses and the reconciliation to Consolidated Income from Operations.
Clear Aligner
Operating margin percentage remained relatively flat in 2023 compared to 2022 primarily due to a decrease in gross margin which was offset by operating leverage.
Systems and Services
Operating margin percentage increased in 2023 compared to 2022 primarily due to higher gross margin.
Interest income (in millions):
| Year Ended December 31, | Year Ended December 31, | |||||||||||||||||||||||||||||||||||||
| 2023 | 2022 | Change | 2022 | 2021 | Change | |||||||||||||||||||||||||||||||||
| Interest income | $ | 17.3 | $ | 5.4 | $ | 11.9 | $ | 5.4 | $ | 3.1 | $ | 2.3 | ||||||||||||||||||||||||||
| % of net revenues | 0.4 | % | 0.1 | % | 0.1 | % | 0.1 | % |
Changes and percentages are based on actual values. Certain tables may not sum or recalculate due to rounding.
Interest income generally includes interest earned on cash, cash equivalents and investment balances.
Interest income increased in 2023 compared to 2022 primarily due to higher interest rates during 2023.
Other income (expense), net (in millions):
| Year Ended December 31, | Year Ended December 31, | |||||||||||||||||||||||||||||||||||||
| 2023 | 2022 | Change | 2022 | 2021 | Change | |||||||||||||||||||||||||||||||||
| Other income (expense), net | $ | (19.4) | $ | (48.9) | $ | 29.5 | $ | (48.9) | $ | 32.9 | $ | (81.8) | ||||||||||||||||||||||||||
| % of net revenues | (0.5) | % | (1.3) | % | (1.3) | % | 0.8 | % |
Changes and percentages are based on actual values. Certain tables may not sum or recalculate due to rounding.
Other income (expense), net, generally includes foreign exchange gains and losses, gains and losses on foreign currency forward contracts, interest expense, gains and losses on equity investments and other miscellaneous charges.
Other income (expense), net decreased in 2023 compared to 2022 primarily due to the favorable impact of foreign exchange rates offset slightly by losses in investments in private companies.
Provision for (benefit from) income taxes (in millions):
| Year Ended December 31, | Year Ended December 31, | |||||||||||||||||||||||||||||||||||||
| 2023 | 2022 | Change | 2022 | 2021 | Change | |||||||||||||||||||||||||||||||||
| Provision for (benefit from) income taxes | $ | 196.2 | $ | 237.5 | $ | (41.3) | $ | 237.5 | $ | 240.4 | $ | (2.9) | ||||||||||||||||||||||||||
| Effective tax rates | 30.6 | % | 39.6 | % | 39.6 | % | 23.7 | % |
Changes and percentages are based on actual values. Certain tables may not sum or recalculate due to rounding.
The decrease in our effective tax rate for the year ended December 31, 2023 compared to the same period in 2022 is primarily attributable to the application of newly issued tax guidance, including IRS Notice 2023-55 and a change in our jurisdictional mix of income.
Liquidity and Capital Resources
Liquidity and Trends
As of December 31, 2023 and 2022, we had the following cash and cash equivalents and short-term and long-term marketable securities (in thousands):
| December 31, | ||||||||||||||
| 2023 | 2022 | |||||||||||||
| Cash and cash equivalents | $ | 937,438 | $ | 942,050 | ||||||||||
| Marketable securities, short-term | 35,304 | 57,534 | ||||||||||||
| Marketable securities, long-term | 8,022 | 41,978 | ||||||||||||
| Total | $ | 980,764 | $ | 1,041,562 |
As of December 31, 2023 and 2022, approximately $784.7 million and $653.7 million, respectively, of cash, cash equivalents and marketable securities were held by our foreign subsidiaries. We intend to reinvest our foreign subsidiary earnings indefinitely outside of the U.S. and do not expect to incur significant additional costs upon repatriation of these foreign earnings. We generate sufficient domestic operating cash flow and have access to $300.0 million under our revolving line of
credit. We believe that our current cash balances and the borrowing capacity under our credit facility, if necessary, will be sufficient to fund our business for at least the next 12 months.
Our material cash requirements as of December 31, 2023 are as below:
-
Our purchase commitments consist primarily of open purchase orders for goods and services, including manufacturing inventory, supplies and services, sales and marketing, research and development services and technological services, issued in the normal course of business. Our purchase commitments totaled $1,234.5 million. We anticipate a majority, an estimated $861.5 million, will be payable within the next 12 months. These purchase commitments exclude capital expenditures.
-
We expect our investments in capital expenditures to be approximately $100.0 million for the next 12 months. Capital expenditures primarily relate to building construction and improvements as well as additional manufacturing capacity due to international expansion. Despite the challenging market conditions, we intend to expand our investments in research and development, manufacturing, treatment planning, sales and marketing operations to meet actual and anticipated local and regional demands.
-
We have future operating lease payments of $153.5 million, which includes $13.3 million for leases that have not yet commenced as of December 31, 2023. Refer to Note 4 “Leases” of the Notes to Consolidated Financial Statements for details on the lease payments.
-
We have approximately $650.0 million available for repurchases of our common stock under the stock repurchase program authorized by our Board of Directors in January 2023 (“January 2023 Repurchase Program”). Our stock repurchase program is subject to periodic evaluations to determine when and if repurchases are in the best interests of our stockholders, taking into account prevailing market conditions. Refer to Note 10 “Common Stock Repurchase Programs” of the Notes to Consolidated Financial Statements for details on our stock repurchase programs. Beginning in fiscal year 2023 our stock repurchases, net of certain issuances, were subject to a 1% excise tax. This excise tax is not expected to have a material impact on our liquidity or capital resources.
-
On January 2, 2024 we completed the acquisition of the remaining interest in privately held Cubicure GmbH for total purchase consideration of approximately $87 million. We paid approximately $79 million in cash, which represents the total purchase consideration less credit for our previously owned interest.
-
As of December 31, 2023, we had no material off-balance sheet arrangements that have, or are reasonably likely to have, a current or future material impact on our liquidity or capital resources.
Sources and Use of Cash
The following table summarizes our Consolidated Statements of Cash Flows for the year ended December 31, 2023, 2022 and 2021 (in thousands):
| Year Ended December 31, | ||||||||||||||||||||
| 2023 | 2022 | 2021 | ||||||||||||||||||
| Net cash provided by (used in): | ||||||||||||||||||||
| Operating activities | $ | 785,776 | $ | 568,732 | $ | 1,172,544 | ||||||||||||||
| Investing activities | (195,943) | (213,316) | (563,430) | |||||||||||||||||
| Financing activities | (598,340) | (501,686) | (458,332) | |||||||||||||||||
| Effects of foreign exchange rate changes on cash, cash equivalents, and restricted cash | 4,671 | (11,514) | (12,117) | |||||||||||||||||
| Net (decrease) increase in cash, cash equivalents, and restricted cash | $ | (3,836) | $ | (157,784) | $ | 138,665 |
Operating Activities
For the year ended December 31, 2023, cash flows from operations of $785.8 million resulted primarily from our net income of approximately $445.1 million as well as the following:
Significant adjustments to net income
-
Stock-based compensation of $154.0 million related to equity awards granted to employees and directors; and
-
Depreciation and amortization of $142.4 million related to our investments in property, plant and equipment and intangible assets.
Significant changes in working capital
-
Inflow of $46.3 million, net from accrued and other long-term liabilities primarily due to higher incentive accruals for 2023, as well as timing of payments of other activities;
-
Inflow of $86.7 million, net from deferred revenues due to the deferral of revenue on shipments;
-
Inflow of $30.2 million, net from inventories primarily due to lower purchases of materials used in manufacturing; and
-
Outflow of $104.6 million, net from accounts receivable due to timing of collections and increased revenues.
For the year ended December 31, 2022, cash flows from operations of $568.7 million resulted primarily from our net income of approximately $361.6 million as well as the following:
Significant adjustments to net income
-
Stock-based compensation of $133.4 million related to equity awards granted to employees and directors;
-
Depreciation and amortization of $125.8 million related to our investments in property, plant and equipment and intangible assets; and
Significant changes in working capital
-
Inflow of $241.9 million, net from deferred revenues due to the deferral of revenue on shipments over the period as well as timing of revenue recognition;
-
Outflow of $130.1 million, net from inventories primarily due to lower shipment volumes over the period in addition to our efforts to manage stock at appropriate levels as required; and
-
Outflow of $121.9 million, net from accrued and other long-term liabilities primarily due to the payment of our 2021 corporate bonus as well as timing payment of other activities.
Investing Activities
Net cash used in investing activities was $195.9 million for the year ended December 31, 2023 which primarily consisted of purchases of property, plant and equipment of $177.7 million which included a building acquisition for $24.5 million, an investment in the equity of a privately held company of $77.0 million and purchases of marketable securities of $2.9 million, partially offset by sales and maturities of marketable securities of $61.4 million.
Net cash used in investing activities was $213.3 million for the year ended December 31, 2022 which primarily consisted of purchases of property, plant and equipment of $291.9 million, purchases of marketable securities of $28.0 million and $12.3 million cash paid relating to a business acquisition. These outflows were partially offset by sales and maturities of marketable securities of $121.1 million.
Financing Activities
Net cash used in financing activities was $598.3 million for the year ended December 31, 2023 which consisted of payments to repurchase shares of our common stock of $602.4 million and payroll taxes paid for equity awards through share withholdings of $22.6 million, which were partially offset by $26.6 million of proceeds from the issuance of common stock.
Net cash used in financing activities was $501.7 million for the year ended December 31, 2022 which consisted of payments to repurchase shares of our common stock of $475.0 million and payroll taxes paid for equity awards through share withholdings of $52.8 million, which were partially offset by $26.1 million of proceeds from the issuance of common stock.
Critical Accounting Estimates
Management’s discussion and analysis of our financial condition and results of operations is based upon our consolidated financial statements, which have been prepared in accordance with accounting principles generally accepted in the United States of America. The preparation of financial statements requires management to make estimates and judgments that affect the reported amounts of assets and liabilities, revenues and expenses and disclosures at the date of the financial statements. We
evaluate our estimates on an on-going basis and use authoritative pronouncements, historical experience and other assumptions as the basis for making the estimates. Actual results could differ from those estimates.
We believe the following critical accounting estimates affect our more significant judgments used in the preparation of our consolidated financial statements. For further information on all of our significant accounting policies, see Note 1 “Summary of Significant Accounting Policies” of the Notes to Consolidated Financial Statements.
Revenue Recognition
Our revenues are derived primarily from the sale of aligners, scanners, and services from our Clear Aligner and Systems and Services segments. We enter into sales contracts that may consist of multiple distinct performance obligations where certain performance obligations of the sales contract are not delivered in one reporting period. We measure and allocate revenues according to ASC 606-10, “Revenues from Contracts with Customers.”
Determining the standalone selling price (“SSP”) in order to allocate consideration from the contract to the individual performance obligations is the result of various factors, such as historical prices, changing trends and market conditions, costs, and gross margins. While changes in the allocation of the SSP between performance obligations will not affect the amount of total revenues recognized for a particular contract, any material changes could impact the timing of revenue recognition, which would have a material effect on our financial position and result of operations. This is because the contract consideration is allocated to each performance obligation, delivered or undelivered, at the inception of the contract based on the SSP of each distinct performance obligation.
We allocate consideration for each clear aligner treatment plan based on each unit’s SSP. Management considers a variety of factors such as same or similar product historical sales, costs, and gross margin, which may vary over time depending upon the unique facts and circumstances related to each performance obligation in making these estimates. In addition to historical data, we take into consideration changing trends and market conditions. For treatment plans with multiple options, we also consider usage rates, which is the number of times a customer is expected to order more aligners after the initial shipment. Our process for estimating usage rates requires significant judgment and evaluation of inputs, including historical usage data by region, country and channel.
We estimate the SSP of each element in a scanner system and services sale taking into consideration same or similar product historical prices as well as our discounting strategies. For CAD/CAM services, we estimate the SSP of each element, including the initial software license and maintenance and support, using data such as historical prices.
Unfulfilled Performance Obligations for Clear Aligners and Scanners
Our unfulfilled performance obligations, including deferred revenues and backlog, and the estimated revenues expected to be recognized in the future related to these performance obligations are $1,578.3 million and $1,515.4 million as of December 31, 2023 and 2022, respectively. This includes performance obligations from the Clear Aligner reportable segment, primarily the shipment of additional aligners, which are fulfilled over six months to five years. This also includes performance obligations from our Systems and Services reportable segment, primarily services and support, which are fulfilled over one to five years, and contracted deliveries of additional scanners. The estimate includes both product and service unfulfilled performance obligations and the time range reflects our best estimate of when we will transfer control to the customer and may change based on customer usage patterns, timing of shipments, readiness of customers' facilities for installation, and manufacturing availability.
Impairment of Goodwill and Finite-Lived Intangible Assets
Goodwill
We evaluate goodwill for impairment at least annually on November 30th or more frequently if indicators of impairment are identified between annual testing dates. Goodwill is tested for impairment between annual testing dates when events or circumstances indicate that the fair value of a reporting unit has been reduced below its carrying value. When an indicator of impairment is identified we perform a quantitative impairment assessment in which we determine the fair value of a reporting unit and compare it to the carrying value of the respective reporting unit. We generally determine the fair value of a reporting unit via a discounted cash flow analysis and allocate the net assets of the Company to each reporting unit to determine carrying value. We will record an impairment charge when our quantitative impairment analysis indicates that the carrying value of a reporting unit exceeds its fair value. Both the determination of fair value and carrying value of a reporting unit require management to exercise significant judgement related to operating assumptions and estimates and allocation methodologies.
Finite-Lived Intangible Assets
Finite-lived intangible assets are reviewed for impairment when events or circumstances indicate that the carrying value of an asset (asset group) may not be recoverable. When an impairment indicator is identified, we perform a recoverability test, in which the estimated, undiscounted future cash flows expected to result from the use and eventual disposition of the asset (asset group) are compared to the carrying value of the asset (asset group). When our recoverability test results in undiscounted cash flows more than carrying value, no impairment is recorded. However, when our recoverability test results in undiscounted cash flows that are less than carrying value, we determine the fair value of the asset (asset group) and reduce the carrying amount of the asset (asset group), through an impairment charge, to its fair value. The process of identifying impairment indicators, preparing an undiscounted cash flow and determining the fair value of the asset (asset group) require management to exercise significant judgement related to various assumptions and estimates.
If we were to have impairments to goodwill or finite-lived intangible assets, it could adversely affect our operating results. During the years ended 2023 and 2022, we did not have any impairment charges related to our goodwill or finite-lived intangible assets.
Accounting for Income Taxes
We are subject to income taxes in the U.S. and numerous foreign jurisdictions. The evaluation of our uncertain tax positions involves significant judgment in the interpretation and application of U.S. GAAP and complex domestic and international tax laws related to the allocation of international taxation rights between countries. We are also required to evaluate the realizability of our deferred tax assets on an ongoing basis in accordance with U.S. GAAP, which requires the assessment of both of our historical and future performance as well as other relevant factors. Realization of our deferred tax assets is dependent on our ability to generate future taxable income which is determined based on assumptions such as estimated growth rates in revenues, gross margins, future cash flows and discount rates. The accuracy of these estimates could be affected by unforeseen events or actual results, and the sustainability of our future tax benefits is dependent upon the acceptance of these valuation estimates and assumptions by the taxing authorities.
Accounting for Legal Proceedings and Litigation
Estimates of probable losses resulting from litigation are inherently difficult to make, particularly when the matters are in early procedural stages with incomplete facts and information. The final outcome of legal proceedings is dependent on many variables difficult to predict and, therefore, the ultimate cost to entirely resolve such matters may be materially different than the amount of current estimates. Consequently, new information or changes in judgments and estimates could have a material adverse effect on our business, financial condition, and results of operations or cash flows.
Recent Accounting Pronouncements
See Note 1 “Summary of Significant Accounting Policies” of the Notes to Consolidated Financial Statements for a discussion of recent accounting pronouncements, including the expected dates of adoption and estimated effects, if any, on results of operations and financial condition, which is incorporated herein.
Item 7A. Quantitative and Qualitative Disclosures About Market Risk.
In the normal course of business, we are exposed to interest rate, foreign currency exchange and inflation risks that could impact our financial position and results of operations. In addition, we are subject to the broad market risk that is created by the global market disruptions and uncertainties resulting from macroeconomic challenges, various military conflicts and consumer confidence. Further discussion on these risks may be found in Item 1A of this Annual Report on Form 10-K under the heading “Risk Factors”.
Interest Rate Risk
Changes in interest rates could impact our anticipated interest income on our cash and cash equivalents and investments in marketable securities. Our investments are fixed-rate short-term and long-term securities. Fixed-rate securities may have their fair market value adversely impacted due to a rise in interest rates, and, as a result, our future investment income may fall short of expectations or we may suffer losses in principal if forced to sell securities which have declined in market value due. As of December 31, 2023, we had approximately $43.3 million invested in available-for-sale marketable securities. An immediate 10% change in interest rates would not have a material adverse impact on our future operating results and cash flows.
We do not enter into investments for trading or speculative purposes and have not used any derivative financial instruments to manage our interest rate risk exposure. As of December 31, 2023, we are not subject to risks from immediate interest rate increases on our unsecured revolving line of credit facility.
Currency Rate Risk
As a result of our international business activities, our financial results have been affected by factors such as changes in foreign currency exchange rates as well as economic conditions in foreign markets, and there is no assurance that exchange rate fluctuations will not harm our business in the future. We generally sell our products in the local currency of the respective countries. This provides some natural hedging because most of the subsidiaries’ operating expenses are generally denominated in their local currencies.
We enter into foreign currency forward contracts for currencies where we have exposures, primarily the Euro, British Pound, Chinese Yuan, Polish Zloty and Canadian Dollar, to minimize the short-term impact of foreign currency exchange rate fluctuations on cash and certain trade and intercompany receivables and payables. These forward contracts are not designated as hedging instruments and are generally one month in original maturity and are marked to market through earnings every period. The gains and losses on these forward contracts are intended to offset the gains and losses in the underlying foreign currency denominated monetary assets and liabilities being economically hedged. We do not enter into foreign currency forward contracts for trading or speculative purposes. As our international operations grow, we will continue to reassess our approach to managing the risks relating to fluctuations in currency rates. It is difficult to predict the impact forward contracts could have on our results of operations.
Although we will continue to monitor our exposure to currency fluctuations, and, where appropriate, may use forward contracts to minimize the effect of these fluctuations, the impact of an aggregate change of 10% in foreign currency exchange rates relative to the U.S. dollar on our results of operations and financial position could be material.
Inflation Risk
The economy has been impacted by certain macroeconomic challenges which have contributed to a rising inflationary trend that have impacted both our revenues and costs globally, and which we expect will continue into the foreseeable future. If our costs become subject to significant inflationary pressures, we may not be able to fully offset such higher costs through price increases. There can be no assurance that our results of operations and financial condition will not be materially impacted by inflation in the future.
Item 8. Financial Statements and Supplementary Data.
INDEX TO CONSOLIDATED FINANCIAL STATEMENTS
REPORT OF MANAGEMENT ON INTERNAL CONTROL OVER FINANCIAL REPORTING
Management of Align is responsible for establishing and maintaining adequate internal control over financial reporting as defined in Rules 13a-15(f) and 15d-15(f) under the Securities Exchange Act of 1934. Our internal control over financial reporting is designed by, or under supervision of, our CEO and CFO, and effected by the board of directors, management and other personnel to provide reasonable assurance regarding the reliability of financial reporting and the preparation of financial statements for external purposes in accordance with generally accepted accounting principles. Internal control over financial reporting includes those policies and procedures that:
-
pertain to the maintenance of records that, in reasonable detail, accurately and fairly reflect the transactions and dispositions of the assets of Align;
-
provide reasonable assurance that transactions are recorded as necessary to permit preparation of financial statements in accordance with generally accepted accounting principles, and that receipts and expenditures of Align are being made only in accordance with authorizations of management and directors of Align; and
-
provide reasonable assurance regarding prevention or timely detection of unauthorized acquisition, use or disposition of Align’s assets that could have a material effect on the financial statements.
Because of its inherent limitations, internal control over financial reporting may not prevent or detect misstatements. In addition, projections of any evaluation of effectiveness to future periods are subject to the risk that controls may become inadequate because of changes in conditions or that the degree of compliance with the policies or procedures may deteriorate.
Management assessed the effectiveness of our internal control over financial reporting as of December 31, 2023. In making this assessment, management used the criteria set forth in Internal Control-Integrated Framework (2013) issued by the Committee of Sponsoring Organizations of the Treadway Commission (“COSO”).
Based on our assessment, management has concluded that, as of December 31, 2023, our internal control over financial reporting was effective based on criteria in Internal Control - Integrated Framework (2013) issued by the COSO.
The effectiveness of our internal control over financial reporting as of December 31, 2023 has been audited by PricewaterhouseCoopers LLP, an independent registered public accounting firm, as stated in their report which is included herein.
| /S/ JOSEPH M. HOGAN | ||
| Joseph M. Hogan | ||
| President and Chief Executive Officer | ||
| February 28, 2024 | ||
| /S/ JOHN F. MORICI | ||
| John F. Morici | ||
| Chief Financial Officer and Executive Vice President, Global Finance | ||
| February 28, 2024 |
Report of Independent Registered Public Accounting Firm
To the Board of Directors and Stockholders of Align Technology, Inc.
Opinions on the Financial Statements and Internal Control over Financial Reporting
We have audited the accompanying consolidated balance sheets of Align Technology, Inc. and its subsidiaries (the “Company”) as of December 31, 2023 and 2022, and the related consolidated statements of operations, of comprehensive income, of stockholders’ equity and of cash flows for each of the three years in the period ended December 31, 2023, including the related notes and financial statement schedule listed in the index appearing under Item 15(a)(2) (collectively referred to as the “consolidated financial statements”). We also have audited the Company's internal control over financial reporting as of December 31, 2023, based on criteria established in Internal Control - Integrated Framework (2013) issued by the Committee of Sponsoring Organizations of the Treadway Commission (COSO).
In our opinion, the consolidated financial statements referred to above present fairly, in all material respects, the financial position of the Company as of December 31, 2023 and 2022, and the results of its operations and its cash flows for each of the three years in the period ended December 31, 2023 in conformity with accounting principles generally accepted in the United States of America. Also in our opinion, the Company maintained, in all material respects, effective internal control over financial reporting as of December 31, 2023, based on criteria established in Internal Control - Integrated Framework (2013) issued by the COSO.
Basis for Opinions
The Company's management is responsible for these consolidated financial statements, for maintaining effective internal control over financial reporting, and for its assessment of the effectiveness of internal control over financial reporting, included in the accompanying Report of Management on Internal Control Over Financial Reporting. Our responsibility is to express opinions on the Company’s consolidated financial statements and on the Company's internal control over financial reporting based on our audits. We are a public accounting firm registered with the Public Company Accounting Oversight Board (United States) (PCAOB) and are required to be independent with respect to the Company in accordance with the U.S. federal securities laws and the applicable rules and regul
Showing the first 8K of 176K characters. Open the full section
Item 9. Changes in and Disagreements With Accountants on Accounting and Financial Disclosure.
None.
Item 9A. Controls and Procedures.
Evaluation of disclosure controls and procedures.
Under the supervision and with the participation of our management, including our Chief Executive Officer and our Chief Financial Officer, we have evaluated the effectiveness of the design and operation of our disclosure controls and procedures (as defined in Rules 13a-15(e) and 15d-15(e) under the Exchange Act). Based upon that evaluation, our Chief Executive Officer and our Chief Financial Officer have concluded that our disclosure controls and procedures are effective as of December 31, 2023 to provide reasonable assurance that information required to be disclosed by us in the reports that we file or submit under the Exchange Act is accumulated and communicated to our management, including our Chief Executive Officer and our Chief Financial Officer, as appropriate, to allow timely decisions regarding required disclosure, and that such information is recorded, processed, summarized and reported within the time periods specified in the Securities and Exchange Commission rules and forms.
Management's annual report on internal control over financial reporting.
See “Report of Management on Internal Control over Financial Reporting” of this Annual Report on Form 10-K.
Changes in internal control over financial reporting.
There have been no changes in our internal control over financial reporting during the quarter ended December 31, 2023 that have materially affected, or are reasonably likely to materially affect, our internal control over financial reporting.
Item 9B. Other Information.
During the fiscal quarter ended December 31, 2023, no director or officer, as defined in Rule 16a-1(f) of the Exchange Act, adopted or terminated a “Rule 10b5-1 trading arrangement” or a “non-Rule 10b5-1 trading arrangement,” each as defined in Regulation S-K Item 408.
Item 9C. Disclosure Regarding Foreign Jurisdictions that Prevent Inspections.
None.
PART III
Certain information required by Part III is omitted from this Form 10-K because we intend to file a definitive Proxy Statement for our 2023 Annual Meeting of Stockholders (the “Proxy Statement”) not later than 120 days after the end of the fiscal year covered by this Annual Report on Form 10-K, and certain information to be included therein is incorporated herein by reference.
Item 10. Directors, Executive Officers and Corporate Governance.
The information required by Item 401 of Regulation S-K concerning our directors is incorporated by reference to the Proxy Statement under the section captioned “Directors.” The information required by Item 401 of Regulation S-K concerning our executive officers is set forth in Item 1— “Business” of this Annual Report on Form 10-K. The information required by Item 405 of Regulation S-K is incorporated by reference to the section entitled “Delinquent Section 16(a) Reports” contained in
the Proxy Statement. The information required by Item 407(c)(3), 407(d)(4) and 407(d)(5) of Regulation S-K is incorporated by reference to the Proxy Statement under the section entitled “Corporate Governance”.
Code of Ethics
We have a code of ethics (which we call our Global Code of Conduct) that applies to all of our employees, including our principal executive officer, principal financial officer and controller. Our Global Code of Conduct is posted on the investor relations portion of our website at http://investor.aligntech.com within the section captioned “Corporate Governance”.
We intend to satisfy the disclosure requirement under Item 5.05 of Form 8-K regarding an amendment to, or waiver from, a provision of this code of ethics by posting such information on our website, at the address and location specified above, or as otherwise required by the NASDAQ Global Select Market.
Item 11. Executive Compensation.
The information required by Item 402 of Regulation S-K is incorporated by reference to the Proxy Statement under the section captioned “Executive Compensation - Compensation Discussion and Analysis.” The information required by Items 407(e)(4) and (e)(5) is incorporated by reference to the Proxy Statement under the section captioned “Corporate Governance - Committee Responsibilities and Oversight - Compensation and Human Capital Committee Interlocks and Insider Participation” and “Compensation and Human Capital Committee of the Board Report,” respectively.
Item 12. Security Ownership of Certain Beneficial Owners and Management and Related Stockholder Matters.
The information required by Item 403 of Regulation S-K is incorporated by reference to the Proxy Statement under the sections captioned “Security Ownership of Certain Beneficial Owners and Management”.
Equity Compensation Plan Information
The following table provides information as of December 31, 2023 about our common stock that may be issued upon the awards granted to employees, consultants or members of our Board of Directors under all existing equity compensation plans, including the 2005 Incentive Plan and the Employee Stock Purchase Plan (“ESPP”), each as amended, and certain individual arrangements (Refer to Note 9 "Stockholders’ Equity” of the Notes to Consolidated Financial Statements for a description of our equity compensation plans).
| Plan Category | Number of securities to be issued upon exercise of outstanding options and restricted stock units (a) | Weighted average exercise price of outstanding options (b) | Number of securities remaining available for future issuance under equity compensation plans (excluding securities reflected in column (a)) | ||||||||||||||||||||
| Equity compensation plans approved by security holders | 898,838 | 1 | $ | — | 7,241,323 | 2, 3 | |||||||||||||||||
| Equity compensation plans not approved by security holders | — | — | — | ||||||||||||||||||||
| Total | 898,838 | $ | — | 7,241,323 |
1 Includes 741,185 RSUs and 157,653 MSUs at 100% of target
2 Includes 1,995,453 shares available for issuance under our ESPP. We are unable to ascertain with specificity the number of securities to be issued upon exercise of outstanding rights or the weighted average exercise price of outstanding rights under the ESPP.
3 Includes additional 449,311 of potentially issuable MSUs above target if performance targets are achieved at maximum payout of 250% (in addition to the reserve for one and nine-tenths (1 9/10) shares for every one (1) issuable share against the authorized share reserve)
Item 13. Certain Relationships and Related Transactions, and Director Independence.
The information required by Item 404 and Item 407 of Regulation S-K is incorporated by reference to the Proxy Statement under the sections captioned “Certain Relationships and Related Party Transactions” and “Corporate Governance—Board Structure and Independence,” respectively.
Item 14. Principal Accountant Fees and Services.
The information required by Item 9(e) of Schedule 14A of the Securities Act of 1934, as amended, is incorporated by reference to the Proxy Statement under the section captioned “Ratification of Appointment of Independent Registered Public Accountants.”
PART IV
Item 15. Exhibit and Financial Statement Schedules.
(a)Financial Statements
1.Consolidated financial statements
The following documents are filed as part of this Annual Report on Form 10-K:
| Report of Independent Registered Public Accounting Firm | 54 | ||||
| Consolidated Statements of Operations for the year ended December 31, 2023, 2022 and 2021 | 56 | ||||
| Consolidated Statements of Comprehensive Income for the year ended December 31, 2023, 2022 and 2021 | 57 | ||||
| Consolidated Balance Sheets as of December 31, 2023 and 2022 | 58 | ||||
| Consolidated Statements of Stockholders’ Equity for the year ended December 31, 2023, 2022 and 2021 | 59 | ||||
| Consolidated Statements of Cash Flows for the year ended December 31, 2023, 2022 and 2021 | 60 | ||||
| Notes to Consolidated Financial Statements | 61 |
2.The following financial statement schedule is filed as part of this Annual Report on Form 10-K:
Schedule II—Valuation and Qualifying Accounts and Reserves for the year ended December 31, 2023, 2022 and 2021
All other schedules have been omitted as they are not required, not applicable, or the required information is otherwise included.
SCHEDULE II: VALUATION AND QUALIFYING ACCOUNTS AND RESERVES
| Balance at Beginning of Period | Additions (Reductions) to Costs and Expenses | Write Offs | Balance at End of Period | |||||||||||||||||||||||
| (in thousands) | ||||||||||||||||||||||||||
| Allowance for doubtful accounts: | ||||||||||||||||||||||||||
| Year Ended December 31, 2021 | $ | 10,239 | $ | 2,814 | $ | (3,808) | $ | 9,245 | ||||||||||||||||||
| Year Ended December 31, 2022 | $ | 9,245 | $ | 4,102 | $ | (3,004) | $ | 10,343 | ||||||||||||||||||
| Year Ended December 31, 2023 | $ | 10,343 | $ | 8,002 | $ | (3,452) | $ | 14,893 | ||||||||||||||||||
| Valuation allowance for deferred tax assets: | ||||||||||||||||||||||||||
| Year Ended December 31, 2021 | $ | 1,325 | $ | 11,613 | $ | — | $ | 12,938 | ||||||||||||||||||
| Year Ended December 31, 2022 | $ | 12,938 | $ | 10,348 | $ | — | $ | 23,286 | ||||||||||||||||||
| Year Ended December 31, 2023 | $ | 23,286 | $ | (8,295) | $ | — | $ | 14,991 |
(b)The following Exhibits are included in this Annual Report on Form 10-K:
| Exhibit Number | Description | Form | Date | Exhibit Number Incorporated by Reference herein | Filed herewith | |||||||||||||||
| 101.INS | Inline XBRL Instance Document (the instance document does not appear in the Interactive Data File because its XBRL tags are embedded within the Inline XBRL document). | * | ||||||||||||||||||
| 101.SCH | Inline XBRL Taxonomy Extension Schema Document | * | ||||||||||||||||||
| 101.CAL | Inline XBRL Taxonomy Extension Calculation Linkbase Document | * | ||||||||||||||||||
| 101.DEF | Inline XBRL Taxonomy Extension Definition Linkbase Document | * | ||||||||||||||||||
| 101.LAB | Inline XBRL Taxonomy Extension Label Linkbase Document | * | ||||||||||||||||||
| 101.PRE | Inline XBRL Taxonomy Extension Presentation Linkbase Document | * | ||||||||||||||||||
| 104 | Cover Page Interactive Data File (formatted as inline XBRL and contained in Exhibit 101) | * |
| ** | Portions of the exhibit, marked by brackets and asterisks [***], have been omitted because the omitted information is not material and (i) would likely cause competitive harm to the registrant if publicly disclosed or (ii) is information that the registrant treats as private or confidential. | ||||
| † | Management contract or compensatory plan or arrangement filed as an Exhibit to this form pursuant to Items 14(a) and 14(c) of Form 10-K. | ||||
| t | Furnished herewith |
Item 16. Form 10-K Summary.
Not applicable.
SIGNATURES
Pursuant to the requirements of Section 13 or 15(d) of the Securities Exchange Act of 1934, the Registrant has duly caused this report to be signed on its behalf by the undersigned, thereunto duly authorized.
| ALIGN TECHNOLOGY, INC. | |||||
| By: | /S/ JOSEPH M. HOGAN | ||||
| Joseph M. Hogan | |||||
| President and Chief Executive Officer | |||||
| Date: | February 28, 2024 |
Each person whose signature appears below constitutes and appoints Joseph M. Hogan or John F. Morici, his or her attorney-in-fact, with the power of substitution, for him or her in any and all capacities, to sign any amendments to this Report on Form 10-K and to file the same, with exhibits thereto and other documents in connection therewith, with the Securities and Exchange Commission, hereby ratifying and confirming all that each of said attorneys-in-fact, or his or her substitute or substitutes, may do or cause to be done by virtue hereof.
Pursuant to the requirements of the Securities Exchange Act of 1934, this report has been signed below by the following persons on behalf of the Registrant and in the capacities and on the dates indicated.
| Signature | Title | Date | ||||||||||||
| /S/ JOSEPH M. HOGAN | President, Chief Executive Officer and Director (Principal Executive Officer) | February 28, 2024 | ||||||||||||
| Joseph M. Hogan | ||||||||||||||
| /S/ JOHN F. MORICI | Chief Financial Officer and Executive Vice President, Global Finance (Principal Financial Officer and Principal Accounting Officer) | February 28, 2024 | ||||||||||||
| John F. Morici | ||||||||||||||
| /S/ KEVIN T. CONROY | Director | February 28, 2024 | ||||||||||||
| Kevin T. Conroy | ||||||||||||||
| /S/ KEVIN J. DALLAS | Director | February 28, 2024 | ||||||||||||
| Kevin J. Dallas | ||||||||||||||
| /S/ JOSEPH LACOB | Director | February 28, 2024 | ||||||||||||
| Joseph Lacob | ||||||||||||||
| /S/ C. RAYMOND LARKIN, JR. | Director | February 28, 2024 | ||||||||||||
| C. Raymond Larkin, Jr. | ||||||||||||||
| /S/ GEORGE J. MORROW | Director | February 28, 2024 | ||||||||||||
| George J. Morrow | ||||||||||||||
| /S/ ANNE M. MYONG | Director | February 28, 2024 | ||||||||||||
| Anne M. Myong | ||||||||||||||
| /S/ MOJDEH POUL | Director | February 28, 2024 | ||||||||||||
| Mojdeh Poul | ||||||||||||||
| /S/ ANDREA L. SAIA | Director | February 28, 2024 | ||||||||||||
| Andrea L. Saia | ||||||||||||||
| /S/ SUSAN E. SIEGEL | Director | February 28, 2024 | ||||||||||||
| Susan E. Siegel |