 filings.tools
Align Technology 10-Q 2024-03-31
Filed 2024-05-03. 8 sections, 260K characters. Original on sec.gov · Markdown · JSON
Cover and table of contents
UNITED STATES
SECURITIES AND EXCHANGE COMMISSION
Washington, D.C. 20549
FORM 10-Q
(Mark One)
| ☒ | QUARTERLY REPORT PURSUANT TO SECTION 13 OR 15(d) OF THE SECURITIES EXCHANGE ACT OF 1934 |
For the quarterly period ended March 31, 2024
or
| ☐ | TRANSITION REPORT PURSUANT TO SECTION 13 OR 15(d) OF THE SECURITIES EXCHANGE ACT OF 1934 |
For the transition period from to
Commission file number: 000-32259
ALIGN TECHNOLOGY, INC.
(Exact name of registrant as specified in its charter)
| Delaware | 94-3267295 | ||||
| (State or other jurisdiction of incorporation or organization) | (I.R.S. Employer Identification Number) |
410 North Scottsdale Road, Suite 1300
Tempe, Arizona 85288
(Address of principal executive offices, including zip code)
(602) 742-2000
(Registrant’s telephone number, including area code)
Securities registered pursuant to Section 12(b) of the Act:
| Title of each class | Trading Symbol(s) | Name of each exchange on which registered | ||||||
| Common Stock, $0.0001 par value | ALGN | The NASDAQ Stock Market LLC | ||||||
| (NASDAQ Global Select Market) |
Indicate by check mark whether the registrant (1) has filed all reports required to be filed by Section 13 or 15(d) of the Securities Exchange Act of 1934 during the preceding 12 months (or for such shorter period that the registrant was required to file such reports), and (2) has been subject to such filing requirements for the past 90 days. Yes ☒ No ☐
Indicate by check mark whether the registrant has submitted electronically every Interactive Data File required to be submitted pursuant to Rule 405 of Regulation S-T (§232.405 of this chapter) during the preceding 12 months (or for such shorter period that the registrant was required to submit such files). Yes ☒ No ☐
Indicate by check mark whether the registrant is a large accelerated filer, an accelerated filer, a non-accelerated filer, a smaller reporting company, or an emerging growth company. See definitions of “large accelerated filer,” “accelerated filer,” “smaller reporting company” and “emerging growth company” in Rule 12b-2 of the Exchange Act.
| Large accelerated filer | ☒ | Accelerated filer | ☐ | ||||||||
| Non-accelerated filer | ☐ | Smaller reporting company | ☐ | ||||||||
| Emerging growth company | ☐ | ||||||||||
| If an emerging growth company, indicate by check mark if the registrant has elected not to use the extended transition period for complying with any new or revised financial accounting standards provided pursuant to Section 13(a) of the Exchange Act. ☐ |
Indicate by check mark whether the registrant is a shell company (as defined in Rule 12b-2 of the Exchange Act). Yes ☐ No ☒
The number of shares outstanding of the registrant’s Common Stock, $0.0001 par value, as of April 26, 2024 was 75,281,687.
ALIGN TECHNOLOGY, INC.
TABLE OF CONTENTS
Invisalign, Align, the Invisalign logo, ClinCheck, Invisalign Assist, Invisalign Teen, Invisalign First, Invisalign Go, the Invisalign sonic logo, Vivera, SmartForce, SmartTrack, SmartStage, SmileView, iTero, iTero Element, iTero Lumina, Orthocad, exocad, Align Digital Platform, Smile Architect, iTero exocad Connector and exocad Dental CAD, among others, are trademarks and/or service marks of Align Technology, Inc. or one of its subsidiaries or affiliated companies and may be registered in the United States and/or other countries.
PART I—FINANCIAL INFORMATION
Item 1. Financial Statements.
ALIGN TECHNOLOGY, INC.
CONDENSED CONSOLIDATED STATEMENTS OF OPERATIONS
(in thousands, except per share data)
(unaudited)
| Three Months Ended March 31, | ||||||||||||||||||||||||||
| 2024 | 2023 | |||||||||||||||||||||||||
| Net revenues | $ | 997,431 | $ | 943,147 | ||||||||||||||||||||||
| Cost of net revenues | 299,615 | 282,493 | ||||||||||||||||||||||||
| Gross profit | 697,816 | 660,654 | ||||||||||||||||||||||||
| Operating expenses: | ||||||||||||||||||||||||||
| Selling, general and administrative | 451,822 | 439,691 | ||||||||||||||||||||||||
| Research and development | 91,859 | 87,447 | ||||||||||||||||||||||||
| Total operating expenses | 543,681 | 527,138 | ||||||||||||||||||||||||
| Income from operations | 154,135 | 133,516 | ||||||||||||||||||||||||
| Interest income and other income (expense), net: | ||||||||||||||||||||||||||
| Interest income | 4,392 | 2,337 | ||||||||||||||||||||||||
| Other income (expense), net | (141) | (1,229) | ||||||||||||||||||||||||
| Total interest income and other income (expense), net | 4,251 | 1,108 | ||||||||||||||||||||||||
| Net income before provision for income taxes | 158,386 | 134,624 | ||||||||||||||||||||||||
| Provision for income taxes | 53,358 | 46,826 | ||||||||||||||||||||||||
| Net income | $ | 105,028 | $ | 87,798 | ||||||||||||||||||||||
| Net income per share: | ||||||||||||||||||||||||||
| Basic | $ | 1.40 | $ | 1.14 | ||||||||||||||||||||||
| Diluted | $ | 1.39 | $ | 1.14 | ||||||||||||||||||||||
| Shares used in computing net income per share: | ||||||||||||||||||||||||||
| Basic | 75,175 | 76,921 | ||||||||||||||||||||||||
| Diluted | 75,322 | 77,111 |
The accompanying notes are an integral part of these unaudited condensed consolidated financial statements.
ALIGN TECHNOLOGY, INC.
CONDENSED CONSOLIDATED STATEMENTS OF COMPREHENSIVE INCOME
(in thousands)
(unaudited)
| Three Months Ended March 31, | ||||||||||||||||||||||||||
| 2024 | 2023 | |||||||||||||||||||||||||
| Net income | $ | 105,028 | $ | 87,798 | ||||||||||||||||||||||
| Other comprehensive income (loss): | ||||||||||||||||||||||||||
| Change in foreign currency translation adjustment, net of tax | (2,932) | 10,474 | ||||||||||||||||||||||||
| Change in unrealized gains (losses) on investments, net of tax | 203 | 1,645 | ||||||||||||||||||||||||
| Other comprehensive income (loss) | (2,729) | 12,119 | ||||||||||||||||||||||||
| Comprehensive income | $ | 102,299 | $ | 99,917 |
The accompanying notes are an integral part of these unaudited condensed consolidated financial statements.
ALIGN TECHNOLOGY, INC.
CONDENSED CONSOLIDATED BALANCE SHEETS
(in thousands, except per share data)
(unaudited)
| March 31, 2024 | December 31, 2023 | |||||||||||||
| ASSETS | ||||||||||||||
| Current assets: | ||||||||||||||
| Cash and cash equivalents | $ | 865,805 | $ | 937,438 | ||||||||||
| Marketable securities, short-term | 33,101 | 35,304 | ||||||||||||
| Accounts receivable, net of allowance for doubtful accounts of $16,026 and $14,893, respectively | 950,738 | 903,424 | ||||||||||||
| Inventories | 280,076 | 296,902 | ||||||||||||
| Prepaid expenses and other current assets | 349,594 | 273,550 | ||||||||||||
| Total current assets | 2,479,314 | 2,446,618 | ||||||||||||
| Marketable securities, long-term | 3,619 | 8,022 | ||||||||||||
| Property, plant and equipment, net | 1,281,709 | 1,290,863 | ||||||||||||
| Operating lease right-of-use assets, net | 118,996 | 117,999 | ||||||||||||
| Goodwill | 458,235 | 419,530 | ||||||||||||
| Intangible assets, net | 121,424 | 82,118 | ||||||||||||
| Deferred tax assets | 1,570,626 | 1,590,045 | ||||||||||||
| Other assets | 121,831 | 128,682 | ||||||||||||
| Total assets | $ | 6,155,754 | $ | 6,083,877 | ||||||||||
| LIABILITIES AND STOCKHOLDERS’ EQUITY | ||||||||||||||
| Current liabilities: | ||||||||||||||
| Accounts payable | $ | 117,238 | $ | 113,125 | ||||||||||
| Accrued liabilities | 496,601 | 525,780 | ||||||||||||
| Deferred revenues | 1,409,202 | 1,427,706 | ||||||||||||
| Total current liabilities | 2,023,041 | 2,066,611 | ||||||||||||
| Income tax payable | 121,314 | 116,744 | ||||||||||||
| Operating lease liabilities | 95,092 | 96,968 | ||||||||||||
| Other long-term liabilities | 156,447 | 173,065 | ||||||||||||
| Total liabilities | 2,395,894 | 2,453,388 | ||||||||||||
| Commitments and contingencies (Note 7 and Note 8) | ||||||||||||||
| Stockholders’ equity: | ||||||||||||||
| Preferred stock, $0.0001 par value (5,000 shares authorized; none issued) | — | — | ||||||||||||
| Common stock, $0.0001 par value (200,000 shares authorized; 75,281 and 75,075 issued and outstanding, respectively) | 7 | 7 | ||||||||||||
| Additional paid-in capital | 1,23 |
Showing the first 8K of 101K characters. Open the full section
Item 2. Management’s Discussion and Analysis of Financial Condition and Results of Operations.
Forward-Looking Statements
In addition to historical information, this quarterly report on Form 10-Q contains forward-looking statements within the meaning of Section 27A of the Securities Act of 1933, as amended (the “Securities Act”), and Section 21E of the Securities Exchange Act of 1934, as amended (the “Exchange Act”). These statements include, among other things, our expectations and intentions regarding our strategic objectives and the means to achieve them, our beliefs and expectations regarding macroeconomic conditions, including inflation, fluctuations in currency exchange rates, rising interest rates, market volatility, weakness in general economic conditions and recessions and the impact of efforts by central banks and federal, state and local governments to combat inflation and recession, our expectations and beliefs regarding customer and consumer purchasing behavior and changes in consumer spending habits, our expectations regarding product mix and product adoption, our expectations regarding competition and our ability to compete in our target markets, our expectations regarding the sales growth of our intraoral scanners, clear aligners and other products, our expectations regarding the impact of the military conflicts in the Middle East and Ukraine and our operations and assets in Israel and Russia, our marketing and efforts to build our brand awareness, our estimates regarding the size and opportunities of the markets we are targeting along with our expectations for growth in those markets, our beliefs regarding the impact of technological innovation in general, and in our solutions and products in particular, on target markets and patient care, our beliefs regarding digital dentistry and its potential to impact our business, our intentions regarding expanding our business, including its impact on our operational flexibility and responsiveness to customer demand, our beliefs regarding the importance of our manufacturing operations on our success, our beliefs regarding the need for and benefits of our technological development on Invisalign treatment, the areas of development in which we focus our efforts, and the advantages of our intellectual property portfolio, our beliefs regarding our business strategy and growth drivers, our expectations regarding the utilization rates for our products, including the impact of marketing on those rates and causes for periodic fluctuations of the rates, our expectations regarding the existence and impact of seasonality, our expectations regarding the productivity impact sales representatives will have on our sales and the impact of specialization of those representatives in sales channels, our expectations regarding the continued expansion of our international markets and their growth, our expectations regarding staying in compliance with laws and regulations currently applicable to, or which may become applicable to, our business both in the United States and internationally, our beliefs regarding our culture and commitment and its impact on our financial and operational performance and its importance to our future success, our expectations for future investments in and benefits from sales and marketing activities, our preparedness and our customers’ preparedness to react to changing circumstances and demand, our expectations for our expenses and capital obligations and expenditures in particular, our intentions to control spending and for investments, our intentions regarding the investment of our international earnings from operations, our belief regarding the sufficiency of our cash and investment balances and borrowing capacity, our judgments regarding the estimates used in our revenue recognition and assessment of goodwill and intangible assets, our expectations regarding our tax positions and the judgements we make related to our tax obligations, our predicted level of operating expenses and gross margins and other factors beyond our control, as well as other statements regarding our future operations, financial condition and prospects and business strategies. These statements may contain words such as “expects,” “anticipates,” “intends,” “plans,” “believes,” “estimates,” or other words indicating future results. These forward-looking statements are subject to certain risks and uncertainties that could cause actual results to differ materially from those reflected in the forward-looking statements. Factors that could cause or contribute to such differences include, but are not limited to, those discussed in Part I, Item 2 “Management’s Discussion and Analysis of Financial Condition and Results of Operations,” and in particular, the risks discussed below in Part II, Item 1A “Risk Factors.” We undertake no obligation to revise or update these forward-looking statements. Given these risks and uncertainties, readers are cautioned not to place undue reliance on such forward-looking statements.
The following discussion and analysis of our financial condition and results of operations should be read together with our Condensed Consolidated Financial Statements and related notes included elsewhere in this Quarterly Report on Form 10-Q and with our audited Consolidated Financial Statements included in our Annual Report on Form 10-K for the year ended December 31, 2023 as filed with the Securities and Exchange Commission (the “SEC”).
Executive Overview of Results
Trends and Uncertainties
Our business strategic priorities focus on four principal pillars for growth: (i) international expansion; (ii) general dental practitioners (“GP”) treatment; (iii) patient demand; and (iv) orthodontic utilization. Our growth strategy depends on our ability to facilitate the digital transformation of dentistry happening around the world, our continuous focus on innovation, and expansion to meet and exceed evolving customer expectations as the array of products and services available to them increases. Below is a discussion of the significant trends and uncertainties that could impact our operations:
Macroeconomic Challenges and Military Conflicts in Ukraine and the Middle East
Our revenues are susceptible to fluctuations caused by macroeconomic conditions, inflation, changes to currency exchange rates, rising interest rates, actual and threatened wars and military actions, threats of or actual recessions, supply chain challenges, market volatility, and other factors, each of which impacts customer confidence, consumer sentiment and demand. Many of these same factors also impact our costs and those of our suppliers through higher raw material prices, transportation costs, labor costs, supply and distribution operations. In 2023, we believe that sales of our products were primarily harmed by macroeconomic conditions that ultimately adversely impacted disposable income and consumer demand and this trend could continue in 2024. Additionally, for 2024, we expect the military conflict between Russia and Ukraine to continue to create market uncertainties and dampen consumer sentiment and demand, particularly in Europe. The impact of declining demand may vary by time and region, making operational results uncertain and difficult to predict.
Additionally, many of our international operations are denominated in currencies other than the U.S. dollar. In the first quarter of 2024, the U.S. dollar weakened against major currencies on a sequential basis, which favorably impacted our financial condition and results of operations for the quarter. However, on a year-over-year basis, the net impact from foreign exchange volatility was unfavorable to our financial condition and results of operations for the quarter. Foreign exchange volatility and the subsequent strengthening or weakening of the U.S dollar against other currencies remains uncertain and unpredictable.
The recent conflict in the Middle East may further exacerbate general and regional macroeconomic instability, particularly if fighting is prolonged, it spreads to other locations, creates shipping and logistical challenges or cost increases, or leads to sanctions or boycotts. Our iTero business is headquartered in Israel and the timing and cost of shipping our products has been impacted. Additionally, we have employees and consultants in Israel that have been called for military service and they may be unavailable for an unknown period of time. The conflict may continue to spread to other areas which may further impact our business. We continue to monitor the potential for violence and military actions that may directly or indirectly impact our personnel, manufacturing, supply chain, and sales.
Changing Product Preferences
As the markets for clear aligners and digital processes and workflows used to transform the practice of dentistry continue to mature, we anticipate customer and patient expectations and demands will evolve. We expect to meet customer demands with innovative treatment options that include more choices to address a wider scope of treatment goals and budgets based on our existing and new products. This may result in larger and unpredictable variations in geographic and product mix and selling prices with uncertain implications on our financial statements and business operations.
We strive to manage the challenges from the trends and uncertainties, including the macroeconomic conditions, military conflicts and the evolution of our target markets, by focusing on improving our operations, building flexibility and efficiencies in our processes, adjusting our business models to changing circumstances and offering products that meet market demand. Specifically, we are managing cost impacts through pricing actions, implementing cost saving measures and slowing hiring. We also continue to innovate and introduce new and enhanced products that augment our doctor customer and patient experiences.
For instance, in 2023, there was significant adoption of the Invisalign Comprehensive 3in3 product and we anticipate continued adoption in 2024. The 3in3 configuration offers doctors Invisalign Comprehensive treatment with a three-year treatment expiration date and three additional clear aligners included prior to the treatment expiration date. The 3in3 product allows us to recognize more revenue up front but is offered at a lower price as compared to our traditional Invisalign comprehensive product that has a five-year treatment expiration date with unlimited additional clear aligners prior to the treatment end date.
Further discussion of the impact of these challenges on our business may be found in Part II, Item 1A of this Quarterly Report on Form 10-Q under the heading “Risk Factors.”
Key Financial and Operating Metrics
We measure our performance against these strategic priorities by the achievement of key financial and operating metrics.
For the three months ended March 31, 2024, our business operations reflect the following:
-
Revenues of $997.4 million, an increase of 5.8% year-over-year;
-
Clear Aligner revenues of $817.3 million, an increase of 3.5% year-over-year;
◦Americas Clear Aligner revenues of $372.3 million, an increase of 1.6% year-over-year;
◦International Clear Aligner revenues of $370.6 million, an increase of 4.6% year-over-year;
◦Clear Aligner case volume increased 2.4% year-over-year and Clear Aligner case volume increase for teenage patients of 5.8% year-over-year;
-
Imaging Systems and CAD/CAM Services revenues of $180.2 million, an increase of 17.5% year-over-year;
-
Income from operations of $154.1 million and operating margin of 15.5%;
-
Effective tax rate of 33.7%;
-
Net income of $105.0 million with diluted net income per share of $1.39;
-
Cash, cash equivalents and marketable securities of $902.5 million as of March 31, 2024;
-
Operating cash flow of $28.7 million;
-
Capital expenditures of $9.4 million, predominantly related to increases in our manufacturing capacity and facilities; and
-
Number of employees was 21,670 as of March 31, 2024, a decrease of 5.9% year-over-year.
Other Statistical Data and Trends
-
As of March 31, 2024, approximately 17.6 million people worldwide have been treated with our Invisalign system. Management measures these results by comparing to the millions of people who can benefit from straighter teeth and uses this data to target opportunities to expand the market for orthodontics by educating consumers about the benefits of straighter teeth using the Invisalign system.
-
For the first quarter of 2024, total Invisalign cases submitted with a digital scanner in the Americas increased to 95.6%, up from 93.4%* in the first quarter of 2023 and international scans increased to 88.9%, up from 86.9%* in the first quarter of 2023. For the first quarter of 2024, 98.2% of Invisalign cases submitted by North American orthodontists were submitted digitally.
-
The total utilization rate in the first quarter of 2024 increased to 7.2 cases per doctor compared to 7.1 cases per doctor in the first quarter of 2023. Utilization rates in North America and our International locations were as follows:
▪North America: The utilization rate among our North American orthodontist customers decreased to 28.2 cases per doctor in the first quarter of 2024 compared to 28.7* cases per doctor in the first quarter of 2023 and the utilization rate among our North American GP customers remained flat at 4.9 cases per doctor in the first quarter of 2024 compared to the first quarter of 2023.
▪International: International doctor utilization rate was 6.3 cases per doctor in the first quarter of 2024 compared to 6.2 cases per doctor in the first quarter of 2023.
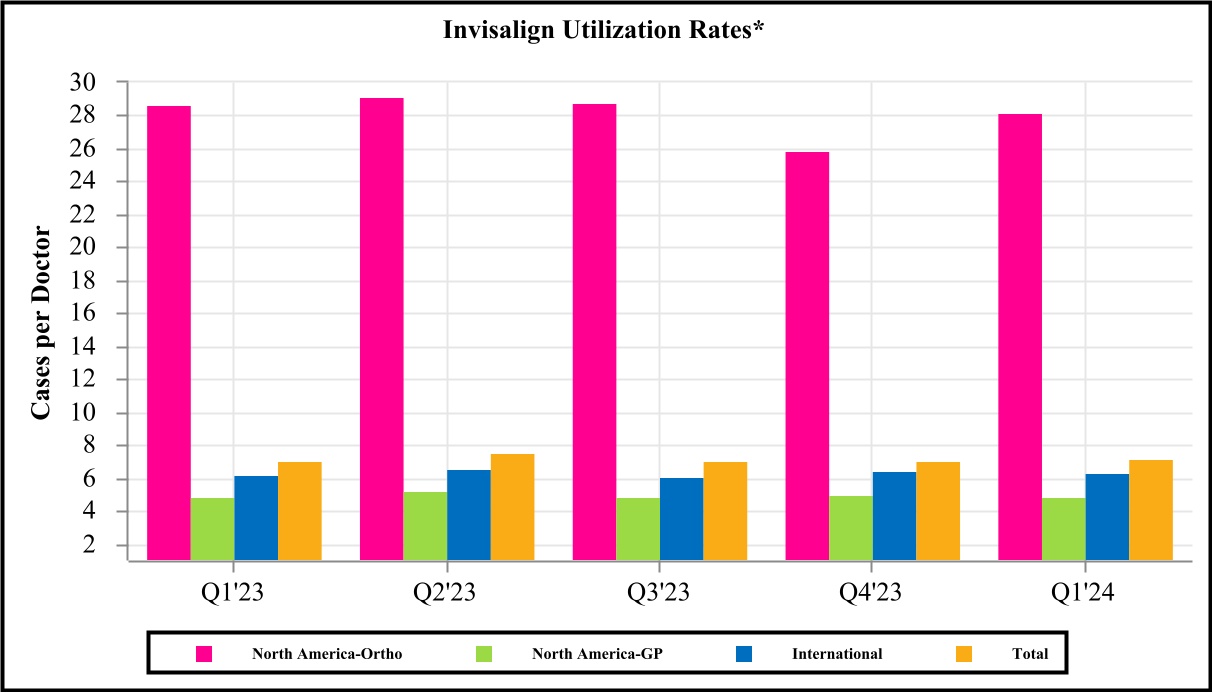
***** Invisalign utilization rates are calculated by the number of cases shipped divided by the number of doctors to whom cases were shipped. Our International region includes Europe, Middle East and Africa (“EMEA”) and Asia Pacific (“APAC”). Latin America (“LATAM”) is excluded from the International region based on its immateriality to the quarter; however is included in the Total utilization.
During the third quarter of 2023, we began including Touch Up case revenues in Americas and/or International net revenues that were previously included in Non-Case revenues and have recast business metrics for the periods presented above accordingly.
Results of Operations
Net Revenues by Reportable Segment
We group our operations into two reportable segments: Clear Aligner segment and Systems and Services segment.
- Our Clear Aligner segment consists of Comprehensive Products, Non-Comprehensive Products and Non-Case revenues as defined below:
▪Comprehensive Products include, but are not limited to, Invisalign Comprehensive and Invisalign First.
▪Non-Comprehensive Products include, but are not limited to, Invisalign Moderate, Lite and Express packages and Invisalign Go and Invisalign Go Plus and Invisalign Palatal Expander.
▪We also offer in the U.S., Canada, and EMEA, a Doctor Subscription Program which is our monthly subscription-based clear aligner program. The program allows doctors the flexibility to order retainers and low-stage “touch-up” clear aligners within their subscribed tier and is designed for a segment of experienced Invisalign trained doctors who are currently not regularly using our retainers or low-stage aligners. The low-stage aligners, the Touch up product, are included as a Non-Comprehensive Product.
▪Non-Case products include, but are not limited to, retention products including retention aligners ordered through the Doctor Subscription Program, Invisalign training, adjusting tools used by dental professionals during the course of treatment and Invisalign Accessory Products that are complementary to our doctor-prescribed principal products such as aligner cases (clamshells), teeth whitening products, cleaning solutions (crystals, foam and other material) and other oral health products available in certain commerce channels in select markets.
▪Our Systems and Services segment consists of sales related to our iTero intraoral scanning systems, which includes a single hardware platform and restorative or orthodontic software options, upgrades and leases of scanner systems, sales of pre-owned scanner systems, subscription software, disposables, pay per scan services, as well as exocad’s CAD/CAM software solutions that integrate workflows to dental labs and dental practices.
Net revenues for our Clear Aligner and Systems and Services segments by region for the three months ended March 31, 2024 and 2023 are as follows (in millions):
| Three Months Ended March 31, | ||||||||||||||||||||||||||||||||||||||||||||||||||
| Net Revenues | 2024 | 2023 | Change | |||||||||||||||||||||||||||||||||||||||||||||||
| Clear Aligner net revenues: | ||||||||||||||||||||||||||||||||||||||||||||||||||
| Americas | $ | 372.3 | $ | 366.5 | $ | 5.8 | 1.6 | % | ||||||||||||||||||||||||||||||||||||||||||
| International | 370.6 | 354.2 | 16.4 | 4.6 | % | |||||||||||||||||||||||||||||||||||||||||||||
| Non-case | 74.3 | 69.1 | 5.2 | 7.5 | % | |||||||||||||||||||||||||||||||||||||||||||||
| Total Clear Aligner net revenues | $ | 817.3 | $ | 789.8 | $ | 27.4 | 3.5 | % | ||||||||||||||||||||||||||||||||||||||||||
| Systems and Services net revenues | 180.2 | 153.3 | 26.8 | 17.5 | % | |||||||||||||||||||||||||||||||||||||||||||||
| Total net revenues | $ | 997.4 | $ | 943.1 | $ | 54.3 | 5.8 | % |
During the third quarter of 2023, we began including Touch Up case revenues in Americas and/or International net revenues that were previously included in Non-Case revenues and recast the three months ended March 31, 2023. Changes and percentages are based on actual values. Certain tables may not sum or recalculate due to rounding.
Case volume data which represents Clear Aligner case shipments for the three months ended March 31, 2024 and 2023 is as follows (in thousands):
| Three Months Ended March 31, | ||||||||||||||||||||||||||||||||||||||||||||||||||
| 2024 | 2023 | Change | ||||||||||||||||||||||||||||||||||||||||||||||||
| Total case volume | 605.1 | 590.9 | 14.1 | 2.4 | % | |||||||||||||||||||||||||||||||||||||||||||||
During the third quarter of 2023, we began including Touch Up case revenues in Americas and/or International net revenues that were previously included in Non-Case revenues and recast the three months ended March 31, 2023. Changes and percentages are based on actual values. Certain tables may not sum or recalculate due to rounding.
For the three months ended March 31, 2024, total net revenues increased by $54.3 million as compared to the same period in 2023, primarily due to an increase in Clear Aligner volume and increases in System and Services net revenues from non-system sales, increased service revenue, and higher scanner volume.
Clear Aligner - Americas
For the three months ended March 31, 2024, Americas net revenues increased by $5.8 million as compared to the same period in 2023, primarily due to a 1.6% increase in ASP, resulting in an increase of net revenues of $5.9 million. Higher additional aligners increased net revenues by $27.2 million and price changes increased net revenues by $8.5 million. These increases were partially offset by a product mix shift to lower priced products which reduced net revenues by $22.3 million and higher promotional discounts which decreased net revenues by $9.8 million.
Clear Aligner - International
For the three months ended March 31, 2024, International net revenues increased by $16.4 million as compared to the same period in 2023, primarily due to a 5.3% increase in case volumes, resulting in increased net revenues by $18.7 million, partially offset by slightly lower ASP which decreased net revenues by $2.2 million. Lower ASP was largely due to higher promotional discounts which reduced net revenues by $19.9 million, a product mix shift to lower priced products reducing net revenues by $17.1 million, and unfavorable foreign exchange rates which decreased net revenues by $6.5 million. The decreases in ASP were partially offset by higher additional aligners and price changes which increased net revenues by $24.9 million and $13.9 million, respectively.
Clear Aligner - Non-Case
For the three months ended March 31, 2024, non-case net revenues increased by $5.2 million as compared to the same period in 2023 mainly due to increased volume of Vivera retainers which includes retention aligners ordered through our Doctor Subscription Program.
Systems and Services
For the three months ended March 31, 2024, Systems and Services net revenues increased by $26.8 million as compared to the same period in 2023 primarily due to an increase in sales of upgrade scanner systems which increased net revenues by $9.5 million, higher scanner volume which increased net revenues by $7.4 million and services revenue which increased net revenues by $8.7 million. Additionally, Systems and Services net revenues increased due to higher scanner ASP which increased net revenues by $2.0 million.
Cost of net revenues and gross profit (in millions):
| Three Months Ended March 31, | ||||||||||||||||||||||||||||||||||||||
| 2024 | 2023 | Change | ||||||||||||||||||||||||||||||||||||
| Clear Aligner | ||||||||||||||||||||||||||||||||||||||
| Cost of net revenues | $ | 238.1 | $ | 223.7 | $ | 14.4 | ||||||||||||||||||||||||||||||||
| % of net segment revenues | 29.1 | % | 28.3 | % | ||||||||||||||||||||||||||||||||||
| Gross profit | $ | 579.1 | $ | 566.1 | $ | 13.0 | ||||||||||||||||||||||||||||||||
| Gross margin % | 70.9 | % | 71.7 | % | ||||||||||||||||||||||||||||||||||
| Systems and Services | ||||||||||||||||||||||||||||||||||||||
| Cost of net revenues | $ | 61.5 | $ | 58.8 | $ | 2.7 | ||||||||||||||||||||||||||||||||
| % of net segment revenues | 34.1 | % | 38.4 | % | ||||||||||||||||||||||||||||||||||
| Gross profit | $ | 118.7 | $ | 94.5 | $ | 24.2 | ||||||||||||||||||||||||||||||||
| Gross margin % | 65.9 | % | 61.6 | % | ||||||||||||||||||||||||||||||||||
| Total cost of net revenues | $ | 299.6 | $ | 282.5 | $ | 17.1 | ||||||||||||||||||||||||||||||||
| % of net revenues | 30.0 | % | 30.0 | % | ||||||||||||||||||||||||||||||||||
| Gross profit | $ | 697.8 | $ | 660.7 | $ | 37.2 | ||||||||||||||||||||||||||||||||
| Gross margin % | 70.0 | % | 70.0 | % |
Changes and percentages are based on actual values. Certain tables may not sum or recalculate due to rounding.
Cost of net revenues includes personnel-related costs including payroll and stock-based compensation for staff involved in the production process, the cost of materials, packaging, freight and shipping related costs, depreciation on capital equipment and facilities used in the production process, amortization of acquired intangible assets and training costs.
Clear Aligner
For the three months ended March 31, 2024, our gross margin percentage decreased as compared to the same period in 2023 primarily due to increased manufacturing spend partially offset by higher net revenues.
Systems and Services
For the three months ended March 31, 2024, our gross margin percentage increased as compared to the same period in 2023 primarily due to higher net revenues and lower service and manufacturing costs.
Selling, general and administrative (in millions):
| Three Months Ended March 31, | ||||||||||||||||||||||||||||||||||||||
| 2024 | 2023 | Change | ||||||||||||||||||||||||||||||||||||
| Selling, general and administrative | $ | 451.8 | $ | 439.7 | $ | 12.1 | ||||||||||||||||||||||||||||||||
| % of net revenues | 45.3 | % | 46.6 | % |
Changes and percentages are based on actual values. Certain tables may not sum or recalculate due to rounding.
Selling, general and administrative expense generally includes personnel-related costs, including payroll, stock-based compensation and commissions for our sales force, marketing and advertising expenses including media, clinical education, marketing materials, trade shows and industry events, legal and outside service costs, equipment, software and maintenance costs, depreciation and amortization expense and allocations of corporate overhead expenses including facilities and Information Technology (“IT”).
For the three months ended March 31, 2024, selling, general and administrative expense increased compared to the same period in 2023 primarily due to higher employee costs, including higher salaries expense, fringe benefits and bonus payments.
Research and development (in millions):
| Three Months Ended March 31, | ||||||||||||||||||||||||||||||||||||||
| 2024 | 2023 | Change | ||||||||||||||||||||||||||||||||||||
| Research and development | $ | 91.9 | $ | 87.4 | $ | 4.4 | ||||||||||||||||||||||||||||||||
| % of net revenues | 9.2 | % | 9.3 | % |
Changes and percentages are based on actual values. Certain tables may not sum or recalculate due to rounding.
Research and development expense generally includes personnel-related costs, including payroll and stock-based compensation, outside service costs associated with the research and development of new products and enhancements to existing products, software, equipment, material and maintenance costs, depreciation and amortization expense and allocations of corporate overhead expenses including facilities and IT.
For the three months ended March 31, 2024, research and development expense increased compared to the same period in 2023 primarily due to higher employee costs, including salaries expense, fringe benefits and stock-based compensation as we continue to focus on our investments in innovation and research, partially offset by lower outside service provider spend.
Income from operations (in millions):
| Three Months Ended March 31, | ||||||||||||||||||||||||||||||||||||||
| 2024 | 2023 | Change | ||||||||||||||||||||||||||||||||||||
| Clear Aligner | ||||||||||||||||||||||||||||||||||||||
| Income from operations | $ | 286.2 | $ | 277.5 | $ | 8.7 | ||||||||||||||||||||||||||||||||
| Operating margin % | 35.0 | % | 35.1 | % | ||||||||||||||||||||||||||||||||||
| Systems and Services | ||||||||||||||||||||||||||||||||||||||
| Income from operations | $ | 49.7 | $ | 35.6 | $ | 14.1 | ||||||||||||||||||||||||||||||||
| Operating margin % | 27.6 | % | 23.2 | % | ||||||||||||||||||||||||||||||||||
| Total income from operations 1 | $ | 154.1 | $ | 133.5 | $ | 20.6 | ||||||||||||||||||||||||||||||||
| Operating margin % | 15.5 | % | 14.2 | % |
Changes and percentages are based on actual values. Certain tables may not sum or recalculate due to rounding.
1 Refer to Note 14 “Segments and Geographical Information” of the Notes to Condensed Consolidated Financial Statements for details on unallocated corporate expenses and the reconciliation to Condensed Consolidated Income from Operations.
Clear Aligner
For the three months ended March 31, 2024, our operating margin percentage remained relatively flat compared to the same period in 2023 primarily due to a decrease in gross margin which was offset by operating leverage.
Systems and Services
For the three months ended March 31, 2024, our operating margin percentage increased compared to the same period in 2023 primarily due to higher gross margin.
Interest income (in millions):
| Three Months Ended March 31, | ||||||||||||||||||||||||||||||||||||||
| 2024 | 2023 | Change | ||||||||||||||||||||||||||||||||||||
| Interest income | $ | 4.4 | $ | 2.3 | $ | 2.1 | ||||||||||||||||||||||||||||||||
| % of net revenues | 0.4 | % | 0.2 | % |
Changes and percentages are based on actual values. Certain tables may not sum or recalculate due to rounding.
Interest income generally includes interest earned on cash, cash equivalents and investment balances.
For the three months ended March 31, 2024, interest income increased compared to the same period in 2023 primarily due to higher interest rates partially offset by lower cash and cash equivalents.
Other income (expense), net (in millions):
| Three Months Ended March 31, | ||||||||||||||||||||||||||||||||||||||
| 2024 | 2023 | Change | ||||||||||||||||||||||||||||||||||||
| Other income (expense), net | $ | (0.1) | $ | (1.2) | $ | 1.1 | ||||||||||||||||||||||||||||||||
| % of net revenues | — | % | (0.1) | % |
Changes and percentages are based on actual values. Certain tables may not sum or recalculate due to rounding.
Other income (expense), net, generally includes foreign exchange gains and losses, gains and losses on foreign currency forward contracts, interest expense, gains and losses on equity investments and other miscellaneous charges.
For the three months ended March 31, 2024, other income (expense), net increased compared to the same period in 2023 primarily due to a gain recorded on our equity investments, partially offset by the unfavorable impact of foreign exchange rates.
Provision for income taxes (in millions):
| Three Months Ended March 31, | ||||||||||||||||||||||||||||||||||||||
| 2024 | 2023 | Change | ||||||||||||||||||||||||||||||||||||
| Provision for income taxes | $ | 53.4 | $ | 46.8 | $ | 6.5 | ||||||||||||||||||||||||||||||||
| Effective tax rates | 33.7 | % | 34.8 | % |
Changes and percentages are based on actual values. Certain tables may not sum or recalculate due to rounding.
Our effective tax rate differs from the statutory federal income tax rate of 21% for both the three month periods ended March 31, 2024 and 2023 primarily due to the recognition of additional tax expense resulting from U.S. taxes on foreign earnings, foreign income taxed at different rates, state income taxes, and non-deductible expense in the U.S.
The decrease in our effective tax rate for the three months ended March 31, 2024 compared to the same period in 2023 is primarily attributable to the change in our jurisdictional mix of income and a decrease in U.S. taxes on foreign earnings.
Liquidity and Capital Resources
Liquidity and Trends
As of March 31, 2024 and December 31, 2023, we had the following cash and cash equivalents and short-term and long-term marketable securities (in thousands):
| March 31, 2024 | December 31, 2023 | |||||||||||||
| Cash and cash equivalents | $ | 865,805 | $ | 937,438 | ||||||||||
| Marketable securities, short-term | 33,101 | 35,304 | ||||||||||||
| Marketable securities, long-term | 3,619 | 8,022 | ||||||||||||
| Total | $ | 902,525 | $ | 980,764 |
As of March 31, 2024 and December 31, 2023, approximately $685.0 million and $784.7 million, respectively, of cash, cash equivalents and marketable securities were held by our foreign subsidiaries. We continue to evaluate opportunities to repatriate our foreign earnings if or when needed. We do not expect to incur significant additional costs upon repatriation of these foreign earnings. We generate sufficient domestic operating cash flow and have access to external funding under our $300.0 million revolving line of credit. We believe that our current cash balances and the borrowing capacity under our credit facility, if necessary, will be sufficient to fund our business for at least the next 12 months.
Our material cash requirements are as follows:
-
Our purchase commitments consist primarily of open purchase orders for goods and services, including manufacturing inventory, supplies and services, sales and marketing, research and development services and technological services, issued in the normal course of business. There have been no material changes to our purchase commitments for goods and services during the three months ended March 31, 2024 as compared to the year ended December 31, 2023.
-
There have been no material changes to our future operating lease payments during the three months ended March 31, 2024 as compared to the year ended December 31, 2023.
-
For 2024, we expect our investments in capital expenditures to be approximately $100.0 million. Capital expenditures primarily relate to building construction and improvements as well as manufacturing capacity in support of our continued expansion. Despite the challenging market conditions, we intend to expand our investments in research and development, manufacturing, treatment planning, sales and marketing operations to meet actual and anticipated local and regional demands.
-
In January 2023, our Board of Directors authorized a plan to repurchase up to $1.0 billion of our common stock, $350.0 million of which had been utilized as of March 31, 2024. We continually evaluate opportunities to repurchase shares of our common stock depending on various factors including share price and liquidity. Refer to Note 10 “Common Stock Repurchase Program” of the Notes to Condensed Consolidated Financial Statements for details on our stock repurchase programs.
-
As of March 31, 2024, we had no material off-balance sheet arrangements that have or are reasonably likely to have, a current or future material impact on our liquidity or capital resources.
-
On April 22, 2024, we invested $75 million to purchase an additional equity interest in the equity of Heartland pursuant to the April 2024 Subscription Agreement.
Sources and Uses of Cash
The following table summarizes our condensed consolidated cash flows for the three months ended March 31, 2024 and 2023 (in thousands):
| Three Months Ended March 31, | ||||||||||||||
| 2024 | 2023 | |||||||||||||
| Net cash flow provided by (used in): | ||||||||||||||
| Operating activities | $ | 28,664 | $ | 199,895 | ||||||||||
| Investing activities | (79,584) | (52,829) | ||||||||||||
| Financing activities | (11,716) | (258,961) | ||||||||||||
| Effect of exchange rate changes on cash, cash equivalents, and restricted cash | (9,004) | 2,221 | ||||||||||||
| Net increase (decrease) in cash, cash equivalents, and restricted cash | $ | (71,640) | $ | (109,674) |
Operating Activities
For the three months ended March 31, 2024, cash flows from operations of $28.7 million resulted primarily from our net income of approximately $105.0 million as well as the following:
Significant adjustments to net income
-
Deferred taxes of $18.0 million related to increase in long term deferred tax position;
-
Depreciation and amortization of $32.9 million related to our investments in property, plant and equipment and intangible assets;
-
Stock-based compensation of $38.8 million related to equity awards granted to employees and directors;
-
Non-cash operating lease costs of $9.6 million related to operating lease cost; and
-
Other non-cash operating activities of $(2.4) million primarily related to a gain recorded on our equity investment.
Significant changes in working capital
-
Net outflow of $79.2 million in prepaid expenses and other assets primarily due to the payment of UK VAT assessments related to prior periods, refer to Note 8. Commitments and Contingencies;
-
Net outflow of $69.6 million in accounts receivable due to timing of collections, partially offset by increased revenues; and
-
Net outflow of $34.5 million in accrued and other long-term liabilities primarily due to payments on operating lease liabilities and higher incentive accruals for 2024, as well as timing of payment of other activities.
Investing Activities
Net cash used in investing activities was $79.6 million for the three months ended March 31, 2024 and primarily consisted of the Cubicure acquisition of $77.1 million and purchases of property, plant and equipment of $9.4 million.
Financing Activities
Net cash used in financing activities was $11.7 million for the three months ended March 31, 2024 and consisted of payroll taxes paid for equity awards through share withholdings of $26.1 million which were partially offset by $14.3 million of proceeds from the issuance of common stock under our employee stock purchase plan.
Critical Accounting Policies and Estimates
Management’s discussion and analysis of our financial condition and results of operations is based upon our Condensed Consolidated Financial Statements which have been prepared in accordance with accounting principles generally accepted in the United States of America. The preparation of financial statements requires management to make estimates and judgments that affect the reported amounts of assets and liabilities, revenues and expenses and disclosures at the date of the financial statements. We evaluate our estimates on an on-going basis, including those related to revenue recognition, goodwill and finite-lived acquired intangible assets, income taxes and legal proceedings and litigation. We use authoritative pronouncements, historical experience and other assumptions as the basis for making estimates. Actual results could differ from those estimates.
Revenue Recognition
Our revenues are derived primarily from the sale of aligners, scanners, and services from our Clear Aligner and Systems and Services segments. We enter into sales contracts that may consist of multiple distinct performance obligations where certain performance obligations of the sales contract are not delivered in one reporting period. We measure and allocate revenues according to ASC 606-10, “Revenues from Contracts with Customers.”
Determining the standalone selling price (“SSP”) in order to allocate consideration from the contract to the individual performance obligations is the result of various factors, such as historical prices, changing trends and market conditions, costs, and gross margins. While changes in the allocation of the SSP between performance obligations will not affect the amount of total revenues recognized for a particular contract, any material changes could impact the timing of revenue recognition, which would have a material effect on our financial position and result of operations. This is because the contract consideration is allocated to each performance obligation, delivered or undelivered, at the inception of the contract based on the SSP of each distinct performance obligation.
We allocate consideration for each clear aligner treatment plan based on each unit’s SSP. Management considers a variety of factors such as same or similar product historical sales, costs, and gross margin, which may vary over time depending upon the unique facts and circumstances related to each performance obligation in making these estimates. In addition to historical data, we take into consideration changing trends and market conditions. For treatment plans with multiple options, we also consider usage rates, which is the number of times a customer is expected to order more aligners after the initial shipment. Our process for estimating usage rates requires significant judgment and evaluation of inputs, including historical usage data by region, country and channel.
We estimate the SSP of each element in a scanner system and services sale taking into consideration same or similar product historical prices as well as our discounting strategies. For CAD/CAM services, we estimate the SSP of each element, including the initial software license and maintenance and support, using data such as historical prices.
Recent Accounting Pronouncements
See Note 1 “Summary of Significant Accounting Policies” of the Notes to Condensed Consolidated Financial Statements for a discussion of recent accounting pronouncements.
Item 3. Quantitative and Qualitative Disclosures About Market Risk.
In the normal course of business, we are exposed to interest rate, foreign currency exchange and inflation risks that could impact our financial position and results of operations. In addition, we are subject to the broad market risk that is created by the global market disruptions and uncertainties resulting from macroeconomic challenges, various military conflicts and consumer confidence. Further discussion on these risks may be found in Item 1A of this Quarterly Report on Form 10-Q under the heading “Risk Factors.”
Interest Rate Risk
Changes in interest rates could impact our anticipated interest income on our cash equivalents and investments in marketable securities. Our investments are fixed-rate short-term and long-term securities. Fair market value of fixed-rate securities may be adversely impacted due to a rise in interest rates. As a result, our future investment income may fall short of expectations due to changes in interest rates or we may suffer losses in principal if forced to sell securities which have declined in market value due to changes in interest rates. As of March 31, 2024, we had approximately $36.7 million invested in available-for-sale marketable securities. An immediate 10% change in interest rates would not have a material adverse impact on our future operating results and cash flows.
We do not enter into investments for trading or speculative purposes and have not used any derivative financial instruments to manage our interest rate risk exposure. As of March 31, 2024, we are not subject to risks from immediate interest rate increases on our unsecured revolving line of credit facility.
Currency Rate Risk
As a result of our international business activities, our financial results have been affected by factors such as changes in foreign currency exchange rates as well as economic conditions in foreign markets, and there is no assurance that exchange rate fluctuations will not harm our business in the future. We generally sell our products in the local currency of the respective countries. This provides some natural hedging because most of the subsidiaries’ operating expenses are generally denominated in their local currencies.
We enter into foreign currency forward contracts for currencies where we have exposures, primarily the Euro, British Pound, Chinese Yuan, Polish Zloty and Canadian Dollar, to minimize the short-term impact of foreign currency exchange rate fluctuations on certain assets and liabilities. These forward contracts are not designated as hedging instruments and are generally one month in original maturity and are marked to market through earnings every period. The gains and losses on these forward contracts are intended to offset the gains and losses in the underlying foreign currency denominated monetary assets and liabilities being economically hedged. We do not enter into foreign currency forward contracts for trading or speculative purposes. As our international operations grow, we will continue to reassess our approach to managing the risks relating to fluctuations in currency rates. It is difficult to predict the impact forward contracts could have on our results of operations.
Although we will continue to monitor our exposure to currency fluctuations, and, where appropriate, may use forward contracts to minimize the effect of these fluctuations, the impact of an aggregate change of 10% in foreign currency exchange rates relative to the U.S. dollar on our results of operations and financial position could be material.
Inflation Risk
The economy has been impacted by certain macroeconomic challenges which have contributed to a rising inflationary trend that have impacted both our revenues and costs globally, and which we expect will continue into the foreseeable future. If our costs become subject to significant inflationary pressures, we may not be able to fully offset such higher costs through price increases. There can be no assurance that our results of operations and financial condition will not be materially impacted by inflation in the future.
Item 4. Controls and Procedures.
Evaluation of disclosure controls and procedures.
Under the supervision and with the participation of our management, including our Chief Executive Officer and our Chief Financial Officer, we have evaluated the effectiveness of the design and operation of our disclosure controls and procedures (as defined in Rules 13a-15(e) and 15d-15(e) under the Exchange Act) as of the end of the period covered by this Quarterly Report on Form 10-Q. Based upon that evaluation, our Chief Executive Officer and our Chief Financial Officer have concluded that our disclosure controls and procedures are effective as of March 31, 2024, to provide reasonable assurance that information required to be disclosed by us in the reports that we file or submit under the Exchange Act is accumulated and communicated to our management, including our Chief Executive Officer and our Chief Financial Officer, as appropriate, to allow timely decisions regarding required disclosure, and that such information is recorded, processed, summarized and reported within the time periods specified in the SEC rules and forms.
Changes in internal control over financial reporting.
There were no changes in our internal control over financial reporting during the quarter ended March 31, 2024 that have materially affected, or are reasonably likely to materially affect, our internal control over financial reporting.
PART II—OTHER INFORMATION
Item 1. Legal Proceedings.
For a discussion of legal proceedings, refer to Note 7 “Legal Proceedings” of the Notes to Condensed Consolidated Financial Statements in Part I, Item 1 of this Form 10-Q*.*
Item 1A. Risk Factors.
The following discusses some of the risks that may affect our business, results of operations, financial condition and the price of our stock. You should carefully review this section, as well as our condensed consolidated financial statements and notes thereto and other information appearing in this Quarterly Report on Form 10-Q, for important information regarding these and other risks that may affect us. The order we have chosen to list the risks below or the sections in which we have identified them should not be interpreted to mean we deem any risks to be more or less important or likely to occur or, if any do occur, that their impact may be any less significant than any others. These risk factors should be considered in connection with the forward-looking statements contained in this report because they could cause our actual results and conditions to differ materially from those statements. Before you invest in Align, you should know that investing involves risks, including those described below. The risks below are not the only risks we face. If any of the risks actually occur, our business, financial condition and results of operations could be negatively affected, the trading price of our common stock could decline, and you may lose all or part of your investment.
Macroeconomic and External Risks
Our operations and financial performance depend on global and regional economic conditions. Inflation, fluctuations in currency exchange rates, changes in consumer confidence and demand, and general economic weakness and threats, or actual recessions, have and could in the future materially affect our business, results of operations, and financial condition.
Macroeconomic conditions impact consumer confidence and discretionary spending, which can adversely affect demand for our products. Consumer spending habits are affected by, among other things, inflation, fluctuations in currency exchange rates, general economic weakness, threats or actual recessions, pandemics, wars and military actions, employment levels, wages, debt obligations, discretionary income, interest rates, volatility in capital, and consumer confidence and perceptions of current and future economic conditions. Macroeconomic conditions can, among other things, reduce or shift spending away from elective procedures, drive patients to pursue less costly orthodontic treatments, decrease the number of orthodontic case starts, reduce patient traffic in dentists’ offices or reduce demand for dental services generally. Further, decreased demand for dental services can cause dentists and labs to postpone investments in capital equipment, such as intraoral scanners and CAD/CAM equipment and software. The declines in, or uncertain economic outlooks for, the U.S., Chinese, European and certain other international economies have and may continue to adversely affect consumer and dental practice spending. Increases in the cost of fuel and energy, food and other essential items as well as higher interest rates have and may continue to reduce consumers' disposable income, which could cause a decrease in discretionary spending for products like ours. Further, we cannot predict the impact of efforts by central banks and federal, state and local governments to combat inflation, which could result in an economic recession or have an adverse impact on consumer spending for a prolonged period of time.
Inflation continues to adversely impact spending and trade activities, causing unpredictable impacts on global and regional economies. Higher inflation has also increased domestic and international shipping costs, raw material prices, and labor rates, which has adversely impacted the costs of producing, procuring and shipping our products. Our ability to recover these cost increases through price increases may continue to lag, resulting in downward pressure on our operating results. Attempts to offset cost increases with price increases may reduce sales, increase customer dissatisfaction or otherwise harm our reputation. Any of these events could materially affect our business and operating results.
We have significant international operations and sales and we are exposed to fluctuations in foreign currencies that have and may continue to adversely impacted our business or results of operations. Although the U.S. dollar is our reporting currency, a large portion of our expenses, net revenues and net income are generated in foreign currencies. While we utilize forward contracts to moderate the impact of exchange rate fluctuations on certain assets and liabilities, our hedging strategies may not be successful, and currency exchange rate fluctuations have and may continue to materially adversely effect our operating results and cash flows. In addition, our foreign currency exposure on assets, liabilities and cash flows that we do not hedge have and could in the future materially impact our financial results in periods when the U.S. dollar significantly fluctuates in relation to foreign currencies.
Our business could be impacted by geopolitical events, trade and other international disputes, war, and terrorism, or major public health crises**.**
Political events, trade and other international disputes, war and terrorism, or major public health crises have and could in the future harm or disrupt international commerce and the global economy and could materially affect our business as well as our customers, suppliers, contract manufacturers, distributors, and other business partners. Such risks include supply chain and trade disruptions, tariffs, trade sanctions or restrictions, boycotts, reduced consumer spending, government shut downs, cyberattacks, energy shortages or power outages, energy rationing that adversely impacts our manufacturing facilities, rising fuel or rising costs of producing, procuring and shipping our products, constraints, volatility or disruption in the financial markets, deaths or injuries to our employees, restrictions and shortages of food, water, shelter, and medical supplies, telecommunications failures and protests that may result in the blocking of pathways relied on to deliver our product to customers or destruction of property.
Tariffs, such as those on Chinese goods, and responses to the tariffs may increase the cost of our products and the components and raw materials used to make them. Increased costs could adversely impact our gross margin and reduce demand for our products. Countries may also adopt other measures, such as controls on the import or export of goods, technology or data, including personal data, that could adversely impact our operations and supply chains or limit our ability to offer products and services. These measures could require us to take various actions, including changing suppliers or restructuring business relationships. Complying with new or changed trade restrictions is expensive, time-consuming and disruptive to our operations. Such restrictions can be announced with little or no advance notice and we may be unable to effectively mitigate any adverse impacts.
Political events, trade and other international disputes, war, terrorism, or major public health crises involving key commercial, development or manufacturing markets such as China, Mexico, Israel, Poland, or other countries or regions have and could again materially impact our international operations. The impact to us, our employees and customers would be uncertain, particularly if emergency circumstances, armed conflicts or an escalation in political instability or violence, or viral out-breaks disrupt our product development, data or information exchange, payroll or banking operations, product or materials shipping by us or our suppliers. Our international operations would also be impacted by other unanticipated business disruptions, interruptions and limitations in telecommunication services or critical systems or applications reliant on a stable and uninterrupted c
Showing the first 8K of 90K characters. Open the full section
Item 5. Other Information.
During the fiscal quarter ended March 31, 2024, no director or officer, as defined in Rule 16a-1(f) of the Exchange Act, adopted or terminated a “Rule 10b5-1 trading arrangement” or a “non-Rule 10b5-1 trading arrangement,” each as defined in Regulation S-K Item 408.
Item 6. Exhibits.
(a) Exhibits:
| Exhibit Number | Description | Filing | Date | Exhibit Number | Filed herewith | |||||||||||||||||||||||||||
| 3.1 | Amended Certificate of Incorporation of Align Technology, Inc. | S-1, as amended (File No. 333-49932) | 12/28/2000 | 3.1 | ||||||||||||||||||||||||||||
| 3.1A | Certificate of Amendment to the Amended Certificate of Incorporation | 8-K | 5/20/2016 | 3.01 | ||||||||||||||||||||||||||||
| 3.1B | Certificate of Amendment to the Amended Certificate of Incorporation | 10-Q | 8/04/2023 | 3.1B | ||||||||||||||||||||||||||||
| 3.2 | Amended and Restated Bylaws of registrant | 8-K | 1/17/2024 | 3.1 | ||||||||||||||||||||||||||||
| 31.1 | Certification of Chief Executive Officer pursuant to 18 U.S.C. Section 1350, as adopted pursuant to Section 302 of the Sarbanes-Oxley Act of 2002. | * | ||||||||||||||||||||||||||||||
| 31.2 | Certification of Chief Financial Officer pursuant to 18 U.S.C. Section 1350, as adopted pursuant to Section 302 of the Sarbanes-Oxley Act of 2002. | * | ||||||||||||||||||||||||||||||
| 32.1† | Certification pursuant to 18 U.S.C. Section 1350, as adopted pursuant to Section 906 of the Sarbanes-Oxley Act of 2002. | * | ||||||||||||||||||||||||||||||
| 101.INS | Inline XBRL Instance Document (the instance document does not appear in the Interactive Data File because its XBRL tags are embedded within the Inline XBRL document). | * | ||||||||||||||||||||||||||||||
| 101.SCH | Inline XBRL Taxonomy Extension Schema Document | * | ||||||||||||||||||||||||||||||
| 101.CAL | Inline XBRL Taxonomy Extension Calculation Linkbase Document | * | ||||||||||||||||||||||||||||||
| 101.DEF | Inline XBRL Taxonomy Extension Definition Linkbase Document | * | ||||||||||||||||||||||||||||||
| 101.LAB | Inline XBRL Taxonomy Extension Label Linkbase Document | * | ||||||||||||||||||||||||||||||
| 101.PRE | Inline XBRL Taxonomy Extension Presentation Linkbase Document | * | ||||||||||||||||||||||||||||||
| 104 | Cover Page Interactive Data File (formatted as inline XBRL and contained in Exhibit 101) | * |
† The certifications attached as Exhibit 32.1 that accompany this Quarterly Report on Form 10-Q are not deemed filed with the SEC and are not to be incorporated by reference into any filing of the Registrant under the Securities Act or the Exchange Act, whether made before or after the date of this Quarterly Report on Form 10-Q, irrespective of any general incorporation language contained in such filing.
SIGNATURES
Pursuant to the requirements of the Securities Exchange Act of 1934, the registrant has duly caused this report to be signed on its behalf by the undersigned thereunto duly authorized.
| ALIGN TECHNOLOGY, INC. | ||||||||
| May 3, 2024 | By: | /s/ JOSEPH M. HOGAN | ||||||
| Joseph M. Hogan President and Chief Executive Officer | ||||||||
| May 3, 2024 | By: | /s/ JOHN F. MORICI | ||||||
| John F. Morici Chief Financial Officer and Executive Vice President, Global Finance |