 filings.tools
Allstate 10-K 2017-12-31
Filed 2018-02-26. 22 sections, 1163K characters. Original on sec.gov · Markdown · JSON
Cover and table of contents
10-K 1 allcorp-12311710xk.htm 10-K
UNITED STATES
SECURITIES AND EXCHANGE COMMISSION
Washington, D.C. 20549
FORM 10-K
| ý | ANNUAL REPORT PURSUANT TO SECTION 13 OR 15(d) OF THE SECURITIES EXCHANGE ACT OF 1934 |
For the fiscal year ended December 31, 2017
OR
| o | TRANSITION REPORT PURSUANT TO SECTION 13 OR 15(d) OF THE SECURITIES EXCHANGE ACT OF 1934 |
For the transition period from to
Commission file number 1-11840

THE ALLSTATE CORPORATION
(Exact name of registrant as specified in its charter)
| Delaware | 36-3871531 | |
| (State or Other Jurisdiction of Incorporation or Organization) | (I.R.S. Employer Identification No.) |
2775 Sanders Road, Northbrook, Illinois 60062
(Address of principal executive offices) (Zip Code)
Registrant’s telephone number, including area code: (847) 402-5000
Securities registered pursuant to Section 12(b) of the Act:
| Title of each class | Name of each exchange on which registered |
| Common Stock, par value $0.01 per share | New York Stock Exchange Chicago Stock Exchange |
| 5.10% Fixed-to-Floating Rate Subordinated Debentures due 2053 | New York Stock Exchange |
| Depositary Shares each representing a 1/1,000th interest in a share of Fixed Rate Noncumulative Perpetual Preferred Stock, Series A | New York Stock Exchange |
| Depositary Shares each representing a 1/1,000th interest in a share of Fixed Rate Noncumulative Perpetual Preferred Stock, Series C | New York Stock Exchange |
| Depositary Shares each representing a 1/1,000th interest in a share of Fixed Rate Noncumulative Perpetual Preferred Stock, Series D | New York Stock Exchange |
| Depositary Shares each representing a 1/1,000th interest in a share of Fixed Rate Noncumulative Perpetual Preferred Stock, Series E | New York Stock Exchange |
| Depositary Shares each representing a 1/1,000th interest in a share of Fixed Rate Noncumulative Perpetual Preferred Stock, Series F | New York Stock Exchange |
Securities registered pursuant to Section 12(g) of the Act: None
Indicate by check mark if the registrant is a well-known seasoned issuer, as defined in Rule 405 of the Securities Act. Yes X No
Indicate by check mark if the registrant is not required to file reports pursuant to Section 13 or Section 15(d) of the Act. Yes No X
Indicate by check mark whether the registrant (1) has filed all reports required to be filed by Section 13 or 15(d) of the Securities Exchange Act of 1934 during the preceding 12 months (or for such shorter period that the registrant was required to file such reports), and (2) has been subject to such filing requirements for the past 90 days. Yes X No
Indicate by check mark whether the registrant has submitted electronically and posted on its corporate Web site, if any, every Interactive Data File required to be submitted and posted pursuant to Rule 405 of Regulation S-T (§ 232.405 of this chapter) during the preceding 12 months (or for such shorter period that the registrant was required to submit and post such files). Yes X No
Indicate by check mark if disclosure of delinquent filers pursuant to Item 405 of Regulation S-K (§ 229.405 of this chapter) is not contained herein, and will not be contained, to the best of registrant’s knowledge in definitive proxy or information statements incorporated by reference in Part III of this Form 10-K or any amendment to this Form 10-K. X
Indicate by check mark whether the registrant is a large accelerated filer, an accelerated filer, a non-accelerated filer, or a smaller reporting company. See the definitions of “large accelerated filer,” “accelerated filer” and “smaller reporting company” in Rule 12b-2 of the Exchange Act.
| Large accelerated filer X | Accelerated filer | |
| Non-accelerated filer (Do not check if a smaller reporting company) | Smaller reporting company |
Indicate by check mark whether the registrant is a shell company (as defined in Rule 12b-2 of the Exchange Act). Yes No X
The aggregate market value of the common stock held by non-affiliates of the registrant, computed by reference to the closing price as of the last business day of the registrant’s most recently completed second fiscal quarter, June 30, 2017, was approximately $31.50 billion.
As of January 31, 2018, the registrant had 354,458,095 shares of common stock outstanding.
Documents Incorporated By Reference
Portions of the following documents are incorporated herein by reference as follows:
Part III of this Form 10-K incorporates by reference certain information from the registrant’s definitive proxy statement for its annual stockholders meeting to be held on May 11, 2018, (the “Proxy Statement”) to be filed not later than 120 days after the end of the fiscal year covered by this Form 10-K.
Table of Contents
Showing the first 8K of 66K characters. Open the full section
Item 1. Business 2017 Form 10-K
Guaranty Funds. Under state insurance guaranty fund laws, insurers doing business in a state can be assessed, up to prescribed limits, in order to cover certain obligations of insolvent insurance companies. We do not anticipate any material adverse financial impact on Allstate from these assessments.
National Flood Insurance Program. We voluntarily participate as a Write Your Own carrier in the National Flood Insurance Program (“NFIP”). The NFIP is administered and regulated by the Federal Emergency Management Agency (“FEMA”). We write the policy for the NFIP, which assumes 100% of the flood risk, while we retain expense allowances for our service. We operate in a fiduciary capacity as a fiscal agent of the federal government in the issuing and administering of the Standard Flood Insurance Policy. This involves the collection of premiums belonging to the federal government, the adjustment of claims, and the paying of covered claims and certain allocated loss adjustment expenses entirely drawn from federal funds. We receive expense allowances from the NFIP for underwriting administration, claims management, commissions, and adjusting expenses. The federal government is obligated to pay all claims and certain allocated loss adjustment expenses in accordance with the arrangement. In 2015, FEMA intervened and took direct responsibility for settling claims in litigation related to named storm Sandy, which occurred in 2012. FEMA also implemented a review process for non-litigated claims and offered to review claims that had previously been closed. These claims have been paid by directly drawing on federal funds to settle litigation and to pay additional amounts on claims reviewed by FEMA and submitted for processing. Due to this review process, approximately 2,300 Allstate claims were reopened by FEMA. As of December 31, 2017, Allstate had received 2,138 directives from FEMA regarding payments. Allstate has not had any involvement in determining the additional payment amounts or settling these claims. Allstate did not accept any additional loss adjustment fees for the additional payments directed by FEMA. In response to concerns from members of Congress, the Office of Inspector General (“OIG”) audited FEMA’s Sandy claims review process and on January 24, 2018, issued an audit report titled “Unsupported Payments Made to Policyholders Who Participated in the Hurricane Sandy Claims Review Process”. The report contains seven recommendations to FEMA, which emphasize the importance of FEMA communicating clear guidance to adjusters, and identifying and implementing better methods to inform policyholders of flood coverage limitations. We cannot predict the impact this report or recommendations will have on FEMA or the operations of the NFIP. Congressional authorization for the NFIP is set to expire March 23, 2018. FEMA purchased $1.46 billion of reinsurance to cover any qualifying flood losses in 2018 for the NFIP. Congress is considering reforms to the program that would be incorporated in legislation to reauthorize the NFIP as well as evaluating the funding of the program.
Investment Regulation. Our insurance subsidiaries are subject to regulations that require investment portfolio diversification and that limit the
amount of investment in certain categories. Failure to comply with these rules leads to the treatment of non-conforming investments as non-admitted assets for purposes of measuring statutory surplus. Further, in some instances, these rules require divestiture of non-conforming investments.
Exiting Geographic Markets; Canceling and Non-Renewing Policies. Most states regulate an insurer’s ability to exit a market. For example, states may limit, to varying degrees, an insurer’s ability to cancel and non-renew policies. Some states restrict or prohibit an insurer from withdrawing one or more types of insurance business from the state, except pursuant to a plan that is approved by the state insurance department. Regulations that limit cancellation and non-renewal and that subject withdrawal plans to prior approval requirements may restrict an insurer’s ability to exit unprofitable markets.
Variable Life Insurance and Registered Fixed Annuities. The sale and administration of variable life insurance and registered fixed annuities with market value adjustment features are subject to extensive regulatory oversight at the federal and state level, including regulation and supervision by the Securities and Exchange Commission (“SEC”) and the Financial Industry Regulatory Authority (“FINRA”).
Broker-Dealers, Investment Advisors and Investment Companies. The Allstate entities that operate as broker-dealers, registered investment advisors, and investment companies are subject to regulation and supervision by the SEC, FINRA and/or, in some cases, state securities administrators. In 2016, the U.S. Department of Labor (“DOL”) issued its final fiduciary rule (the “Rule”). The Rule expands the range of activities considered “investment advice” and establishes a new framework for determining whether a person is a fiduciary when selling mutual funds, variable and indexed annuities, or variable life products in connection with an individual retirement account (“IRA”) or employee benefit plan covered under the Employee Retirement Income Security Act of 1974, as amended (“ERISA”). The Rule impacts non-proprietary products provided by Allstate agencies and Allstate’s broker-dealer, Allstate Financial Services, LLC, their sales processes and volumes, and producer compensation arrangements. Allstate does not currently sell proprietary annuities or proprietary variable life products in connection with IRAs or employee benefit plans covered under ERISA. Allstate Benefits offers universal life products which, when sold in an employee welfare benefit plan, may be considered subject to the fiduciary rule as an insurance product with an “investment component.” Products we previously offered and continue to have in force, such as indexed annuities, are impacted by the Rule. These requirements may increase regulatory costs and litigation exposure. The financial impact to Allstate is expected to be immaterial. Certain provisions of the Rule, such as the impartial conduct standards, became effective on June 9, 2017, while other provisions were not to apply until January 1, 2018. In November 2017, the DOL approved an 18-month delay to the provisions of the Rule that were to apply on January 1, 2018. The
The Allstate Corporation  13
13
2017 Form 10-K Item 1. Business
delay will allow the DOL to determine whether the Rule may adversely affect investors or retirees or adversely affect the ability of Americans to gain access to retirement information and financial advice. The delay also allows the DOL to coordinate with other regulators, such as state insurance regulators and the SEC, and Congress. It is yet to be determined whether any changes to the Rule’s requirements will result from the DOL’s continued examination of the Rule.
Dodd-Frank: Covered Agreement. The Secretary of the Treasury (operating through FIO) and the Office of the U.S. Trade Representative (“USTR”) are jointly authorized, pursuant to the Dodd-Frank, to negotiate Covered Agreements. A Covered Agreement is a bilateral or multilateral agreement that “relates to the recognition of prudential measures with respect to the business of insurance or reinsurance that achieves a level of protection for insurance or reinsurance consumers that is substantially equivalent to the level of protection achieved under State insurance or reinsurance regulation.”
On September 22, 2017, the U.S. and European Union (“EU”) signed a Covered Agreement. In addition to signing the Covered Agreement, Treasury and the USTR jointly issued a policy statement clarifying how the U.S. views implementation of certain provisions of th
Showing the first 8K of 75K characters. Open the full section
Item 1A. Risk Factors and Other Disclosures 2017 Form 10-K
efforts to raise rates even if the property and casualty industry generally is not experiencing regulatory challenges to rate increases. Such challenges affect our ability to obtain approval for rate changes that may be required to achieve targeted levels of profitability and returns on equity. Moreover, our ability to purchase reinsurance required to reduce catastrophe risk in designated areas may be dependent upon the ability to adjust rates for its cost. If we are unsuccessful, our results of operations could be negatively impacted.
In addition, certain states have enacted laws that require an insurer conducting business in that state to participate in assigned risk plans, reinsurance facilities and joint underwriting associations. Certain states also require the insurer to offer coverage to all consumers, often restricting an insurer’s ability to charge the price it might otherwise charge. In these markets, we may be compelled to underwrite significant amounts of business at lower-than-desired rates, possibly leading to an unacceptable return on equity. Alternatively, as the facilities recognize a financial deficit, they could have the ability to assess participating insurers, adversely affecting our results of operations and financial condition. Laws and regulations of many states also limit an insurer’s ability to withdraw from one or more lines of insurance there, except pursuant to a plan that is approved by the state insurance department. Additionally, certain states require an insurer to participate in guaranty funds for impaired or insolvent insurance companies. These funds periodically assess losses against all insurance companies doing business in the state. Our results of operations and financial condition could be adversely affected by any of these factors.
Regulatory reforms, and the more stringent application of existing regulations, may make it more expensive for us to conduct our business
The federal government has enacted comprehensive regulatory reforms for financial services entities. As part of a larger effort to strengthen the regulation of the financial services market, certain reforms are applicable to the insurance industry.
In recent years, the state insurance regulatory framework has come under public scrutiny. Members of Congress have discussed proposals to provide for federal chartering of insurance companies. The Federal Insurance Office (“FIO”) and Financial Stability Oversight Council (“FSOC”) were also established. If the FSOC were to determine that Allstate is a “systemically important” nonbank financial company, Allstate would be subject to regulation by the Federal Reserve Board. We can make no assurances regarding the potential impact of state or federal measures that change the nature or scope of insurance and financial regulation.
In 2016, the U.S. Department of Labor (“DOL”) issued a rule that expands the range of activities that would be considered to be “investment advice” and establishes a new framework for determining whether a person is a fiduciary when selling mutual funds, variable and indexed annuities, or variable life products
in connection with an IRA or employee benefit plan covered under ERISA. See the Regulation section, Broker-Dealers, Investment Advisors and Investment Companies, for additional information.
Such regulatory reforms, additional legislative or regulatory requirements and any further stringent enforcement of existing regulations may make it more expensive for us to conduct business and limit our ability to grow or to achieve profitability.
Changes in tax laws may affect our operations, decrease sales and profitability of products and adversely affect our financial condition
The Tax Legislation contains numerous changes, including a permanent reduction of the corporate income tax rate from 35% to 21% beginning January 1, 2018, and a change to the international system of taxation to a modified territorial system. While we believe the overall effect of the Tax Legislation may have a positive impact on us and our customers, it also includes changes to the income tax basis for the amortization periods for deferred acquisition costs, the computation of insurance tax reserves, deductibility of certain corporate expenses and rules relating to the dividends received deduction that, when taken separately, will not be beneficial to us.
Under current federal and state income tax law, certain products, primarily life insurance, receive beneficial tax treatment. This favorable treatment may give some products a competitive advantage over noninsurance products. Congress and various state legislatures occasionally consider legislation that could reduce or eliminate the beneficial policyholder tax treatment currently applicable to life insurance. Congress and state legislatures also consider proposals to reduce the taxation of certain products or investments that may compete with life insurance. Legislation that increases the taxation on insurance products or reduces the taxation on competing products could lessen the advantage or create a disadvantage for some products by making them less competitive. Such proposals, if adopted, could impact the demand for certain of our life insurance products that offer income tax deferrals and may have a material effect on our profitability and financial condition and could result in the surrender of some existing contracts and policies. In addition, changes in the federal estate tax laws could negatively affect the demand for the types of life insurance used in estate planning.
We may not be able to mitigate the capital impact associated with statutory reserving and capital requirements, potentially resulting in a need to increase prices, reduce sales of certain products, and/or accept a return on equity below original levels assumed in pricing
Regulatory capital and reserving requirements affect the amount of capital required to be maintained by our life insurance companies. Changes to capital or reserving requirements or regulatory interpretations may result in additional capital held in our life insurance companies. To support statutory reserves for certain life insurance products, we currently utilize reinsurance and captive reserve financing solutions for
The Allstate Corporation 25
2017 Form 10-K Part I - Item 1A. Risk Factors and Other Disclosures
financing a portion of our statutory reserve requirements deemed to be non-economic. Changes to capital or reserving requirements or an inability to continue existing financing as a result of market conditions or otherwise could require us to increase prices, reduce our sales of certain products, and/or accept a return on equity below original levels assumed in pricing.
Changes in accounting standards issued by the Financial Accounting Standards Board or other standard-setting bodies may adversely affect our results of operations and financial condition
Our financial statements are subject to the application of generally accepted accounting principles, which are periodically revised, interpreted and/or expanded. Our life insurance business involves products that remain in force for extended time periods. Accordingly, we may be required to adopt new guidance or interpretations, including those that relate to products which remain in force for extended time periods and were designed and issued in contemplation of a different accounting framework, which may have a material effect on our results of operations and financial condition that is either unexpected or has a greater impact than expected. For a description of changes in accounting standards that are currently pending and, if known, our estimates of their expected impact, see Note 2 of the consolidated financial statements.
Our policyholders and shareholders make decisions in part based on an evaluation of our reported financial condition, results of operations as well as the stability and predictability of those conditions and results. Potential accounting changes that retroactively affect long-duration insurance contracts and require more market-based measurements may introduce substantial variability and may unfavorably impact our reported financial condition and results of operations as well as their stability and predictability. The potential impacts of a retroactive accounting change applied to long-duration insurance contracts could be pervasive and may unfavorably impact policyholder and shareholder assessments of our financial condition and results of operations.
Losses from legal and regulatory actions may be material to our results of operations, cash flows and financial condition
We are involved in various legal actions, including class action litigation challenging a range of company practices and coverage provided by our insurance products, some of which involve claims for substantial or indeterminate amounts. We are also involved in various regulatory actions and inquiries, including market conduct exams by state insurance regulatory agencies. In the event of an unfavorable outcome in any of these matters, the ultimate liability may be in excess of amounts currently accrued, if any, and may be material to our results of operations, cash flows and financial condition. The aggregate estimate of the range of reasonably possible loss in excess of the amount accrued, if any, disclosed in Note 14 of the
consolidated financial statements is not an indication of expected loss, if any.
We are subject to extensive regulation and potential further restrictive regulation may increase our operating costs and limit our growth
As insurance companies, broker-dealers, investment advisers, investment companies and other types of companies, many of our subsidiaries are subject to extensive laws and regulations that are complex and subject to change. Changes may sometimes lead to additional expenses, increased legal exposure, increased required reserves or capital, and additional limits on our ability to grow or to achieve targeted profitability. Moreover, laws and regulations are administered and enforced by a number of different governmental authorities, each of which exercises a degree of interpretive latitude, including state insurance regulators; state securities administrators; state attorneys general as well as federal agencies including the SEC, the Financial Industry Regulatory Authority, the DOL, the U.S. Department of Justice and the National Labor Relations Board. Consequently, we are subject to the risk that compliance with any particular regulator’s or enforcement authority’s interpretation of a legal issue may not result in compliance with another’s interpretation of the same issue, particularly when compliance is judged in hindsight.
In addition, there is risk that any particular regulator’s or enforcement authority’s interpretation of a legal issue may change over time to our detriment. There is also a risk that changes in the overall legal environment may cause us to change our views regarding the actions we need to take from a legal risk management perspective. This would necessitate changes to our practices that may adversely impact our business. Furthermore, in some cases, these laws and regulations are designed to protect or benefit the interests of a specific constituency rather than a range of constituencies. For example, state insurance laws and regulations are generally intended to protect or benefit purchasers or users of insurance products, not holders of securities that we issue. These laws and regulations may limit our ability to grow or to improve the profitability of our business.
Our participation in certain state industry pools and facilities subjects us to the risk that reimbursement for qualifying claims and claims expenses may not be received, which could have a material effect on our results of operations and financial condition
We have exposure associated with the Michigan Catastrophic Claim Association (“MCCA”), a state-mandated indemnification mechanism for personal injury protection losses that exceed a retention level which is adjusted upward every other MCCA fiscal year based on a formula. We also have exposure associated with the New Jersey Property-Liability Insurance Guaranty Association (“PLIGA”) which provides reimbursement to insurers for certain qualifying medical benefits portion of personal injury protection coverage paid in excess of certain levels. We also have exposure associated with the North Carolina
Part I - Item 1A. Risk Factors and Other Disclosures 2017 Form 10-K
Reinsurance Facility (“NCRF”), which provides automobile liability insurance to drivers that insurers are not otherwise willing to insure. The MCCA and NCRF are currently operating with a statutory surplus deficit. Our reinsurance recoverable on paid and unpaid claims from the MCCA, PLIGA and NCRF was $5.26 billion, $493 million and $86 million, respectively, as of December 31, 2017.
The MCCA is funded by annually assessing participating member companies actively writing motor vehicle coverage in Michigan on a per vehicle basis. The MCCA’s calculation of the annual assessment is based upon the total of members’ actuarially determined present value of expected payments on lifetime claims by all persons expected to be catastrophically injured in that year, its operating expenses and adjustments for the amount of excesses or deficiencies in prior assessments. The MCCA reimburses all current and former member companies (whether or not actively writing motor vehicle coverage in Michigan) for qualifying claims and claims expenses incurred while the member companies were actively writing the mandatory personal injury protection coverage in Michigan.
The MCCA’s annual assessments have been sufficient to fund current operations and member companies’ reimbursements to date since inception, but they have not resulted in sufficient pre-funding of its ultimate obligation to reimburse all expected future billings from member companies for reimbursement of their ultimate qualifying claims. There is no method by which insurers are able to obtain the benefit of managed care programs to reduce claims costs through the MCCA. Member companies actively writing automobile coverage in Michigan include the MCCA annual assessments in determining the level of premiums to charge insureds in the state.
The MCCA has a statutory accounting permitted practice that has been granted by the Michigan Department of Insurance to discount its liabilities for loss and loss adjustment expense. As of June 30, 2017, the date of the most recent statutory financial reports, the permitted practice reduced the MCCA’s accumulated deficit of $48.71 billion by $46.08 billion to $2.63 billion. Calculation of the pre-funding shortfall is dependent on actuarial estimates and investment funding decisions. The MCCA is not pursing economic actions approved by the Michigan Department of Insurance that may eliminate the accumulated deficit. As of December 31, 2016, our auto market share in Michigan was 8.6%.
Technological changes such as autonomous or partially autonomous vehicles or technologies that facilitate ride sharing could significantly impact the number of vehicles in use or the extent of customer needs for vehicle insurance. Although the timing and extent of the technology changes and their impact on the numbers of motor vehicle insurance policies and the extent of their coverage in Michigan are uncertain, these changes may result in a diminished number of insured vehicles over which MCCA assessments can be recovered. If this occurs, we may not be able to recover all of the MCCA’s assessments through our
insurance premiums collected from our insureds. Consequently, we may experience increased costs to operate our business. Moreover, the MCCA may not be able to sufficiently assess member companies annually to fund its obligation to reimburse its ultimate obligation to all member companies for qualifying claims and claims expenses. Our inability to recover MCCA annual assessments from insureds or obtain reimbursement for the payment of covered claims ultimately reimbursable by the MCCA could have a material effect on our results of operations and financial condition.
Impacts from the Covered Agreement may involve changes in state insurance laws that may adversely affect our results of operations and financial condition
Existing laws in 15 states require some form of collateral to be posted for the benefit of the ceding insurer when an assuming reinsurer is not domiciled in the ceding company’s state of domicile. In the remaining states, laws governing reinsurance typically require an assuming reinsurer to post an amount of collateral, based on an independently determined financial strength rating and other factors including whether a particular reinsurer has achieved certified status. Under Dodd-Frank, a Covered Agreement may pre-empt state insurance laws that are inconsistent with its terms. The Covered Agreement signed by the U.S. and EU provides states with five years from the date of signature to conform their laws with its terms to avoid preemption. The Covered Agreement between the U.S. and EU could eliminate the requirement for all EU reinsurers that meet certain minimum requirements to post collateral. The elimination of existing collateral requirements could adversely affect our results of operations and financial condition if reinsurers fail to pay our reinsurance billings.
Strategic Risks
Our future growth and profitability are dependent in part on our ability to successfully operate in an insurance industry that is highly competitive
Many of our primary competitors have well-established national reputations and market similar products. In addition, the insurance industry consistently attracts well-capitalized new entrants to the market.
We have invested in growth strategies by utilizing unique customer value propositions for each of our brands, differentiated product offerings and distinctive advertising campaigns. If we are unsuccessful in generating new business, retaining a sufficient number of customers, retaining or acquiring key relationships or renewing contracts within our voluntary benefits or protection plan businesses, our ability to maintain or increase premiums written or the ability to sell our products could be adversely impacted. In addition, if we experience unexpected increases in underlying costs, such as the frequency or severity of claims costs, it could result in decreases in profitability and lead to price increases. This, in turn, could negatively impact our competitive position leading to a decline in new and renewal business. Further, many of our
The Allstate Corporation 27
2017 Form 10-K Part I - Item 1A. Risk Factors and Other Disclosures
competitors are also using data analytics to improve pricing accuracy, be more targeted in marketing, strengthen customer relationships and provide more customized services. They may obtain a competitive advantage if they are able to use data analytics more effectively than we currently do.
Because of the competitive nature of the insurance industry, there can be no assurance that we will continue to compete effectively within our industry, or that competitive pressures will not have a material effect on our business, results of operations or financial condition. This includes competition for producers such as exclusive and independent agents and their licensed sales professionals. Growth and retention may be materially affected if we are unable to attract and retain these producers or if the producers are unable to attract and retain their licensed sales professionals or customers. Furthermore, certain competitors operate using a mutual insurance company structure and therefore may have dissimilar profitability and return targets.
Our ability to successfully operate may also be impaired if we are not effective in developing the talent and skills of our human resources, attracting and assimilating new executive talent into our organization, retaining experienced and qualified employees or deploying human resource talent consistently with our business goals.
The potential benefits of our sophisticated risk segmentation process may not be fully realized
Sophisticated pricing and underwriting methods have allowed us to offer competitive pricing to attract and retain more customers while continuing to operate profitably. However, because many of our competitors seek to adopt underwriting criteria and sophisticated pricing models similar to those we use, our competitive advantage could decline or be lost. Further, the review of such pricing models by regulators and special interest groups may require changes to such models. In addition, competitive pressures could force us to modify these sophisticated pricing models. Furthermore, we cannot be assured that these sophisticated pricing models will accurately reflect the level of losses that we will ultimately incur.
Acquisitions or divestitures of businesses may not produce anticipated benefits resulting in operating difficulties, unforeseen liabilities or asset impairments, which may adversely affect our results of operations and financial condition
The ability to achieve certain anticipated financial benefits from the acquisition of SquareTrade Holding Company, Inc. or other businesses depends in part upon our ability to successfully grow the businesses consistent with our anticipated acquisition economics. Our financial results could be adversely affected by unanticipated performance issues, unforeseen liabilities, transaction-related charges, diversion of management time and resources to acquisition integration challenges or growth strategies, loss of key employees, amortization of expenses related to intangibles, charges for impairment of long-term assets or goodwill and indemnifications. In addition,
acquired businesses may not perform as projected, cost savings anticipated from the acquisition may not materialize, and costs associated with the integration may be greater than anticipated. This may result in the company not achieving returns on its investment at the level projected at acquisition. We also may make strategic divestitures from time to time. These transactions may result in continued financial involvement in the divested businesses, such as through reinsurance, guarantees or other financial arrangements, following the transaction. Nonperformance or decline in the financial strength ratings by those divested businesses could affect our future financial results through an increase in policy lapses, decreased future premiums, additional payment obligations, higher costs or asset write-downs. We reinsure life insurance and payout annuity business from Lincoln Benefit Life Company (“LBL”). Premiums and contract charges assumed from LBL totaled $720 million in 2017. A decline in LBL’s financial strength ratings could adversely affect our results of operations by decreasing future premiums.
Reducing our concentration in spread-based business and exiting certain distribution channels may adversely affect annuity reported results
We have been reducing our concentration in spread-based business since 2008 and discontinued offering fixed annuities effective January 1, 2014. We also exited the independent master brokerage agencies and structured settlement annuity brokers distribution channels in 2013 and sold LBL on April 1, 2014. The reduction in sales of these products has and will continue to reduce investment portfolio levels. It may also affect the settlement of contract benefits including sales of assets with unrealized capital losses and affect insurance reserves deficiency testing.
Part I - Item 1A. Risk Factors and Other Disclosures 2017 Form 10-K
Item 1B. Unresolved Staff Comments
None.
Item 2. Properties
Our home office complex is owned and located in Northbrook, Illinois. As of December 31, 2017, the home office complex consists of several buildings totaling 1.9 million square feet of office space on a 186-acre site.
We also operate from approximately 500 administrative, data processing, claims handling and other support facilities in North America. In addition to our home office facilities, 1.3 million square feet are owned and 6.0 million square feet are leased. Outside North America, we lease three properties in Northern Ireland comprising approximately 165,000 square feet. We also have two leased facilities in India for approximately 250,000 square feet and two leased facilities in London for 3,385 square feet.
The locations where Allstate exclusive agencies operate in the U.S. are normally leased by the agencies.
Item 3. Legal Proceedings
Information required for Item 3 is incorporated by reference to the discussion under the heading “Regulation and compliance” and under the heading “Legal and regulatory proceedings and inquiries” in Note 14 of the consolidated financial statements.
Item 4. Mine Safety Disclosures
Not applicable.
The Allstate Corporation 29
2017 Form 10-K
Part II
Item 5. Market for Registrant’s Common Equity, Related Stockholder Matters and Issuer Purchases of Equity Securities
As of January 31, 2018, there were 75,863 holders of record of The Allstate Corporation’s common stock. The principal market for the common stock is the New York Stock Exchange but it is also listed on the Chicago Stock Exchange. Set forth below are the high, low and closing prices of the New York Stock Exchange Composite listing, and cash dividends declared for the common stock during 2017 and 2016.
| Common stock high and low New York Stock Exchange Composite listing prices and cash dividends declared | ||||||||||||||||||||||||||||||||
| 2017 | 2016 | |||||||||||||||||||||||||||||||
| High | Low | Close | Dividends Declared | High | Low | Close | Dividends Declared | |||||||||||||||||||||||||
| First quarter | $ | 83.09 | $ | 73.04 | $ | 81.49 | $ | 0.37 | $ | 67.92 | $ | 56.03 | $ | 67.37 | $ | 0.33 | ||||||||||||||||
| Second quarter | 90.74 | 79.09 | 88.44 | 0.37 | 69.95 | 64.36 | 69.95 | 0.33 | ||||||||||||||||||||||||
| Third quarter | 95.25 | 85.59 | 91.91 | 0.37 | 70.38 | 67.24 | 69.18 | 0.33 | ||||||||||||||||||||||||
| Fourth quarter | 105.36 | 90.62 | 104.71 | 0.37 | 74.77 | 66.55 | 74.12 | 0.33 |
The payment of dividends by Allstate Insurance Company (“AIC”) to The Allstate Corporation is limited by Illinois insurance law to formula amounts based on statutory net income and statutory surplus, as well as the timing and amount of dividends paid in the preceding twelve months. In the twelve-month period ending December 31, 2017, AIC paid dividends of $1.56 billion. Based on the greater of 2017 statutory net income or 10% of statutory surplus, the maximum amount of dividends that AIC will be able to pay, without prior Illinois Department of Insurance approval, at a given point in time in 2018 is $2.87 billion, less dividends paid during the preceding twelve months measured at that point in time. Notification and approval of intercompany lending activities are also required by the Illinois Department of Insurance for those transactions that exceed formula amounts based on statutory admitted assets and statutory surplus.
Common stock performance graph
The following performance graph compares the cumulative total shareholder return on Allstate Common Stock for a five-year period (December 31, 2012 to December 31, 2017) with the cumulative total return of the S&P Property and Casualty Insurance Index (S&P P/C) and the S&P’s 500 stock index.
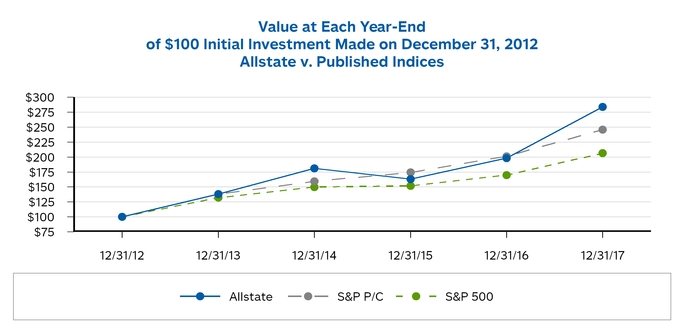
| Value at each year-end of $100 initial investment made on December 31, 2012 | ||||||||||||||||||||||||
| 12/31/2012 | 12/31/2013 | 12/31/2014 | 12/31/2015 | 12/31/2016 | 12/31/2017 | |||||||||||||||||||
| Allstate | $ | 100.00 | $ | 138.26 | $ | 180.93 | $ | 163.00 | $ | 198.05 | $ | 283.74 | ||||||||||||
| S&P P/C | $ | 100.00 | $ | 138.13 | $ | 159.42 | $ | 174.29 | $ | 201.30 | $ | 245.90 | ||||||||||||
| S&P 500 | $ | 100.00 | $ | 132.04 | $ | 149.89 | $ | 151.94 | $ | 169.82 | $ | 206.49 |
2017 Form 10-K
Issuer Purchases of Equity Securities
| Period | Total number of shares (or units) purchased (1) | Average price paid per share (or unit) | Total number of shares (or units) purchased as part of publicly announced plans or programs (3) | Maximum number (or approximate dollar value) of shares (or units) that may yet be purchased under the plans or programs (4) | ||||||||
| October 1, 2017 - October 31, 2017 | ||||||||||||
| Open Market Purchases | 1,796,030 | $ | 92.8883 | 1,789,717 | ||||||||
| November 1, 2017 - November 30, 2017 | ||||||||||||
| Open Market Purchases | 2,028,067 | 99.3560 | 1,512,700 | |||||||||
| December 1, 2017 - December 31, 2017 | ||||||||||||
| ASR Agreement (2) | 2,487,805 | — | 2,487,805 | |||||||||
| Open Market Purchases | 473,424 | 98.0832 | 70,000 | |||||||||
| Total | 6,785,326 | 5,860,222 | $1.27 billion |
| (1) | In accordance with the terms of its equity compensation plans, Allstate acquired the following shares in connection with the vesting of restricted stock units and performance stock awards and the exercise of stock options held by employees and/or directors. The shares were acquired in satisfaction of withholding taxes due upon exercise or vesting and in payment of the exercise price of the options. |
October: 6,313
November: 515,367
December: 124
| (2) | On December 8, 2017, Allstate entered into an accelerated share repurchase agreement (“ASR Agreement”) with Morgan Stanley & Co. LLC (“Morgan Stanley”), to purchase $300 million of our outstanding shares of common stock. In exchange for an upfront payment of $300 million, Morgan Stanley initially delivered 2,487,805 shares to Allstate. This ASR agreement settled on January 5, 2018, and we repurchased a total of 2.92 million shares at an average price of $102.8811. |
| (3) | From time to time, repurchases under our programs are executed under the terms of a pre-set trading plan meeting the requirements of Rule 10b5-1(c) of the Securities Exchange Act of 1934. |
| (4) | On May 4, 2016, we announced the approval of a common share repurchase program for $1.5 billion, which was completed on August 21, 2017. On August 1, 2017, we announced the approval of a new common share repurchase program for $2 billion, which is expected to be completed by February 2019. |
The Allstate Corporation 31
2017 Form 10-K
Item 6. Selected Financial Data
| 5-year summary of selected financial data | ||||||||||||||||||||
| ($ in millions, except per share data and ratios) | 2017 | 2016 | 2015 | 2014 | 2013 | |||||||||||||||
| Consolidated Operating Results | ||||||||||||||||||||
| Insurance premiums and contract charges | $ | 34,678 | $ | 33,582 | $ | 32,467 | $ | 31,086 | $ | 29,970 | ||||||||||
| Net investment income | 3,401 | 3,042 | 3,156 | 3,459 | 3,943 | |||||||||||||||
| Realized capital gains and losses | 445 | (90 | ) | 30 | 694 | 594 | ||||||||||||||
| Total revenues | 38,524 | 36,534 | 35,653 | 35,239 | 34,507 | |||||||||||||||
| Net income applicable to common shareholders | 3,073 | 1,761 | 2,055 | 2,746 | 2,263 | |||||||||||||||
| Net income applicable to common shareholders per common share: | ||||||||||||||||||||
| Net income applicable to common shareholders per common share - Basic | 8.49 | 4.72 | 5.12 | 6.37 | 4.87 | |||||||||||||||
| Net income applicable to common shareholders per common share - Diluted | 8.36 | 4.67 | 5.05 | 6.27 | 4.81 | |||||||||||||||
| Cash dividends declared per common share | 1.48 | 1.32 | 1.20 | 1.12 | 1.00 | |||||||||||||||
| Consolidated Financial Position | ||||||||||||||||||||
| Investments | $ | 82,803 | $ | 81,799 | $ | 77,758 | $ | 81,113 | $ | 81,155 | ||||||||||
| Total assets (1) | 112,422 | 108,610 | 104,656 | 108,479 | 123,460 | |||||||||||||||
| Reserves for claims and claims expense, life-contingent contract benefits and contractholder funds | 58,308 | 57,749 | 57,411 | 57,832 | 58,547 | |||||||||||||||
| Long-term debt | 6,350 | 6,347 | 5,124 | 5,140 | 6,141 | |||||||||||||||
| Shareholders’ equity | 22,551 | 20,573 | 20,025 | 22,304 | 21,480 | |||||||||||||||
| Shareholders’ equity per diluted common share | 57.58 | 50.77 | 47.34 | 48.24 | 45.31 |
| (1) | As of December 31, 2013, total assets include $11.98 billion of investments that were classified as held for sale relating to the sale of Lincoln Benefit Life Company. |
2017 Form 10-K
Item 7. Management’s Discussion and Analysis of Financial Condition and Results of Operations
| Overview and Segment Results | Page | |
| Overview and 2017 Highlights | 34 | |
| Consolidated Net Income | 37 | |
| Property-Liability Results | 38 | |
| Allstate Protection | 41 | |
| • Allstate brand | 47 | |
| • Esurance brand | 52 | |
| • Encompass brand | 56 | |
| Discontinued Lines and Coverages | 60 | |
| Claims and Claims Expense Reserves | 64 | |
| Service Businesses | 62 | |
| Allstate Life | 73 | |
| Allstate Benefits | 78 | |
| Allstate Annuities | 81 | |
| Key Business Area Results and Updates | ||
| Investments | 85 | |
| Market Risk | 96 | |
| Pension and Other Postretirement Plans | 99 | |
| Capital Resources and Liquidity | 100 | |
| Enterprise Risk and Return Management | 107 | |
| Application of Critical Accounting Estimates | 109 | |
| Regulation and Legal Proceedings | 122 | |
| Pending Accounting Standards | 122 |
The Allstate Corporation 33
2017 Form 10-K
Overview
The following discussion highlights significant factors influencing the consolidated financial position and results of operations of The Allstate Corporation (referred to in this document as “we,” “our,” “us,” the “Company” or “Allstate”). It should be read in conjunction with the 5-year summary of selected financial data, consolidated financial statements and related notes found under Part II. Item 6. and Item 8. contained herein.
In fourth quarter 2017, we changed from four to seven reportable segments. These segments align with our key product and service offerings and reflect the manner in which our chief operating decision maker reviews performance and makes decisions about the allocation of resources. To conform to the current year presentation, certain amounts in the prior years’ financial information have been updated to reflect changes in reportable segments. For additional information on the changes in reportable segments, see Notes 1, 2 and 4 of the consolidated financial statements.
The most important factors we monitor to evaluate the financial condition and performance for our reportable segments and the Company include:
| • | Allstate Protection: premium, policies in force (“PIF”), new business sales, policy retention, price changes, claim frequency and severity, catastrophes, loss ratio, expenses, underwriting results, and relative competitive position. |
| • | Service Businesses: revenues, premium written, PIF, adjusted net income and net income. |
| • | Allstate Life: premiums and contract charges, new business sales, PIF, benefit spread, expenses, adjusted net income and net income. |
| • | Allstate Benefits: premiums, new business sales, PIF, benefit ratio, expenses, adjusted net income and net income. |
| • | Allstate Annuities: investment spread, asset-liability matching, contract benefits, expenses, adjusted net income, net income and invested assets. |
| • | Investments: exposure to market risk, asset allocation, credit quality/experience, total return, net investment income, cash flows, realized capital gains and losses, unrealized capital gains and losses, stability of long-term returns, and asset and liability duration. |
| • | Financial condition: liquidity, parent holding company deployable assets, financial strength ratings, operating leverage, debt levels, book value per share and return on equity. |
Measuring segment profit or loss
The measure of segment profit or loss used in evaluating performance is underwriting income for the Allstate Protection and Discontinued Lines and Coverages segments and adjusted net income for the Service Businesses, Allstate Life, Allstate Benefits, Allstate Annuities, and Corporate and Other segments.
Underwriting income is calculated as premiums earned, less claims and claims expense (“losses”), amortization of DAC, operating costs and expenses and restructuring and related charges, as determined using accounting principles generally accepted in the United States of America (“GAAP”). We use this measure in our evaluation of results of operations to analyze the profitability of the Property-Liability insurance operations separately from investment results. Underwriting income is reconciled to net income applicable to common shareholders in the Property-Liability Results section of Management’s Discussion and Analysis (“MD&A”).
Adjusted net income is net income applicable to common shareholders, excluding:
| • Realized capital gains and losses, after-tax, except for periodic settlements and accruals on non-hedge derivative instruments, which are reported with realized capital gains and losses but included in adjusted net income |
| • Valuation changes on embedded derivatives not hedged, after-tax |
| • Amortization of DAC and DSI, to the extent they resulted from the recognition of certain realized capital gains and losses or valuation changes on embedded derivatives not hedged, after-tax |
| • Business combination expenses and the amortization of purchased intangible assets, after-tax |
| • Gain (loss) on disposition of operations, after-tax |
| • Adjustments for other significant non-recurring, infrequent or unusual items, when (a) the nature of the charge or gain is such that it is reasonably unlikely to recur within two years, or (b) there has been no similar charge or gain within the prior two years |
Adjusted net income is reconciled to net income applicable to common shareholders in the Service Businesses, Allstate Life, Allstate Benefits and Allstate Annuities Segment sections of MD&A.
2017 Form 10-K
2017 Highlights
| Consolidated Net Income | ||||
| ($ in billions) |
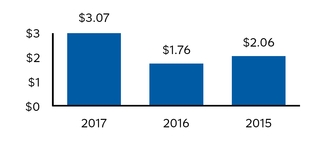
| 2017 vs. 2016 - Increase was primarily due to higher Allstate Protection insurance premiums, a tax benefit from the Tax Legislation, net realized capital gains in 2017 compared to net realized capital losses in 2016, higher net investment income, lower claims and claims expense, partially offset by higher catastrophe losses. The Property-Liability combined ratio was 93.6 in 2017 compared to 96.0 in 2016. 2016 vs. 2015 - Decrease |
Showing the first 8K of 463K characters. Open the full section
Item 7A. Quantitative and Qualitative Disclosures About Market Risk
Information required for Item 7A is incorporated by reference to the material under the caption “Market Risk” in Part II, Item 7 of this report.
Item 8. Financial Statements and Supplementary Data
| Consolidated Financial Statements | Page | |
| Consolidated Statements of Operations | 123 | |
| Consolidated Statements of Comprehensive Income | 124 | |
| Consolidated Statements of Financial Position | 125 | |
| Consolidated Statements of Shareholders’ Equity | 126 | |
| Consolidated Statements of Cash Flows | 127 | |
| Notes to Consolidated Financial Statements (Notes) | 128 | |
| Report of Independent Registered Public Accounting Firm | 209 |
122 www.allstate.com
Financial Statements 2017 Form 10-K
The Allstate Corporation and Subsidiaries
Consolidated Statements of Operations
| Years Ended December 31, | ||||||||||||
| ($ in millions, except per share data) | 2017 | 2016 | 2015 | |||||||||
| Revenues | ||||||||||||
| Property and casualty insurance premiums (net of reinsurance ceded of $971, $987 and $1,006) | $ | 32,300 | $ | 31,307 | $ | 30,309 | ||||||
| Life premiums and contract charges (net of reinsurance ceded of $303, $309 and $332) | 2,378 | 2,275 | 2,158 | |||||||||
| Net investment income | 3,401 | 3,042 | 3,156 | |||||||||
| Realized capital gains and losses: | ||||||||||||
| Total other-than-temporary impairment (“OTTI”) losses | (146 | ) | (313 | ) | (452 | ) | ||||||
| OTTI losses reclassified to other comprehensive income | (4 | ) | 10 | 36 | ||||||||
| Net OTTI losses recognized in earnings | (150 | ) | (303 | ) | (416 | ) | ||||||
| Sales and other realized capital gains and losses | 595 | 213 | 446 | |||||||||
| Total realized capital gains and losses | 445 | (90 | ) | 30 | ||||||||
| Total revenues | 38,524 | 36,534 | 35,653 | |||||||||
| Costs and expenses | ||||||||||||
| Property and casualty insurance claims and claims expense (net of reinsurance ceded of $1,807, $1,116 and $602) | 21,929 | 22,221 | 21,034 | |||||||||
| Life contract benefits (net of reinsurance ceded of $179, $208 and $219) | 1,923 | 1,857 | 1,803 | |||||||||
| Interest credited to contractholder funds (net of reinsurance ceded of $25, $26 and $25) | 690 | 726 | 761 | |||||||||
| Amortization of deferred policy acquisition costs | 4,784 | 4,550 | 4,364 | |||||||||
| Operating costs and expenses | 4,658 | 4,106 | 4,081 | |||||||||
| Restructuring and related charges | 109 | 30 | 39 | |||||||||
| Goodwill impairment | 125 | — | — | |||||||||
| Interest expense | 335 | 295 | 292 | |||||||||
| Total costs and expenses | 34,553 | 33,785 | 32,374 | |||||||||
| Gain on disposition of operations | 20 | 5 | 3 | |||||||||
| Income from operations before income tax expense | 3,991 | 2,754 | 3,282 | |||||||||
| Income tax expense | 802 | 877 | 1,111 | |||||||||
| Net income | 3,189 | 1,877 | 2,171 | |||||||||
| Preferred stock dividends | 116 | 116 | 116 | |||||||||
| Net income applicable to common shareholders | $ | 3,073 | $ | 1,761 | $ | 2,055 | ||||||
| Earnings per common share: | ||||||||||||
| Net income applicable to common shareholders per common share - Basic | $ | 8.49 | $ | 4.72 | $ | 5.12 | ||||||
| Weighted average common shares - Basic | 362.0 | 372.8 | 401.1 | |||||||||
| Net income applicable to common shareholders per common share - Diluted | $ | 8.36 | $ | 4.67 | $ | 5.05 | ||||||
| Weighted average common shares - Diluted | 367.8 | 377.3 | 406.8 | |||||||||
| Cash dividends declared per common share | $ | 1.48 | $ | 1.32 | $ | 1.20 |
See notes to consolidated financial statements.
The Allstate Corporation 123
2017 Form 10-K Financial Statements
The Allstate Corporation and Subsidiaries
Consolidated Statements of Comprehensive Income
| Years Ended December 31, | ||||||||||||
| ($ in millions) | 2017 | 2016 | 2015 | |||||||||
| Net income | $ | 3,189 | $ | 1,877 | $ | 2,171 | ||||||
| Other comprehensive income (loss), after-tax | ||||||||||||
| Changes in: | ||||||||||||
| Unrealized net capital gains and losses | 319 | 433 | (1,306 | ) | ||||||||
| Unrealized foreign currency translation adjustments | 47 | 10 | (58 | ) | ||||||||
| Unrecognized pension and other postretirement benefit cost | 307 | (104 | ) | 48 | ||||||||
| Other comprehensive income (loss), after-tax | 673 | 339 | (1,316 | ) | ||||||||
| Comprehensive income | $ | 3,862 | $ | 2,216 | $ | 855 |
See notes to consolidated financial statements.
124 www.allstate.com
Financial Statements 2017 Form 10-K
The Allstate Corporation and Subsidiaries
Consolidated Statements of Financial Position
| December 31, | ||||||||
| ($ in millions, except par value data) | 2017 | 2016 | ||||||
| Assets | ||||||||
| Investments | ||||||||
| Fixed income securities, at fair value (amortized cost $57,525 and $56,576) | $ | 58,992 | $ | 57,839 | ||||
| Equity securities, at fair value (cost $5,461 and $5,157) | 6,621 | 5,666 | ||||||
| Mortgage loans | 4,534 | 4,486 | ||||||
| Limited partnership interests | 6,740 | 5,814 | ||||||
| Short-term, at fair value (amortized cost $1,944 and $4,288) | 1,944 | 4,288 | ||||||
| Other | 3,972 | 3,706 | ||||||
| Total investments | 82,803 | 81,799 | ||||||
| Cash | 617 | 436 | ||||||
| Premium installment receivables, net | 5,786 | 5,597 | ||||||
| Deferred policy acquisition costs | 4,191 | 3,954 | ||||||
| Reinsurance recoverables, net | 8,921 | 8,745 | ||||||
| Accrued investment income | 569 | 567 | ||||||
| Property and equipment, net | 1,072 | 1,065 | ||||||
| Goodwill | 2, |
Showing the first 8K of 463K characters. Open the full section
Item 9. Changes in and Disagreements with Accountants on Accounting and Financial Disclosure
None.
Item 9A. Controls and Procedures
Evaluation of Disclosure Controls and Procedures. We maintain disclosure controls and procedures as defined in Rule 13a-15(e) under the Securities Exchange Act of 1934. Under the supervision and with the participation of our management, including our principal executive officer and principal financial officer, we conducted an evaluation of the effectiveness of our disclosure controls and procedures as of the end of the period covered by this report. Based upon this evaluation, the principal executive officer and the principal financial officer concluded that our disclosure controls and procedures are effective in providing reasonable assurance that material information required to be disclosed in our reports filed with or submitted to the Securities and Exchange Commission under the Securities Exchange Act is recorded, processed, summarized and reported within the time periods specified by the Securities Exchange Act and made known to management, including the principal executive officer and the principal financial officer, as appropriate to allow timely decisions regarding required disclosure.
Management’s Report on Internal Control over Financial Reporting. Management is responsible for establishing and maintaining adequate internal control over financial reporting as defined in Rule 13a-15(f) under the Securities Exchange Act of 1934.
Under the supervision and with the participation of our management, including our principal executive officer and principal financial officer, we conducted an evaluation of the effectiveness of our internal control over financial reporting as of December 31, 2017 based on the criteria related to internal control over financial reporting described in “Internal Control – Integrated Framework (2013)” issued by the Committee of Sponsoring Organizations of the Treadway Commission. Based on our evaluation, management concluded that our internal control over financial reporting was effective as of December 31, 2017.
Deloitte & Touche LLP, the independent registered public accounting firm that audited the consolidated financial statements included in this Form 10-K, has issued their attestation report on the Company’s internal control over financial reporting, which is included herein.
Changes in Internal Control over Financial Reporting. During the fiscal quarter ended December 31, 2017, there have been no changes in our internal control over financial reporting that have materially affected, or are reasonably likely to materially affect, our internal control over financial reporting.
Item 9B. Other Information
On February 23, 2018, Mary Alice Taylor informed The Allstate Corporation that she will not stand for re-election to the board of directors at the Corporation’s annual stockholders meeting scheduled for May 11, 2018. Ms. Taylor will continue to serve as a director until such stockholders meeting. Her decision to not stand for re-election did not involve any disagreement with the Corporation.
210 www.allstate.com
2017 Form 10-K
Part III
Item 10. Directors, Executive Officers and Corporate Governance
Information regarding directors of The Allstate Corporation standing for election at the 2018 annual stockholders meeting is incorporated in this Item 10 by reference to the descriptions in the Proxy Statement under the captions “Corporate Governance – Proposal 1. Election of 10 Directors - Director Nominees.”
Information regarding our audit committee and audit committee financial experts is incorporated in this Item 10 by reference to the information under the caption “Corporate Governance - Board Meetings and Committees” in the Proxy Statement.
Information regarding compliance with Section 16(a) of the Securities Exchange Act of 1934 is incorporated in this Item 10 by reference to “Stock Ownership Information – Section 16(a) Beneficial Ownership Reporting Compliance” in the Proxy Statement.
Information regarding executive officers of The Allstate Corporation is incorporated in this Item 10 by
reference to Part I, Item 1 of this report under the caption “Executive Officers of the Registrant.”
We have adopted a global code of business conduct that applies to all of our employees, including our principal executive officer, principal financial officer, principal accounting officer and controller. The text of our global code of business conduct is posted on our website, www.allstateinvestors.com. We intend to satisfy the disclosure requirements under Item 5.05 of Form 8-K, regarding amendments to, and waiver from, the provisions of our global code of business conduct by posting such information on the same website.
Item 11. Executive Compensation
Information required for Item 11 is incorporated by reference to the sections of the Proxy Statement with the following captions:
| • | Corporate Governance – Director Compensation |
| • | Executive Compensation |
The Allstate Corporation 211
2017 Form 10-K
Item 12. Security Ownership of Certain Beneficial Owners and Management and Related Stockholder Matters
Information regarding security ownership of certain beneficial owners and management is incorporated in this Item 12 by reference to the sections of the Proxy Statement with the following captions:
| • | Stock Ownership Information – Security Ownership of Directors and Executive Officers |
| • | Stock Ownership Information – Security Ownership of Certain Beneficial Owners |
| Equity compensation plan information | ||||||||||
| The following table includes information as of December 31, 2017, with respect to The Allstate Corporation’s equity compensation plans: | ||||||||||
| Plan Category | Number of Securities to be Issued upon Exercise of Outstanding Options, Warrants and Rights | Weighted-Average Exercise Price of Outstanding Options, Warrants and Rights | Number of Securities Remaining Available for Future Issuance under Equity Compensation Plans (Excluding Securities Reflected in Column (a)) | |||||||
| (a) | (b) | (c) | ||||||||
| Equity Compensation Plans Approved by Security Holders (1) | 14,683,337 | (2) | 58.46 | 15,906,409 | (3) | |||||
| Total | 14,683,337 | (2) | 58.46 | 15,906,409 | (3) |
| (1) | Consists of the 2013 Equity Incentive Plan, which amended and restated the 2009 Equity Incentive Plan; the 2017 Equity Compensation Plan for Non-Employee Directors; the 2006 Equity Compensation Plan for Non-Employee Directors; and the Equity Incentive Plan for Non-Employee Directors (the equity plan for non-employee directors prior to 2006). The Corporation does not maintain any equity compensation plans not approved by stockholders. |
| (2) | As of December 31, 2017, 1,241,053 restricted stock units (“RSUs”) and 2,180,644 performance stock awards (“PSAs”) were outstanding. The weighted-average exercise price of outstanding options, warrants, and rights does not take into account RSUs and PSAs, which have no exercise price. PSAs are reported at the maximum potential amount awarded for incomplete performance periods and the amount earned for the 2015 PSA grant, reduced for forfeitures. For incomplete performance periods, the actual number of shares earned may be less and are based upon measures achieved at the end of the three-year performance period for those PSAs granted in 2016 and 2017. |
| (3) | Includes 15,523,581 shares that may be issued in the form of stock options, unrestricted stock, restricted stock, restricted stock units, stock appreciation rights, performance units, performance stock, and stock in lieu of cash under the 2013 Equity Incentive Plan; and 382,828 shares that may be issued in the form of stock options, unrestricted stock, restricted stock, restricted stock units, and stock in lieu of cash compensation under the 2017 Equity Compensation Plan for Non-Employee Directors. |
Asset managers, such as those that manage mutual funds and exchange traded funds, principally on behalf of third party investors, at times acquire sufficient voting ownership interests in Allstate to require disclosure. BlackRock, Inc. has disclosed that it, together with certain subsidiaries, held 7.5% of our common stock as of December 31, 2017. BlackRock also manages approximately $3.6 billion of Allstate’s investment portfolio under an investment management agreement and has licensed an investment technology software system to Allstate. The terms of these arrangements are customary and the aggregate related fees are not material. State Street Corp. manages an investment portfolio of $2.1 billion on behalf of participants in Allstate’s 401(k) Savings Plan and $2.7 billion on behalf of Allstate domestic qualified pension plans. The terms of these arrangements are customary and the aggregate related fees are not material.
Item 13. Certain Relationships and Related Transactions, and Director Independence
Information required for Item 13 is incorporated by reference to the material in the Proxy Statement under the captions “Corporate Governance – Board Leadership Structure and Practices – Related Person Transactions” and “Corporate Governance –Board Composition and Nominee Considerations – Nominee Independence Determinations” and “Appendix B – Categorical Standards of Independence.”
Item 14. Principal Accounting Fees and Services
Information required for Item 14 is incorporated by reference to the material in the Proxy Statement under the caption “Audit Committee Matters – Proposal 3. Ratification of Deloitte & Touche LLP as the Independent Registered Public Accountant for 2018.”
212 www.allstate.com
2017 Form 10-K
Part IV
Item 15. (a) (1) Exhibits and Financial Statement Schedules.
The following consolidated financial statements, notes thereto and related information of The Allstate Corporation (the “Company”) are included in Item 8.
| • | Consolidated Statements of Operations |
| • | Consolidated Statements of Comprehensive Income |
| • | Consolidated Statements of Financial Position |
| • | Consolidated Statements of Shareholders’ Equity |
| • | Consolidated Statements of Cash Flows |
| • | Notes to the Consolidated Financial Statements |
| • | Report of Independent Registered Public Accounting Firm |
Item 15. (a) (2)
The following additional financial statement schedules are furnished herewith pursuant to the requirements of Form 10-K.
| The Allstate Corporation | Page | |||
| Schedules required to be filed under the provisions of Regulation S-X Article 7: | ||||
| Schedule I | Summary of Investments – Other than Investments in Related Parties | S-1 | ||
| Schedule II | Condensed Financial Information of Registrant (The Allstate Corporation) | S-2 | ||
| Schedule III | Supplementary Insurance Information | S-6 | ||
| Schedule IV | Reinsurance | S-7 | ||
| Schedule V | Valuation Allowances and Qualifying Accounts | S-8 |
All other schedules are omitted because they are not applicable, or not required, or because the required information is included in the Consolidated Financial Statements or in notes thereto.
Item 15. (a) (3)
The following is a list of the exhibits filed as part of this Form 10-K. The exhibit numbers followed by an asterisk (*) indicate exhibits that are management contracts or compensatory plans or arrangements. A dagger (†) indicates an award form first used under The Allstate Corporation 2001 Equity Incentive Plan, which was amended and restated as The Allstate Corporation 2009 Equity Incentive Plan. A plus (+) indicates an award form first used under The Allstate Corporation 2009 Equity Incentive Plan, which was amended and restated as The Allstate Corporation 2013 Equity Incentive Plan.
The Allstate Corporation 213
2017 Form 10-K
214 www.allstate.com
2017 Form 10-K
The Allstate Corporation 215
2017 Form 10-K
Item 15. (b)
The exhibits are listed in Item 15. (a)(3) above.
Item 15. (c)
The financial statement schedules are listed in Item 15. (a)(2) above.
Item 16. None.
None.
216 www.allstate.com
2017 Form 10-K
Signatures
Pursuant to the requirements of Section 13 or 15(d) of the Securities Exchange Act of 1934, the registrant has duly caused this report to be signed on its behalf by the undersigned, thereunto duly authorized.
| The Allstate Corporation (Registrant) | ||
| /s/ Eric K. Ferren | ||
| By: Eric K. Ferren Senior Vice President, Controller, and Chief Accounting Officer (Principal Accounting Officer) | ||
| February 26, 2018 |
Pursuant to the requirements of the Securities Exchange Act of 1934, this report has been signed below by the following persons on behalf of the registrant and in the capacities and on the dates indicated.
| Signature | Title | Date | ||
| /s/ Thomas J. Wilson | Chairman of the Board, President, Chief Executive Officer and a Director (Principal Executive Officer) | February 26, 2018 | ||
| Thomas J. Wilson | ||||
| /s/ Mario Rizzo | Executive Vice President and Chief Financial Officer (Principal Financial Officer) | February 26, 2018 | ||
| Mario Rizzo | ||||
| /s/ Kermit R. Crawford | Director | February 26, 2018 | ||
| Kermit R. Crawford | ||||
| /s/ Michael L. Eskew | Director | February 26, 2018 | ||
| Michael L. Eskew | ||||
| /s/ Margaret M. Keane | Director | February 26, 2018 | ||
| Margaret M. Keane | ||||
| /s/ Siddharth N. Mehta | Director | February 26, 2018 | ||
| Siddharth N. Mehta | ||||
| /s/ Jacques P. Perold | Director | February 26, 2018 | ||
| Jacques P. Perold | ||||
| /s/ Andrea Redmond | Director | February 26, 2018 | ||
| Andrea Redmond | ||||
| /s/ John W. Rowe | Director | February 26, 2018 | ||
| John W. Rowe | ||||
| /s/ Gregg M. Sherrill | Director | February 26, 2018 | ||
| Gregg M. Sherrill | ||||
| /s/ Judith A. Sprieser | Lead Director | February 26, 2018 | ||
| Judith A. Sprieser | ||||
| /s/ Mary Alice Taylor | Director | February 26, 2018 | ||
| Mary Alice Taylor | ||||
| /s/ Perry M. Traquina | Director | February 26, 2018 | ||
| Perry M. Traquina |
The Allstate Corporation 217
2017 Form 10-K
The Allstate Corporation and Subsidiaries
Schedule I — Summary of Investments Other than Investments in Related Parties
| As of December 31, 2017 | ||||||||||||
| ($ in millions) | Cost/amortized cost | Fair value | Amount at which shown in the Balance Sheet | |||||||||
| Type of investment | ||||||||||||
| Fixed maturities: | ||||||||||||
| Bonds: | ||||||||||||
| United States government, government agencies and authorities | $ | 3,580 | $ | 3,616 | $ | 3,616 | ||||||
| States, municipalities and political subdivisions | 8,053 | 8,328 | 8,328 | |||||||||
| Foreign governments | 1,005 | 1,021 | 1,021 | |||||||||
| Public utilities | 5,655 | 5,988 | 5,988 | |||||||||
| All other corporate bonds | 37,341 | 38,038 | 38,038 | |||||||||
| Asset-backed securities | 1,266 | 1,272 | 1,272 | |||||||||
| Residential mortgage-backed securities | 480 | 578 | 578 | |||||||||
| Commercial mortgage-backed securities | 124 | 128 | 128 | |||||||||
| Redeemable preferred stocks | 21 | 23 | 23 | |||||||||
| Total fixed maturities | 57,525 | $ | 58,992 | 58,992 | ||||||||
| Equity securities: | ||||||||||||
| Common stocks: | ||||||||||||
| Public utilities | 84 | $ | 99 | 99 | ||||||||
| Banks, trusts and insurance companies | 565 | 725 | 725 | |||||||||
| Industrial, miscellaneous and all other | 4,591 | 5,506 | 5,506 | |||||||||
| Nonredeemable preferred stocks | 221 | 291 | 291 | |||||||||
| Total equity securities | 5,461 | $ | 6,621 | 6,621 | ||||||||
| Mortgage loans on real estate | 4,534 | $ | 4,732 | 4,534 | ||||||||
| Real estate (none acquired in satisfaction of debt) | 468 | 468 | ||||||||||
| Policy loans | 905 | 905 | ||||||||||
| Derivative instruments | 127 | $ | 127 | 127 | ||||||||
| Limited partnership interests | 6,740 | 6,740 | ||||||||||
| Other long-term investments | 2,472 | 2,472 | ||||||||||
| Short-term investments | 1,944 | $ | 1,944 | 1,944 | ||||||||
| Total investments | $ | 80,176 | $ | 82,803 |
S-1 www.allstate.com
2017 Form 10-K
The Allstate Corporation and Subsidiaries
Schedule II — Condensed Financial Information of Registrant Statement of Operations
| Year Ended December 31, | ||||||||||||
| ($ in millions) | 2017 | 2016 | 2015 | |||||||||
| Revenues | ||||||||||||
| Investment income, less investment expense | $ | 10 | $ | 11 | $ | 8 | ||||||
| Realized capital gains and losses | (2 | ) | 2 | — | ||||||||
| Other income | 36 | 55 | 66 | |||||||||
| 44 | 68 | 74 | ||||||||||
| Expenses | ||||||||||||
| Interest expense | 334 | 295 | 292 | |||||||||
| Pension and other postretirement benefit expense | 119 | 10 | (15 | ) | ||||||||
| Other operating expenses | 50 | 28 | 34 | |||||||||
| 503 | 333 | 311 | ||||||||||
| Loss from operations before income tax benefit and equity in net income of subsidiaries | (459 | ) | (265 | ) | (237 | ) | ||||||
| Income tax benefit | (92 | ) | (115 | ) | (108 | ) | ||||||
| Loss before equity in net income of subsidiaries | (367 | ) | (150 | ) | (129 | ) | ||||||
| Equity in net income of subsidiaries | 3,556 | 2,027 | 2,300 | |||||||||
| Net income | 3,189 | 1,877 | 2,171 | |||||||||
| Preferred stock dividends | 116 | 116 | 116 | |||||||||
| Net income applicable to common shareholders | 3,073 | 1,761 | 2,055 | |||||||||
| Other comprehensive income (loss), after-tax | ||||||||||||
| Changes in: | ||||||||||||
| Unrealized net capital gains and losses | 319 | 433 | (1,306 | ) | ||||||||
| Unrealized foreign currency translation adjustments | 47 | 10 | (58 | ) | ||||||||
| Unrecognized pension and other postretirement benefit cost | 307 | (104 | ) | 48 | ||||||||
| Other comprehensive income (loss), after-tax | 673 | 339 | (1,316 | ) | ||||||||
| Comprehensive income | $ | 3,862 | $ | 2,216 | $ | 855 |
See accompanying notes to condensed financial information and notes to consolidated financial statements.
The Allstate Corporation S-2
2017 Form 10-K
The Allstate Corporation and Subsidiaries
Schedule II (Continued) — Condensed Financial Information of Registrant Statement of Financial Position
| ($ in millions, except par value data) | December 31, | |||||||
| 2017 | 2016 | |||||||
| Assets | ||||||||
| Investments in subsidiaries | $ | 29,126 | $ | 26,929 | ||||
| Fixed income securities, at fair value (amortized cost $361 and $510) | 362 | 513 | ||||||
| Short-term investments, at fair value (amortized cost $171 and $219) | 171 | 219 | ||||||
| Cash | — | 2 | ||||||
| Receivable from subsidiaries | 427 | 385 | ||||||
| Deferred income taxes | 124 | 348 | ||||||
| Other assets | 150 | 138 | ||||||
| Total assets | $ | 30,360 | $ | 28,534 | ||||
| Liabilities | ||||||||
| Long-term debt | $ | 6,350 | $ | 6,347 | ||||
| Pension and other postretirement benefit obligations | 675 | 1,079 | ||||||
| Deferred compensation | 297 | 274 | ||||||
| Notes due to subsidiaries | 250 | — | ||||||
| Dividends payable to shareholders | 167 | 157 | ||||||
| Other liabilities | 70 | 104 | ||||||
| Total liabilities | 7,809 | 7,961 | ||||||
| Shareholders’ equity | ||||||||
| Preferred stock and additional capital paid-in, $1 par value, 25 million shares authorized, 72.2 thousand issued and outstanding, and $1,805 aggregate liquidation preference | 1,746 | 1,746 | ||||||
| Common stock, $.01 par value, 2.0 billion shares authorized and 900 million issued, 355 million and 366 million shares outstanding | 9 | 9 | ||||||
| Additional capital paid-in | 3,313 | 3,303 | ||||||
| Retained income | 43,162 | 40,678 | ||||||
| Deferred ESOP expense | (3 | ) | (6 | ) | ||||
| Treasury stock, at cost (545 million and 534 million shares) | (25,982 | ) | (24,741 | ) | ||||
| Accumulated other comprehensive income: | ||||||||
| Unrealized net capital gains and losses | 1,662 | 1,053 | ||||||
| Unrealized foreign currency translation adjustments | (9 | ) | (50 | ) | ||||
| Unrealized pension and other postretirement benefit cost | (1,347 | ) | (1,419 | ) | ||||
| Total accumulated other comprehensive loss | 306 | (416 | ) | |||||
| Total shareholders’ equity | 22,551 | 20,573 | ||||||
| Total liabilities and shareholders’ equity | $ | 30,360 | $ | 28,534 |
See accompanying notes to condensed financial information and notes to consolidated financial statements.
S-3 www.allstate.com
2017 Form 10-K
The Allstate Corporation and Subsidiaries
Schedule II (Continued) — Condensed Financial Information of Registrant Statement of Cash Flows
| ($ in millions) | Years Ended December 31, | |||||||||||
| 2017 | 2016 | 2015 | ||||||||||
| Cash flows from operating activities | ||||||||||||
| Net income | $ | 3,189 | $ | 1,877 | $ | 2,171 | ||||||
| Adjustments to reconcile net income to net cash provided by operating activities: | ||||||||||||
| Equity in net income of subsidiaries | (3,556 | ) | (2,027 | ) | (2,300 | ) | ||||||
| Dividends received from subsidiaries | 1,671 | 1,874 | 2,300 | |||||||||
| Realized capital gains and losses | 2 | (2 | ) | — | ||||||||
| Changes in: | ||||||||||||
| Pension and other postretirement benefits | 119 | 10 | (15 | ) | ||||||||
| Income taxes | 35 | 13 | 77 | |||||||||
| Operating assets and liabilities | 56 | 43 | 26 | |||||||||
| Net cash provided by operating activities | 1,516 | 1,788 | 2,259 | |||||||||
| Cash flows from investing activities | ||||||||||||
| Proceeds from sales of investments | 880 | 389 | 399 | |||||||||
| Investment purchases | (748 | ) | (243 | ) | (4 | ) | ||||||
| Investment collections | 13 | 60 | — | |||||||||
| Return of capital from subsidiaries | 42 | (1,500 | ) | 50 | ||||||||
| Transfers to subsidiaries through intercompany loan agreement | — | (30 | ) | — | ||||||||
| Change in short-term investments, net | 48 | 58 | 397 | |||||||||
| Net cash provided (used in) by investing activities | 235 | (1,266 | ) | 842 | ||||||||
| Cash flows from financing activities | ||||||||||||
| Proceeds from borrowings from subsidiaries | 300 | — | — | |||||||||
| Repayment of notes due to subsidiaries | (50 | ) | — | — | ||||||||
| Proceeds from issuance of long-term debt | — | 1,236 | — | |||||||||
| Repayment of long-term debt | — | (17 | ) | (20 | ) | |||||||
| Dividends paid on common stock | (525 | ) | (486 | ) | (483 | ) | ||||||
| Dividends paid on preferred stock | (116 | ) | (116 | ) | (116 | ) | ||||||
| Treasury stock purchases | (1,495 | ) | (1,337 | ) | (2,808 | ) | ||||||
| Shares reissued under equity incentive plans, net | 135 | 164 | 130 | |||||||||
| Excess tax benefits on share-based payment arrangements | — | 32 | 45 | |||||||||
| Other | (2 | ) | — | — | ||||||||
| Net cash used in financing activities | (1,753 | ) | (524 | ) | (3,252 | ) | ||||||
| Net decrease in cash | (2 | ) | (2 | ) | (151 | ) | ||||||
| Cash at beginning of year | 2 | 4 | 155 | |||||||||
| Cash at end of year | $ | — | $ | 2 | $ | 4 |
See accompanying notes to condensed financial information and notes to consolidated financial statements.
The Allstate Corporation S-4
2017 Form 10-K
The Allstate Corporation and Subsidiaries
Schedule II (Continued) — Condensed Financial Information of Registrant
Notes to Condensed Financial Information
- General
The financial statements of the Registrant should be read in conjunction with the consolidated financial statements and notes thereto included in Item 8. The long-term debt presented in Note 12 “Capital Structure” are direct obligations of the Registrant. A majority of the pension and other postretirement benefits plans presented in Note 17 “Benefit Plans” are direct obligations of the Registrant.
Participating subsidiaries fund the pension plans contributions under a master services cost sharing agreement. In addition, as a result of joint and several pension liability rules under the Internal Revenue Code and the Employee Retirement Income Security Act of 1974, as amended, many liabilities that arise in connection with pension plans are joint and several across all members of a controlled group of entities.
- Notes due to subsidiaries
On December 11, 2017, the Registrant issued $125 million and $175 million notes, each with a rate of 1.59% and due on June 11, 2018, to its wholly owned subsidiaries Kennett Capital Inc. and Allstate Non-Insurance Holdings Inc (“ANIHI”), respectively. The proceeds of these issuances were used for cash management purposes. On December 20, 2017, the Registrant repaid $50 million to ANIHI.
- Supplemental Disclosures of Cash Flow Information
The Registrant paid $331 million, $287 million and $289 million of interest on debt in 2017, 2016 and 2015, respectively.
S-5 www.allstate.com
2017 Form 10-K
The Allstate Corporation and Subsidiaries
Schedule III — Supplementary Insurance Information
| ($ in millions) | As of December 31, | For the years ended December 31, | ||||||||||||||||||||||||||||||||||
| Segment | Deferred policy acquisition costs | Reserves for claims and claims expense, contract benefits and contractholder funds | Unearned premiums | Premium revenue and contract charges | Net investment income (1) | Claims and claims expense, contract benefits and interest credited to contractholders | Amortization of deferred policy acquisition costs | Other operating costs and expenses | Premiums written (excluding life) | |||||||||||||||||||||||||||
| 2017 | ||||||||||||||||||||||||||||||||||||
| Property-Liability | ||||||||||||||||||||||||||||||||||||
| Allstate Protection | $ | 1,510 | $ | 24,336 | $ | 11,409 | $ | 31,433 | $ | 21,470 | $ | 4,205 | $ | 3,647 | $ | 31,648 | ||||||||||||||||||||
| Discontinued Lines and Coverages | — | 1,893 | — | — | 96 | — | 3 | — | ||||||||||||||||||||||||||||
| Total Property-Liability | 1,510 | 26,229 | 11,409 | 31,433 | $ | 1,478 | 21,566 | 4,205 | 3,650 | 31,648 | ||||||||||||||||||||||||||
| Service Businesses (2) | 954 | 96 | 2,052 | 977 | 16 | 369 | 296 | 506 | 1,094 | |||||||||||||||||||||||||||
| Allstate Life | 1,152 | 10,244 | 4 | 1,280 | 489 | 1,047 | 134 | 240 | — | |||||||||||||||||||||||||||
| Allstate Benefits | 541 | 1,869 | 8 | 1,084 | 72 | 599 | 142 | 269 | 919 | |||||||||||||||||||||||||||
| Allstate Annuities | 34 | 19,870 | — | 14 | 1,305 | 967 | 7 | 35 | — | |||||||||||||||||||||||||||
| Corporate and Other | — | — | — | — | 41 | — | — | 631 | — | |||||||||||||||||||||||||||
| Intersegment Eliminations (2) | — | — | — | (110 | ) | — | (6 | ) | — | (104 | ) | — | ||||||||||||||||||||||||
| Total | $ | 4,191 | $ | 58,308 | $ | 13,473 | $ | 34,678 | $ | 3,401 | $ | 24,542 | $ | 4,784 | $ | 5,227 | $ | 33,661 | ||||||||||||||||||
| 2016 | ||||||||||||||||||||||||||||||||||||
| Property-Liability | ||||||||||||||||||||||||||||||||||||
| Allstate Protection | $ | 1,432 | $ | 23,263 | $ | 11,160 | $ | 30,727 | $ | 21,863 | $ | 4,053 | $ | 3,484 | $ | 30,888 | ||||||||||||||||||||
| Discontinued Lines and Coverages | — | 1,953 | — | — | 105 | — | 2 | 3 | ||||||||||||||||||||||||||||
| Total Property-Liability | 1,432 | 25,216 | 11,160 | 30,727 | $ | 1,253 | 21,968 | 4,053 | 3,486 | 30,891 | ||||||||||||||||||||||||||
| Service Businesses (2) | 756 | 34 | 1,411 | 685 | 13 | 258 | 214 | 223 | 709 | |||||||||||||||||||||||||||
| Allstate Life | 1,200 | 10,042 | 4 | 1,250 | 482 | 1,027 | 131 | 226 | — | |||||||||||||||||||||||||||
| Allstate Benefits | 526 | 1,821 | 8 | 1,011 | 71 | 545 | 145 | 240 | 855 | |||||||||||||||||||||||||||
| Allstate Annuities | 40 | 20,636 | — | 14 | 1,181 | 1,011 | 7 | 32 | — | |||||||||||||||||||||||||||
| Corporate and Other | — | — | — | — | 42 | — | — | 324 | — | |||||||||||||||||||||||||||
| Intersegment Eliminations (2) | — | — | — | (105 | ) | — | (5 | ) | — | (100 | ) | — | ||||||||||||||||||||||||
| Total | $ | 3,954 | $ | 57,749 | $ | 12,583 | $ | 33,582 | $ | 3,042 | $ | 24,804 | $ | 4,550 | $ | 4,431 | $ | 32,455 | ||||||||||||||||||
| 2015 | ||||||||||||||||||||||||||||||||||||
| Property-Liability | ||||||||||||||||||||||||||||||||||||
| Allstate Protection | $ | 1,410 | $ | 21,777 | $ | 10,979 | $ | 29,748 | $ | 20,718 | $ | 3,933 | $ | 3,476 | $ | 30,115 | ||||||||||||||||||||
| Discontinued Lines and Coverages | — | 2,062 | — | — | 53 | — | 2 | — | ||||||||||||||||||||||||||||
| Total Property-Liability | 1,410 | 23,839 | 10,979 | 29,748 | $ | 1,226 | 20,771 | 3,933 | 3,478 | 30,115 | ||||||||||||||||||||||||||
| Service Businesses (2) | 619 | 30 | 1,210 | 603 | 11 | 277 | 169 | 164 | 756 | |||||||||||||||||||||||||||
| Allstate Life | 1,271 | 9,895 | 4 | 1,223 | 490 | 1,031 | 133 | 213 | — | |||||||||||||||||||||||||||
| Allstate Benefits | 514 | 1,760 | 9 | 921 | 71 | 488 | 124 | 222 | 777 | |||||||||||||||||||||||||||
| Allstate Annuities | 47 | 21,887 | — | 14 | 1,323 | 1,045 | 5 | 37 | — | |||||||||||||||||||||||||||
| Corporate and Other | — | — | — | — | 35 | — | — | 326 | — | |||||||||||||||||||||||||||
| Intersegment Eliminations (2) | — | — | — | (42 | ) | — | (14 | ) | — | (28 | ) | — | ||||||||||||||||||||||||
| Total | $ | 3,861 | $ | 57,411 | $ | 12,202 | $ | 32,467 | $ | 3,156 | $ | 23,598 | $ | 4,364 | $ | 4,412 | $ | 31,648 |
| (1) | A single investment portfolio supports both Allstate Protection and Discontinued Lines and Coverages segments. |
| (2) | Includes intersegment premiums and service fees and the related incurred losses and expenses that are eliminated in the consolidated financial statements. |
The Allstate Corporation S-6
2017 Form 10-K
The Allstate Corporation and Subsidiaries
Schedule IV — Reinsurance
| ($ in millions) | Gross amount | Ceded to other companies (1) | Assumed from other companies | Net amount | Percentage of amount assumed to net | ||||||||||||||
| Year ended December 31, 2017 | |||||||||||||||||||
| Life insurance in force | $ | 188,186 | $ | 86,642 | $ | 259,671 | $ | 361,215 | 71.9 | % | |||||||||
| Premiums and contract charges: | |||||||||||||||||||
| Life insurance | $ | 936 | $ | 276 | $ | 787 | $ | 1,447 | 54.4 | % | |||||||||
| Accident and health insurance | 958 | 27 | — | 931 | — | % | |||||||||||||
| Property and casualty insurance | 33,221 | 971 | 50 | 32,300 | 0.2 | % | |||||||||||||
| Total premiums and contract charges | $ | 35,115 | $ | 1,274 | $ | 837 | $ | 34,678 | 2.4 | % | |||||||||
| Year ended December 31, 2016 | |||||||||||||||||||
| Life insurance in force | $ | 167,355 | $ | 90,011 | $ | 275,008 | $ | 352,352 | 78.0 | % | |||||||||
| Premiums and contract charges: | |||||||||||||||||||
| Life insurance | $ | 877 | $ | 279 | $ | 818 | $ | 1,416 | 57.8 | % | |||||||||
| Accident and health insurance | 889 | 30 | — | 859 | — | % | |||||||||||||
| Property and casualty insurance | 32,249 | 987 | 45 | 31,307 | 0.1 | % | |||||||||||||
| Total premiums and contract charges | $ | 34,015 | $ | 1,296 | $ | 863 | $ | 33,582 | 2.6 | % | |||||||||
| Year ended December 31, 2015 | |||||||||||||||||||
| Life insurance in force | $ | 156,486 | $ | 93,326 | $ | 280,644 | $ | 343,804 | 81.6 | % | |||||||||
| Premiums and contract charges: | |||||||||||||||||||
| Life insurance | $ | 828 | $ | 299 | $ | 849 | $ | 1,378 | 61.6 | % | |||||||||
| Accident and health insurance | 813 | 33 | — | 780 | — | % | |||||||||||||
| Property and casualty insurance | 31,274 | 1,006 | 41 | 30,309 | 0.1 | % | |||||||||||||
| Total premiums and contract charges | $ | 32,915 | $ | 1,338 | $ | 890 | $ | 32,467 | 2.7 | % |
| (1) | No reinsurance or coinsurance income was netted against premium ceded in 2017, 2016 or 2015. |
S-7 www.allstate.com
2017 Form 10-K
The Allstate Corporation and Subsidiaries
Schedule V — Valuation Allowances and Qualifying Accounts
| ($ in millions) | Additions | |||||||||||||||||||
| Description | Balance as of beginning of period | Charged to costs and expenses | Other additions | Deductions | Balance as of end of period | |||||||||||||||
| Year ended December 31, 2017 | ||||||||||||||||||||
| Allowance for reinsurance recoverables | $ | 84 | $ | (10 | ) | $ | — | $ | 4 | $ | 70 | |||||||||
| Allowance for premium installment receivable | 84 | 109 | — | 116 | 77 | |||||||||||||||
| Allowance for deferred tax assets | — | — | — | — | — | |||||||||||||||
| Allowance for estimated losses on mortgage loans | 3 | 1 | — | 1 | 3 | |||||||||||||||
| Year ended December 31, 2016 | ||||||||||||||||||||
| Allowance for reinsurance recoverables | $ | 80 | $ | 5 | $ | — | $ | 1 | $ | 84 | ||||||||||
| Allowance for premium installment receivable | 90 | 107 | — | 113 | 84 | |||||||||||||||
| Allowance for deferred tax assets | — | — | — | — | — | |||||||||||||||
| Allowance for estimated losses on mortgage loans | 3 | — | — | — | 3 | |||||||||||||||
| Year ended December 31, 2015 | ||||||||||||||||||||
| Allowance for reinsurance recoverables | $ | 95 | $ | (15 | ) | $ | — | $ | — | $ | 80 | |||||||||
| Allowance for premium installment receivable | 83 | 107 | — | 100 | 90 | |||||||||||||||
| Allowance for deferred tax assets | — | — | — | — | — | |||||||||||||||
| Allowance for estimated losses on mortgage loans | 8 | (4 | ) | — | 1 | 3 |
The Allstate Corporation S-8