 filings.tools
Item 7. Management’s Discussion and Analysis of Financial Condition and Results of Operations
426K characters. Original on sec.gov · Markdown
Item 7. Management’s Discussion and Analysis of Financial Condition and Results of Operations
| Page | |||
| 2019 Highlights | 34 | ||
| Property-Liability Operations | 38 | ||
| Allstate Protection | 41 | ||
| – Allstate brand | 48 | ||
| – Esurance brand | 52 | ||
| – Encompass brand | 55 | ||
| Discontinued Lines and Coverages | 58 | ||
| Service Businesses | 60 | ||
| Claims and Claims Expense Reserves | 62 | ||
| Allstate Life | 70 | ||
| Allstate Benefits | 75 | ||
| Allstate Annuities | 78 | ||
| Investments | 82 | ||
| Market Risk | 90 | ||
| Capital Resources and Liquidity | 94 | ||
| Enterprise Risk and Return Management | 101 | ||
| Application of Critical Accounting Estimates | 104 | ||
| Regulation and Legal Proceedings | 118 | ||
| Pending Accounting Standards | 118 |
The Allstate Corporation 33
2019 Form 10-K
2019 Highlights
Overview
The following discussion highlights significant factors influencing the consolidated financial position and results of operations of The Allstate Corporation (referred to in this document as “we,” “our,” “us,” the “Company” or “Allstate”). It should be read in conjunction with the consolidated financial statements and related notes found under Item 8. contained herein.
This section of this Form 10-K generally discusses 2019 and 2018 results and year-to-year comparisons between 2019 and 2018. Discussions of 2017 results and year-to-year comparisons between 2018 and 2017 that are not included in this Form 10-K can be found in Management’s Discussion and Analysis (“MD&A”) in Part II, Item 7 of our annual report on Form 10-K for 2018, filed February 15, 2019, and the Company’s Current Report on Form 8-K filed on May 16, 2019, Exhibit 99.1, reflecting the Company’s 2018 Form 10-K with adjustments to Part II. Item 6., Item 7. and Item 8. for the Company’s change in accounting principle for pension and other postretirement benefit plans.
The most important factors we monitor to evaluate the financial condition and performance for our reportable segments and the Company include:
| • | Allstate Protection: premium, policies in force (“PIF”), new business sales, policy retention, price changes, claim frequency and severity, catastrophes, loss ratio, expenses, underwriting results, and relative competitive position. |
| • | Service Businesses: revenues, premium written, PIF, adjusted net income and net income. |
| • | Allstate Life: premiums and contract charges, new business sales, PIF, benefit spread, investment spread, expenses, adjusted net income and net income. |
| • | Allstate Benefits: premiums, new business sales, PIF, benefit ratio, expenses, adjusted net income and net income. |
| • | Allstate Annuities: investment spread, asset-liability matching, contract benefits, expenses, adjusted net income, net income and invested assets. |
| • | Investments: exposure to market risk, asset allocation, credit quality/experience, total return, net investment income, cash flows, realized capital gains and losses, unrealized capital gains and losses, stability of long-term returns, and asset and liability duration. |
| • | Financial condition: liquidity, parent holding company deployable assets, financial strength ratings, operating leverage, debt levels, book value per share and return on equity. |
Measuring segment profit or loss
The measure of segment profit or loss used in evaluating performance is underwriting income for the Allstate Protection and Discontinued Lines and Coverages segments and adjusted net income for the Service Businesses, Allstate Life, Allstate Benefits, Allstate Annuities, and Corporate and Other segments.
Underwriting income is calculated as premiums earned and other revenue, less claims and claims expense (“losses”), amortization of deferred policy acquisition costs (“DAC”), operating costs and expenses, restructuring and related charges and amortization or impairment of purchased intangibles, as determined using accounting principles generally accepted in the United States of America (“GAAP”). We use this measure in our evaluation of results of operations to analyze the profitability of the Property-Liability insurance operations separately from investment results. Underwriting income is reconciled to net income applicable to common shareholders in the Property-Liability Operations section of Management’s Discussion and Analysis (“MD&A”).
Adjusted net income is net income applicable to common shareholders, excluding:
| • Realized capital gains and losses, after-tax, except for periodic settlements and accruals on non-hedge derivative instruments, which are reported with realized capital gains and losses but included in adjusted net income |
| • Pension and other postretirement remeasurement gains and losses, after-tax |
| • Valuation changes on embedded derivatives not hedged, after-tax |
| • Amortization of DAC and deferred sales inducement costs (“DSI”), to the extent they resulted from the recognition of certain realized capital gains and losses or valuation changes on embedded derivatives not hedged, after-tax |
| • Business combination expenses and the amortization or impairment of purchased intangible assets, after-tax |
| • Gain (loss) on disposition of operations, after-tax |
| • Adjustments for other significant non-recurring, infrequent or unusual items, when (a) the nature of the charge or gain is such that it is reasonably unlikely to recur within two years, or (b) there has been no similar charge or gain within the prior two years |
Adjusted net income is reconciled to net income applicable to common shareholders in the Service Businesses, Allstate Life, Allstate Benefits and Allstate Annuities Segment sections of MD&A.
2019 Form 10-K
| Allstate Delivered on 2019 Operating Priorities (1) | |||||
| Better Serve Customers | Enterprise Net Promoter Score increased with improvement at most businesses | ||||
| Grow Customer Base | Total policies in force reached 145.9 million, a 27.7% increase from prior year | ||||
| Property-Liability policies increased 1.3% from prior year to 33.7 million | |||||
| Achieve Target Returns on Capital | Strong results in Property-Liability insurance with a combined ratio of 92.0 | ||||
| 21.7% return on average common shareholders’ equity in 2019 | |||||
| Proactively Manage Investments | Net investment income of $3.2 billion in 2019 reflects higher market-based portfolio yields | ||||
| Performance-based results were below expectations, but long-term returns have been strong | |||||
| Total return of 9.2% on $88.4 billion investment portfolio in 2019 | |||||
| Build Long-Term Growth Platforms | Accelerating Transformative Growth Plan | ||||
| Arity continued to expand telematics usage and capabilities | |||||
| Expanding Allstate Identity Protection |
| (1) | 2020 operating priorities will remain consistent with the 2019 priorities. |
| Consolidated Net Income | ||||
| ($ in millions) |
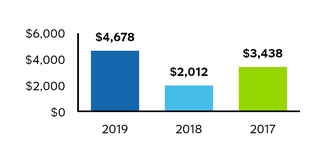
| Consolidated net income applicable to common shareholders increased $2.67 billion in 2019 compared to 2018, primarily due to net realized capital gains in 2019 compared to losses in 2018 from increased valuations on equity investments and higher underwriting income in Allstate Protection. |
| Total Revenue | ||||
| ($ in millions) |
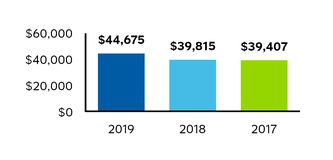
| Total revenue increased 12.2% in 2019 compared to 2018, driven by net realized capital gains in 2019 compared to losses in 2018 and a 5.7% increase in insurance premiums and contract charges. Insurance premiums increased in the following segments: Allstate Protection (Allstate and Esurance brands), Service Businesses (Allstate Protection Plans and Allstate Dealer Services), Allstate Life and Allstate Benefits. |
| Net Investment Income | ||||
| ($ in millions) |
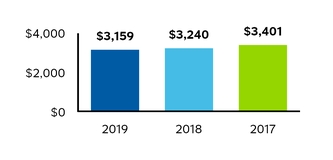
| Net investment income decreased 2.5% in 2019 compared to 2018, primarily due to lower income from performance-based investment results, partially offset by higher income from the market-based portfolio. |
The Allstate Corporation 35
2019 Form 10-K
Summarized financial results
| Years Ended December 31, | ||||||||||||
| ($ in millions) | 2019 | 2018 | 2017 | |||||||||
| Revenues | ||||||||||||
| Property and casualty insurance premiums | $ | 36,076 | $ | 34,048 | $ | 32,300 | ||||||
| Life premiums and contract charges | 2,501 | 2,465 | 2,378 | |||||||||
| Other revenue | 1,054 | 939 | 883 | |||||||||
| Net investment income | 3,159 | 3,240 | 3,401 | |||||||||
| Realized capital gains and losses | 1,885 | (877 | ) | 445 | ||||||||
| Total revenues | 44,675 | 39,815 | 39,407 | |||||||||
| Costs and expenses | ||||||||||||
| Property and casualty insurance claims and claims expense | (23,976 | ) | (22,778 | ) | (21,847 | ) | ||||||
| Life contract benefits and interest credited to contractholder funds | (2,679 | ) | (2,627 | ) | (2,613 | ) | ||||||
| Amortization of deferred policy acquisition costs | (5,533 | ) | (5,222 | ) | (4,784 | ) | ||||||
| Operating, restructuring and interest expenses | (6,058 | ) | (5,993 | ) | (5,627 | ) | ||||||
| Pension and other postretirement remeasurement gains and losses | (114 | ) | (468 | ) | 217 | |||||||
| Amortization of purchased intangibles | (126 | ) | (105 | ) | (99 | ) | ||||||
| Impairment of goodwill and purchased intangibles | (106 | ) | — | (125 | ) | |||||||
| Total costs and expenses | (38,592 | ) | (37,193 | ) | (34,878 | ) | ||||||
| Gain on disposition of operations | 6 | 6 | 20 | |||||||||
| Income tax expense | (1,242 | ) | (468 | ) | (995 | ) | ||||||
| Net income | 4,847 | 2,160 | 3,554 | |||||||||
| Preferred stock dividends | (169 | ) | (148 | ) | (116 | ) | ||||||
| Net income applicable to common shareholders | $ | 4,678 | $ | 2,012 | $ | 3,438 |
Segment Highlights
Allstate Protection underwriting income totaled $2.91 billion in 2019, a 24.3% increase from $2.34 billion in 2018, primarily due to increased premiums earned and lower catastrophe losses, partially offset by higher non-catastrophe losses and amortization of DAC.
Catastrophe losses were $2.56 billion in 2019 compared $2.86 billion in 2018.
Premiums written increased 5.6% to $35.42 billion in 2019 compared to 2018.
Service Businesses adjusted net income was $38 million in 2019 compared to $8 million in 2018. The improvement in 2019 was primarily due to growth of Allstate Protection Plans, favorable loss experience of both Allstate Protection Plans and Allstate Dealer Services, partially offset by higher operating expenses related to investing in growth and developing new products and distribution channels for Allstate Protection Plans and Allstate Identity Protection.
Total revenues increased 25.1% or $331 million to $1.65 billion in 2019 from $1.32 billion in 2018.
Allstate Life adjusted net income was $261 million in 2019 compared to $295 million in 2018. The decrease was primarily due to higher amortization of DAC related to our annual review of assumptions and higher contract benefits, partially offset by higher premiums and net investment income, and lower operating costs and expenses.
Premiums and contract charges totaled $1.34 billion in 2019, an increase of 2.1% from $1.32 billion in 2018.
Allstate Benefits adjusted net income was $115 million in 2019 compared to $124 million in 2018. The decrease was primarily due to higher DAC amortization related primarily to the non-renewal of a large underperforming account and increased operating costs and expenses, partially offset by higher premiums.
Premiums and contract charges totaled $1.15 billion in 2019, an increase of 0.9% from $1.14 billion in 2018.
Allstate Annuities adjusted net income was $10 million in 2019 compared to $131 million in 2018. The decrease was primarily due to lower net investment income, partially offset by lower interest credited to contractholder funds.
Net investment income decreased 16.3% to $917 million in 2019 from $1.10 billion in 2018. The decrease was primarily due to lower performance-based investment results, mainly from limited partnerships, and lower average investment balances.
2019 Form 10-K
Financial Highlights
Investments totaled $88.36 billion as of December 31, 2019, increasing from $81.26 billion as of December 31, 2018. Unrealized net capital gains totaled $2.74 billion as of December 31, 2019 compared to net unrealized capital gains of $33 million as of December 31, 2018.
Shareholders’ equity As of December 31, 2019, shareholders’ equity was $26.00 billion. This total included $2.30 billion in deployable assets at the parent holding company level comprising cash and investments that are generally saleable within one quarter.
Book value per diluted common share (ratio of common shareholders’ equity to total common shares outstanding and dilutive potential common shares outstanding) was $73.12 as of December 31, 2019, an increase of 27.03% from $57.56 as of December 31, 2018.
Return on average common shareholders’ equity For the twelve months ended December 31, 2019, net income applicable to common shareholders’ return on the average of beginning and ending period common shareholders’ equity of 21.7% increased by 11.7 points from 10.0% for the twelve months ended December 31, 2018, primarily due to higher net income applicable to common shareholders, partially offset by an increase in average common shareholders’ equity.
Pension and other postretirement measurement gains and losses Pension and other postretirement measurement losses were $114 million in 2019 compared to losses of $468 million in 2018. The decrease was primarily related to favorable asset performance compared to the expected return on plan assets, partially offset by a decrease in the discount rate used to value the liabilities. See Note 17 of the consolidated financial statements for further information.
The Allstate Corporation 37
2019 Form 10-K Property-Liability
Property-Liability Operations
Overview Property-Liability operations consist of two reportable segments: Allstate Protection and Discontinued Lines and Coverages. These segments are consistent with the groupings of financial information that management uses to evaluate performance and to determine the allocation of resources.
We do not allocate Property-Liability investment income, realized capital gains and losses, or assets to the Allstate Protection and Discontinued Lines and Coverages segments. Management reviews assets at the Property-Liability level for decision-making purposes.
The table below includes GAAP operating ratios we use to measure our profitability. We believe that they enhance an investor’s understanding of our profitability. They are calculated as follows:
| • | Loss ratio: the ratio of claims and claims expense to premiums earned. Loss ratios include the impact of catastrophe losses. |
| • | Expense ratio: the ratio of amortization of DAC, operating costs and expenses, amortization or impairment of purchased intangibles and restructuring and related charges, less other revenue to premiums earned. |
| • | Combined ratio: is the sum of the loss ratio and the expense ratio. The difference between 100% and the combined ratio represents underwriting income as a percentage of premiums earned, or underwriting margin. |
We have also calculated the following impacts of specific items on the GAAP operating ratios because of the volatility of these items between fiscal periods.
| • | Effect of catastrophe losses on combined ratio: the ratio of catastrophe losses included in claims and claims expense to premiums earned. This ratio includes prior year reserve reestimates of catastrophe losses. |
| • | Effect of prior year reserve reestimates on combined ratio: the ratio of prior year reserve reestimates included in claims and claims expense to premiums earned. This ratio includes prior year reserve reestimates of catastrophe losses. |
| • | Effect of amortization of purchased intangibles on combined ratio: the ratio of amortization of purchased intangibles to premiums earned. |
| • | Effect of impairment of purchased intangibles on combined ratio: the ratio of impairment of purchased intangibles to premiums earned. |
| • | Effect of restructuring and related charges on combined ratio: the ratio of restructuring and related charges to premiums earned. |
| • | Effect of Discontinued Lines and Coverages on combined ratio: the ratio of claims and claims expense and operating costs and expenses in the Discontinued Lines and Coverages segment to Property-Liability premiums earned. The sum of the effect of Discontinued Lines and Coverages on the combined ratio and the Allstate Protection combined ratio is equal to the Property-Liability combined ratio. |
Property-Liability 2019 Form 10-K
| Summarized financial data | ||||||||||||
| ($ in millions, except ratios) | 2019 | 2018 | 2017 | |||||||||
| Premiums written | $ | 35,419 | $ | 33,555 | $ | 31,648 | ||||||
| Revenues | ||||||||||||
| Premiums earned | $ | 34,843 | $ | 32,950 | $ | 31,433 | ||||||
| Other revenue | 741 | 738 | 703 | |||||||||
| Net investment income | 1,533 | 1,464 | 1,478 | |||||||||
| Realized capital gains and losses | 1,470 | (639 | ) | 401 | ||||||||
| Total revenues | 38,587 | 34,513 | 34,015 | |||||||||
| Costs and expenses | ||||||||||||
| Claims and claims expense | (23,622 | ) | (22,435 | ) | (21,484 | ) | ||||||
| Amortization of DAC | (4,649 | ) | (4,475 | ) | (4,205 | ) | ||||||
| Operating costs and expenses | (4,420 | ) | (4,465 | ) | (4,164 | ) | ||||||
| Restructuring and related charges | (38 | ) | (60 | ) | (78 | ) | ||||||
| Impairment of purchased intangibles (1) | (51 | ) | — | — | ||||||||
| Total costs and expenses | (32,780 | ) | (31,435 | ) | (29,931 | ) | ||||||
| Gain on disposition of operations | — | — | 14 | |||||||||
| Income tax expense | (1,196 | ) | (613 | ) | (1,285 | ) | ||||||
| Net income applicable to common shareholders | $ | 4,611 | $ | 2,465 | $ | 2,813 | ||||||
| Underwriting income | $ | 2,804 | $ | 2,253 | $ | 2,205 | ||||||
| Net investment income | 1,533 | 1,464 | 1,478 | |||||||||
| Income tax expense on operations | (887 | ) | (747 | ) | (1,187 | ) | ||||||
| Realized capital gains and losses, after-tax | 1,161 | (500 | ) | 272 | ||||||||
| Gain on disposition of operations, after-tax | — | — | 9 | |||||||||
| Tax Legislation (expense) benefit | — | (5 | ) | 36 | ||||||||
| Net income applicable to common shareholders | $ | 4,611 | $ | 2,465 | $ | 2,813 | ||||||
| Catastrophe losses | ||||||||||||
| Catastrophe losses, excluding reserve reestimates | $ | 2,509 | $ | 2,830 | $ | 3,246 | ||||||
| Catastrophe reserve reestimates (2) | 48 | 25 | (18 | ) | ||||||||
| Total catastrophe losses | $ | 2,557 | $ | 2,855 | $ | 3,228 | ||||||
| Non-catastrophe reserve reestimates (2) | (176 | ) | (278 | ) | (487 | ) | ||||||
| Prior year reserve reestimates (2) | (128 | ) | (253 | ) | (505 | ) | ||||||
| GAAP operating ratios | ||||||||||||
| Loss ratio | 67.8 | 68.1 | 68.4 | |||||||||
| Expense ratio (3) | 24.2 | 25.1 | 24.6 | |||||||||
| Combined ratio | 92.0 | 93.2 | 93.0 | |||||||||
| Effect of catastrophe losses on combined ratio | 7.3 | 8.7 | 10.3 | |||||||||
| Effect of prior year reserve reestimates on combined ratio | (0.3 | ) | (0.7 | ) | (1.6 | ) | ||||||
| Effect of catastrophe losses included in prior year reserve reestimates on combined ratio | 0.1 | 0.1 | (0.1 | ) | ||||||||
| Effect of restructuring and related charges on combined ratio | 0.1 | 0.2 | 0.2 | |||||||||
| Effect of impairment of purchased intangibles (1) | 0.1 | — | — | |||||||||
| Effect of Discontinued Lines and Coverages on combined ratio | 0.4 | 0.3 | 0.3 |
| (1) | Our Transformative Growth Plan included a decision to reposition the Allstate brand for broader customer access, resulting in a $51 million impairment for the Esurance brand trade name. See the Esurance section of this Item for further details. |
| (2) | Favorable reserve reestimates are shown in parentheses. |
| (3) | Other revenue is deducted from operating costs and expenses in the expense ratio calculation. |
The Allstate Corporation 39
2019 Form 10-K Property-Liability
Net investment income increased 4.7% or $69 million in 2019 compared to 2018, due to higher income from market-based portfolios, partially offset by lower performance-based investment results, mainly from limited partnerships. 2019 performance-based investment results included lower valuations in the fourth quarter, on two private equity investments totaling $37 million. We increased the maturity profile of fixed income securities in our Property-Liability portfolio to a duration of 5.2 years as of December 31, 2019 compared to 4.1 years as of December 31, 2018.
| Net investment income | ||||||||||||
| For the years ended December 31, | ||||||||||||
| ($ in millions) | 2019 | 2018 | 2017 | |||||||||
| Fixed income securities | $ | 1,066 | $ | 943 | $ | 909 | ||||||
| Equity securities | 155 | 121 | 122 | |||||||||
| Mortgage loans | 17 | 17 | 12 | |||||||||
| Limited partnership interests | 296 | 378 | 432 | |||||||||
| Short-term investments | 56 | 40 | 17 | |||||||||
| Other | 107 | 123 | 100 | |||||||||
| Investment income, before expense | 1,697 | 1,622 | 1,592 | |||||||||
| Investment expense (1) (2) | (164 | ) | (158 | ) | (114 | ) | ||||||
| Net investment income | $ | 1,533 | $ | 1,464 | $ | 1,478 |
| (1) | Investment expense includes $51 million and $45 million of investee level expenses in 2019 and 2018, respectively. Investee level expenses include depreciation and asset level operating expenses on directly held real estate and other consolidated investments. |
| (2) | Investment expense includes $27 million and $18 million related to the portion of reinvestment income on securities lending collateral paid to the counterparties in 2019 and 2018, respectively. |
Realized capital gains and losses Net realized capital gains in 2019, primarily related to increased valuation of equity investments and gains on sales of fixed income securities. Valuation of equity investments for 2019 includes $883 million of appreciation in the valuation of equity securities and $141 million of appreciation primarily related to certain limited partnerships where the underlying assets are predominately public equity securities. Net realized capital losses in 2018, primarily related to decreases in the valuation of equity investments and losses on sales of fixed income securities.
| Realized capital gains and losses | ||||||||||||
| For the years ended December 31, | ||||||||||||
| ($ in millions) | 2019 | 2018 | 2017 | |||||||||
| Impairment write-downs | $ | (26 | ) | $ | (5 | ) | $ | (56 | ) | |||
| Change in intent write-downs | — | — | (44 | ) | ||||||||
| Net OTTI losses recognized in earnings | (26 | ) | (5 | ) | (100 | ) | ||||||
| Sales | 498 | (148 | ) | 531 | ||||||||
| Valuation of equity investments | 1,024 | (522 | ) | — | ||||||||
| Valuation and settlements of derivative instruments | (26 | ) | 36 | (30 | ) | |||||||
| Realized capital gains and losses, pre-tax | 1,470 | (639 | ) | 401 | ||||||||
| Income tax (expense) benefit | (309 | ) | 139 | (129 | ) | |||||||
| Realized capital gains and losses, after-tax | $ | 1,161 | $ | (500 | ) | $ | 272 |
Beginning January 1, 2018, equity securities are reported at fair value with changes in fair value recognized in realized capital gains and losses. Limited partnerships previously reported using the cost method are reported at fair value with changes in fair value recognized in net investment income. As a result, 2017 net investment income and net realized capital gains and losses are not comparable to other periods presented.
Allstate Protection 2019 Form 10-K
Allstate Protection Segment
Private passenger auto, homeowners, and other personal lines insurance products are offered to consumers through agencies and directly through contact centers and online. Our strategy is to position product offerings and distribution channels to meet customers’ needs and protect them from life’s uncertainties. For additional information on our strategy and outlook, see Part I, Item 1. Business - Strategy and Segment Information.
| Underwriting results | ||||||||||||
| For the years ended December 31, | ||||||||||||
| ($ in millions) | 2019 | 2018 | 2017 | |||||||||
| Premiums written | $ | 35,419 | $ | 33,555 | $ | 31,648 | ||||||
| Premiums earned | $ | 34,843 | $ | 32,950 | $ | 31,433 | ||||||
| Other revenue | 741 | 738 | 703 | |||||||||
| Claims and claims expense | (23,517 | ) | (22,348 | ) | (21,388 | ) | ||||||
| Amortization of DAC | (4,649 | ) | (4,475 | ) | (4,205 | ) | ||||||
| Other costs and expenses | (4,417 | ) | (4,462 | ) | (4,161 | ) | ||||||
| Restructuring and related charges | (38 | ) | (60 | ) | (78 | ) | ||||||
| Impairment of purchased intangibles | (51 | ) | — | — | ||||||||
| Underwriting income | $ | 2,912 | $ | 2,343 | $ | 2,304 | ||||||
| Catastrophe losses | $ | 2,557 | $ | 2,855 | $ | 3,228 | ||||||
| Underwriting income (loss) by line of business | ||||||||||||
| Auto | $ | 1,688 | $ | 1,791 | $ | 1,437 | ||||||
| Homeowners | 914 | 483 | 689 | |||||||||
| Other personal lines (1) | 224 | 110 | 141 | |||||||||
| Commercial lines | 14 | (83 | ) | (13 | ) | |||||||
| Other business lines (2) | 75 | 49 | 51 | |||||||||
| Answer Financial | (3 | ) | (7 | ) | (1 | ) | ||||||
| Underwriting income | $ | 2,912 | $ | 2,343 | $ | 2,304 |
| (1) | Other personal lines include renters, condominium, landlord and other personal lines products. |
| (2) | Other business lines primarily represent Ivantage, a general agency for Allstate exclusive agencies. Ivantage provides agencies a solution for their customers when coverage through Allstate brand underwritten products is not available. |
The Allstate Corporation 41
2019 Form 10-K Allstate Protection
| Changes in underwriting results from prior year by component and by line of business (1) | ||||||||||||||||||||||||||||||||||||||||
| For the year ended December 31, | ||||||||||||||||||||||||||||||||||||||||
| Auto | Homeowners | Other personal lines | Commercial lines | Allstate Protection (2) | ||||||||||||||||||||||||||||||||||||
| ($ in millions) | 2019 | 2018 | 2019 | 2018 | 2019 | 2018 | 2019 | 2018 | 2019 | 2018 | ||||||||||||||||||||||||||||||
| Underwriting income (loss) - prior year | $ | 1,791 | $ | 1,437 | $ | 483 | $ | 689 | $ | 110 | $ | 141 | $ | (83 | ) | $ | (13 | ) | $ | 2,343 | $ | 2,304 | ||||||||||||||||||
| Changes in underwriting income (loss) from: | ||||||||||||||||||||||||||||||||||||||||
| Increase (decrease) premiums earned | 1,218 | 1,092 | 395 | 207 | 53 | 58 | 227 | 160 | 1,893 | 1,517 | ||||||||||||||||||||||||||||||
| Increase (decrease) other revenue | 1 | 30 | — | 3 | (1 | ) | 4 | — | (2 | ) | 3 | 35 | ||||||||||||||||||||||||||||
| (Increase) decrease incurred claims and claims expense (“losses”): | ||||||||||||||||||||||||||||||||||||||||
| Incurred losses, excluding catastrophe losses and reserve reestimates | (1,002 | ) | (642 | ) | (183 | ) | (263 | ) | 21 | (72 | ) | (219 | ) | (138 | ) | (1,383 | ) | (1,115 | ) | |||||||||||||||||||||
| Catastrophe losses, excluding reserve reestimates | (33 | ) | 336 | 294 | 92 | 51 | (13 | ) | 9 | 1 | 321 | 416 | ||||||||||||||||||||||||||||
| Catastrophe reserve reestimates | (22 | ) | 24 | (1 | ) | (72 | ) | (1 | ) | 4 | 1 | 1 | (23 | ) | (43 | ) | ||||||||||||||||||||||||
| Non-catastrophe reserve reestimates | (110 | ) | (59 | ) | (50 | ) | (73 | ) | (14 | ) | 4 | 90 | (90 | ) | (84 | ) | (218 | ) | ||||||||||||||||||||||
| Losses subtotal | (1,167 | ) | (341 | ) | 60 | (316 | ) | 57 | (77 | ) | (119 | ) | (226 | ) | (1,169 | ) | (960 | ) | ||||||||||||||||||||||
| (Increase) decrease expenses | (155 | ) | (427 | ) | (24 | ) | (100 | ) | 5 | (16 | ) | (11 | ) | (2 | ) | (158 | ) | (553 | ) | |||||||||||||||||||||
| Underwriting income (loss) | $ | 1,688 | $ | 1,791 | $ | 914 | $ | 483 | $ | 224 | $ | 110 | $ | 14 | $ | (83 | ) | $ | 2,912 | $ | 2,343 |
| (1) | The 2019 column presents changes in 2019 compared to 2018. The 2018 column presents changes in 2018 compared to 2017. |
| (2) | Includes other business lines underwriting income of $75 million and $49 million in 2019 and 2018, respectively, and Answer Financial underwriting loss of $3 million and $7 million in 2019 and 2018, respectively. |
Underwriting income increased 24.3% or $569 million in 2019 compared to 2018, primarily due to increased premiums earned and lower catastrophe losses, partially offset by higher non-catastrophe losses and amortization of DAC.
Allstate Protection 2019 Form 10-K
Premiums written is the amount of premiums charged for policies issued during a fiscal period. Premiums are considered earned and are included in the financial results on a pro-rata basis over the policy period. The portion of premiums written applicable to the unexpired term of the policies is recorded as unearned premiums on our Consolidated Statements of Financial Position.
| Premiums written and earned by line of business | ||||||||||||
| For the years ended December 31, | ||||||||||||
| ($ in millions) | 2019 | 2018 | 2017 | |||||||||
| Premiums written | ||||||||||||
| Auto | $ | 24,462 | $ | 23,367 | $ | 22,042 | ||||||
| Homeowners | 8,165 | 7,698 | 7,350 | |||||||||
| Other personal lines | 1,890 | 1,831 | 1,768 | |||||||||
| Subtotal – Personal lines | 34,517 | 32,896 | 31,160 | |||||||||
| Commercial lines | 902 | 659 | 488 | |||||||||
| Total premiums written | $ | 35,419 | $ | 33,555 | $ | 31,648 | ||||||
| Reconciliation of premiums written to premiums earned: | ||||||||||||
| Increase in unearned premiums | (614 | ) | (544 | ) | (258 | ) | ||||||
| Other | 38 | (61 | ) | 43 | ||||||||
| Total premiums earned | $ | 34,843 | $ | 32,950 | $ | 31,433 | ||||||
| Auto | $ | 24,188 | $ | 22,970 | $ | 21,878 | ||||||
| Homeowners | 7,912 | 7,517 | 7,310 | |||||||||
| Other personal lines | 1,861 | 1,808 | 1,750 | |||||||||
| Subtotal – Personal lines | 33,961 | 32,295 | 30,938 | |||||||||
| Commercial lines | 882 | 655 | 495 | |||||||||
| Total premiums earned | $ | 34,843 | $ | 32,950 | $ | 31,433 |
Auto insurance premiums written increased 4.7% or $1.10 billion in 2019 compared to 2018.
Homeowners insurance premiums written increased 6.1% or $467 million in 2019 compared to 2018.
| Unearned premium balance and the time frame in which we expect to recognize these premiums as earned | ||||||||||||||||||||
| ($ in millions) | As of December 31, | % earned after | ||||||||||||||||||
| 2019 | 2018 | Three months | Six months | Nine months | Twelve months | |||||||||||||||
| Allstate brand: | ||||||||||||||||||||
| Auto | $ | 5,916 | $ | 5,635 | 70.9 | % | 96.4 | % | 99.1 | % | 100.0 | % | ||||||||
| Homeowners | 4,158 | 3,908 | 43.3 | % | 75.5 | % | 94.2 | % | 100.0 | % | ||||||||||
| Other personal lines | 950 | 917 | 43.5 | % | 75.5 | % | 94.1 | % | 100.0 | % | ||||||||||
| Commercial lines | 270 | 250 | 43.4 | % | 74.7 | % | 93.7 | % | 100.0 | % | ||||||||||
| Total Allstate brand | 11,294 | 10,710 | 58.0 | % | 86.6 | % | 96.8 | % | 100.0 | % | ||||||||||
| Esurance brand: | ||||||||||||||||||||
| Auto | 489 | 471 | 74.4 | % | 99.1 | % | 99.8 | % | 100.0 | % | ||||||||||
| Homeowners | 62 | 53 | 43.4 | % | 75.6 | % | 94.2 | % | 100.0 | % | ||||||||||
| Other personal lines | 2 | 2 | 43.6 | % | 75.5 | % | 94.2 | % | 100.0 | % | ||||||||||
| Total Esurance brand | 553 | 526 | 70.8 | % | 96.3 | % | 99.1 | % | 100.0 | % | ||||||||||
| Encompass brand: | ||||||||||||||||||||
| Auto | 276 | 275 | 44.1 | % | 75.9 | % | 94.3 | % | 100.0 | % | ||||||||||
| Homeowners | 214 | 212 | 43.9 | % | 75.8 | % | 94.3 | % | 100.0 | % | ||||||||||
| Other personal lines | 41 | 42 | 44.2 | % | 76.0 | % | 94.3 | % | 100.0 | % | ||||||||||
| Total Encompass brand | 531 | 529 | 44.0 | % | 75.9 | % | 94.3 | % | 100.0 | % | ||||||||||
| Allstate Protection unearned premiums | $ | 12,378 | $ | 11,765 | 57.9 | % | 86.5 | % | 96.8 | % | 100.0 | % |
The Allstate Corporation 43
2019 Form 10-K Allstate Protection
| Combined ratios by line of business | |||||||||||||||||||||||||||
| For the years ended December 31, | |||||||||||||||||||||||||||
| Loss ratio | Expense ratio (1) | Combined ratio | |||||||||||||||||||||||||
| 2019 | 2018 | 2017 | 2019 | 2018 | 2017 | 2019 | 2018 | 2017 | |||||||||||||||||||
| Auto | 68.2 | 66.8 | 68.5 | 24.8 | 25.4 | 24.9 | 93.0 | 92.2 | 93.4 | ||||||||||||||||||
| Homeowners | 65.1 | 69.4 | 67.0 | 23.3 | 24.2 | 23.6 | 88.4 | 93.6 | 90.6 | ||||||||||||||||||
| Other personal lines | 61.1 | 66.0 | 63.8 | 26.9 | 27.9 | 28.1 | 88.0 | 93.9 | 91.9 | ||||||||||||||||||
| Commercial lines | 81.3 | 91.3 | 75.1 | 17.1 | 21.4 | 27.5 | 98.4 | 112.7 | 102.6 | ||||||||||||||||||
| Total | 67.5 | 67.8 | 68.1 | 24.1 | 25.1 | 24.6 | 91.6 | 92.9 | 92.7 |
| (1) | Other revenue is deducted from operating costs and expenses in the expense ratio calculation. |
| Loss ratios by line of business | ||||||||||||||||||||||||||||||||||||
| For the years ended December 31, | ||||||||||||||||||||||||||||||||||||
| Loss ratio | Effect of catastrophe losses on combined ratio | Effect of prior year reserve reestimates on combined ratio | Effect of catastrophe losses included in prior year reserve reestimates on combined ratio | |||||||||||||||||||||||||||||||||
| 2019 | 2018 | 2017 | 2019 | 2018 | 2017 | 2019 | 2018 | 2017 | 2019 | 2018 | 2017 | |||||||||||||||||||||||||
| Auto | 68.2 | 66.8 | 68.5 | 1.7 | 1.6 | 3.3 | (1.4 | ) | (2.0 | ) | (2.3 | ) | (0.1 | ) | (0.2 | ) | (0.1 | ) | ||||||||||||||||||
| Homeowners | 65.1 | 69.4 | 67.0 | 24.8 | 30.0 | 31.1 | 0.8 | 0.2 | (1.7 | ) | 0.8 | 0.8 | (0.1 | ) | ||||||||||||||||||||||
| Other personal lines | 61.1 | 66.0 | 63.8 | 9.0 | 12.1 | 11.9 | 0.5 | (0.4 | ) | 0.1 | — | — | 0.2 | |||||||||||||||||||||||
| Commercial lines | 81.3 | 91.3 | 75.1 | 1.4 | 3.4 | 4.8 | 1.9 | 16.5 | 3.9 | (0.1 | ) | — | 0.2 | |||||||||||||||||||||||
| Total | 67.5 | 67.8 | 68.1 | 7.3 | 8.7 | 10.3 | (0.7 | ) | (1.0 | ) | (1.9 | ) | 0.1 | 0.1 | (0.1 | ) |
Catastrophe losses decreased 10.4% or $298 million in 2019 compared to 2018. We define a “catastrophe” as an event that produces pre-tax losses before reinsurance in excess of $1 million and involves multiple first party policyholders, or a winter weather event that produces a number of claims in excess of a preset, per-event threshold of average claims in a specific area, occurring within a certain amount of time following the event. Catastrophes are caused by various natural events including high winds, winter storms and freezes, tornadoes, hailstorms, wildfires, tropical storms, tsunamis, hurricanes, earthquakes and volcanoes. We are also exposed to man-made catastrophic events, such as certain types of terrorism, wildfires or industrial accidents. The nature and level of catastrophes in any period cannot be reliably predicted.
| Catastrophe losses in 2019 by the size of event | ||||||||||||||||||||
| ($ in millions) | Number of events | Claims and claims expense | Combined ratio impact | Average catastrophe loss per event | ||||||||||||||||
| Size of catastrophe loss | ||||||||||||||||||||
| Greater than $250 million | 1 | 1.0 | % | $ | 362 | 14.1 | % | 1.0 | $ | 362 | ||||||||||
| $101 million to $250 million | 2 | 1.8 | 342 | 13.4 | 1.0 | 171 | ||||||||||||||
| $50 million to $100 million | 9 | 8.2 | 662 | 25.9 | 1.9 | 74 | ||||||||||||||
| Less than $50 million | 98 | 89.0 | 1,143 | 44.7 | 3.3 | 12 | ||||||||||||||
| Total | 110 | 100.0 | % | 2,509 | 98.1 | 7.2 | 23 | |||||||||||||
| Prior year reserve reestimates | 48 | 1.9 | 0.1 | |||||||||||||||||
| Total catastrophe losses | $ | 2,557 | 100.0 | % | 7.3 |
| Catastrophe losses by the type of event | |||||||||||||||||||||
| For the years ended December 31, | |||||||||||||||||||||
| ($ in millions) | Number of events | 2019 | Number of events | 2018 | Number of events | 2017 | |||||||||||||||
| Hurricanes/Tropical storms | 3 | $ | 86 | 3 | $ | 200 | 3 | $ | 613 | ||||||||||||
| Tornadoes | 6 | 551 | 3 | 17 | 3 | 100 | |||||||||||||||
| Wind/Hail | 91 | 1,721 | 99 | 1,752 | 93 | 1,973 | |||||||||||||||
| Wildfires | 4 | 28 | 10 | 745 | 10 | 536 | |||||||||||||||
| Other events | 6 | 123 | 2 | 116 | 2 | 24 | |||||||||||||||
| Prior year reserve reestimates | 48 | 25 | (18 | ) | |||||||||||||||||
| Total catastrophe losses | 110 | $ | 2,557 | 117 | $ | 2,855 | 111 | $ | 3,228 |
Allstate Protection 2019 Form 10-K
Catastrophe management
Historical catastrophe experience For the last ten years, the average annual impact of catastrophes on our loss ratio was 8.3 points, but it has varied from 4.5 points to 14.7 points. The average annual impact of catastrophes on the homeowners loss ratio for the last ten years was 26.8 points. Over time, we have limited our aggregate insurance exposure to catastrophe losses in certain regions of the country that are subject to high levels of natural catastrophes by our participation in various state facilities. For further discussion of these facilities, see Note 14 of the consolidated financial statements. However, the impact of these actions may be diminished by the growth in insured values, and the effect of state insurance laws and regulations. In addition, in various states we are required to participate in assigned risk plans, reinsurance facilities and joint underwriting associations that provide insurance coverage to individuals or entities that otherwise are unable to purchase such coverage from private insurers. Because of our participation in these and other state facilities such as wind pools, we may be exposed to losses that surpass the capitalization of these facilities and to assessments from these facilities.
We have continued to take actions to maintain an appropriate level of exposure to catastrophic events while continuing to meet the needs of our customers, including the following:
| • | Continuing to limit or not offer new homeowners, manufactured home and landlord package policy business in certain coastal geographies. |
| • | Increased capacity in our brokerage platform for customers not offered an Allstate policy. |
| • | We began to write a limited number of homeowners policies in select areas of California in 2016, additionally we: |
| – | Continue to renew current policyholders and allow replacement policies for existing customers who buy a new home or change their residence to rental property |
| – | Have decreased our overall homeowner exposures in California by more than 50% since 2007 |
| – | Write homeowners coverage through our excess and surplus lines carrier, North Light Specialty Insurance Company (“North Light”), which includes earthquake coverage (other than fire following earthquakes) that is currently ceded via quota share reinsurance. |
| • | In certain states, we have been ceding wind exposure related to insured property located in wind pool eligible areas. |
| • | Starting in the second quarter of 2017, we began writing a limited number of homeowners policies in select areas of Florida and continue to support existing customers who replace their currently-insured home with an acceptable property. Encompass withdrew from property lines in Florida in 2009. |
| • | Tropical cyclone deductibles are generally higher than all peril deductibles and are in place for a large portion of coastal insured properties. |
| • | Auto comprehensive damage coverage generally includes coverage for flood-related loss. We have additional catastrophe exposure, beyond the property lines, for auto customers who have purchased comprehensive damage coverage. |
| • | We offer a homeowners policy available in 43 states, Allstate House and Home®, that provides options of coverage for roof damage, including graduated coverage and pricing based on roof type and age. In 2019, premiums written totaled $3.44 billion or 42.1% of homeowners premiums written compared to $2.84 billion or 36.9% in 2018. |
Hurricanes We consider the greatest areas of potential catastrophe losses due to hurricanes generally to be major metropolitan centers in counties along the eastern and gulf coasts of the United States. The average premium on a property policy near these coasts is generally greater than in other areas. However, average premiums are often not considered commensurate with the inherent risk of loss. In addition, as explained in Note 14 of the consolidated financial statements, in various states Allstate is subject to assessments from assigned risk plans, reinsurance facilities and joint underwriting associations providing insurance for wind related property losses.
We have addressed our risk of hurricane loss by, among other actions, purchasing reinsurance for specific states and on a countrywide basis for our personal lines property insurance in areas most exposed to hurricanes, limiting personal homeowners, landlord package policy and manufactured home new business writings in coastal areas in southern and eastern states, implementing tropical cyclone deductibles where appropriate, and not offering continuing coverage on certain policies in coastal counties in certain states. We continue to seek appropriate returns for the risks we write. This may require further actions, similar to those already taken, in geographies where we are not getting appropriate returns. However, we may maintain or opportunistically increase our presence in areas where adequate risk adjusted returns can be achieved.
Earthquakes We do not offer earthquake coverage in most states. We retain approximately 22,000 PIF with earthquake coverage, primarily in Kentucky, due to regulatory and other reasons. We purchase reinsurance in Kentucky and enter into arrangements in many states to make earthquake coverage available through our brokerage platform.
We continue to have exposure to earthquake risk on certain policies that do not specifically exclude coverage for earthquake losses, including our auto policies, and to fires following earthquakes. Allstate policyholders in California are offered homeowners coverage through the California Earthquake Authority (“CEA”), a privately-financed, publicly-managed state agency created to provide insurance coverage for earthquake damage. Allstate is subject to
The Allstate Corporation 45
2019 Form 10-K Allstate Protection
assessments from the CEA under certain circumstances as explained in Note 14 of the consolidated financial statements. While North Light writes property policies in California, which can include earthquake coverage, this coverage is 100% ceded via quota share reinsurance.
Fires following earthquakes Under a standard homeowners policy we cover fire losses, including those caused by an earthquake. Actions taken related to our risk of loss from fires following earthquakes include restrictive underwriting guidelines in California for new business writings, purchasing reinsurance for Kentucky personal lines property risks, and purchasing nationwide occurrence reinsurance, excluding Florida.
Wildfires Actions taken related to managing our risk of loss from wildfires include purchasing nationwide occurrence reinsurance, new and renewal inspection programs to identify and remediate wildfire risk as well as leveraging contemporary underwriting tools in select areas. While these programs are designed to mitigate risk, the exposure to wildfires still exists. We continue to manage our exposure and seek appropriate returns for the risks we write.
To manage the exposure, this may require further actions, similar to those already taken, in geographies where we are not achieving appropriate returns. However, we may maintain or opportunistically increase our presence in areas where adequate risk adjusted returns can be achieved.
Reinsurance A description of our current catastrophe reinsurance program appears in Note 10 of the consolidated financial statements.
California wildfire subrogation PG&E Corporation and Pacific Gas and Electric Company (together, "PG&E") have reached agreements to resolve insurance subrogation and tort claimants’ claims arising from the 2017 Northern California wildfires and the 2018 Camp Fire for $11 billion and $13.5 billion, respectively. Allstate is one of the insurance companies that is party to the agreement with subrogating insurers. PG&E has also reached agreement to settle claims of its bondholders.
The settlements with insurers and tort claimants have been approved by the bankruptcy court overseeing PG&E's Chapter 11 case. The settlement with the bondholders has not yet been approved. All will be subject to confirmation of a Plan of Reorganization, which has not yet occurred. There remain other uncertainties with respect to the ultimate resolution of all claims, including the allocation of benefits among claimants and the amount of recovery, if any, that we may receive. Accordingly, we have not recorded any benefit related to the potential proceeds from the subrogation settlement agreement in the consolidated financial statements. We will continue to monitor this matter.
Expense ratio decreased 1.0 point in 2019 compared to 2018.
| Impact of specific costs and expenses on the expense ratio | |||||||||
| For the years ended December 31, | |||||||||
| 2019 | 2018 | 2017 | |||||||
| Amortization of DAC | 13.4 | 13.6 | 13.4 | ||||||
| Advertising expense | 2.4 | 2.5 | 2.2 | ||||||
| Other costs and expenses | 8.1 | 8.8 | 8.8 | ||||||
| Restructuring and related charges | 0.1 | 0.2 | 0.2 | ||||||
| Impairment of purchased intangibles | 0.1 | — | — | ||||||
| Total expense ratio | 24.1 | 25.1 | 24.6 |
Deferred acquisition costs We establish a DAC asset for costs that are related directly to the successful acquisition of new or renewal insurance policies, principally agency remuneration and premium taxes. DAC is amortized to income over the period in which premiums are earned.
| DAC balance as of December 31 by product type | ||||||||
| ($ in millions) | 2019 | 2018 | ||||||
| Auto | $ | 849 | $ | 845 | ||||
| Homeowners | 600 | 599 | ||||||
| Other personal lines | 141 | 141 | ||||||
| Commercial lines | 34 | 33 | ||||||
| Total DAC | $ | 1,624 | $ | 1,618 |
Allstate Protection 2019 Form 10-K
The following table presents premiums written, PIF and underwriting income (loss) by line of business for Allstate brand, Esurance brand, Encompass brand and Allstate Protection as of or for the year ended December 31, 2019. Detailed analysis of underwriting results, premiums written and earned, and the combined ratios, including loss and expense ratios, are discussed in the brand sections.
| Premiums written, policies in force and underwriting income (loss) | |||||||||||||||||||||||||||||
| ($ in millions) | Allstate brand | Esurance brand | Encompass brand | Allstate Protection | |||||||||||||||||||||||||
| Premiums written | Amount | Percent to total brand | Amount | Percent to total brand | Amount | Percent to total brand | Amount | Percent to total | |||||||||||||||||||||
| Auto | $ | 21,936 | 67.9 | % | $ | 1,986 | 94.0 | % | $ | 540 | 52.9 | % | $ | 24,462 | 69.1 | % | |||||||||||||
| Homeowners | 7,645 | 23.7 | 119 | 5.6 | 401 | 39.3 | 8,165 | 23.1 | |||||||||||||||||||||
| Other personal lines | 1,803 | 5.6 | 8 | 0.4 | 79 | 7.8 | 1,890 | 5.3 | |||||||||||||||||||||
| Commercial lines | 902 | 2.8 | — | — | — | — | 902 | 2.5 | |||||||||||||||||||||
| Total | $ | 32,286 | 100.0 | % | $ | 2,113 | 100.0 | % | $ | 1,020 | 100.0 | % | $ | 35,419 | 100.0 | % | |||||||||||||
| Percent to total Allstate Protection | 91.1 | % | 6.0 | % | 2.9 | % | 100.0 | % | |||||||||||||||||||||
| PIF (thousands) | |||||||||||||||||||||||||||||
| Auto | 20,398 | 65.4 | % | 1,515 | 90.9 | % | 493 | 61.4 | % | 22,406 | 66.5 | % | |||||||||||||||||
| Homeowners | 6,254 | 20.0 | 105 | 6.3 | 234 | 29.1 | 6,593 | 19.6 | |||||||||||||||||||||
| Other personal lines | 4,344 | 13.9 | 46 | 2.8 | 76 | 9.5 | 4,466 | 13.2 | |||||||||||||||||||||
| Commercial lines | 227 | 0.7 | — | — | — | — | 227 | 0.7 | |||||||||||||||||||||
| Total | 31,223 | 100.0 | % | 1,666 | 100.0 | % | 803 | 100.0 | % | 33,692 | 100.0 | % | |||||||||||||||||
| Percent to total Allstate Protection | 92.7 | % | 4.9 | % | 2.4 | % | 100.0 | % | |||||||||||||||||||||
| Underwriting income (loss) | |||||||||||||||||||||||||||||
| Auto | $ | 1,727 | 58.5 | % | $ | (47 | ) | (1 | ) | 109.4 | % | $ | 8 | 114.3 | % | $ | 1,688 | 58.0 | % | ||||||||||
| Homeowners | 910 | 30.9 | 2 | (4.7 | ) | 2 | 28.6 | 914 | 31.4 | ||||||||||||||||||||
| Other personal lines | 225 | 7.6 | 2 | (4.7 | ) | (3 | ) | (42.9 | ) | 224 | 7.6 | ||||||||||||||||||
| Commercial lines | 14 | 0.5 | — | — | — | — | 14 | 0.5 | |||||||||||||||||||||
| Other business lines | 75 | 2.5 | — | — | — | — | 75 | 2.6 | |||||||||||||||||||||
| Answer Financial | — | — | — | — | — | — | (3 | ) | (0.1 | ) | |||||||||||||||||||
| Total | $ | 2,951 | 100.0 | % | $ | (43 | ) | 100.0 | % | $ | 7 | 100.0 | % | $ | 2,912 | 100.0 | % |
| (1) | Our Transformative Growth Plan included a decision to reposition the Allstate brand for broader customer access, resulting in a $51 million impairment for the Esurance brand trade name. See the Esurance section of this Item for further details. |
When analyzing premium measures and statistics for all three brands the following calculations are used as described below.
| • | PIF: Policy counts are based on items rather than customers. A multi-car customer would generate multiple item (policy) counts, even if all cars were insured under one policy while Commercial lines PIF counts for shared economy agreements typically reflect contracts that cover multiple rather than individual drivers. |
| • | New issued applications: Item counts of automobile or homeowner insurance applications for insurance policies that were issued during the period, regardless of whether the customer was previously insured by another Allstate Protection brand. Allstate brand includes automobiles added by existing customers when they exceed the number allowed (currently 10) on a policy. |
| • | Average premium-gross written (“average premium”): Gross premiums written divided by issued item count. Gross premiums written include the impacts from discounts, surcharges and ceded reinsurance premiums and exclude the impacts from mid-term premium adjustments and premium refund accruals. Average premiums represent the appropriate policy term for each line. Allstate and Esurance brand policy terms are 6 |
months for auto and 12 months for homeowners. Encompass brand policy terms are generally 12 months for auto and homeowners.
| • | Renewal ratio: Renewal policy item counts issued during the period, based on contract effective dates, divided by the total policy item counts issued 6 months prior for auto (generally 12 months prior for Encompass brand) or 12 months prior for homeowners. |
| • | Approved rate changes: Based on historical premiums written in locations where the brands operate, not including rate plan enhancements (such as the introduction of discounts and surcharges that result in no change in the overall rate level) and initial rates filed for insurance subsidiaries initially writing business in a location. Includes rate changes approved based on our net cost of reinsurance. The rate change percentages are calculated using approved rate changes during the period as a percentage of: |
| – | Total brand premiums written |
| – | Premiums written in respective locations with rate changes |
The Allstate Corporation 47
2019 Form 10-K Allstate Protection: Allstate brand

Allstate brand products are sold primarily through Allstate exclusive agencies and serve customers who prefer local personalized advice and service and are brand-sensitive. In 2019, the Allstate brand represented 91.1% of the Allstate Protection segment’s written premium. For additional information on our strategy and outlook, see Part I, Item 1. Business - Strategy and Segment Information.
| Underwriting results | ||||||||||||
| For the years ended December 31, | ||||||||||||
| ($ in millions) | 2019 | 2018 | 2017 | |||||||||
| Premiums written | $ | 32,286 | $ | 30,591 | $ | 28,885 | ||||||
| Premiums earned | $ | 31,738 | $ | 30,058 | $ | 28,631 | ||||||
| Other revenue | 583 | 582 | 559 | |||||||||
| Claims and claims expense | (21,178 | ) | (20,237 | ) | (19,273 | ) | ||||||
| Amortization of DAC | (4,411 | ) | (4,242 | ) | (3,963 | ) | ||||||
| Other costs and expenses | (3,748 | ) | (3,752 | ) | (3,497 | ) | ||||||
| Restructuring and related charges | (33 | ) | (52 | ) | (70 | ) | ||||||
| Underwriting income | $ | 2,951 | $ | 2,357 | $ | 2,387 | ||||||
| Catastrophe losses | $ | 2,391 | $ | 2,701 | $ | 2,985 | ||||||
| Underwriting income (loss) by line of business | ||||||||||||
| Auto | $ | 1,727 | $ | 1,788 | $ | 1,465 | ||||||
| Homeowners | 910 | 496 | 754 | |||||||||
| Other personal lines (1) | 225 | 107 | 130 | |||||||||
| Commercial lines | 14 | (83 | ) | (13 | ) | |||||||
| Other business lines (2) | 75 | 49 | 51 | |||||||||
| Underwriting income | $ | 2,951 | $ | 2,357 | $ | 2,387 |
| (1) | Other personal lines include renters, condominium, landlord and other personal lines products. |
| (2) | Other business lines represent Ivantage. |
| Changes in underwriting results from prior year by component (1) | ||||||||
| For the years ended December 31, | ||||||||
| ($ in millions) | 2019 | 2018 | ||||||
| Underwriting income - prior year | $ | 2,357 | $ | 2,387 | ||||
| Changes in underwriting income (loss) from: | ||||||||
| Increase (decrease) premiums earned | 1,680 | 1,427 | ||||||
| Increase (decrease) other revenue | 1 | 23 | ||||||
| (Increase) decrease incurred claims and claims expense (“losses”): | ||||||||
| Incurred losses, excluding catastrophe losses and reserve reestimates | (1,185 | ) | (1,022 | ) | ||||
| Catastrophe losses, excluding reserve reestimates | 337 | 311 | ||||||
| Catastrophe reserve reestimates | (27 | ) | (27 | ) | ||||
| Non-catastrophe reserve reestimates | (66 | ) | (226 | ) | ||||
| Losses subtotal | (941 | ) | (964 | ) | ||||
| (Increase) decrease expenses | (146 | ) | (516 | ) | ||||
| Underwriting income | $ | 2,951 | $ | 2,357 |
(1) The 2019 column presents changes in 2019 compared to 2018. The 2018 column presents changes in 2018 compared to 2017.
Underwriting income increased 25.2% or $594 million in 2019 compared to 2018, primarily due to increased premiums earned and lower catastrophe losses, partially offset by higher non-catastrophe losses and amortization of DAC.
Allstate Protection: Allstate brand 2019 Form 10-K
| Premiums written and earned by line of business | ||||||||||||
| For the years ended December 31, | ||||||||||||
| ($ in millions) | 2019 | 2018 | 2017 | |||||||||
| Premiums written | ||||||||||||
| Auto | $ | 21,936 | $ | 20,991 | $ | 19,859 | ||||||
| Homeowners (1) | 7,645 | 7,199 | 6,865 | |||||||||
| Other personal lines | 1,803 | 1,742 | 1,673 | |||||||||
| Subtotal – Personal lines | 31,384 | 29,932 | 28,397 | |||||||||
| Commercial lines | 902 | 659 | 488 | |||||||||
| Total | $ | 32,286 | $ | 30,591 | $ | 28,885 | ||||||
| Premiums earned | ||||||||||||
| Auto | $ | 21,680 | $ | 20,662 | $ | 19,676 | ||||||
| Homeowners | 7,403 | 7,025 | 6,811 | |||||||||
| Other personal lines | 1,773 | 1,716 | 1,649 | |||||||||
| Subtotal – Personal lines | 30,856 | 29,403 | 28,136 | |||||||||
| Commercial lines | 882 | 655 | 495 | |||||||||
| Total | $ | 31,738 | $ | 30,058 | $ | 28,631 |
| (1) | The cost of our catastrophe reinsurance program increased $22 million to $286 million in 2019 from $264 million in 2018. Catastrophe placement premiums are recorded primarily in the Allstate brand and are a reduction of premium. For a more detailed discussion on reinsurance, see the Claims and Claims Expense Reserves section of the MD&A and Note 10 of the consolidated financial statements. |
| Auto premium measures and statistics | ||||||||||||||||||||
| 2019 | 2018 | 2017 | 2019 vs. 2018 | 2018 vs. 2017 | ||||||||||||||||
| PIF (thousands) | 20,398 | 20,104 | 19,580 | 1.5 | % | 2.7 | % | |||||||||||||
| New issued applications (thousands) | 2,942 | 2,933 | 2,520 | 0.3 | % | 16.4 | % | |||||||||||||
| Average premium | $ | 586 | $ | 570 | $ | 550 | 2.8 | % | 3.6 | % | ||||||||||
| Renewal ratio (%) | 88.6 | 88.5 | 87.6 | 0.1 | 0.9 | |||||||||||||||
| Approved rate changes: | ||||||||||||||||||||
| Impact of rate changes ($ in millions) | $ | 574 | $ | 215 | $ | 773 | $ | 359 | $ | (558 | ) | |||||||||
| # of locations (1) | 47 | 47 | 49 | — | (2 | ) | ||||||||||||||
| Total brand (%) | 2.7 | 1.1 | 4.0 | 1.6 | (2.9 | ) | ||||||||||||||
| Location specific (%) | 4.6 | 2.9 | 6.0 | 1.7 | (3.1 | ) |
| (1) | Allstate brand operates in 50 states, D.C. and 5 Canadian provinces. |
Auto insurance premiums written increased 4.5% or $945 million in 2019 compared to 2018, primarily due to an increase in average premium and growth.
PIF increased by 294 thousand policies compared to the prior year with increases in 33 states, including 6 of our largest 10 states.
| Homeowners premium measures and statistics | ||||||||||||||||||||
| 2019 | 2018 | 2017 | 2019 vs. 2018 | 2018 vs. 2017 | ||||||||||||||||
| PIF (thousands) | 6,254 | 6,186 | 6,088 | 1.1 | % | 1.6 | % | |||||||||||||
| New issued applications (thousands) | 848 | 826 | 733 | 2.7 | % | 12.7 | % | |||||||||||||
| Average premium | $ | 1,295 | $ | 1,231 | $ | 1,197 | 5.2 | % | 2.8 | % | ||||||||||
| Renewal ratio (%) | 88.3 | 88.0 | 87.3 | 0.3 | 0.7 | |||||||||||||||
| Approved rate changes: | ||||||||||||||||||||
| Impact of rate changes ($ in millions) | $ | 239 | $ | 189 | $ | 122 | $ | 50 | $ | 67 | ||||||||||
| # of locations (1) | 39 | 40 | 30 | (1 | ) | 10 | ||||||||||||||
| Total brand (%) | 3.2 | 2.7 | 1.8 | 0.5 | 0.9 | |||||||||||||||
| Location specific (%) | 5.1 | 4.3 | 3.7 | 0.8 | 0.6 |
| (1) | Allstate brand operates in 50 states, D.C., and 5 Canadian provinces. |
Homeowners insurance premiums written increased 6.2% or $446 million in 2019 compared to 2018, primarily due to higher average premiums, including rate changes and inflation in insured home valuations, and growth. PIF increased 68 thousand policies with increases in 31 states, including 6 of our largest 10 states.
Other personal lines premiums written increased 3.5% or $61 million in 2019 compared to 2018. The increase in 2019 was primarily due to increases in personal umbrella and condominium insurance premiums.
The Allstate Corporation 49
2019 Form 10-K Allstate Protection: Allstate brand
Commercial lines premiums written increased 36.9% or $243 million in 2019 compared to 2018. The increase in 2019 was primarily due to expansion in our shared economy business, including growth in our current agreements and addition of new customers.
Growth in premiums written is not reflected in growth in policies in force as the shared economy agreements typically reflect contracts that cover multiple drivers as opposed to individual drivers.
| Combined ratios by line of business | |||||||||||||||||||||||||||
| For the years ended December 31, | |||||||||||||||||||||||||||
| Loss ratio | Expense ratio (1) | Combined ratio | |||||||||||||||||||||||||
| 2019 | 2018 | 2017 | 2019 | 2018 | 2017 | 2019 | 2018 | 2017 | |||||||||||||||||||
| Auto | 67.3 | 65.9 | 67.9 | 24.7 | 25.4 | 24.7 | 92.0 | 91.3 | 92.6 | ||||||||||||||||||
| Homeowners | 64.9 | 69.3 | 66.0 | 22.8 | 23.6 | 22.9 | 87.7 | 92.9 | 88.9 | ||||||||||||||||||
| Other personal lines | 60.6 | 66.3 | 64.1 | 26.7 | 27.5 | 28.0 | 87.3 | 93.8 | 92.1 | ||||||||||||||||||
| Commercial lines | 81.3 | 91.3 | 75.1 | 17.1 | 21.4 | 27.5 | 98.4 | 112.7 | 102.6 | ||||||||||||||||||
| Total | 66.7 | 67.3 | 67.3 | 24.0 | 24.9 | 24.4 | 90.7 | 92.2 | 91.7 |
| (1) | Other revenue is deducted from operating costs and expenses in the expense ratio calculation. |
| Loss ratios by line of business | ||||||||||||||||||||||||||||||||||||
| For the years ended December 31, | ||||||||||||||||||||||||||||||||||||
| Loss ratio | Effect of catastrophe losses | Effect of prior year reserve reestimates | Effect of catastrophe losses included in prior year reserve reestimates | |||||||||||||||||||||||||||||||||
| 2019 | 2018 | 2017 | 2019 | 2018 | 2017 | 2019 | 2018 | 2017 | 2019 | 2018 | 2017 | |||||||||||||||||||||||||
| Auto | 67.3 | 65.9 | 67.9 | 1.7 | 1.6 | 3.4 | (1.5 | ) | (2.2 | ) | (2.4 | ) | (0.1 | ) | (0.2 | ) | (0.1 | ) | ||||||||||||||||||
| Homeowners | 64.9 | 69.3 | 66.0 | 24.8 | 30.5 | 30.7 | 0.7 | — | (2.0 | ) | 0.8 | 0.8 | (0.1 | ) | ||||||||||||||||||||||
| Other personal lines | 60.6 | 66.3 | 64.1 | 9.2 | 12.3 | 12.2 | 0.6 | 0.5 | 0.7 | 0.1 | (0.1 | ) | 0.2 | |||||||||||||||||||||||
| Commercial lines | 81.3 | 91.3 | 75.1 | 1.4 | 3.4 | 4.8 | 1.9 | 16.5 | 3.9 | (0.1 | ) | — | 0.2 | |||||||||||||||||||||||
| Total | 66.7 | 67.3 | 67.3 | 7.5 | 9.0 | 10.4 | (0.7 | ) | (1.1 | ) | (2.0 | ) | 0.1 | — | (0.1 | ) |
Frequency and severity statistics, which are influenced by driving patterns, inflation and other factors, are provided to describe the trends in loss costs of the business. Our reserving process incorporates changes in loss patterns, operational statistics and changes in claims reporting processes to determine our best estimate of recorded reserves. We use the following statistics to evaluate losses:
| • Paid claim frequency (1) is calculated as annualized notice counts closed with payment in the period divided by the average of PIF with the applicable coverage during the period. |
| • Gross claim frequency (1) is calculated as annualized notice counts received in the period divided by the average of PIF with the applicable coverage during the period. Gross claim frequency includes all actual notice counts, regardless of their current status (open or closed) or their ultimate disposition (closed with a payment or closed without payment). |
| • Paid claim severity is calculated by dividing the sum of paid losses and loss expenses by claims closed with a payment during the period. |
| • Percent change in frequency or severity statistics is calculated as the amount of increase or decrease in the paid or gross claim frequency or severity in the current period compared to the same period in the prior year divided by the prior year paid or gross claim frequency or severity. |
| (1) | Frequency statistics exclude counts associated with catastrophe events. |
Paid claim frequency trends will often differ from gross claim frequency trends due to differences in the timing of when notices are received and when claims are settled. For property damage claims, paid
frequency trends reflect smaller differences as timing between opening and settlement is generally less. For bodily injury, gross frequency trends reflect emerging trends since the difference in timing between opening and settlement is much greater and gross frequency does not typically experience the same volatility in quarterly fluctuations seen in paid frequency. In evaluating frequency, we typically rely upon paid frequency trends for physical damage coverages such as property damage and gross frequency for casualty coverages such as bodily injury to provide an indicator of emerging trends in overall claim frequency while also providing insights for our analysis of severity.
We are continuing to implement new technology and process improvements that provide continued loss cost accuracy, efficient processing and enhanced customer experiences that are simple, fast and produce high degrees of satisfaction. We use Digital Operating Centers to handle auto physical damage claims countrywide utilizing our virtual estimation capabilities, which includes estimating damage with photos and video through the use of QuickFoto Claim® and Virtual Assist®. We are also leveraging virtual capabilities to handle property claims by estimating damage through video with Virtual Assist and aerial imagery using satellites, airplanes and drones. These organizational and process changes impact frequency and severity statistics as changes in claim opening and closing practices and shifts in timing, if any, can impact comparisons to prior periods.
Auto loss ratio increased 1.4 points in 2019 compared to 2018, primarily due to higher claim severity and lower favorable non-catastrophe prior
Allstate Protection: Allstate brand 2019 Form 10-K
year reserve reestimates, partially offset by higher premiums earned and lower claim frequency.
Property damage paid claim frequency decreased 2.2% in 2019 compared to 2018. Property damage paid claim severities increased 6.5% in 2019 compared to 2018 due to the impact of higher costs to repair more sophisticated, newer model vehicles, higher third-party subrogation demands and increased number of total losses.
Bodily injury gross claim frequency decreased 1.8% in 2019 compared to 2018. Bodily injury severity trends increased at a rate above medical care inflation indices in 2019.
Homeowners loss ratio decreased 4.4 points in 2019 compared to 2018, primarily due to lower catastrophes, increased premiums earned and improved claim frequency, partially offset by increased claim severity. Paid claim frequency excluding
catastrophe losses decreased 6.0% in 2019 compared to 2018. Paid claim severity excluding catastrophe losses increased 11.8% in 2019 compared to 2018 as we experienced increased claim severity in fire and water perils. Homeowner paid claim severity can be impacted by both the mix of perils and the magnitude of specific losses paid during the year.
Other personal lines loss ratio decreased 5.7 points in 2019 compared to 2018, primarily due to lower catastrophe losses and increased premiums earned.
Commercial lines loss ratio decreased 10.0 points in 2019 compared to 2018, primarily due to increased premiums earned and lower unfavorable non-catastrophe prior year reserve reestimates, partially offset by higher severity. Commercial lines recorded losses related to the shared economy agreements are primarily based on original pricing expectations given limited loss experience.
| Impact of specific costs and expenses on the expense ratio | |||||||||
| For the years ended December 31, | |||||||||
| 2019 | 2018 | 2017 | |||||||
| Amortization of DAC | 13.9 | 14.1 | 13.8 | ||||||
| Advertising expense | 2.2 | 2.2 | 2.0 | ||||||
| Other costs and expenses | 7.8 | 8.4 | 8.4 | ||||||
| Restructuring and related charges | 0.1 | 0.2 | 0.2 | ||||||
| Total expense ratio | 24.0 | 24.9 | 24.4 |
Expense ratio decreased 0.9 points in 2019 compared to 2018, primarily due to lower agent incentive compensation and decreased operating expenses driven by enterprise-wide cost reduction efforts. Amortization of DAC primarily includes agent remuneration and premium taxes. Allstate agency total incurred base commissions, variable compensation and bonuses in 2019 were lower than 2018.
Commercial lines expense ratio decreased 4.3 points in 2019 compared to 2018, primarily due to growth in our shared economy business, which has a lower expense ratio.
The Allstate Corporation 51
2019 Form 10-K Allstate Protection: Esurance brand

Esurance brand products are sold directly to self-directed, brand-sensitive consumers online and through contact centers. We manage the direct-to-customer business based on its profitability over the lifetime of the customer relationship. In 2019, the Esurance brand represented 6.0% of the Allstate Protection segment’s written premium. For additional information on our strategy and outlook, see Part I, Item 1. Business - Strategy and Segment Information.
| Underwriting results | ||||||||||||
| For the years ended December 31, | ||||||||||||
| ($ in millions) | 2019 | 2018 | 2017 | |||||||||
| Premiums written | $ | 2,113 | $ | 1,948 | $ | 1,728 | ||||||
| Premiums earned | $ | 2,087 | $ | 1,869 | $ | 1,712 | ||||||
| Other revenue | 83 | 80 | 67 | |||||||||
| Claims and claims expense | (1,650 | ) | (1,443 | ) | (1,329 | ) | ||||||
| Amortization of DAC | (46 | ) | (43 | ) | (41 | ) | ||||||
| Other costs and expenses | (465 | ) | (487 | ) | (462 | ) | ||||||
| Restructuring and related charges | (1 | ) | (1 | ) | (3 | ) | ||||||
| Impairment of purchased intangibles | (51 | ) | — | — | ||||||||
| Underwriting loss | $ | (43 | ) | $ | (25 | ) | $ | (56 | ) | |||
| Catastrophe losses | $ | 51 | $ | 52 | $ | 50 | ||||||
| Underwriting income (loss) by line of business | ||||||||||||
| Auto | $ | (47 | ) | $ | (11 | ) | $ | (37 | ) | |||
| Homeowners | 2 | (14 | ) | (20 | ) | |||||||
| Other personal lines | 2 | — | 1 | |||||||||
| Underwriting loss | $ | (43 | ) | $ | (25 | ) | $ | (56 | ) |
| Changes in underwriting results from prior year by component (1) | ||||||||
| For the years ended December 31, | ||||||||
| ($ in millions) | 2019 | 2018 | ||||||
| Underwriting income (loss) - prior year | $ | (25 | ) | $ | (56 | ) | ||
| Changes in underwriting income (loss) from: | ||||||||
| Increase (decrease) premiums earned | 218 | 157 | ||||||
| Increase (decrease) other revenue | 3 | 13 | ||||||
| (Increase) decrease incurred claims and claims expense (“losses”): | ||||||||
| Incurred losses, excluding catastrophe losses and reserve reestimates | (207 | ) | (110 | ) | ||||
| Catastrophe losses, excluding reserve reestimates | — | 1 | ||||||
| Catastrophe reserve reestimates | 1 | (3 | ) | |||||
| Non-catastrophe reserve reestimates | (1 | ) | (2 | ) | ||||
| Losses subtotal | (207 | ) | (114 | ) | ||||
| (Increase) decrease expenses: | ||||||||
| Expenses, excluding impairment of purchased intangibles | 19 | (25 | ) | |||||
| Impairment of purchased intangibles | (51 | ) | — | |||||
| Expenses subtotal | (32 | ) | (25 | ) | ||||
| Underwriting loss | $ | (43 | ) | $ | (25 | ) |
(1) The 2019 column presents changes in 2019 compared to 2018. The 2018 column presents changes in 2018 compared to 2017.
Underwriting loss increased 72.0% or $18 million in 2019 compared to 2018, primarily due to the impairment of purchased intangibles of $51 million for the Esurance brand trade name as we integrate Esurance into the Allstate brand.
Excluding the impairment of purchased intangibles, Esurance underwriting income totaled $8 million in 2019, an increase of $33 million from an underwriting loss of $25 million in 2018. The improvement was primarily due to increased premiums earned and lower operating expenses, partially offset by increased loss costs.
Allstate Protection: Esurance brand 2019 Form 10-K
| Premiums written and earned by line of business | ||||||||||||
| For the years ended December 31, | ||||||||||||
| ($ in millions) | 2019 | 2018 | 2017 | |||||||||
| Premiums written | ||||||||||||
| Auto | $ | 1,986 | $ | 1,839 | $ | 1,641 | ||||||
| Homeowners | 119 | 101 | 79 | |||||||||
| Other personal lines | 8 | 8 | 8 | |||||||||
| Total | $ | 2,113 | $ | 1,948 | $ | 1,728 | ||||||
| Premiums earned | ||||||||||||
| Auto | $ | 1,969 | $ | 1,771 | $ | 1,636 | ||||||
| Homeowners | 110 | 90 | 68 | |||||||||
| Other personal lines | 8 | 8 | 8 | |||||||||
| Total | $ | 2,087 | $ | 1,869 | $ | 1,712 |
| Auto premium measures and statistics | ||||||||||||||||||||
| 2019 | 2018 | 2017 | 2019 vs. 2018 | 2018 vs. 2017 | ||||||||||||||||
| PIF (thousands) | 1,515 | 1,488 | 1,352 | 1.8 | % | 10.1 | % | |||||||||||||
| New issued applications (thousands) | 593 | 633 | 484 | (6.3 | )% | 30.8 | % | |||||||||||||
| Average premium | $ | 620 | $ | 605 | $ | 574 | 2.5 | % | 5.4 | % | ||||||||||
| Renewal ratio (%) | 82.8 | 83.3 | 81.5 | (0.5 | ) | 1.8 | ||||||||||||||
| Approved rate changes: | ||||||||||||||||||||
| Impact of rate changes ($ in millions) | $ | 92 | $ | 28 | $ | 78 | $ | 64 | $ | (50 | ) | |||||||||
| # of locations (1) | 30 | 30 | 39 | — | (9 | ) | ||||||||||||||
| Total brand (%) | 5.0 | 1.8 | 4.8 | 3.2 | (3.0 | ) | ||||||||||||||
| Location specific (%) | 5.7 | 2.7 | 5.5 | 3.0 | (2.8 | ) |
| (1) | Esurance brand operates in 43 states. |
Auto insurance premiums written increased 8.0% or $147 million in 2019 compared to 2018 due to higher average premium primarily due to rate changes approved and PIF growth, partially offset by a lower renewal ratio.
PIF increased 1.8% or 27 thousand in 2019 compared to 2018. New issued applications decreased 6.3% in 2019 compared to 2018 due to lower advertising spend.
| Homeowners premium measures and statistics | ||||||||||||||||||||
| 2019 | 2018 | 2017 | 2019 vs. 2018 | 2018 vs. 2017 | ||||||||||||||||
| PIF (thousands) | 105 | 95 | 79 | 10.5 | % | 20.3 | % | |||||||||||||
| New issued applications (thousands) | 29 | 32 | 34 | (9.4 | )% | (5.9 | )% | |||||||||||||
| Average premium | $ | 1,055 | $ | 982 | $ | 917 | 7.4 | % | 7.1 | % | ||||||||||
| Renewal ratio (%) (1) | 84.5 | 85.3 | 85.5 | (0.8 | ) | (0.2 | ) | |||||||||||||
| Approved rate changes: | ||||||||||||||||||||
| Impact of rate changes ($ in millions) | $ | 5 | $ | 2 | $ | 3 | $ | 3 | $ | (1 | ) | |||||||||
| # of locations (2) | 5 | 6 | 3 | (1 | ) | 3 | ||||||||||||||
| Total brand (%) | 4.7 | 2.1 | 4.5 | 2.6 | (2.4 | ) | ||||||||||||||
| Location specific (%) | 17.1 | 6.9 | 18.5 | 10.2 | (11.6 | ) |
| (1) | Esurance’s renewal ratios exclude the impact of risk related cancellations. Customers can enter into a policy without a physical inspection. During the underwriting review period, a number of policies may be canceled if upon inspection the condition is unsatisfactory. |
| (2) | Esurance brand operates in 31 states. |
Homeowners insurance premiums written increased 17.8% or $18 million in 2019 compared to 2018 due to higher average premium primarily due to approved rate changes. As of December 31, 2019, Esurance continues to write homeowners insurance in
31 states with lower hurricane risk, contributing to lower average premium compared to the industry.
PIF increased 10.5% or 10 thousand in 2019 compared to 2018.
The Allstate Corporation 53
2019 Form 10-K Allstate Protection: Esurance brand
| Combined ratios by line of business | |||||||||||||||||||||||||||
| For the years ended December 31, | |||||||||||||||||||||||||||
| Loss ratio | Expense ratio (1) | Combined ratio | |||||||||||||||||||||||||
| 2019 | 2018 | 2017 | 2019 | 2018 | 2017 | 2019 | 2018 | 2017 | |||||||||||||||||||
| Auto | 79.4 | 77.0 | 77.5 | 23.0 | 23.6 | 24.8 | 102.4 | 100.6 | 102.3 | ||||||||||||||||||
| Homeowners | 74.6 | 83.4 | 83.8 | 23.6 | 32.2 | 45.6 | 98.2 | 115.6 | 129.4 | ||||||||||||||||||
| Total | 79.1 | 77.2 | 77.6 | 23.0 | 24.1 | 25.7 | 102.1 | 101.3 | 103.3 |
| (1) | Other revenue is deducted from operating costs and expenses in the expense ratio calculation. |
| Loss ratios by line of business | ||||||||||||||||||||||||||||||||||||
| For the years ended December 31, | ||||||||||||||||||||||||||||||||||||
| Loss ratio | Effect of catastrophe losses | Effect of prior year reserve reestimates | Effect of catastrophe losses included in prior year reserve reestimates | |||||||||||||||||||||||||||||||||
| 2019 | 2018 | 2017 | 2019 | 2018 | 2017 | 2019 | 2018 | 2017 | 2019 | 2018 | 2017 | |||||||||||||||||||||||||
| Auto | 79.4 | 77.0 | 77.5 | 1.2 | 1.5 | 2.1 | 0.1 | 0.1 | 0.1 | — | — | — | ||||||||||||||||||||||||
| Homeowners | 74.6 | 83.4 | 83.8 | 24.6 | 27.8 | 23.5 | 0.9 | 2.2 | (3.0 | ) | 0.9 | 2.2 | (1.5 | ) | ||||||||||||||||||||||
| Total | 79.1 | 77.2 | 77.6 | 2.4 | 2.8 | 2.9 | 0.1 | 0.2 | (0.1 | ) | — | 0.1 | (0.1 | ) |
Auto loss ratio increased 2.4 points in 2019 compared to 2018, primarily due to higher claim severity and to a lesser extent higher frequency, partially offset by higher premiums earned.
Homeowners loss ratio decreased 8.8 points in 2019 compared to 2018, primarily due to lower frequency and higher premiums earned, partially offset by higher claims severity.
| Impact of specific costs and expenses on the expense ratio | |||||||||
| For the years ended December 31, | |||||||||
| 2019 | 2018 | 2017 | |||||||
| Amortization of DAC | 2.2 | 2.3 | 2.4 | ||||||
| Advertising expense | 7.0 | 8.7 | 8.3 | ||||||
| Amortization of purchased intangibles | 0.1 | 0.1 | 0.2 | ||||||
| Other costs and expenses | 11.2 | 12.9 | 14.6 | ||||||
| Restructuring and related charges | — | 0.1 | 0.2 | ||||||
| Impairment of purchased intangibles | 2.5 | — | — | ||||||
| Total expense ratio | 23.0 | 24.1 | 25.7 |
Expense ratio decreased 1.1 points in 2019 compared to 2018. Excluding the impairment of purchased intangibles, the expense ratio decreased by 3.6 points compared to 2018.
Other costs and expenses, including salaries of telephone sales personnel and other underwriting costs related to customer acquisition, were 1.7 points lower in 2019 compared to 2018 reflecting continued implementation of digital self-service capabilities and premium growth.
Esurance uses a direct distribution model, therefore its primary acquisition-related costs are advertising as opposed to commissions. Esurance advertising expense ratio decreased 1.7 points in 2019 compared to 2018.
Allstate Protection: Encompass brand 2019 Form 10-K

Encompass products are sold through independent agencies that serve brand-neutral customers who prefer personal service and support from an independent agent. In 2019, the Encompass brand represented 2.9% of the Allstate Protection segment’s written premium. For additional information on our strategy and outlook, see Part I, Item 1. Business - Strategy and Segment Information.
| Underwriting results | ||||||||||||
| For the years ended December 31, | ||||||||||||
| ($ in millions) | 2019 | 2018 | 2017 | |||||||||
| Premiums written | $ | 1,020 | $ | 1,016 | $ | 1,035 | ||||||
| Premiums earned | $ | 1,018 | $ | 1,023 | $ | 1,090 | ||||||
| Other revenue | 5 | 5 | 6 | |||||||||
| Claims and claims expense | (689 | ) | (668 | ) | (786 | ) | ||||||
| Amortization of DAC | (192 | ) | (190 | ) | (201 | ) | ||||||
| Other costs and expenses | (131 | ) | (145 | ) | (130 | ) | ||||||
| Restructuring and related charges | (4 | ) | (7 | ) | (5 | ) | ||||||
| Underwriting income (loss) | $ | 7 | $ | 18 | $ | (26 | ) | |||||
| Catastrophe losses | $ | 115 | $ | 102 | $ | 193 | ||||||
| Underwriting income (loss) by line of business | ||||||||||||
| Auto | $ | 8 | $ | 14 | $ | 9 | ||||||
| Homeowners | 2 | 1 | (45 | ) | ||||||||
| Other personal lines | (3 | ) | 3 | 10 | ||||||||
| Underwriting income (loss) | $ | 7 | $ | 18 | $ | (26 | ) |
| Changes in underwriting results from prior year by component (1) | ||||||||
| For the years ended December 31, | ||||||||
| ($ in millions) | 2019 | 2018 | ||||||
| Underwriting income (loss) - prior year | $ | 18 | $ | (26 | ) | |||
| Changes in underwriting income (loss) from: | ||||||||
| Increase (decrease) premiums earned | (5 | ) | (67 | ) | ||||
| Increase (decrease) other revenue | — | (1 | ) | |||||
| (Increase) decrease incurred claims and claims expense (“losses”): | ||||||||
| Incurred losses, excluding catastrophe losses and reserve reestimates | 9 | 17 | ||||||
| Catastrophe losses, excluding reserve reestimates | (16 | ) | 104 | |||||
| Catastrophes reserve reestimates | 3 | (13 | ) | |||||
| Non-catastrophe reserve reestimates | (17 | ) | 10 | |||||
| Losses subtotal | (21 | ) | 118 | |||||
| (Increase) decrease expenses | 15 | (6 | ) | |||||
| Underwriting income | $ | 7 | $ | 18 |
(1) The 2019 column presents changes in 2019 compared to 2018. The 2018 column presents changes in 2018 compared to 2017.
Underwriting income decreased 61.1% or $11 million in 2019 compared to 2018, primarily due to higher catastrophe losses and lower favorable non-catastrophe prior year reestimates, partially offset by lower operating expenses.
The Allstate Corporation 55
2019 Form 10-K Allstate Protection: Encompass brand
| Premiums written and earned by line of business | ||||||||||||
| For the years ended December 31, | ||||||||||||
| ($ in millions) | 2019 | 2018 | 2017 | |||||||||
| Premiums written | ||||||||||||
| Auto | $ | 540 | $ | 537 | $ | 542 | ||||||
| Homeowners | 401 | 398 | 406 | |||||||||
| Other personal lines | 79 | 81 | 87 | |||||||||
| Total | $ | 1,020 | $ | 1,016 | $ | 1,035 | ||||||
| Premiums earned | ||||||||||||
| Auto | $ | 539 | $ | 537 | $ | 566 | ||||||
| Homeowners | 399 | 402 | 431 | |||||||||
| Other personal lines | 80 | 84 | 93 | |||||||||
| Total | $ | 1,018 | $ | 1,023 | $ | 1,090 |
| Auto premium measures and statistics | ||||||||||||||||||||
| 2019 | 2018 | 2017 | 2019 vs. 2018 | 2018 vs. 2017 | ||||||||||||||||
| PIF (thousands) | 493 | 502 | 530 | (1.8 | )% | (5.3 | )% | |||||||||||||
| New issued applications (thousands) | 82 | 76 | 52 | 7.9 | % | 46.2 | % | |||||||||||||
| Average premium | $ | 1,134 | $ | 1,118 | $ | 1,079 | 1.4 | % | 3.6 | % | ||||||||||
| Renewal ratio (%) (1) | 78.1 | 74.9 | 73.4 | 3.2 | 1.5 | |||||||||||||||
| Approved rate changes: | ||||||||||||||||||||
| Impact of rate changes ($ in millions) | $ | 8 | $ | 13 | $ | 37 | $ | (5 | ) | $ | (24 | ) | ||||||||
| # of locations (2) | 17 | 17 | 27 | — | (10 | ) | ||||||||||||||
| Total brand (%) | 1.5 | 2.4 | 6.2 | (0.9 | ) | (3.8 | ) | |||||||||||||
| Location specific (%) | 4.1 | 4.8 | 7.8 | (0.7 | ) | (3.0 | ) |
| (1) | Encompass announced a plan to exit business in Massachusetts in the second quarter of 2017 and previously announced a plan to exit business in North Carolina in the first half of 2016, which impacted the renewal ratio. Excluding Massachusetts and North Carolina, the renewal ratios were 76.5 points in 2018 compared to 74.5 points in 2017. |
| (2) | Encompass brand operates in 40 states and D.C. |
Auto insurance premiums written increased 0.6% or $3 million in 2019 compared to 2018, primarily due to higher average premiums due to rate changes over the past 12 months, with the top 10 states representing
approximately 70% of premiums written. PIF decreased 1.8% or 9 thousand in 2019 compared to 2018.
| Homeowners premium measure and statistics | ||||||||||||||||||||
| 2019 | 2018 | 2017 | 2019 vs. 2018 | 2018 vs. 2017 | ||||||||||||||||
| PIF (thousands) | 234 | 239 | 254 | (2.1 | )% | (5.9 | )% | |||||||||||||
| New issued applications (thousands) | 42 | 37 | 30 | 13.5 | % | 23.3 | % | |||||||||||||
| Average premium | $ | 1,795 | $ | 1,724 | $ | 1,684 | 4.1 | % | 2.4 | % | ||||||||||
| Renewal ratio (%) (1) | 82.5 | 80.0 | 78.5 | 2.5 | 1.5 | |||||||||||||||
| Approved rate changes: | ||||||||||||||||||||
| Impact of rate changes ($ in millions) | $ | 38 | $ | 20 | $ | 23 | $ | 18 | $ | (3 | ) | |||||||||
| # of locations (2) | 27 | 20 | 21 | 7 | (1 | ) | ||||||||||||||
| Total brand (%) | 9.2 | 4.7 | 4.8 | 4.5 | (0.1 | ) | ||||||||||||||
| Location specific (%) | 10.9 | 8.1 | 8.4 | 2.8 | (0.3 | ) |
| (1) | Encompass announced a plan to exit business in Massachusetts in the second quarter of 2017 and previously announced a plan to exit business in North Carolina in the first half of 2016, which has impacted the renewal ratio. Excluding Massachusetts and North Carolina, the renewal ratios were 80.8 points in 2018 compared to 79.0 points in 2017. |
| (2) | Encompass brand operates in 40 states and D.C. |
Homeowners insurance premiums written increased 0.8% or $3 million in 2019 compared to 2018, primarily due to higher average premiums due to rate changes over the past 12 months, with the top 10
states representing approximately 70% of premiums written. PIF decreased 2.1% or 5 thousand in 2019 compared to 2018.
Allstate Protection: Encompass brand 2019 Form 10-K
| Combined ratios by line of business | |||||||||||||||||||||||||||
| For the years ended December 31, | |||||||||||||||||||||||||||
| Loss ratio | Expense ratio (1) | Combined ratio | |||||||||||||||||||||||||
| 2019 | 2018 | 2017 | 2019 | 2018 | 2017 | 2019 | 2018 | 2017 | |||||||||||||||||||
| Auto | 66.8 | 65.0 | 68.0 | 31.7 | 32.4 | 30.4 | 98.5 | 97.4 | 98.4 | ||||||||||||||||||
| Homeowners | 68.2 | 66.7 | 80.3 | 31.3 | 33.1 | 30.1 | 99.5 | 99.8 | 110.4 | ||||||||||||||||||
| Other personal lines | 71.3 | 60.7 | 59.1 | 32.5 | 35.7 | 30.1 | 103.8 | 96.4 | 89.2 | ||||||||||||||||||
| Total | 67.7 | 65.3 | 72.1 | 31.6 | 32.9 | 30.3 | 99.3 | 98.2 | 102.4 |
| (1) | Other revenue is deducted from operating costs and expenses in the expense ratio calculation. |
| Loss ratios by line of business | ||||||||||||||||||||||||||||||||||||
| For the years ended December 31, | ||||||||||||||||||||||||||||||||||||
| Loss ratio | Effect of catastrophe losses | Effect of prior year reserve reestimates | Effect of catastrophe losses included in prior year reserve reestimates | |||||||||||||||||||||||||||||||||
| 2019 | 2018 | 2017 | 2019 | 2018 | 2017 | 2019 | 2018 | 2017 | 2019 | 2018 | 2017 | |||||||||||||||||||||||||
| Auto | 66.8 | 65.0 | 68.0 | 1.9 | 1.1 | 2.1 | (1.9 | ) | (1.9 | ) | (1.1 | ) | — | (0.2 | ) | (0.2 | ) | |||||||||||||||||||
| Homeowners | 68.2 | 66.7 | 80.3 | 25.1 | 22.1 | 40.1 | 3.7 | 3.3 | 0.5 | 2.5 | 3.0 | — | ||||||||||||||||||||||||
| Other personal lines | 71.3 | 60.7 | 59.1 | 6.3 | 8.3 | 8.6 | (2.5 | ) | (16.7 | ) | (10.8 | ) | (1.2 | ) | 1.2 | — | ||||||||||||||||||||
| Total | 67.7 | 65.3 | 72.1 | 11.3 | 10.0 | 17.7 | 0.3 | (1.1 | ) | (1.3 | ) | 0.9 | 1.2 | (0.1 | ) |
Auto loss ratio increased 1.8 points in 2019 compared to 2018, primarily due to increased claim severity and higher catastrophe losses, partially offset by favorable claim frequency.
Homeowners loss ratio increased 1.5 points in 2019 compared to 2018, primarily due to higher catastrophe losses and unfavorable prior year reserve reestimates, partially offset by lower non-catastrophe losses driven by favorable claim frequency.
| Impact of specific costs and expenses on the expense ratio | |||||||||
| For the years ended December 31, | |||||||||
| 2019 | 2018 | 2017 | |||||||
| Amortization of DAC | 18.8 | 18.5 | 18.3 | ||||||
| Advertising expense | 0.2 | 0.2 | 0.2 | ||||||
| Other costs and expenses | 12.2 | 13.5 | 11.3 | ||||||
| Restructuring and related charges | 0.4 | 0.7 | 0.5 | ||||||
| Total expense ratio | 31.6 | 32.9 | 30.3 |
Expense ratio decreased 1.3 points in 2019 compared to 2018, primarily due to lower technology and employee-related costs.
The Allstate Corporation 57
2019 Form 10-K Discontinued Lines and Coverages
Discontinued Lines and Coverages Segment
The Discontinued Lines and Coverages segment includes results from property and casualty insurance coverage that primarily relates to policies written during the 1960s through the mid-1980s. Our exposure to asbestos, environmental and other discontinued lines claims arises principally from direct excess commercial insurance, assumed reinsurance coverage, direct primary commercial insurance and other businesses in run-off. For additional information on our strategy and outlook, see Part I, Item 1. Business - Strategy and Segment Information.
| Underwriting results | ||||||||||||
| For the years ended December 31, | ||||||||||||
| ($ in millions) | 2019 | 2018 | 2017 | |||||||||
| Claims and claims expense (1) | $ | (105 | ) | $ | (87 | ) | $ | (96 | ) | |||
| Operating costs and expenses | (3 | ) | (3 | ) | (3 | ) | ||||||
| Underwriting loss | $ | (108 | ) | $ | (90 | ) | $ | (99 | ) |
(1) The cost of administering claims settlements totaled $11 million for all periods presented.
Underwriting losses in 2019 primarily related to our annual reserve review using established industry and actuarial best practices. The annual review resulted in unfavorable reestimates of $95 million, including $28 million for asbestos exposures, primarily related to new reported information and settlement agreements, including bankruptcy proceedings; $36 million for environmental exposures primarily related to the reporting of additional clean-up sites; $37 million for other exposures based on new reported information, partially offset by a $6 million decrease in the allowance for future uncollectible reinsurance.
Underwriting losses in 2018 primarily related to our annual reserve review, which resulted in unfavorable reestimates of $76 million, including $44 million for asbestos exposures, $20 million for environmental exposures and $13 million for other exposures, partially offset by a $1 million decrease in the allowance for future uncollectible reinsurance.
| Reserves for asbestos, environmental and other discontinued lines claims before and after the effects of reinsurance | ||||||||
| ($ in millions) | December 31, 2019 | December 31, 2018 | ||||||
| Asbestos claims | ||||||||
| Gross reserves | $ | 1,172 | $ | 1,266 | ||||
| Reinsurance | (362 | ) | (400 | ) | ||||
| Net reserves | 810 | 866 | ||||||
| Environmental claims | ||||||||
| Gross reserves | 219 | 209 | ||||||
| Reinsurance | (40 | ) | (39 | ) | ||||
| Net reserves | 179 | 170 | ||||||
| Other discontinued lines | ||||||||
| Gross reserves | 427 | 389 | ||||||
| Reinsurance | (51 | ) | (34 | ) | ||||
| Net reserves | 376 | 355 | ||||||
| Total | ||||||||
| Gross reserves | 1,818 | 1,864 | ||||||
| Reinsurance | (453 | ) | (473 | ) | ||||
| Net reserves | $ | 1,365 | $ | 1,391 |
Discontinued Lines and Coverages 2019 Form 10-K
| Reserves by type of exposure before and after the effects of reinsurance | ||||||||
| ($ in millions) | December 31, 2019 | December 31, 2018 | ||||||
| Direct excess commercial insurance | ||||||||
| Gross reserves (1) | $ | 948 | $ | 973 | ||||
| Reinsurance (2) | (332 | ) | (355 | ) | ||||
| Net reserves | 616 | 618 | ||||||
| Assumed reinsurance coverage | ||||||||
| Gross reserves (3) | 606 | 625 | ||||||
| Reinsurance (4) | (53 | ) | (53 | ) | ||||
| Net reserves | 553 | 572 | ||||||
| Direct primary commercial insurance | ||||||||
| Gross reserves (5) | 169 | 171 | ||||||
| Reinsurance (6) | (54 | ) | (48 | ) | ||||
| Net reserves | 115 | 123 | ||||||
| Other run-off business | ||||||||
| Gross reserves | 15 | 19 | ||||||
| Reinsurance | (13 | ) | (16 | ) | ||||
| Net reserves | 2 | 3 | ||||||
| Unallocated loss adjustment expenses | ||||||||
| Gross reserves | 80 | 76 | ||||||
| Reinsurance | (1 | ) | (1 | ) | ||||
| Net reserves | 79 | 75 | ||||||
| Total | ||||||||
| Gross reserves | 1,818 | 1,864 | ||||||
| Reinsurance | (453 | ) | (473 | ) | ||||
| Net reserves | $ | 1,365 | $ | 1,391 |
(1) Gross reserves as of December 31, 2019 comprised 68% case reserves and 32% incurred but not reported (“IBNR”) reserves. Approximately 72% of the total gross case reserves are subject to settlement agreements. In 2019, total gross payments from case reserves were $122 million with approximately 83% attributable to settlements. Reserves as of December 31, 2018, comprised 67% case reserves and 33% IBNR reserves.
(2) Ceded reserves as of December 31, 2019 comprised 78% case reserves and 22% IBNR reserves. Approximately 79% of the total ceded case reserves are subject to settlement agreements. In 2019, reinsurance billings of ceded case reserves were $53 million with approximately 87% attributable to settlements. Reserves as of December 31, 2018, comprised 78% case reserves and 22% IBNR reserves.
(3) Gross reserves as of December 31, 2019 comprised 34% case reserves and 66% IBNR reserves. In 2019, total gross payments from case reserves were $43 million. Reserves as of December 31, 2018, comprised 34% case reserves and 66% IBNR reserves.
(4) Ceded reserves as of December 31, 2019 comprised 35% case reserves and 65% IBNR reserves. In 2019, reinsurance billings of ceded case reserves were $3 million. Reserves as of December 31, 2018, comprised 37% case reserves and 63% IBNR reserves.
(5) Gross reserves as of December 31, 2019 comprised 56% case reserves and 44% IBNR reserves. In 2019, total gross payments from case reserves were $15 million. Reserves as of December 31, 2018, comprised 58% case reserves and 42% IBNR reserves.
(6) Ceded reserves as of December 31, 2019 comprised 78% case reserves and 22% IBNR reserves. In 2019, reinsurance billings of ceded case reserves were $2 million. Reserves as of December 31, 2018, comprised 78% case reserves and 22% IBNR reserves.
Total net reserves as of December 31, 2019, included $660 million or 48% of estimated IBNR reserves compared to $693 million or 50% of estimated IBNR reserves as of December 31, 2018.
Total gross payments were $183 million and $156 million for 2019 and 2018, respectively, primarily related to payments on settlement agreements reached with several insureds on large claims, mainly asbestos related losses, where the scope of coverages has been agreed upon.
The claims associated with these settlement agreements are expected to be substantially paid out over the next several years as qualified claims are submitted by these insureds. Reinsurance collections were $49 million and $62 million for 2019 and 2018, respectively.
See the Claims and Claims Expense Reserves section of this Item for a more detailed discussion.
The Allstate Corporation 59
2019 Form 10-K Service Businesses
Service Businesses Segment

Service Businesses comprise Allstate Protection Plans, Allstate Dealer Services, Allstate Roadside Services, Arity and Allstate Identity Protection. In 2019, Service Businesses represented 3.7% of total revenue, 72.6% of total PIF and 1.1% of total adjusted net income. We offer consumer product protection plans, finance and insurance products (including vehicle service contracts, guaranteed asset protection waivers, road hazard tire and wheel and paintless dent repair protection), roadside assistance, device and mobile data collection services and analytic solutions using automotive telematics information and identity protection. For additional information on our strategy and outlook, see Part I, Item 1. Business - Strategy and Segment Information.
| Summarized financial information | ||||||||||||
| For the years ended December 31, | ||||||||||||
| ($ in millions) | 2019 | 2018 | 2017 | |||||||||
| Premiums written | $ | 1,535 | $ | 1,431 | $ | 1,094 | ||||||
| Revenues | ||||||||||||
| Premiums | $ | 1,233 | $ | 1,098 | $ | 867 | ||||||
| Other revenue | 188 | 82 | 66 | |||||||||
| Intersegment insurance premiums and service fees (1) | 154 | 122 | 110 | |||||||||
| Net investment income | 42 | 27 | 16 | |||||||||
| Realized capital gains and losses | 32 | (11 | ) | — | ||||||||
| Total revenues | 1,649 | 1,318 | 1,059 | |||||||||
| Costs and expenses | ||||||||||||
| Claims and claims expense | (363 | ) | (350 | ) | (369 | ) | ||||||
| Amortization of DAC | (543 | ) | (463 | ) | (296 | ) | ||||||
| Operating costs and expenses | (661 | ) | (505 | ) | (460 | ) | ||||||
| Restructuring and related charges (2) | — | (4 | ) | (13 | ) | |||||||
| Amortization of purchased intangibles | (122 | ) | (94 | ) | (92 | ) | ||||||
| Impairment of purchased intangibles | (55 | ) | — | — | ||||||||
| Total costs and expenses | (1,744 | ) | (1,416 | ) | (1,230 | ) | ||||||
| Income tax benefit | 18 | 19 | 194 | |||||||||
| Net (loss) income applicable to common shareholders | $ | (77 | ) | $ | (79 | ) | $ | 23 | ||||
| Adjusted net income (loss) | $ | 38 | $ | 8 | $ | (54 | ) | |||||
| Realized capital gains and losses, after-tax | 25 | (9 | ) | — | ||||||||
| Amortization of purchased intangibles, after-tax | (97 | ) | (74 | ) | (60 | ) | ||||||
| Impairment of purchased intangibles, after-tax | (43 | ) | — | — | ||||||||
| Tax Legislation (expense) benefit | — | (4 | ) | 137 | ||||||||
| Net (loss) income applicable to common shareholders | $ | (77 | ) | $ | (79 | ) | $ | 23 | ||||
| Allstate Protection Plans (3) | $ | 60 | $ | 23 | $ | (22 | ) | |||||
| Allstate Dealer Services | 26 | 15 | (1 | ) | ||||||||
| Allstate Roadside Services | (15 | ) | (20 | ) | (17 | ) | ||||||
| Arity | (7 | ) | (11 | ) | (14 | ) | ||||||
| Allstate Identity Protection (4) | (26 | ) | 1 | — | ||||||||
| Adjusted net income (loss) | $ | 38 | $ | 8 | $ | (54 | ) | |||||
| Allstate Protection Plans | 99,632 | 68,588 | 38,719 | |||||||||
| Allstate Dealer Services | 4,205 | 4,338 | 4,088 | |||||||||
| Allstate Roadside Services | 599 | 663 | 699 | |||||||||
| Allstate Identity Protection | 1,511 | 1,040 | — | |||||||||
| Policies in force as of December 31 (in thousands) | 105,947 | 74,629 | 43,506 |
| (1) | Primarily related to Arity and Allstate Roadside Services and are eliminated in our consolidated financial statements. |
| (2) | 2018 related to organizational changes at Allstate Roadside Services and 2017 related to a one-time vendor contract termination. |
| (3) | SquareTrade, which sells consumer protection plans using the Allstate Protection Plans name in the U.S., acquired PlumChoice on November 30, 2018 and iCracked on February 12, 2019. |
| (4) | InfoArmor, which sells identity protection plans using the Allstate Identity Protection name was acquired on October 5, 2018. |
Service Businesses 2019 Form 10-K
Net loss applicable to common shareholders decreased 2.5% or $2 million in 2019 compared to 2018. 2019 results included a $55 million intangible asset impairment related to the change in trade name from SquareTrade to Allstate Protection Plans.
Adjusted net income increased $30 million in 2019 compared to 2018. The improvement in 2019 was primarily due to growth of Allstate Protection Plans, favorable loss experience of both Allstate Protection Plans and Allstate Dealer Services, partially offset by higher operating expenses related to investing in growth and developing new products and distribution channels for Allstate Protection Plans and Allstate Identity Protection.
Total revenues increased 25.1% or $331 million in 2019 compared to 2018, primarily due to Allstate Protection Plan’s growth through its U.S. retail and international channels, higher Allstate Identity Protection revenue due to its acquisition in fourth quarter 2018 and increased premiums earned on Allstate Dealer Services’ vehicle service contracts.
Premiums written increased 7.3% or $104 million in 2019 compared to 2018, primarily due to growth at Allstate Protection Plans and increased premiums written by Allstate Dealer Services, partially offset by declines in Allstate Roadside Services wholesale and retail business.
PIF increased 42.0% or 31 million in 2019 compared to 2018 due to continued growth at Allstate Protection Plans.
Intersegment premiums and service fees increased 26.2% or $32 million in 2019 compared to 2018, primarily related to increased auto connections and device sales through Arity’s device and mobile data collection services and analytic solutions.
Other revenue increased $106 million in 2019 compared to 2018, primarily due to the acquisition of Allstate Identity Protection and Allstate Protection Plans' acquisitions of PlumChoice and iCracked. All of the revenue from these acquired businesses is reported as other revenue. See Note 3 of the consolidated financial statements for further details.
Claims and claims expense increased 3.7% or $13 million in 2019 compared to 2018, primarily due to higher loss costs at Allstate Protection Plans driven by growth of the business, partially offset by improved loss experience at both Allstate Protection Plans and Allstate Dealer Services.
Amortization of DAC increased 17.3% or $80 million in 2019 compared to 2018. The increase is in line with the growth experienced at Allstate Protection Plans and Allstate Dealer Services.
Operating costs and expenses increased 30.9% or $156 million in 2019 compared to 2018, primarily due to the acquisitions of Allstate Identity Protection, PlumChoice and iCracked, product development costs, investments in growing Allstate Protection Plans and expanding Allstate Identity Protection.
Amortization and impairment of purchased intangibles relates to the acquisitions of Allstate Protection Plans in 2017 and Allstate Identity Protection in 2018. We recognized $486 million and $257 million of intangible assets subject to amortization for Allstate Protection Plans and Allstate Identity Protection, respectively. We recorded amortization expense of $122 million in 2019 compared to $94 million in 2018.
During 2019, we made the decision to phase-out the use of the SquareTrade trade name in the United States and sell consumer protection plans under the Allstate Protection Plans name. The SquareTrade trade name will continue to be used outside of the United States. This resulted in a $55 million impairment in 2019 of the intangible asset related to the trade name established in 2017 when SquareTrade was acquired.
The Allstate Corporation 61
2019 Form 10-K Claims and Claims Expense Reserves
Claims and Claims Expense Reserves
Underwriting results are significantly influenced by estimates of claims and claims expense reserves. For a description of our reserve process, see Note 8 of the consolidated financial statements. Further, for a description of our reserving policies and the potential variability in our reserve estimates, see the Application of Critical Accounting Estimates section of the MD&A. These reserves are an estimate of amounts necessary to settle all outstanding claims, including IBNR claims, as of the reporting date.
The facts and circumstances leading to reestimates of reserves relate to changes in claim activity and revisions to the development factors used to predict how losses are likely to develop from the end of a reporting period until all claims have been paid. Reestimates occur when actual losses differ from those predicted by the estimated development factors used in prior reserve estimates.
We believe the net loss reserves exposures are appropriately established based on available facts, technology, laws and regulations.
| Total reserves, net of recoverables (“net reserves”), as of December 31, by line of business | ||||||||||||
| ($ in millions) | 2019 | 2018 | 2017 | |||||||||
| Allstate brand | $ | 17,809 | $ | 17,272 | $ | 16,826 | ||||||
| Esurance brand | 941 | 862 | 777 | |||||||||
| Encompass brand | 646 | 691 | 758 | |||||||||
| Total Allstate Protection | 19,396 | 18,825 | 18,361 | |||||||||
| Discontinued Lines and Coverages | 1,365 | 1,391 | 1,407 | |||||||||
| Total Property-Liability | 20,761 | 20,216 | 19,768 | |||||||||
| Service Businesses | 39 | 52 | 86 | |||||||||
| Total net reserves | $ | 20,800 | $ | 20,268 | $ | 19,854 |
The year-end 2019 gross reserves of $27.71 billion for insurance claims and claims expense were $8.34 billion more than the net reserve balance of $19.37 billion recorded on the basis of statutory accounting practices for reports provided to state regulatory authorities. The principal differences are recoverables from third parties totaling $6.91 billion, including $5.46 billion of indemnification recoverables related to the Michigan Catastrophic Claims Association (“MCCA”), that reduce reserves for statutory reporting, but are
recorded as assets for GAAP reporting, and a liability for the reserves of the Canadian subsidiaries for $1.33 billion that are a component of our consolidated reserves, but not included in our U.S. statutory reserves. The tables below show net reserves representing the estimated cost of outstanding claims as they were recorded at the beginning of years 2019, 2018 and 2017, and the effect of reestimates in each year.
| Net reserves | ||||||||||||
| January 1 reserves | ||||||||||||
| ($ in millions) | 2019 | 2018 | 2017 | |||||||||
| Allstate brand | $ | 17,272 | $ | 16,826 | $ | 16,108 | ||||||
| Esurance brand | 862 | 777 | 740 | |||||||||
| Encompass brand | 691 | 758 | 749 | |||||||||
| Total Allstate Protection | 18,825 | 18,361 | 17,597 | |||||||||
| Discontinued Lines and Coverages | 1,391 | 1,407 | 1,445 | |||||||||
| Total Property-Liability | 20,216 | 19,768 | 19,042 | |||||||||
| Service Businesses | 52 | 86 | 24 | |||||||||
| Total net reserves | $ | 20,268 | $ | 19,854 | $ | 19,066 |
Claims and Claims Expense Reserves 2019 Form 10-K
| Impact of reserve reestimates by brand on combined ratio and net income applicable to common shareholders(1) (2) | |||||||||||||||||||||
| 2019 | 2018 | 2017 | |||||||||||||||||||
| ($ in millions, except ratios) | Reserve reestimate | Effect on combined ratio | Reserve reestimate | Effect on combined ratio | Reserve reestimate | Effect on combined ratio | |||||||||||||||
| Allstate brand | $ | (239 | ) | (0.7 | ) | $ | (332 | ) | (1.0 | ) | $ | (585 | ) | (1.8 | ) | ||||||
| Esurance brand | 3 | — | 3 | — | (2 | ) | — | ||||||||||||||
| Encompass brand | 3 | — | (11 | ) | — | (14 | ) | (0.1 | ) | ||||||||||||
| Total Allstate Protection | (233 | ) | (0.7 | ) | (340 | ) | (1.0 | ) | (601 | ) | (1.9 | ) | |||||||||
| Discontinued Lines and Coverages | 105 | 0.4 | 87 | 0.3 | 96 | 0.3 | |||||||||||||||
| Total Property-Liability | (128 | ) | (0.3 | ) | (253 | ) | (0.7 | ) | (505 | ) | (1.6 | ) | |||||||||
| Service Businesses | (2 | ) | — | (2 | ) | — | 2 | — | |||||||||||||
| Total | $ | (130 | ) | $ | (255 | ) | $ | (503 | ) | ||||||||||||
| Reserve reestimates, after-tax | $ | (103 | ) | $ | (201 | ) | $ | (327 | ) | ||||||||||||
| Consolidated net income applicable to common shareholders | $ | 4,678 | $ | 2,012 | $ | 3,438 | |||||||||||||||
| Reserve reestimates as a % impact on consolidated net income applicable to common shareholders | 2.2 | % | 10.0 | % | 9.5 | % | |||||||||||||||
| Property-Liability prior year reserve reestimates included in catastrophe losses | $ | 48 | $ | 25 | $ | (18 | ) |
| (1) | Favorable reserve reestimates are shown in parentheses. |
| (2) | Ratios are calculated using property and casualty premiums earned. |
The following tables reflect the accident years to which the reestimates shown above are applicable. Favorable reserve reestimates are shown in parentheses.
| 2019 prior year reserve reestimates | ||||||||||||||||||||||||
| ($ in millions) | 2014 & prior | 2015 | 2016 | 2017 | 2018 | Total | ||||||||||||||||||
| Allstate brand | $ | (133 | ) | $ | (44 | ) | $ | (25 | ) | $ | (96 | ) | $ | 59 | $ | (239 | ) | |||||||
| Esurance brand | (5 | ) | (2 | ) | (1 | ) | (3 | ) | 14 | 3 | ||||||||||||||
| Encompass brand | (2 | ) | 2 | (2 | ) | 4 | 1 | 3 | ||||||||||||||||
| Total Allstate Protection | (140 | ) | (44 | ) | (28 | ) | (95 | ) | 74 | (233 | ) | |||||||||||||
| Discontinued Lines and Coverages | 105 | — | — | — | — | 105 | ||||||||||||||||||
| Total Property-Liability | (35 | ) | (44 | ) | (28 | ) | (95 | ) | 74 | (128 | ) | |||||||||||||
| Service Businesses | — | — | — | — | (2 | ) | (2 | ) | ||||||||||||||||
| Total | $ | (35 | ) | $ | (44 | ) | $ | (28 | ) | $ | (95 | ) | $ | 72 | $ | (130 | ) |
| 2018 prior year reserve reestimates | ||||||||||||||||||||||||
| ($ in millions) | 2013 & prior | 2014 | 2015 | 2016 | 2017 | Total | ||||||||||||||||||
| Allstate brand | $ | (61 | ) | $ | (50 | ) | $ | (25 | ) | $ | (146 | ) | $ | (50 | ) | $ | (332 | ) | ||||||
| Esurance brand | (5 | ) | (6 | ) | 9 | 13 | (8 | ) | 3 | |||||||||||||||
| Encompass brand | (12 | ) | (11 | ) | (15 | ) | 1 | 26 | (11 | ) | ||||||||||||||
| Total Allstate Protection | (78 | ) | (67 | ) | (31 | ) | (132 | ) | (32 | ) | (340 | ) | ||||||||||||
| Discontinued Lines and Coverages | 87 | — | — | — | — | 87 | ||||||||||||||||||
| Total Property-Liability | 9 | (67 | ) | (31 | ) | (132 | ) | (32 | ) | (253 | ) | |||||||||||||
| Service Businesses | — | — | — | — | (2 | ) | (2 | ) | ||||||||||||||||
| Total | $ | 9 | $ | (67 | ) | $ | (31 | ) | $ | (132 | ) | $ | (34 | ) | $ | (255 | ) |
| 2017 prior year reserve reestimates | ||||||||||||||||||||||||
| ($ in millions) | 2012 & prior | 2013 | 2014 | 2015 | 2016 | Total | ||||||||||||||||||
| Allstate brand | $ | 3 | $ | (99 | ) | $ | (103 | ) | $ | (121 | ) | $ | (265 | ) | $ | (585 | ) | |||||||
| Esurance brand | (3 | ) | (1 | ) | (12 | ) | 1 | 13 | (2 | ) | ||||||||||||||
| Encompass brand | (6 | ) | (1 | ) | (4 | ) | (1 | ) | (2 | ) | (14 | ) | ||||||||||||
| Total Allstate Protection | (6 | ) | (101 | ) | (119 | ) | (121 | ) | (254 | ) | (601 | ) | ||||||||||||
| Discontinued Lines and Coverages | 96 | — | — | — | — | 96 | ||||||||||||||||||
| Total Property-Liability | 90 | (101 | ) | (119 | ) | (121 | ) | (254 | ) | (505 | ) | |||||||||||||
| Service Businesses | — | — | — | — | 2 | 2 | ||||||||||||||||||
| Total | $ | 90 | $ | (101 | ) | $ | (119 | ) | $ | (121 | ) | $ | (252 | ) | $ | (503 | ) |
The Allstate Corporation 63
2019 Form 10-K Claims and Claims Expense Reserves
Allstate Protection
The tables below show Allstate Protection net reserves representing the estimated cost of outstanding claims as they were recorded at the beginning of years 2019, 2018, and 2017, and the effect of reestimates in each year.
| Net reserves by line | ||||||||||||
| January 1 reserves | ||||||||||||
| ($ in millions) | 2019 | 2018 | 2017 | |||||||||
| Auto | $ | 14,378 | $ | 14,051 | $ | 13,530 | ||||||
| Homeowners | 2,157 | 2,205 | 1,990 | |||||||||
| Other personal lines | 1,489 | 1,489 | 1,456 | |||||||||
| Commercial lines | 801 | 616 | 621 | |||||||||
| Total Allstate Protection | $ | 18,825 | $ | 18,361 | $ | 17,597 |
| Impact of reserve reestimates by line on combined ratio and underwriting income | |||||||||||||||||||||
| 2019 | 2018 | 2017 | |||||||||||||||||||
| ($ in millions, except ratios) | Reserve reestimate | Effect on combined ratio | Reserve reestimate | Effect on combined ratio | Reserve reestimate | Effect on combined ratio | |||||||||||||||
| Auto | $ | (323 | ) | (0.9 | ) | $ | (455 | ) | (1.3 | ) | $ | (490 | ) | (1.6 | ) | ||||||
| Homeowners | 65 | 0.2 | 14 | — | (131 | ) | (0.4 | ) | |||||||||||||
| Other personal lines | 8 | — | (7 | ) | — | 1 | — | ||||||||||||||
| Commercial lines | 17 | — | 108 | 0.3 | 19 | 0.1 | |||||||||||||||
| Total Allstate Protection | $ | (233 | ) | (0.7 | ) | $ | (340 | ) | (1.0 | ) | $ | (601 | ) | (1.9 | ) | ||||||
| Underwriting income | $ | 2,912 | $ | 2,343 | $ | 2,304 | |||||||||||||||
| Reserve reestimates as a % impact on underwriting income | 8.0 | % | 14.5 | % | 26.1 | % |
Prior year reserve reestimates are developed based on factors that are calculated quarterly and periodically throughout the year for data elements such as claims reported and settled, paid losses and paid losses combined with case reserves. We use significant judgment and these data elements to make revisions to loss development factors that predict how losses are likely to develop from the end of a reporting period until all claims have been paid. When actual development of these data elements is different than the historical development pattern used in a prior period reserve estimate, reserves are revised as actuarial studies validate new trends based on the indications of updated development factor calculations. On-going claims organizational and process changes that are occurring are considered within our estimation process.
Favorable reserve reestimates for auto in 2019 primarily related to continued favorable personal lines auto injury coverage development, offset by strengthening in our homeowners lines. Auto liability claims process changes implemented in prior years, including a program requiring enhanced documentation of injuries and related medical
treatments, have resulted in favorable severity trends compared to those originally estimated as we continue to develop greater experience in settling claims under these programs. The impact of these program changes continues to moderate. Unfavorable results for homeowners lines in 2019 were primarily due to catastrophe development being higher than anticipated in previous estimates.
Favorable reserve reestimates for auto in 2018 primarily related to continued favorable personal lines auto injury coverage development, offset by strengthening in our commercial lines and personal injury protection (“PIP”) coverage, including an unfavorable ruling against the insurance industry related to Florida PIP. Unfavorable results for commercial lines in 2018 were primarily due to non-catastrophe auto loss development being higher than anticipated in previous estimates.
Estimating the ultimate cost of claims and claims expenses is an inherently uncertain and complex process involving a high degree of judgment and is subject to the evaluation of numerous variables.
Claims and Claims Expense Reserves 2019 Form 10-K
Discontinued Lines and Coverages
We conduct an annual review in the third quarter of each year to evaluate and establish asbestos, environmental and other discontinued lines reserves. Reserves are recorded in the reporting period in which they are determined. Using established industry and actuarial best practices and assuming no change in the
regulatory or economic environment, this detailed and comprehensive methodology determines reserves based on assessments of the characteristics of exposure (e.g. claim activity, potential liability, jurisdiction, products versus non-products exposure) presented by policyholders.
| Discontinued Lines and Coverages reserve reestimates | ||||||||||||||||||||||||
| 2019 | 2018 | 2017 | ||||||||||||||||||||||
| ($ in millions) | January 1 reserves | Reserve reestimate | January 1 reserves | Reserve reestimate | January 1 reserves | Reserve reestimate | ||||||||||||||||||
| Asbestos claims | $ | 866 | $ | 28 | $ | 884 | $ | 44 | $ | 912 | $ | 61 | ||||||||||||
| Environmental claims | 170 | 36 | 166 | 20 | 179 | 10 | ||||||||||||||||||
| Other discontinued lines | 355 | 41 | 357 | 23 | 354 | 25 | ||||||||||||||||||
| Total | $ | 1,391 | $ | 105 | $ | 1,407 | $ | 87 | $ | 1,445 | $ | 96 | ||||||||||||
| Underwriting loss | $ | (108 | ) | $ | (90 | ) | $ | (99 | ) |
Reserve additions for asbestos in 2019 were primarily related to new reported information and settlement agreements, including bankruptcy proceedings. Reserve additions for asbestos in 2018 were primarily related to new reported information, changes in our projections of reported claims and settlement agreements, including bankruptcy proceedings.
Reserve additions for environmental in 2019 were primarily related to the reporting of additional clean-up sites. Reserve additions for environmental in 2018 were primarily related to expected greater loss activity for future claims.
| Reserves and claim activity before (Gross) and after (Net) the effects of reinsurance | ||||||||||||||||||||||||
| 2019 | 2018 | 2017 | ||||||||||||||||||||||
| ($ in millions, except ratios) | Gross | Net | Gross | Net | Gross | Net | ||||||||||||||||||
| Asbestos claims | ||||||||||||||||||||||||
| Beginning reserves | $ | 1,266 | $ | 866 | $ | 1,296 | $ | 884 | $ | 1,356 | $ | 912 | ||||||||||||
| Incurred claims and claims expense | 39 | 28 | 89 | 44 | 79 | 61 | ||||||||||||||||||
| Claims and claims expense paid | (133 | ) | (84 | ) | (119 | ) | (62 | ) | (139 | ) | (89 | ) | ||||||||||||
| Ending reserves | $ | 1,172 | $ | 810 | $ | 1,266 | $ | 866 | $ | 1,296 | $ | 884 | ||||||||||||
| Annual survival ratio | 8.8 | 9.6 | 10.6 | 14.0 | 9.3 | 9.9 | ||||||||||||||||||
| 3-year survival ratio | 9.0 | 10.3 | 9.1 | 9.7 | 9.2 | 8.9 | ||||||||||||||||||
| Environmental claims | ||||||||||||||||||||||||
| Beginning reserves | $ | 209 | $ | 170 | $ | 199 | $ | 166 | $ | 219 | $ | 179 | ||||||||||||
| Incurred claims and claims expense | 42 | 36 | 30 | 20 | 9 | 10 | ||||||||||||||||||
| Claims and claims expense paid | (32 | ) | (27 | ) | (20 | ) | (16 | ) | (29 | ) | (23 | ) | ||||||||||||
| Ending reserves | $ | 219 | $ | 179 | $ | 209 | $ | 170 | $ | 199 | $ | 166 | ||||||||||||
| Annual survival ratio | 6.8 | 6.6 | 10.5 | 10.6 | 6.9 | 7.2 | ||||||||||||||||||
| 3-year survival ratio | 8.1 | 8.1 | 8.4 | 8.2 | 6.9 | 6.9 | ||||||||||||||||||
| Combined environmental and asbestos claims | ||||||||||||||||||||||||
| Annual survival ratio | 8.4 | 8.9 | 10.6 | 13.3 | 8.9 | 9.4 | ||||||||||||||||||
| 3-year survival ratio | 8.8 | 9.9 | 9.0 | 9.5 | 8.8 | 8.5 | ||||||||||||||||||
| Percentage of IBNR in ending reserves | 48.8 | % | 49.6 | % | 52.7 | % |
The survival ratio is calculated by taking our ending reserves divided by payments made during the year. This is a commonly used but simplistic and imprecise approach to measuring the adequacy of asbestos and environmental reserve levels. Many factors, such as mix of business, level of coverage provided and settlement procedures have significant impacts on the amount of environmental and asbestos
claims and claims expense reserves, claim payments and the resultant ratio. As payments result in corresponding reserve reductions, survival ratios can be expected to vary over time. In 2019 and 2018, the asbestos and environmental net 3-year survival ratio increased due to lower claim payments associated with settlement agreements.
The Allstate Corporation 65
2019 Form 10-K Claims and Claims Expense Reserves
| Net asbestos reserves by type of exposure and total reserve additions | ||||||||||||||||||||||||||||||
| December 31, 2019 | December 31, 2018 | December 31, 2017 | ||||||||||||||||||||||||||||
| ($ in millions) | Active policy-holders | Net reserves | % of reserves | Active policy-holders | Net reserves | % of reserves | Active policy-holders | Net reserves | % of reserves | |||||||||||||||||||||
| Direct policyholders: | ||||||||||||||||||||||||||||||
| Primary | 58 | $ | 12 | 1 | % | 51 | $ | 12 | 1 | % | 48 | $ | 10 | 1 | % | |||||||||||||||
| Excess | 299 | 292 | 36 | 295 | 309 | 36 | 296 | 308 | 35 | |||||||||||||||||||||
| Total case reserves | 357 | 304 | 37 | 346 | 321 | 37 | 344 | 318 | 36 | |||||||||||||||||||||
| Assumed reinsurance | 127 | 16 | 138 | 16 | 117 | 13 | ||||||||||||||||||||||||
| IBNR | 379 | 47 | 407 | 47 | 449 | 51 | ||||||||||||||||||||||||
| Total net reserves | $ | 810 | 100 | % | $ | 866 | 100 | % | $ | 884 | 100 | % | ||||||||||||||||||
| Total reserve additions | $ | 28 | $ | 44 | $ | 61 |
At December 31, 2019, there were 357 active policyholders with open asbestos claims.
| • | Active policyholders increased by 11 in 2019, including 16 policyholders reporting asbestos claims for the first time and the closing of all claims for 5 policyholders. |
| • | Active policyholders increased by 2 in 2018, including 13 policyholders reporting asbestos |
claims for the first time and the closing of all claims for 11 policyholders.
IBNR net reserves decreased $28 million as of December 31, 2019 compared to December 31, 2018. IBNR provides for reserve development of known claims and future reporting of additional unknown claims from current policyholders and ceding companies.
| Claims counts for asbestos and environmental exposures | |||||||||
| For the years ended December 31, | |||||||||
| Number of claims | 2019 | 2018 | 2017 | ||||||
| Asbestos | |||||||||
| Pending, beginning of year | 6,440 | 6,659 | 6,883 | ||||||
| New | 332 | 427 | 406 | ||||||
| Closed | (551 | ) | (646 | ) | (630 | ) | |||
| Pending, end of year | 6,221 | 6,440 | 6,659 | ||||||
| Closed without payment | 392 | 446 | 377 | ||||||
| Environmental | |||||||||
| Pending, beginning of year | 3,229 | 3,351 | 3,399 | ||||||
| New | 273 | 335 | 375 | ||||||
| Closed | (323 | ) | (457 | ) | (423 | ) | |||
| Pending, end of year | 3,179 | 3,229 | 3,351 | ||||||
| Closed without payment | 197 | 320 | 299 |
Reinsurance and indemnification programs We utilize reinsurance to reduce exposure to catastrophe risk and manage capital, and to support the required statutory surplus and the insurance financial strength ratings of certain subsidiaries such as Castle Key Insurance Company (“CKIC”) and Allstate New Jersey Insurance Company (“ANJ”). We purchase significant reinsurance to manage our aggregate countrywide exposure to an acceptable level. The price and terms of reinsurance and the credit quality of the reinsurer are considered in the purchase process, along with whether the price can be appropriately reflected in the costs that are considered in setting future rates
charged to policyholders. We have also purchased reinsurance to mitigate exposures in our long-tail liability lines, including environmental, asbestos and other discontinued lines as well as our commercial lines, including shared economy. We also participate in various indemnification mechanisms, including state-based industry pool or facility programs mandating participation by insurers offering certain coverage in their state and the federal government National Flood Insurance Program (“NFIP”). See Note 10 of the consolidated financial statements for additional details on these programs.
Claims and Claims Expense Reserves 2019 Form 10-K
| Reinsurance and indemnification recoverables, net of the allowance established for uncollectible amounts | ||||||||||
| S&P financial strength rating (1) | Reinsurance or indemnification recoverable on paid and unpaid claims, net | |||||||||
| ($ in millions) | 2019 | 2018 | ||||||||
| Indemnification programs | ||||||||||
| State-based industry pool or facility programs | ||||||||||
| MCCA (2) | N/A | $ | 5,499 | $ | 5,400 | |||||
| New Jersey Property-Liability Insurance Guaranty Association (“PLIGA”) | N/A | 446 | 461 | |||||||
| North Carolina Reinsurance Facility | N/A | 78 | 86 | |||||||
| Florida Hurricane Catastrophe Fund (“FHCF”) | N/A | 52 | 104 | |||||||
| Other | 9 | 9 | ||||||||
| Federal Government - NFIP | N/A | 25 | 31 | |||||||
| Subtotal | 6,109 | 6,091 | ||||||||
| Catastrophe reinsurance recoverables | ||||||||||
| Renaissance Reinsurance Limited | A+ | 27 | 65 | |||||||
| Swiss Reinsurance America Corporation | AA- | 15 | 39 | |||||||
| Everest Reinsurance Company | A+ | 15 | 33 | |||||||
| Other | 179 | 416 | ||||||||
| Subtotal | 236 | 553 | ||||||||
| Other reinsurance recoverables (3) | ||||||||||
| Lloyd’s of London (“Lloyd’s”) (4) | A+ | 158 | 165 | |||||||
| Aleka Insurance Inc. | N/A | 115 | 37 | |||||||
| Westport Insurance Corporation | AA- | 55 | 60 | |||||||
| TIG Insurance Company | N/A | 38 | 35 | |||||||
| Other, including allowance for future uncollectible recoverables | 293 | 307 | ||||||||
| Subtotal | 659 | 604 | ||||||||
| Total Property-Liability | 7,004 | 7,248 | ||||||||
| Service Businesses | 20 | 18 | ||||||||
| Total | $ | 7,024 | $ | 7,266 |
| (1) | N/A reflects no S&P Global Ratings (“S&P”) rating available. |
| (2) | As of December 31, 2019 and 2018, MCCA includes $39 million and $30 million of reinsurance recoverable on paid claims, respectively, and $5.46 billion and $5.37 billion of reinsurance recoverable on unpaid claims, respectively. |
| (3) | Other reinsurance recoverables primarily relate to asbestos, environmental and other liability exposures as well as commercial lines, including shared economy. |
| (4) | As of December 31, 2019, case reserves for Lloyd’s were 68% of the reinsurance recoverable for unpaid claims. |
Reinsurance and indemnification recoverables include an estimate of the amount of insurance claims and claims expense reserves that are ceded under the terms of the agreements, including incurred but not reported unpaid losses. We calculate our ceded reinsurance and indemnification estimates based on the terms of each applicable agreement, including an estimate of how IBNR losses will ultimately be ceded under the agreement. We also consider other limitations and coverage exclusions under our agreements. Accordingly, our estimate of recoverables is subject to similar risks and uncertainties as our estimate of reserves claims and claims expense. We believe the recoverables are appropriately established; however, as our underlying reserves continue to develop, the amount ultimately recoverable may vary from amounts currently recorded. We regularly evaluate the reinsurers and the respective amounts of our reinsurance recoverables, and a provision for uncollectible reinsurance recoverables is recorded, if needed. The establishment of reinsurance recoverables and the related allowance for
uncollectible reinsurance is also an inherently uncertain process involving estimates. Changes in estimates could result in additional changes to the Consolidated Statements of Operations.
Indemnification recoverables are considered collectible based on the industry pool and facility enabling legislation and the Company has not had any credit losses related to these programs and we do not anticipate losses in the foreseeable future. We also have not experienced credit losses on our catastrophe reinsurance programs, which include highly rated reinsurers.
The allowance for uncollectible reinsurance relates to other reinsurance programs primarily related to our Discontinued Lines and Coverages segment. This allowance was $60 million and $65 million as of December 31, 2019 and 2018, respectively. The allowance is based upon our ongoing review of amounts outstanding, length of collection periods, changes in reinsurer credit standing, and other relevant factors. In addition, in the ordinary course of
The Allstate Corporation 67
2019 Form 10-K Claims and Claims Expense Reserves
business, we may become involved in coverage disputes with certain of our reinsurers that may ultimately result in lawsuits and arbitrations brought by or against such reinsurers to determine the parties’ rights and obligations under the various reinsurance agreements. We employ dedicated specialists to manage reinsurance collections and disputes. We also consider recent developments in commutation activity between reinsurers and cedents, and recent trends in arbitration and litigation outcomes in disputes between cedents and reinsurers in seeking to maximize our reinsurance recoveries.
Adverse developments in the insurance industry have led to a decline in the financial strength of some of our reinsurance carriers, causing amounts recoverable from them and future claims ceded to them to be considered a higher risk. There has also been consolidation activity in the industry, which causes reinsurance risk across the industry to be concentrated among fewer companies.
For further details related to our reinsurance and indemnification recoverables, see the Regulation section in Part I and Note 10 of the consolidated financial statements.
| Effects of reinsurance ceded and indemnification programs on our premiums earned and claims and claims expense | |||||||||||||
| For the years ended December 31, | |||||||||||||
| ($ in millions) | 2019 | 2018 | 2017 | ||||||||||
| Allstate Protection - Premiums | |||||||||||||
| Indemnification programs | |||||||||||||
| State-based industry pool or facility programs | |||||||||||||
| MCCA | $ | 89 | $ | 77 | $ | 73 | |||||||
| PLIGA | 8 | 9 | 9 | ||||||||||
| FHCF | 9 | 10 | 11 | ||||||||||
| Other | 85 | 90 | 108 | ||||||||||
| Federal Government - NFIP | 258 | 258 | 263 | ||||||||||
| Catastrophe reinsurance | 377 | 344 | 344 | ||||||||||
| Other reinsurance programs | 121 | 54 | — | ||||||||||
| Total Allstate Protection | 947 | 842 | 808 | ||||||||||
| Discontinued Lines and Coverages | — | — | — | ||||||||||
| Total Property-Liability | 947 | 842 | 808 | ||||||||||
| Service Businesses | 175 | 174 | 163 | ||||||||||
| Total effect on premiums earned | $ | 1,122 | $ | 1,016 | $ | 971 | |||||||
| Allstate Protection - Claims | |||||||||||||
| Indemnification programs | |||||||||||||
| State-based industry pool or facility programs | |||||||||||||
| MCCA | $ | 208 | $ | 233 | $ | 410 | |||||||
| PLIGA | 3 | (6 | ) | 3 | |||||||||
| FHCF | 31 | 148 | 19 | ||||||||||
| Other | 67 | 90 | 89 | ||||||||||
| Federal Government - NFIP | 150 | 118 | 1,116 | ||||||||||
| Catastrophe reinsurance | (166 | ) | (1 | ) | 604 | 46 | |||||||
| Other reinsurance programs | 94 | 40 | — | ||||||||||
| Total Allstate Protection | 387 | 1,227 | 1,683 | ||||||||||
| Discontinued Lines and Coverages | 39 | 57 | 35 | ||||||||||
| Total Property-Liability | 426 | 1,284 | 1,718 | ||||||||||
| Service Businesses | 98 | 94 | 89 | ||||||||||
| Total effect on claims and claims expense | $ | 524 | $ | 1,378 | $ | 1,807 |
| (1) | Decline reflects reestimates in claims and claims expense related to the 2018 Camp Fire. |
In 2019 and 2018, ceded premiums earned increased primarily due to increased activity within our shared economy business and catastrophe reinsurance premium rates. In 2019, ceded claims and claims expenses decreased $854 million, primarily due to lower amounts related to the catastrophe reinsurance program, partially offset by increased activity with our shared economy business. In 2018, ceded claims and claims expenses decreased $429 million, primarily due to higher amounts related to NFIP in 2017.
Our claim reserve development experience is consistent with the MCCA’s overall experience with
reported and pending claims increasing in recent years. The MCCA has reported severity increasing with nearly 55% of reimbursements for attendant and residential care services. The Governor of Michigan signed new legislation on May 30, 2019 to reform Michigan’s no-fault auto insurance system. For further discussion of these items, see Regulation, Indemnification Programs and Note 10 of the consolidated financial statements.
Claims and Claims Expense Reserves 2019 Form 10-K
| Michigan personal injury protection reserve and claim activity before and after the effects of MCCA recoverables | ||||||||||||||||||||||||
| For the years ended December 31, | ||||||||||||||||||||||||
| 2019 | 2018 | 2017 | ||||||||||||||||||||||
| ($ in millions) | Gross | Net | Gross | Net | Gross | Net | ||||||||||||||||||
| Beginning reserves | $ | 5,975 | $ | 605 | $ | 5,799 | $ | 565 | $ | 5,443 | $ | 522 | ||||||||||||
| Incurred claims and claims expense-current year | 446 | 202 | 449 | 189 | 513 | 195 | ||||||||||||||||||
| Incurred claims and claims expense-prior years | (16 | ) | 20 | 9 | 35 | 117 | 25 | |||||||||||||||||
| Claims and claims expense paid-current year (1) | (55 | ) | (53 | ) | (52 | ) | (51 | ) | (54 | ) | (53 | ) | ||||||||||||
| Claims and claims expense paid-prior years (1) | (244 | ) | (127 | ) | (230 | ) | (133 | ) | (220 | ) | (124 | ) | ||||||||||||
| Ending reserves (2) | $ | 6,106 | $ | 647 | $ | 5,975 | $ | 605 | $ | 5,799 | $ | 565 |
| (1) | Paid claims and claims expenses reported in the table for the current and prior years, recovered from the MCCA totaled $119 million, $98 million and $97 million in 2019, 2018 and 2017, respectively. |
| (2) | Gross reserves for the year ended December 31, 2019, comprise 85% case reserves and 15% IBNR. Gross reserves for the year ended December 31, 2018, comprise 88% case reserves and 12% IBNR. Gross reserves for the year ended December 31, 2017 comprise 87% case reserves and 13% IBNR. The MCCA does not require member companies to report ultimate case reserves. |
Pending MCCA claims differ from most personal lines insurance pending claims as other personal lines policies have coverage limits and incurred claims settle in shorter periods. Claims are considered pending as long as payments are continuing pursuant to an outstanding MCCA claim, which can be for a claimant’s lifetime. Many of these injuries are catastrophic in
nature, resulting in serious permanent disabilities that require attendant and residential care for periods that may span decades. A significant portion of the ultimate incurred claim reserves and the recoverables can be attributed to a small number of catastrophic claims that occurred more than five years ago and continue to pay lifetime benefits.
| Pending, new and closed claims for Michigan personal injury protection exposures | |||||||||
| For the years ended December 31, | |||||||||
| Number of claims (1) | 2019 | 2018 | 2017 | ||||||
| Pending, beginning of year | 4,812 | 4,983 | 5,388 | ||||||
| New | 7,807 | 7,858 | 8,494 | ||||||
| Closed | (7,677 | ) | (8,029 | ) | (8,899 | ) | |||
| Pending, end of year | 4,942 | 4,812 | 4,983 |
| (1) | Total claims includes those covered and not covered by the MCCA indemnification. |
As of December 31, 2019, approximately 1,600 of our pending claims have been reported to the MCCA, of which approximately 55% represents claims that occurred more than 5 years ago. There are 73 Allstate brand claims with reserves in excess of $15 million as of December 31, 2019, which comprise approximately 32% of the gross ending reserves in the table above. As a result, significant developments with a single claimant can result in volatility in prior year incurred claims.
Intercompany reinsurance We enter into certain intercompany insurance and reinsurance transactions in order to maintain underwriting control and manage insurance risk among various legal entities. These reinsurance agreements have been approved by the appropriate regulatory authorities. All significant intercompany transactions have been eliminated in consolidation.
Catastrophe reinsurance Our catastrophe reinsurance program is designed to address our exposure to catastrophes nationwide, utilizing our risk management methodology. Our program is designed to provide reinsurance protection for catastrophes resulting from multiple perils including hurricanes, windstorms, hail, tornadoes, earthquakes, wildfires, and fires following earthquakes. These reinsurance agreements are part of our catastrophe management strategy, which is intended to provide our shareholders an acceptable return on the risks assumed in our property business, while providing protection to our customers.
We anticipate completing the placement of our 2020 nationwide catastrophe reinsurance program in the second quarter of 2020. We expect the program will be similar to our 2019 nationwide catastrophe reinsurance program but will evaluate opportunities to improve the economic terms and conditions. For further details of the existing 2019 program, see Note 10 of the consolidated financial statements.
The Allstate Corporation 69
2019 Form 10-K Allstate Life
Allstate Life Segment
Allstate Life offers traditional, interest-sensitive and variable life insurance. In 2019, Allstate Life represented 4.4% of total revenue, 1.3% of total PIF and 7.5% of total adjusted net income. Our target customers are middle market consumers with family and financial protection needs. For additional information on our strategy and outlook, see Part I, Item 1. Business - Strategy and Segment Information.
| Summarized financial information | ||||||||||||
| For the years ended December 31, | ||||||||||||
| ($ in millions) | 2019 | 2018 | 2017 | |||||||||
| Revenues | ||||||||||||
| Premiums and contract charges | $ | 1,343 | $ | 1,315 | $ | 1,280 | ||||||
| Other revenue | 125 | 119 | 114 | |||||||||
| Net investment income | 514 | 505 | 489 | |||||||||
| Realized capital gains and losses | 1 | (14 | ) | 5 | ||||||||
| Total revenues | 1,983 | 1,925 | 1,888 | |||||||||
| Costs and expenses | ||||||||||||
| Contract benefits | (855 | ) | (809 | ) | (765 | ) | ||||||
| Interest credited to contractholder funds | (299 | ) | (285 | ) | (282 | ) | ||||||
| Amortization of DAC | (173 | ) | (132 | ) | (134 | ) | ||||||
| Operating costs and expenses | (354 | ) | (361 | ) | (342 | ) | ||||||
| Restructuring and related charges | (2 | ) | (3 | ) | (2 | ) | ||||||
| Total costs and expenses | (1,683 | ) | (1,590 | ) | (1,525 | ) | ||||||
| Income tax (expense) benefit | (53 | ) | (75 | ) | 226 | |||||||
| Net income applicable to common shareholders | $ | 247 | $ | 260 | $ | 589 | ||||||
| Adjusted net income | $ | 261 | $ | 295 | $ | 259 | ||||||
| Realized capital gains and losses, after-tax | — | (11 | ) | 2 | ||||||||
| Valuation changes on embedded derivatives not hedged, after-tax | (9 | ) | — | — | ||||||||
| DAC and DSI amortization related to realized capital gains and losses and valuation changes on embedded derivatives not hedged, after-tax | (5 | ) | (8 | ) | (10 | ) | ||||||
| Tax Legislation (expense) benefit | — | (16 | ) | 338 | ||||||||
| Net income applicable to common shareholders | $ | 247 | $ | 260 | $ | 589 | ||||||
| Reserve for life-contingent contract benefits as of December 31 | $ | 2,736 | $ | 2,677 | $ | 2,636 | ||||||
| Contractholder funds as of December 31 | $ | 7,805 | $ | 7,656 | $ | 7,608 | ||||||
| Policies in force as of December 31 by distribution channel (in thousands) | ||||||||||||
| Allstate agencies | 1,816 | 1,831 | 1,822 | |||||||||
| Closed channels | 107 | 114 | 123 | |||||||||
| Total | 1,923 | 1,945 | 1,945 |
Net income applicable to common shareholders decreased 5.0% or $13 million in 2019 compared to 2018. 2018 results include a tax expense of $16 million related to the Tax Legislation.
Adjusted net income decreased 11.5% or $34 million in 2019 compared to 2018, primarily due to higher amortization of DAC related to our annual review of assumptions and higher contract benefits, partially
offset by higher premiums and net investment income, and lower operating costs and expenses.
Premiums and contract charges increased 2.1% or $28 million in 2019 compared to 2018, primarily due to growth in traditional life insurance. Approximately 85% of Allstate Life’s traditional life insurance premium relates to term life insurance products.
| Premiums and contract charges by product | ||||||||||||
| For the years ended December 31, | ||||||||||||
| ($ in millions) | 2019 | 2018 | 2017 | |||||||||
| Traditional life insurance premiums | $ | 630 | $ | 600 | $ | 568 | ||||||
| Accident and health insurance premiums | 2 | 2 | 2 | |||||||||
| Interest-sensitive life insurance contract charges (1) | 711 | 713 | 710 | |||||||||
| Premiums and contract charges | $ | 1,343 | $ | 1,315 | $ | 1,280 |
| (1) | Contract charges related to the cost of insurance totaled $499 million, $493 million and $487 million in 2019, 2018 and 2017, respectively. |
Allstate Life 2019 Form 10-K
Other revenue increased 5.0% or $6 million in 2019 compared to 2018, primarily due to higher gross dealer concessions earned on Allstate agencies’ sales of non-proprietary fixed and variable annuities, and mutual funds.
Contract benefits increased 5.7% or $46 million in 2019 compared to 2018, primarily due to higher claim experience on interest-sensitive life insurance, partially offset by a favorable change associated with the annual review of assumptions.
Our annual review of assumptions in 2019 resulted in a $5 million decrease in reserves primarily for secondary guarantees on interest-sensitive life insurance due to utilizing more refined policy level information and assumptions. In 2018, the review resulted in a $1 million increase in reserves, primarily for secondary guarantees on interest-sensitive life insurance due to higher than anticipated policyholder persistency.
Benefit spread reflects our mortality and morbidity results using the difference between premiums and contract charges earned for the cost of insurance and contract benefits (“benefit spread”). Benefit spread decreased 3.5% to $276 million in 2019 compared to $286 million in 2018, primarily due to higher claim experience on interest-sensitive life insurance, partially offset by growth in traditional life insurance premiums.
Interest credited to contractholder funds increased 4.9% or $14 million in 2019 compared to 2018. Valuation changes on derivatives embedded in equity-indexed universal life contracts that are not hedged increased interest credited to contractholder funds by $11 million in 2019 compared to zero in 2018.
Investment spread reflects the difference between net investment income and interest credited to contractholder funds (“investment spread”) and is used to analyze the impact of net investment income and interest credited to contractholder funds on net income.
| Investment spread | ||||||||||||
| For the years ended December 31, | ||||||||||||
| ($ in millions) | 2019 | 2018 | 2017 | |||||||||
| Investment spread before valuation changes on embedded derivatives not hedged | $ | 226 | $ | 220 | $ | 207 | ||||||
| Valuation changes on derivatives embedded in equity-indexed universal life contracts that are not hedged | (11 | ) | — | — | ||||||||
| Total investment spread | $ | 215 | $ | 220 | $ | 207 |
Investment spread before valuation changes on embedded derivatives not hedged increased 2.7% in 2019 compared to 2018, primarily due to higher net investment income, partially offset by higher credited interest.
Amortization of DAC increased 31.1% or $41 million in 2019 compared to 2018, primarily due to higher amortization acceleration for changes in assumptions, partially offset by lower gross profits on interest-sensitive life insurance.
| Components of amortization of DAC | ||||||||||||
| For the years ended December 31, | ||||||||||||
| ($ in millions) | 2019 | 2018 | 2017 | |||||||||
| Amortization of DAC before amortization relating to realized capital gains and losses, valuation changes on embedded derivatives that are not hedged and changes in assumptions | $ | 109 | $ | 117 | $ | 134 | ||||||
| Amortization relating to realized capital gains and losses (1) and valuation changes on embedded derivatives that are not hedged | 6 | 10 | 14 | |||||||||
| Amortization acceleration (deceleration) for changes in assumptions (‘‘DAC unlocking’’) | 58 | 5 | (14 | ) | ||||||||
| Total amortization of DAC | $ | 173 | $ | 132 | $ | 134 |
| (1) | The impact of realized capital gains and losses on amortization of DAC is dependent upon the relationship between the assets that give rise to the gain or loss and the product liability supported by the assets. Fluctuations result from changes in the impact of realized capital gains and losses on actual and expected gross profits. |
Our annual comprehensive review of assumptions underlying estimated future gross profits for our interest-sensitive life contracts covers assumptions for mortality, persistency, expenses, investment returns, including capital gains and losses, interest crediting rates to policyholders, and the effect of any hedges. An assessment is made of future projections to ensure the reported DAC balances reflect current expectations.
In 2019, the review resulted in an acceleration of DAC amortization (decrease to income) of $58 million. DAC amortization acceleration primarily related to the
investment margin component of estimated gross profits and was due to lower projected future interest rates and investment returns compared to our previous expectations. The acceleration related to benefit margin was due to decreased projected interest rates that result in lower projected policyholder account values which increases benefits on guaranteed products and more refined policy level information and assumptions.
In 2018, the review resulted in an acceleration of DAC amortization (decrease to income) of $5 million. DAC amortization acceleration primarily related to the
The Allstate Corporation 71
2019 Form 10-K Allstate Life
investment margin component of estimated gross profits and was due to lower projected investment returns. This was partially offset by DAC amortization deceleration (increase to income) for changes in the
benefit margin due to a decrease in projected mortality.
| Changes in DAC | ||||||||||||||||||||||||
| ($ in millions) | Traditional life and accident and health | Interest-sensitive life insurance | Total | |||||||||||||||||||||
| For the years ended December 31, | ||||||||||||||||||||||||
| 2019 | 2018 | 2019 | 2018 | 2019 | 2018 | |||||||||||||||||||
| Balance, beginning of year | $ | 489 | $ | 465 | $ | 811 | $ | 687 | $ | 1,300 | $ | 1,152 | ||||||||||||
| Acquisition costs deferred | 63 | 65 | 60 | 65 | 123 | 130 | ||||||||||||||||||
| Amortization of DAC before amortization relating to realized capital gains and losses, valuation changes on embedded derivatives that are not hedged and changes in assumptions (1) | (44 | ) | (41 | ) | (65 | ) | (76 | ) | (109 | ) | (117 | ) | ||||||||||||
| Amortization relating to realized capital gains and losses (1) and valuation changes on embedded derivatives that are not hedged | — | — | (6 | ) | (10 | ) | (6 | ) | (10 | ) | ||||||||||||||
| Amortization (acceleration) deceleration for changes in assumptions (“DAC unlocking”) (1) | — | — | (58 | ) | (5 | ) | (58 | ) | (5 | ) | ||||||||||||||
| Effect of unrealized capital gains and losses (2) | — | — | (171 | ) | 150 | (171 | ) | 150 | ||||||||||||||||
| Ending balance | $ | 508 | $ | 489 | $ | 571 | $ | 811 | $ | 1,079 | $ | 1,300 |
| (1) | Included as a component of amortization of DAC on the Consolidated Statements of Operations. |
| (2) | Represents the change in the DAC adjustment for unrealized capital gains and losses. The DAC adjustment represents the amount by which the amortization of DAC would increase or decrease if the unrealized gains and losses in the respective product portfolios were realized. |
Operating costs and expenses decreased 1.9% or $7 million in 2019 compared to 2018, primarily due to lower employee-related expenses, partially offset by higher commissions on non-proprietary product sales.
Analysis of reserves and contractholder funds
| Reserve for life-contingent contract benefits | ||||||||
| For the years ended December 31, | ||||||||
| ($ in millions) | 2019 | 2018 | ||||||
| Traditional life insurance | $ | 2,612 | $ | 2,539 | ||||
| Accident and health insurance | 124 | 138 | ||||||
| Reserve for life-contingent contract benefits | $ | 2,736 | $ | 2,677 |
Allstate Life 2019 Form 10-K
Contractholder funds represent interest-bearing liabilities arising from the sale of products such as interest-sensitive life insurance. The balance of contractholder funds is equal to the cumulative deposits received and interest credited to the contractholder less cumulative contract benefits, surrenders, withdrawals and contract charges for mortality or administrative expenses.
| Change in contractholder funds | ||||||||||||
| For the years ended December 31, | ||||||||||||
| ($ in millions) | 2019 | 2018 | 2017 | |||||||||
| Contractholder funds, beginning balance | $ | 7,656 | $ | 7,608 | $ | 7,464 | ||||||
| Deposits | 949 | 965 | 973 | |||||||||
| Interest credited | 298 | 284 | 282 | |||||||||
| Benefits, withdrawals and other adjustments | ||||||||||||
| Benefits | (233 | ) | (232 | ) | (241 | ) | ||||||
| Surrenders and partial withdrawals | (261 | ) | (259 | ) | (254 | ) | ||||||
| Contract charges | (702 | ) | (704 | ) | (704 | ) | ||||||
| Net transfers from separate accounts | 10 | 6 | 4 | |||||||||
| Other adjustments (1) | 88 | (12 | ) | 84 | ||||||||
| Total benefits, withdrawals and other adjustments | (1,098 | ) | (1,201 | ) | (1,111 | ) | ||||||
| Contractholder funds, ending balance | $ | 7,805 | $ | 7,656 | $ | 7,608 |
| (1) | The table above illustrates the changes in contractholder funds, which are presented gross of reinsurance recoverables on the Consolidated Statements of Financial Position. The table above is intended to supplement our discussion and analysis of revenues, which are presented net of reinsurance on the Consolidated Statements of Operations. As a result, the net change in contractholder funds associated with products reinsured is reflected as a component of the other adjustments line. |
Contractholder deposits decreased 1.7% in 2019 compared to 2018. The weighted average guaranteed crediting rate and weighted average current crediting rate for our interest-sensitive life insurance contracts, excluding variable life, are both 3.9% as of December 31, 2019.
The Allstate Corporation 73
2019 Form 10-K Allstate Life
Allstate Life reinsurance ceded
In the normal course of business, we seek to limit aggregate and single exposure to losses on large risks by purchasing reinsurance. In addition, we have used reinsurance to effect the disposition of certain blocks of business.
We retain primary liability as a direct insurer for all risks ceded to reinsurers. As of December 31, 2019, approximately 13% of our face amount of life insurance in force was reinsured.
| Reinsurance recoverables by reinsurer | ||||||||||
| S&P financial strength rating (1) | Reinsurance recoverable on paid and unpaid benefits | |||||||||
| For the years ended December 31, | ||||||||||
| ($ in millions) | 2019 | 2018 | ||||||||
| RGA Reinsurance Company | AA- | $ | 197 | $ | 210 | |||||
| Swiss Re Life and Health America, Inc. | AA- | 155 | 156 | |||||||
| Munich American Reassurance | AA- | 80 | 87 | |||||||
| Transamerica Life Group | AA- | 75 | 76 | |||||||
| Scottish Re (U.S.), Inc. (2) | N/A | 70 | 66 | |||||||
| John Hancock Life & Health Insurance Company | AA- | 50 | 53 | |||||||
| Triton Insurance Company (3) | N/A | 43 | 45 | |||||||
| American Health & Life Insurance Co. (3) | N/A | 32 | 34 | |||||||
| Lincoln National Life Insurance | AA- | 27 | 25 | |||||||
| Security Life of Denver | A+ | 23 | 24 | |||||||
| SCOR Global Life | AA- | 14 | 14 | |||||||
| American United Life Insurance Company | AA- | 11 | 13 | |||||||
| Other (4) | 17 | 20 | ||||||||
| Total | $ | 794 | $ | 823 |
| (1) | N/A reflects no S&P rating available. |
| (2) | In December 2018, the Delaware Insurance Commissioner placed Scottish Re (U.S.), Inc. under regulatory supervision and in March 2019, the reinsurer was placed in rehabilitation. We have been permitted to exercise certain setoff rights while the parties address any potential disputes. See Note 10 of the consolidated financial statements for further details. |
| (3) | A.M. Best rating is B++. |
| (4) | As of December 31, 2019 and 2018, the other category includes $12 million and $9 million, respectively, of recoverables due from reinsurers rated A- or better by S&P. |
We continuously monitor the creditworthiness of reinsurers in order to determine our risk of recoverability on an individual and aggregate basis, and a provision for uncollectible reinsurance is recorded if needed. No amounts have been deemed unrecoverable in the three-years ended December 31, 2019, except for an allowance related to Scottish Re (U.S.), Inc. that was established in 2019.
We enter into certain intercompany reinsurance transactions for the Allstate Life operations in order to maintain underwriting control and manage insurance risk among various legal entities. These reinsurance agreements have been approved by the appropriate regulatory authorities. All significant intercompany transactions have been eliminated in consolidation.
Allstate Benefits 2019 Form 10-K
Allstate Benefits Segment

Allstate Benefits offers voluntary benefits products, including life, accident, critical illness, short-term disability and other health products. In 2019, Allstate Benefits represented 2.8% of total revenue, 2.9% of total PIF and 3.3% of total adjusted net income. Our target customers are middle market consumers with family and financial protection needs. For additional information on our strategy and outlook, see Part I, Item 1. Business - Strategy and Segment Information.
| Summarized financial information | ||||||||||||
| For the years ended December 31, | ||||||||||||
| ($ in millions) | 2019 | 2018 | 2017 | |||||||||
| Revenues | ||||||||||||
| Premiums and contract charges | $ | 1,145 | $ | 1,135 | $ | 1,084 | ||||||
| Net investment income | 83 | 77 | 72 | |||||||||
| Realized capital gains and losses | 12 | (9 | ) | 1 | ||||||||
| Total revenues | 1,240 | 1,203 | 1,157 | |||||||||
| Costs and expenses | ||||||||||||
| Contract benefits | (601 | ) | (595 | ) | (564 | ) | ||||||
| Interest credited to contractholder funds | (34 | ) | (35 | ) | (35 | ) | ||||||
| Amortization of DAC | (161 | ) | (145 | ) | (142 | ) | ||||||
| Operating costs and expenses | (285 | ) | (278 | ) | (258 | ) | ||||||
| Restructuring and related charges | — | — | (3 | ) | ||||||||
| Total costs and expenses | (1,081 | ) | (1,053 | ) | (1,002 | ) | ||||||
| Income tax expense | (35 | ) | (32 | ) | (1 | ) | ||||||
| Net income applicable to common shareholders | $ | 124 | $ | 118 | $ | 154 | ||||||
| Adjusted net income | $ | 115 | $ | 124 | $ | 100 | ||||||
| Realized capital gains and losses, after-tax | 9 | (7 | ) | — | ||||||||
| DAC and DSI amortization related to realized capital gains and losses, after-tax | — | 1 | — | |||||||||
| Tax Legislation benefit | — | — | 54 | |||||||||
| Net income applicable to common shareholders | $ | 124 | $ | 118 | $ | 154 | ||||||
| Benefit ratio (1) | 52.5 | 52.4 | 52.0 | |||||||||
| Operating expense ratio (2) | 24.9 | 24.5 | 23.8 | |||||||||
| Reserve for life-contingent contract benefits as of December 31 | $ | 1,034 | $ | 1,007 | $ | 979 | ||||||
| Contractholder funds as of December 31 | $ | 915 | $ | 898 | $ | 890 | ||||||
| Policies in force as of December 31 (in thousands) | 4,183 | 4,208 | 4,033 |
| (1) | Benefit ratio is calculated as contract benefits divided by premiums and contract charges. |
| (2) | Operating expense ratio is calculated as operating costs and expenses divided by premiums and contract charges. |
Net income applicable to common shareholders increased 5.1% or $6 million in 2019 compared to 2018.
Adjusted net income decreased 7.3% or $9 million in 2019 compared to 2018, primarily due to higher DAC amortization related primarily to the non-renewal of a large underperforming account and increased operating costs and expenses, partially offset by higher premiums.
Premiums and contract charges increased 0.9% or $10 million in 2019 compared to 2018, primarily related to growth in hospital indemnity (included in other health), critical illness and life products.
The Allstate Corporation 75
2019 Form 10-K Allstate Benefits
| Premiums and contract charges by product | ||||||||||||
| For the years ended December 31, | ||||||||||||
| ($ in millions) | 2019 | 2018 | 2017 | |||||||||
| Life | $ | 157 | $ | 155 | $ | 155 | ||||||
| Accident | 298 | 297 | 280 | |||||||||
| Critical illness | 479 | 476 | 468 | |||||||||
| Short-term disability | 107 | 108 | 102 | |||||||||
| Other health | 104 | 99 | 79 | |||||||||
| Premiums and contract charges | $ | 1,145 | $ | 1,135 | $ | 1,084 |
New annualized premium sales (annualized premiums at initial customer enrollment) decreased 4.4% to $372 million in 2019 and decreased 12.4% to $389 million in 2018. The decrease in 2019 relates to increased competition and higher initial enrollments for certain accounts in the prior year.
Contract benefits increased 1.0% or $6 million in 2019 compared to 2018, primarily due to higher claim experience on critical illness and disability products, partially offset by favorable mortality experience on life products.
Benefit ratio increased to 52.5 in 2019 compared to 52.4 in 2018 due to higher claim experience on critical illness and disability products, partially offset by
favorable mortality experience on life products and improved claims experience on other health products.
Amortization of DAC increased 11.0% or $16 million in 2019 compared to 2018, primarily due to DAC amortization related to the non-renewal of a large underperforming account and an unfavorable adjustment associated with our annual review of assumptions.
Our annual comprehensive review of assumptions underlying estimated future gross profits for our interest-sensitive life contracts resulted in an acceleration of DAC amortization (decrease to income) of $2 million in 2019 compared to a deceleration of DAC amortization (increase to income) of $4 million in 2018.
| Changes in DAC | ||||||||
| For the years ended | ||||||||
| ($ in millions) | 2019 | 2018 | ||||||
| Balance, beginning of year | $ | 549 | $ | 542 | ||||
| Acquisition costs deferred | 142 | 150 | ||||||
| Amortization of DAC before amortization relating to changes in assumptions (1) | (159 | ) | (150 | ) | ||||
| Amortization relating to realized capital gains and losses (1) | — | 1 | ||||||
| Amortization deceleration (acceleration) for changes in assumptions (“DAC unlocking”) (1) | (2 | ) | 4 | |||||
| Effect of unrealized capital gains and losses (2) | (3 | ) | 2 | |||||
| Ending balance | $ | 527 | $ | 549 |
| (1) | Included as a component of amortization of DAC on the Consolidated Statements of Operations. |
| (2) | Represents the change in the DAC adjustment for unrealized capital gains and losses. The DAC adjustment represents the amount by which the amortization of DAC would increase or decrease if the unrealized gains and losses in the respective product portfolios were realized. |
| Operating costs and expenses | ||||||||||||
| For the years ended December 31, | ||||||||||||
| ($ in millions) | 2019 | 2018 | 2017 | |||||||||
| Non-deferrable commissions | $ | 104 | $ | 109 | $ | 98 | ||||||
| General and administrative expenses | 181 | 169 | 160 | |||||||||
| Total operating costs and expenses | $ | 285 | $ | 278 | $ | 258 |
Operating costs and expenses increased 2.5% or $7 million in 2019 compared to 2018, primarily due to higher technology and employee-related costs.
Operating expense ratio increased to 24.9 in 2019 compared to 24.5 in 2018, primarily due to higher investment in technology.
Analysis of reserves
| Reserve for life-contingent contract benefits | ||||||||
| For the years ended December 31, | ||||||||
| ($ in millions) | 2019 | 2018 | ||||||
| Traditional life insurance | $ | 285 | $ | 269 | ||||
| Accident and health insurance | 749 | 738 | ||||||
| Reserve for life-contingent contract benefits | $ | 1,034 | $ | 1,007 |
Allstate Benefits 2019 Form 10-K
Allstate Benefits reinsurance ceded
The vast majority of reinsurance relates to the disposition of long-term care and other closed blocks of business several years ago. We retain primary liability as a direct insurer for all risks ceded to reinsurers.
| Reinsurance recoverables by reinsurer | ||||||||||
| S&P financial strength rating | Reinsurance recoverable on paid and unpaid benefits | |||||||||
| For the years ended December 31, | ||||||||||
| ($ in millions) | 2019 | 2018 | ||||||||
| Mutual of Omaha Insurance | AA- | $ | 64 | $ | 71 | |||||
| General Re Life Corporation | AA+ | 18 | 19 | |||||||
| Other (1) | 6 | 5 | ||||||||
| Total | $ | 88 | $ | 95 |
| (1) | As of both December 31, 2019 and 2018, the other category includes $4 million of recoverables due from reinsurers rated A- or better by S&P. |
We continuously monitor the creditworthiness of reinsurers in order to determine our risk of recoverability on an individual and aggregate basis, and a provision for uncollectible reinsurance is recorded if needed. No amounts have been deemed unrecoverable in the three-years ended December 31, 2019.
We enter into certain intercompany reinsurance transactions for the Allstate Benefits operations in order to maintain underwriting control and manage insurance risk among various legal entities. These reinsurance agreements have been approved by the appropriate regulatory authorities. All significant intercompany transactions have been eliminated in consolidation.
The Allstate Corporation 77
2019 Form 10-K Allstate Annuities
Allstate Annuities Segment
Allstate Annuities consists primarily of deferred fixed annuities and immediate fixed annuities (including standard and sub-standard structured settlements). In 2019, Allstate Annuities represented 2.9% of total revenue, 0.1% of total PIF and 0.3% of total adjusted net income. We discontinued the sale of proprietary annuities over an eight-year period from 2006 to 2014, reflecting our expectations of declining returns. This segment is in run-off, and we manage it with a focus on increasing economic value through our investment strategy. For additional information on our strategy and outlook, see Part I, Item 1. Business - Strategy and Segment Information.
| Summarized financial information | ||||||||||||
| For the years ended December 31, | ||||||||||||
| ($ in millions) | 2019 | 2018 | 2017 | |||||||||
| Revenues | ||||||||||||
| Contract charges | $ | 13 | $ | 15 | $ | 14 | ||||||
| Net investment income | 917 | 1,096 | 1,305 | |||||||||
| Realized capital gains and losses | 346 | (166 | ) | 44 | ||||||||
| Total revenues | 1,276 | 945 | 1,363 | |||||||||
| Costs and expenses | ||||||||||||
| Contract benefits | (583 | ) | (569 | ) | (594 | ) | ||||||
| Interest credited to contractholder funds | (307 | ) | (334 | ) | (373 | ) | ||||||
| Amortization of DAC | (7 | ) | (7 | ) | (7 | ) | ||||||
| Operating costs and expenses | (29 | ) | (31 | ) | (34 | ) | ||||||
| Restructuring and related charges | (1 | ) | — | — | ||||||||
| Total costs and expenses | (927 | ) | (941 | ) | (1,008 | ) | ||||||
| Gain on disposition of operations | 6 | 6 | 6 | |||||||||
| Income tax (expense) benefit | (73 | ) | 66 | 58 | ||||||||
| Net income applicable to common shareholders | $ | 282 | $ | 76 | $ | 419 | ||||||
| Adjusted net income | $ | 10 | $ | 131 | $ | 205 | ||||||
| Realized capital gains and losses, after-tax | 274 | (131 | ) | 28 | ||||||||
| Valuation changes on embedded derivatives not hedged, after-tax | (6 | ) | 3 | — | ||||||||
| Gain on disposition of operations, after-tax | 4 | 4 | 4 | |||||||||
| Tax Legislation benefit | — | 69 | 182 | |||||||||
| Net income applicable to common shareholders | $ | 282 | $ | 76 | $ | 419 | ||||||
| Reserve for life-contingent contract benefits as of December 31 | $ | 8,530 | $ | 8,524 | $ | 8,934 | ||||||
| Contractholder funds as of December 31 | $ | 8,972 | $ | 9,817 | $ | 10,936 | ||||||
| Policies in force as of December 31 (in thousands) | ||||||||||||
| Deferred annuities | 114 | 127 | 142 | |||||||||
| Immediate annuities | 78 | 84 | 89 | |||||||||
| Total | 192 | 211 | 231 |
Net income applicable to common shareholders increased $206 million in 2019 compared to 2018. 2018 results include a tax benefit of $69 million related to the Tax Legislation.
Adjusted net income decreased $121 million in 2019 compared to 2018, primarily due to lower net investment income, partially offset by lower interest credited to contractholder funds.
Net investment income decreased 16.3% or $179 million in 2019 compared to 2018, primarily due to lower performance-based investment results, mainly from limited partnerships, and lower average investment balances. 2019 performance-based investment results included lower valuations in the fourth quarter, on two private equity investments totaling $37 million.
The investment portfolio supporting immediate annuities is managed to ensure the assets match the characteristics of the liabilities and provide the long-term returns needed to support this business. To better match the long-term nature of our immediate annuities, we use performance-based investments in which we have ownership interests, and a greater proportion of return is derived from idiosyncratic asset or operating performance. Performance-based income can vary significantly between periods and is influenced by economic conditions, equity market performance, comparable public company earnings multiples, capitalization rates, operating performance of the underlying investments and the timing of asset sales.
Allstate Annuities 2019 Form 10-K
Net realized capital gains in 2019 primarily related to increased valuation of equity investments and gains on sales of fixed income securities. Net realized capital losses in 2018 primarily related to decreased valuation of equity investments and losses on sales of fixed income securities.
Contract benefits increased 2.5% or $14 million in 2019 compared to 2018, primarily due to worse immediate annuity mortality experience, partially offset by lower implied interest on immediate annuities with life contingencies.
Our annual review of assumptions in 2019 resulted in no adjustment to reserves for guaranteed benefits. In 2018, the review resulted in a $2 million increase in reserves primarily for guaranteed withdrawal benefits on equity-indexed annuities due to higher projected guaranteed benefits.
As of December 31, 2019 and 2018, our premium deficiency and profits followed by losses evaluations for our immediate annuities with life contingencies concluded that no adjustments were required to be recognized. For further detail on these evaluations, see Reserve for life-contingent contract benefits estimation in the Application of Critical Accounting Estimates section.
Benefit spread reflects our mortality results using the difference between contract charges earned and contract benefits excluding the portion related to the implied interest on immediate annuities with life contingencies. This implied interest totaled $479 million and $492 million in 2019 and 2018, respectively. Total benefit spread was $(95) million and $(68) million in 2019 and 2018, respectively.
Interest credited to contractholder funds decreased 8.1% or $27 million in 2019 compared to 2018, primarily due to lower average contractholder funds. Valuation changes on derivatives embedded in equity-indexed annuity contracts that are not hedged increased interest credited to contractholder funds by $8 million in 2019 compared to a decrease of $3 million in 2018.
Investment spread reflects the difference between net investment income and the sum of interest credited to contractholder funds and the implied interest on immediate annuities with life contingencies, which is included as a component of contract benefits and is used to analyze the impact of net investment income and interest credited to contractholders on net income.
| Investment spread | ||||||||||||
| For the years ended December 31, | ||||||||||||
| ($ in millions) | 2019 | 2018 | 2017 | |||||||||
| Investment spread before valuation changes on embedded derivatives not hedged | $ | 139 | $ | 267 | $ | 432 | ||||||
| Valuation changes on derivatives embedded in equity-indexed annuity contracts that are not hedged | (8 | ) | 3 | (1 | ) | |||||||
| Total investment spread | $ | 131 | $ | 270 | $ | 431 |
Investment spread before valuation changes on embedded derivatives not hedged decreased 47.9% or $128 million in 2019 compared to 2018, primarily due to lower investment income, mainly from limited partnership interests, partially offset by lower interest credited to contractholder funds.
To further analyze investment spreads, the following table summarizes the weighted average investment yield on assets supporting product liabilities, interest crediting rates and investment spreads. Investment spreads may vary significantly between periods due to the variability in investment income, particularly for immediate fixed annuities where the investment portfolio includes performance-based investments.
| Analysis of investment spread | |||||||||||||||||||||||||||
| Weighted average investment yield | Weighted average interest crediting rate | Weighted average investment spreads | |||||||||||||||||||||||||
| 2019 | 2018 | 2017 | 2019 | 2018 | 2017 | 2019 | 2018 | 2017 | |||||||||||||||||||
| Deferred fixed annuities | 4.3 | % | 4.1 | % | 4.2 | % | 2.7 | % | 2.8 | % | 2.8 | % | 1.6 | % | 1.3 | % | 1.4 | % | |||||||||
| Immediate fixed annuities with and without life contingencies | 5.0 | 6.4 | 8.0 | 5.9 | 6.0 | 6.0 | (0.9 | ) | 0.4 | 2.0 |
The Allstate Corporation 79
2019 Form 10-K Allstate Annuities
The following table summarizes the weighted average guaranteed crediting rates and weighted average current crediting rates as of December 31, 2019 for certain fixed annuities where management has the ability to change the crediting rate, subject to a contractual minimum. Other products, including equity-indexed, variable and immediate annuities totaling $4.12 billion of contractholder funds, have been excluded from the analysis because management does not have the ability to change the crediting rate or the minimum crediting rate is not considered meaningful in this context.
| Weighted average guaranteed crediting rates and weighted average current crediting rates | ||||||||||
| ($ in millions) | Weighted average guaranteed crediting rates | Weighted average current crediting rates | Contractholder funds | |||||||
| Annuities with annual crediting rate resets | 3.16 | % | 3.17 | % | $ | 4,220 | ||||
| Annuities with multi-year rate guarantees (1): | ||||||||||
| Resettable in next 12 months | 1.73 | 2.89 | 116 | |||||||
| Resettable after 12 months | 2.22 | 2.63 | 518 |
| (1) | These contracts include interest rate guarantee periods, the majority of which are 5 years. |
Operating costs and expenses decreased 6.5% or $2 million in 2019 compared to 2018, primarily due to lower technology and employee-related costs.
Analysis of reserves and contractholder funds
| Product liabilities | ||||||||
| For the years ended December 31, | ||||||||
| ($ in millions) | 2019 | 2018 | ||||||
| Immediate fixed annuities with life contingencies | ||||||||
| Sub-standard structured settlements and group pension terminations (1) | $ | 5,085 | $ | 4,990 | ||||
| Standard structured settlements and SPIA (2) | 3,367 | 3,425 | ||||||
| Other | 78 | 109 | ||||||
| Reserve for life-contingent contract benefits | $ | 8,530 | $ | 8,524 | ||||
| Deferred fixed annuities | $ | 6,499 | $ | 7,156 | ||||
| Immediate fixed annuities without life contingencies | 2,346 | 2,525 | ||||||
| Other | 127 | 136 | ||||||
| Contractholder funds | $ | 8,972 | $ | 9,817 |
| (1) | Comprises structured settlement annuities for annuitants with severe injuries or other health impairments which increased their expected mortality rate at the time the annuity was issued (“sub-standard structured settlements”) and group annuity contracts issued to sponsors of terminated pension plans. |
| (2) | Comprises structured settlement annuities for annuitants with standard life expectancy (“standard structured settlements”) and single premium immediate annuities (“SPIA”) with life contingencies. |
Allstate Annuities 2019 Form 10-K
Contractholder funds represent interest-bearing liabilities arising from the sale of products such as fixed annuities. The balance of contractholder funds is equal to the cumulative deposits received and interest credited to the contractholder less cumulative contract benefits, surrenders, withdrawals and contract charges for mortality or administrative expenses.
| Changes in contractholder funds | ||||||||||||
| For the years ended December 31, | ||||||||||||
| ($ in millions) | 2019 | 2018 | 2017 | |||||||||
| Contractholder funds, beginning balance | $ | 9,817 | $ | 10,936 | $ | 11,915 | ||||||
| Deposits | 16 | 15 | 28 | |||||||||
| Interest credited | 304 | 331 | 370 | |||||||||
| Benefits, withdrawals and other adjustments | ||||||||||||
| Benefits | (547 | ) | (587 | ) | (638 | ) | ||||||
| Surrenders and partial withdrawals | (602 | ) | (854 | ) | (723 | ) | ||||||
| Contract charges | (9 | ) | (9 | ) | (9 | ) | ||||||
| Net transfers from separate accounts | — | — | 1 | |||||||||
| Other adjustments (1) | (7 | ) | (15 | ) | (8 | ) | ||||||
| Total benefits, withdrawals and other adjustments | (1,165 | ) | (1,465 | ) | (1,377 | ) | ||||||
| Contractholder funds, ending balance | $ | 8,972 | $ | 9,817 | $ | 10,936 |
| (1) | The table above illustrates the changes in contractholder funds, which are presented gross of reinsurance recoverables on the Consolidated Statements of Financial Position. The table above is intended to supplement our discussion and analysis of revenues, which are presented net of reinsurance on the Consolidated Statements of Operations. As a result, the net change in contractholder funds associated with products reinsured is reflected as a component of the other adjustments line. |
Contractholder funds decreased 8.6% in 2019, primarily due to the continued runoff of our deferred fixed annuity business. We discontinued the sale of proprietary annuities but still accept additional deposits on existing contracts.
Surrenders and partial withdrawals decreased 29.5% or $252 million in 2019 compared to 2018. 2018 had elevated surrenders on fixed annuities resulting from an increased number of contracts reaching the 30-45 day period during which there is no surrender charge. The surrender and partial withdrawal rate on deferred fixed annuities, based on the beginning of year contractholder funds, was 9.2% in 2019 compared to 11.4% in 2018.
Allstate Annuities reinsurance ceded
We ceded substantially all of the risk associated with our variable annuity business to Prudential Insurance Company of America (“Prudential”). Our reinsurance recoverables from Prudential totaled $1.29 billion and $1.36 billion as of December 31, 2019 and 2018, respectively. We also have reinsurance recoverables from other reinsurers of $17 million as of both December 31, 2019 and 2018.
We retain primary liability as a direct insurer for all risks ceded to reinsurers. We continuously monitor the creditworthiness of reinsurers in order to determine our risk of recoverability on an individual and aggregate basis, and a provision for uncollectible reinsurance is recorded if needed. No amounts have been deemed unrecoverable in the three-years ended December 31, 2019.
The Allstate Corporation 81
2019 Form 10-K Investments
Investments
Overview and strategy The return on our investment portfolios is an important component of our ability to offer good value to customers, fund business improvements and create value for shareholders. Investment portfolios are held for Property-Liability, Service Businesses, Allstate Life, Allstate Benefits, Allstate Annuities, and Corporate and Other operations. While taking into consideration the investment portfolio in aggregate, management of the underlying portfolios is significantly influenced by the nature of each respective business and its corresponding liability profile. For each business, we identify a strategic asset allocation which considers both the nature of the liabilities and the risk and return characteristics of the various asset classes in which we invest. This allocation is informed by our long-term and market expectations, as well as other considerations such as risk appetite, portfolio diversification, duration, desired liquidity and capital. Within appropriate ranges relative to strategic allocations, tactical allocations are made in consideration of prevailing and potential future market conditions. We manage risks that involve uncertainty related to interest rates, credit spreads, equity returns and currency exchange rates.
The Property-Liability portfolio emphasizes protection of principal and consistent income generation, within a total return framework. This approach has produced competitive returns over the long term and is designed to ensure financial strength and stability for paying claims, while maximizing economic value and surplus growth. Products with lower liquidity needs, such as auto insurance and discontinued lines and coverages, and capital create capacity to invest in less liquid higher yielding fixed income securities, performance-based investments such as limited partnerships and equity securities. Products with higher liquidity needs, such as homeowners insurance, are invested primarily in high quality liquid fixed income securities.
The Service Businesses portfolio is focused on protection of principal and consistent income generation, within a total return framework. The portfolio is largely comprised of fixed income securities with a lesser allocation to equity securities and short-term investments.
The Allstate Life portfolio is comprised of assets chosen to generate returns to support corresponding liabilities within an asset-liability framework that targets an appropriate return on capital. This portfolio is well diversified and primarily consists of longer duration fixed income securities and commercial mortgage loans.
The Allstate Benefits portfolio is focused on protection of principal and consistent income generation while targeting an appropriate return on capital. The portfolio is largely comprised of fixed income securities and commercial mortgage loans with a small allocation to equity securities.
The Allstate Annuities portfolio is managed to ensure the assets match the characteristics of the liabilities. For longer-term immediate annuity liabilities, we invest primarily in performance-based investments such as limited partnerships and equity securities. For shorter-term annuity liabilities, we invest primarily in fixed income securities and commercial mortgage loans with maturity profiles aligned with liability cash flow requirements.
The Corporate and Other portfolio balances liquidity needs related to the corporate capital structure with the pursuit of returns.
Within each segment, we utilize two primary strategies to manage risks and returns and to position our portfolio to take advantage of market opportunities while attempting to mitigate adverse effects. As strategies and market conditions evolve, the asset allocation may change or assets may be moved between strategies.
Market-based strategy includes investments primarily in public fixed income and equity securities. It seeks to deliver predictable earnings aligned to business needs and take advantage of short-term opportunities primarily through public and private fixed income investments and public equity securities.
Performance-based strategy seeks to deliver attractive risk-adjusted returns and supplement market risk with idiosyncratic risk. Returns are impacted by a variety of factors including general macroeconomic and public market conditions as public benchmarks are often used in the valuation of underlying investments. Variability in earnings will also result from the performance of the underlying assets or business and the timing of sales of those investments. Earnings from the sales of investments may be recorded as net investment income or realized capital gains and losses. The portfolio, which primarily includes private equity and real estate with a majority being limited partnerships, is diversified across a number of characteristics, including managers or partners, vintage years, strategies, geographies (including international) and industry sectors or property types. These investments are generally illiquid in nature, often require specialized expertise, typically involve a third-party manager, and often enhance returns and income through transformation at the company or property level. A portion of these investments seek returns in markets or asset classes that are dislocated or special situations, primarily in private markets.
Impact of Low Interest Rate Environment
In January 2020, the Federal Open Market Committee (“FOMC”) maintained the target range for federal funds rate at 1-1/2 percent to 1-3/4 percent and maintained their inflation target of 2 percent. The FOMC noted that the current stance of monetary policy is appropriate to support sustained expansion of economic activity, strong labor market conditions and inflation returning to the target of 2 percent. The path
Investments 2019 Form 10-K
of the federal funds rate will depend on economic conditions and their impact on the economic outlook. Interest-bearing investments are comprised of fixed income securities, mortgage loans, short-term
investments and other investments, including bank and agent loans.
| Contractual maturities and yields of fixed income securities and mortgage loans for the next three years | ||||||||||||||
| Fixed income securities | Mortgage loans | |||||||||||||
| ($ in millions) | Carrying value | Investment yield | Carrying value | Investment yield | ||||||||||
| 2020 | $ | 3,239 | 3.6 | % | $ | 58 | 4.8 | % | ||||||
| 2021 | 5,877 | 3.4 | 446 | 4.8 | ||||||||||
| 2022 | 6,107 | 3.3 | 460 | 4.3 |
Investing activity will continue to decrease our portfolio yield as long as market yields remain below the current portfolio yield. In the Allstate Annuities segment, the portfolio yield has been less impacted by reinvestment in the current low interest rate environment than other portfolios because much of the investment cash flows have been used to fund the managed reduction in spread-based liabilities. The decline in market-based portfolio yield and Allstate Annuities invested assets are expected to result in lower net investment income in future periods.
Investments Outlook
We plan to focus on the following priorities:
| • | Enhance investment portfolio returns through use of a dynamic capital allocation framework and focus on tax efficiency. |
| • | Leverage our broad capabilities to shift the portfolio mix to earn higher risk-adjusted returns on capital. |
| • | Invest for the specific needs and characteristics of Allstate’s businesses, including its corresponding liability profile. |
We continue to increase performance-based investments in our Property-Liability portfolio, consistent with our ongoing strategy to have a greater proportion of return derived from idiosyncratic asset or operating performance.
Invested assets and market-based income are expected to decline with reductions in contractholder funds and income related to performance-based investments will result in variability of earnings for the Allstate Annuities segment.
| Portfolio composition and strategy by reporting segment (1) | ||||||||||||||||||||||||||||
| As of December 31, 2019 | ||||||||||||||||||||||||||||
| ($ in millions) | Property-Liability | Service Businesses | Allstate Life | Allstate Benefits | Allstate Annuities | Corporate and Other | Total | |||||||||||||||||||||
| Fixed income securities (2) | $ | 33,299 | $ | 1,157 | $ | 8,061 | $ | 1,298 | $ | 13,984 | $ | 1,245 | $ | 59,044 | ||||||||||||||
| Equity securities (3) | 5,919 | 311 | 210 | 80 | 1,300 | 342 | 8,162 | |||||||||||||||||||||
| Mortgage loans | 538 | — | 1,861 | 209 | 2,209 | — | 4,817 | |||||||||||||||||||||
| Limited partnership interests | 4,846 | — | — | — | 3,232 | — | 8,078 | |||||||||||||||||||||
| Short-term investments (4) | 2,186 | 76 | 396 | 44 | 815 | 739 | 4,256 | |||||||||||||||||||||
| Other | 1,626 | — | 1,386 | 310 | 681 | 2 | 4,005 | |||||||||||||||||||||
| Total | $ | 48,414 | $ | 1,544 | $ | 11,914 | $ | 1,941 | $ | 22,221 | $ | 2,328 | $ | 88,362 | ||||||||||||||
| Percent to total | 54.9 | % | 1.7 | % | 13.5 | % | 2.2 | % | 25.1 | % | 2.6 | % | 100.0 | % | ||||||||||||||
| Market-based | $ | 43,256 | $ | 1,544 | $ | 11,914 | $ | 1,941 | $ | 18,672 | $ | 2,326 | $ | 79,653 | ||||||||||||||
| Performance-based | 5,158 | — | — | — | 3,549 | 2 | 8,709 | |||||||||||||||||||||
| Total | $ | 48,414 | $ | 1,544 | $ | 11,914 | $ | 1,941 | $ | 22,221 | $ | 2,328 | $ | 88,362 |
| (1) | Balances reflect the elimination of related party investments between segments. |
| (2) | Fixed income securities are carried at fair value. Amortized cost basis for these securities was $32.22 billion, $1.12 billion, $7.43 billion, $1.23 billion, $13.08 billion, $1.21 billion and $56.29 billion for Property-Liability, Service Businesses, Allstate Life, Allstate Benefits, Allstate Annuities, Corporate and Other, and in Total, respectively. |
| (3) | Equity securities are carried at fair value. The fair value of equity securities, held as of December 31, 2019, was $1.59 billion in excess of cost. These net gains were primarily concentrated in the consumer goods and technology sectors and in domestic equity index funds. |
| (4) | Short-term investments are carried at fair value. |
Investments totaled $88.36 billion as of December 31, 2019, increasing from $81.26 billion as of December 31, 2018, primarily due to higher fixed income and equity valuations, positive investment and operating cash flows and issuance of preferred stock and senior debt, partially offset by common share repurchases, dividends paid to shareholders, net reductions in contractholder funds and repayment of preferred stock and senior debt.
Beginning January 1, 2018, equity securities are reported at fair value with changes in fair value recognized in realized capital gains and losses. Limited partnerships previously reported using the cost method are reported at fair
The Allstate Corporation 83
2019 Form 10-K Investments
value with changes in fair value recognized in net investment income. As a result, 2017 net investment income and net realized capital gains and losses are not comparable to other periods presented.
| Portfolio composition by investment strategy | ||||||||||||
| As of December 31, 2019 | ||||||||||||
| ($ in millions) | Market-based | Performance-based | Total | |||||||||
| Fixed income securities | $ | 58,950 | $ | 94 | $ | 59,044 | ||||||
| Equity securities | 7,822 | 340 | 8,162 | |||||||||
| Mortgage loans | 4,817 | — | 4,817 | |||||||||
| Limited partnership interests | 906 | 7,172 | 8,078 | |||||||||
| Short-term investments | 4,256 | — | 4,256 | |||||||||
| Other | 2,902 | 1,103 | 4,005 | |||||||||
| Total | $ | 79,653 | $ | 8,709 | $ | 88,362 | ||||||
| Percent to total | 90.1 | % | 9.9 | % | 100.0 | % | ||||||
| Unrealized net capital gains and losses | ||||||||||||
| Fixed income securities | $ | 2,751 | $ | — | $ | 2,751 | ||||||
| Limited partnership interests | — | (4 | ) | (4 | ) | |||||||
| Other | (3 | ) | — | (3 | ) | |||||||
| Total | $ | 2,748 | $ | (4 | ) | $ | 2,744 |
During 2019, strategic actions focused on optimizing portfolio yield, return and risk in the low interest rate environment.
We continued to increase performance-based investments in the Property-Liability portfolio.
We increased the maturity profile of fixed income securities in our Property-Liability portfolio to a duration of 5.2 years, while maintaining duration at 5.9 years and 4.5 years for the Allstate Life and Allstate Annuities portfolios, respectively.
In the Allstate Annuities portfolio, invested assets and market-based income declined with reductions in contractholder funds. Performance-based investments and equity securities will continue to be allocated primarily to the longer-term immediate annuity liabilities to reduce the risk that investment returns are below levels required to meet their funding needs while shorter-term annuity liabilities will be invested in market-based investments.
| Fixed income securities by type | ||||||||
| Fair value as of December 31, | ||||||||
| ($ in millions) | 2019 | 2018 | ||||||
| U.S. government and agencies | $ | 5,086 | $ | 5,517 | ||||
| Municipal | 8,620 | 9,169 | ||||||
| Corporate | 43,078 | 40,158 | ||||||
| Foreign government | 979 | 747 | ||||||
| Asset-backed securities (“ABS”) | 862 | 1,045 | ||||||
| Mortgage-backed securities (“MBS”) | 419 | 534 | ||||||
| Total fixed income securities | $ | 59,044 | $ | 57,170 |
Fixed income securities are rated by third-party credit rating agencies and/or are internally rated. As of December 31, 2019, 87.9% of the consolidated fixed income securities portfolio was rated investment grade, which is defined as a security having a rating of Aaa, Aa, A or Baa from Moody’s, a rating of AAA, AA, A or BBB from S&P, a comparable rating from another nationally recognized rating agency, or a comparable internal rating if an externally provided rating is not available. Credit ratings below these designations are
considered lower credit quality or below investment grade, which includes high yield bonds. Market prices for certain securities may have credit spreads which imply higher or lower credit quality than the current third-party rating. Our initial investment decisions and ongoing monitoring procedures for fixed income securities are based on a thorough due diligence process which includes, but is not limited to, an assessment of the credit quality, sector, structure and liquidity risks of each issue.
Investments 2019 Form 10-K
| Fair value and unrealized net capital gains (losses) for fixed income securities by credit quality | |||||||||||||||||||||||||||
| As of December 31, 2019 | |||||||||||||||||||||||||||
| Investment grade | Below investment grade | Total | |||||||||||||||||||||||||
| ($ in millions) | Fair value | Unrealized gain (loss) | Fair value | Unrealized gain (loss) | Fair value | Unrealized gain (loss) | Percent rated investment grade | ||||||||||||||||||||
| U.S. government and agencies | $ | 5,086 | $ | 115 | $ | — | $ | — | $ | 5,086 | $ | 115 | 100.0 | % | |||||||||||||
| Municipal | 8,569 | 546 | 51 | (6 | ) | 8,620 | 540 | 99.4 | |||||||||||||||||||
| Corporate | |||||||||||||||||||||||||||
| Public | 27,777 | 1,356 | 3,103 | 122 | 30,880 | 1,478 | 90.0 | ||||||||||||||||||||
| Privately placed | 8,581 | 391 | 3,617 | 119 | 12,198 | 510 | 70.3 | ||||||||||||||||||||
| Total Corporate | 36,358 | 1,747 | 6,720 | 241 | 43,078 | 1,988 | 84.4 | ||||||||||||||||||||
| Foreign government | 972 | 11 | 7 | — | 979 | 11 | 99.3 | ||||||||||||||||||||
| ABS | 791 | 1 | 71 | 1 | 862 | 2 | 91.8 | ||||||||||||||||||||
| MBS | 123 | 3 | 296 | 92 | 419 | 95 | 29.4 | ||||||||||||||||||||
| Total fixed income securities | $ | 51,899 | $ | 2,423 | $ | 7,145 | $ | 328 | $ | 59,044 | $ | 2,751 | 87.9 | % |
Municipal bonds, including tax exempt and taxable securities, include general obligations of state and local issuers and revenue bonds (including pre-refunded bonds, which are bonds for which an irrevocable trust has been established to fund the remaining payments of principal and interest).
Our practice for acquiring and monitoring municipal bonds is predominantly based on the underlying credit quality of the primary obligor. We currently rely on the primary obligor to pay all contractual cash flows and are not relying on bond insurers for payments. As a result of downgrades in the insurers’ credit ratings, the ratings of the insured municipal bonds generally reflect the underlying ratings of the primary obligor.
Corporate bonds include publicly traded and privately placed securities. Privately placed securities primarily consist of corporate issued senior debt securities that are directly negotiated with the borrower or are in unregistered form.
Our portfolio of privately placed securities is diversified by issuer, industry sector and country. The portfolio is made up of 478 issuers. Privately placed corporate obligations may contain structural security features such as financial covenants and call protections that provide investors greater protection against credit deterioration, reinvestment risk or fluctuations in interest rates than those typically found in publicly registered debt securities. Additionally, investments in these securities are made after due diligence of the issuer, typically including discussions with senior management and on-site visits to company facilities. Ongoing monitoring includes direct periodic dialog with senior management of the issuer and continuous monitoring of operating performance and financial position. Every issue not rated by an independent rating agency is internally rated with a formal rating affirmation at least once a year.
Our corporate bonds portfolio includes $6.72 billion of below investment grade bonds, $3.62 billion of which are privately placed. These securities are diversified by issuer and industry sector. The below
investment grade corporate bonds portfolio is made up of 289 issuers. We employ fundamental analyses of issuers and sectors along with macro and asset class views to identify investment opportunities. This results in a portfolio with broad exposure to the high yield market with an emphasis on idiosyncratic positions reflective of our views of market conditions and opportunities.
Foreign government securities include 83.8% of Canadian governmental and provincial securities (83.0% of which are held by our Canadian companies), 15.5% backed by the U.S. government and 0.7% that are highly diversified in other foreign governments.
ABS and MBS are structured securities that are primarily collateralized by consumer or corporate borrowings and residential and commercial real estate loans. The cash flows from the underlying collateral paid to the securitization trust are generally applied in a pre-determined order and are designed so that each security issued by the trust, typically referred to as a “class”, qualifies for a specific original rating.
For example, the “senior” portion or “top” of the capital structure, or rating class, which would originally qualify for a rating of Aaa typically has priority in receiving principal repayments on the underlying collateral and retains this priority until the class is paid in full. In a sequential structure, underlying collateral principal repayments are directed to the most senior rated Aaa class in the structure until paid in full, after which principal repayments are directed to the next most senior Aaa class in the structure until it is paid in full. Senior Aaa classes generally share any losses from the underlying collateral on a pro-rata basis after losses are absorbed by classes with lower original ratings.
The payment priority and class subordination included in these securities serves as credit enhancement for holders of the senior or top portions of the structures. These securities continue to retain the payment priority features that existed at the origination of the securitization trust. Other forms of credit enhancement may include structural features
The Allstate Corporation 85
2019 Form 10-K Investments
embedded in the securitization trust, such as overcollateralization, excess spread and bond insurance. The underlying collateral may contain fixed interest rates, variable interest rates (such as adjustable rate mortgages), or both fixed and variable rate features.
ABS includes collateralized debt obligations, consumer and other ABS. Credit risk is managed by monitoring the performance of the underlying collateral. Many of the securities in the ABS portfolio have credit enhancement with features such as overcollateralization, subordinated structures, reserve funds, guarantees and/or insurance.
MBS includes residential mortgage-backed securities (“RMBS”) and commercial mortgage-backed securities (“CMBS”). RMBS is subject to interest rate risk, but unlike other fixed income securities, is additionally subject to prepayment risk from the underlying residential mortgage loans. RMBS consists of a U.S. Agency portfolio having collateral issued or guaranteed by U.S. government agencies and a non-agency portfolio consisting of securities collateralized by Prime, Alt-A and Subprime loans. CMBS investments are primarily traditional conduit transactions collateralized by commercial mortgage loans, broadly diversified across property types and geographical area.
Equity securities primarily include common stocks, exchange traded and mutual funds, non-redeemable preferred stocks and real estate
investment trust equity investments. Exchange traded and mutual funds that have fixed income securities as their underlying investments totaled $1.79 billion as of December 31, 2019, an increase of $1.39 billion compared to December 31, 2018.
Mortgage loans mainly comprise loans secured by first mortgages on developed commercial real estate. Key considerations used to manage our exposure include property type and geographic diversification. For further detail on our mortgage loan portfolio, see Note 5 of the consolidated financial statements.
Limited partnership interests include $6.13 billion of private equity funds interests, $1.04 billion of real estate funds interests and $906 million of other funds interests as of December 31, 2019. We have commitments to invest additional amounts in limited partnership interests totaling $2.84 billion as of December 31, 2019.
Short-term investments primarily comprise money market funds, commercial paper, U.S. Treasury bills and other short-term investments, including securities lending collateral of $1.81 billion.
Other investments primarily comprise $1.20 billion of bank loans, $1.01 billion of real estate, $894 million of policy loans, $666 million of agent loans (loans issued to exclusive Allstate agents) and $140 million of derivatives as of December 31, 2019. For further detail on our use of derivatives, see Note 7 of the consolidated financial statements.
| Unrealized net capital gains (losses) | ||||||||
| As of December 31, | ||||||||
| ($ in millions) | 2019 | 2018 | ||||||
| U.S. government and agencies | $ | 115 | $ | 131 | ||||
| Municipal | 540 | 206 | ||||||
| Corporate | 1,988 | (399 | ) | |||||
| Foreign government | 11 | 8 | ||||||
| ABS | 2 | (4 | ) | |||||
| MBS | 95 | 94 | ||||||
| Fixed income securities | 2,751 | 36 | ||||||
| Derivatives | (3 | ) | (3 | ) | ||||
| Equity method of accounting (“EMA”) limited partnerships | (4 | ) | — | |||||
| Unrealized net capital gains and losses, pre-tax | $ | 2,744 | $ | 33 |
Investments 2019 Form 10-K
Fixed income portfolio monitoring is a comprehensive process to identify and evaluate each security that may be other-than-temporarily impaired. The process includes a quarterly review of all securities to identify instances where the fair value of a security compared to its amortized cost is below established thresholds. The process also includes the monitoring of other impairment indicators such as ratings, ratings downgrades and payment defaults. The securities identified, in addition to other securities for which we may have a concern, are evaluated for potential other-than-temporary impairment using all reasonably available information relevant to the collectability or recovery of the security. Inherent in our evaluation of other-than-temporary impairment for these fixed income securities are assumptions and estimates about the financial condition and future earnings potential of the issue or issuer.
Some of the factors that may be considered in evaluating whether a decline in fair value is other than temporary are:
| 1) | Financial condition, near-term and long-term prospects of the issue or issuer, including relevant industry specific market conditions and trends, geographic location and implications of rating agency actions and offering prices |
| 2) | Specific reasons that a security is in an unrealized loss position, including overall market conditions which could affect liquidity |
| 3) | Length of time and extent to which the fair value has been less than amortized cost or cost. All investments in an unrealized loss position as of December 31, 2019 were included in our portfolio monitoring process for determining whether declines in value were other than temporary. |
| Gross unrealized gains (losses) on fixed income securities | ||||||||
| As of December 31, | ||||||||
| ($ in millions) | 2019 | 2018 | ||||||
| Gross unrealized gains | $ | 2,847 | $ | 993 | ||||
| Gross unrealized losses | (96 | ) | (957 | ) | ||||
| Unrealized net capital gains and losses | $ | 2,751 | $ | 36 |
Fixed income valuations increased primarily due to a decrease in risk-free interest rates and tighter credit spreads.
| Gross unrealized gains (losses) on fixed income securities by type | ||||||||||||||||
| As of December 31, 2019 | ||||||||||||||||
| Amortized cost | Gross unrealized | Fair value | ||||||||||||||
| ($ in millions) | Gains | Losses | ||||||||||||||
| Corporate | $ | 41,090 | $ | 2,035 | $ | (47 | ) | $ | 43,078 | |||||||
| U.S. government and agencies | 4,971 | 141 | (26 | ) | 5,086 | |||||||||||
| Municipal | 8,080 | 551 | (11 | ) | 8,620 | |||||||||||
| Foreign government | 968 | 16 | (5 | ) | 979 | |||||||||||
| ABS | 860 | 8 | (6 | ) | 862 | |||||||||||
| MBS | 324 | 96 | (1 | ) | 419 | |||||||||||
| Total fixed income securities | $ | 56,293 | $ | 2,847 | $ | (96 | ) | $ | 59,044 |
The consumer goods, utilities and capital goods sectors comprise 28%, 13% and 12%, respectively, of the carrying value of our corporate fixed income securities portfolio as of December 31, 2019. The banking, energy and utilities sectors comprise 30%, 30% and 13%, respectively, of the gross unrealized losses of our corporate fixed income securities portfolio as of December 31, 2019.
In general, the gross unrealized losses are related to an increase in market yields, which may include increased risk-free interest rates and/or wider credit
spreads since the time of initial purchase. Similarly, gross unrealized gains reflect a decrease in market yields since the time of initial purchase.
As of December 31, 2019, we have not made the decision to sell and it is not more likely than not we will be required to sell fixed income securities with unrealized losses before recovery of the amortized cost basis.
The Allstate Corporation 87
2019 Form 10-K Investments
| Net investment income | ||||||||||||
| For the years ended December 31, | ||||||||||||
| ($ in millions) | 2019 | 2018 | 2017 | |||||||||
| Fixed income securities | $ | 2,175 | $ | 2,077 | $ | 2,078 | ||||||
| Equity securities | 206 | 170 | 174 | |||||||||
| Mortgage loans | 220 | 217 | 206 | |||||||||
| Limited partnership interests | 471 | 705 | 889 | |||||||||
| Short-term investments | 102 | 73 | 30 | |||||||||
| Other | 262 | 272 | 236 | |||||||||
| Investment income, before expense | 3,436 | 3,514 | 3,613 | |||||||||
| Investment expense (1) (2) | (277 | ) | (274 | ) | (212 | ) | ||||||
| Net investment income | $ | 3,159 | $ | 3,240 | $ | 3,401 | ||||||
| Market-based | $ | 2,893 | $ | 2,734 | $ | 2,661 | ||||||
| Performance-based | 543 | 780 | 952 | |||||||||
| Investment income, before expense | $ | 3,436 | $ | 3,514 | $ | 3,613 |
| (1) | Investment expense includes $81 million, $71 million and $40 million of investee level expenses in 2019, 2018 and 2017, respectively, and has increased compared to prior year, primarily due to growth in real estate investments. Investee level expenses include depreciation and asset level operating expenses on directly held real estate and other consolidated investments. |
| (2) | Investment expense includes $40 million, $28 million and $10 million related to the portion of reinvestment income on securities lending collateral paid to the counterparties in 2019, 2018 and 2017, respectively. |
Net investment income decreased 2.5% or $81 million in 2019 compared to 2018, primarily due to lower performance-based results, primarily from limited partnerships, partially offset by higher market-based income.
| Performance-based investment income | ||||||||||||
| For the years ended December 31, | ||||||||||||
| ($ in millions) | 2019 | 2018 | 2017 | |||||||||
| Limited partnerships | ||||||||||||
| Private equity | $ | 330 | $ | 582 | $ | 725 | ||||||
| Real estate | 138 | 123 | 164 | |||||||||
| Performance-based - limited partnerships | 468 | 705 | 889 | |||||||||
| Non-limited partnerships | ||||||||||||
| Private equity | 9 | 9 | 19 | |||||||||
| Real estate | 66 | 66 | 44 | |||||||||
| Performance-based - non-limited partnerships | 75 | 75 | 63 | |||||||||
| Total | ||||||||||||
| Private equity | 339 | 591 | 744 | |||||||||
| Real estate | 204 | 189 | 208 | |||||||||
| Total performance-based | $ | 543 | $ | 780 | $ | 952 | ||||||
| Investee level expenses (1) | $ | (74 | ) | $ | (64 | ) | $ | (35 | ) |
| (1) | Investee level expenses include depreciation and asset level operating expenses reported in investment expense. |
Performance-based investment income decreased 30.4% or $237 million in 2019 compared to 2018, primarily due to lower asset appreciation related to private equity investments and lower valuations in the fourth quarter, on two private equity investments totaling $74 million.
Performance-based investment results and income can vary significantly between periods and are influenced by economic conditions, equity market performance, comparable public company earnings multiples, capitalization rates, operating performance of the underlying investments and the timing of asset sales.
Investments 2019 Form 10-K
| Components of realized capital gains (losses) and the related tax effect | ||||||||||||
| For the year December 31, | ||||||||||||
| ($ in millions) | 2019 | 2018 | 2017 | |||||||||
| Impairment write-downs: | ||||||||||||
| Fixed income securities | $ | (14 | ) | $ | (10 | ) | $ | (26 | ) | |||
| Equity securities | — | — | (38 | ) | ||||||||
| Mortgage loans | — | — | (1 | ) | ||||||||
| Limited partnership interests | (6 | ) | (3 | ) | (32 | ) | ||||||
| Other investments | (27 | ) | (1 | ) | (5 | ) | ||||||
| Total impairment write-downs | (47 | ) | (14 | ) | (102 | ) | ||||||
| Change in intent write-downs | — | — | (48 | ) | ||||||||
| Net OTTI losses recognized in earnings | (47 | ) | (14 | ) | (150 | ) | ||||||
| Sales | 575 | (215 | ) | 641 | ||||||||
| Valuation of equity investments - appreciation (decline): | ||||||||||||
| Equity securities | 1,210 | (594 | ) | — | ||||||||
| Limited partnerships (1) | 162 | (97 | ) | — | ||||||||
| Total valuation of equity investments | 1,372 | (691 | ) | — | ||||||||
| Valuation and settlements of derivative instruments | (15 | ) | 43 | (46 | ) | |||||||
| Realized capital gains and losses, pre-tax | 1,885 | (877 | ) | 445 | ||||||||
| Income tax (expense) benefit | (397 | ) | 189 | (147 | ) | |||||||
| Realized capital gains and losses, after-tax | $ | 1,488 | $ | (688 | ) | $ | 298 | |||||
| Market-based | $ | 1,750 | $ | (946 | ) | $ | 486 | |||||
| Performance-based | 135 | 69 | (41 | ) | ||||||||
| Realized capital gains and losses, pre-tax | $ | 1,885 | $ | (877 | ) | $ | 445 |
| (1) | Relates to limited partnerships where the underlying assets are predominately public equity securities. |
Realized capital gains in 2019 related primarily to increased valuation of equity investments and gains on sales of fixed income securities.
Impairment write-downs in 2019 and 2018 related to investment-specific circumstances.
Sales in 2019 related primarily to fixed income securities in connection with ongoing portfolio management, as well as gains from limited partnerships. Sales in 2018 related primarily to fixed income securities in connection with ongoing portfolio management.
Valuation and settlements of derivative instruments in 2019 primarily comprised losses on equity options and futures used for risk management, partially offset by gains on interest rate futures and total return swaps used for asset replication due to increases in equity indices. 2018 primarily comprised gains on foreign currency contracts due to the strengthening of the U.S. dollar and gains on equity options used for risk management due to a decrease in equity indices, partially offset by losses on total return swaps and equity options and futures used for asset replication due to decreases in equity indices.
| Realized capital gains (losses) for performance-based investments | ||||||||||||
| For the years ended December 31, | ||||||||||||
| ($ in millions) | 2019 | 2018 | 2017 | |||||||||
| Impairment write-downs | $ | (6 | ) | $ | (3 | ) | $ | (32 | ) | |||
| Sales | 103 | 7 | 15 | |||||||||
| Valuation of equity investments | 31 | 36 | — | |||||||||
| Valuation and settlements of derivative instruments | 7 | 29 | (24 | ) | ||||||||
| Total performance-based | $ | 135 | $ | 69 | $ | (41 | ) |
Realized capital gains for performance-based investments in 2019 primarily related to gains on sales of investments in directly held real estate, a gain on the sale of a limited partnership and increased valuation of equity investments. 2018 primarily related to increased valuation of equity investments and gains on valuation and settlements of derivative instruments.
The Allstate Corporation 89
2019 Form 10-K Market Risk
Market Risk
Market risk is the risk that we will incur losses due to adverse changes in interest rates, credit spreads, equity prices, commodity prices or currency exchange rates. Adverse changes to these rates and prices may occur due to changes in fiscal policy, the economic climate, the liquidity of a market or market segment, insolvency or financial distress of key market makers or participants or changes in market perceptions of credit worthiness and/or risk tolerance. Our primary market risk exposures are to changes in interest rates, credit spreads and equity prices. We also have direct and indirect exposure to commodity price changes through our diversified investments in timber, agriculture, infrastructure and energy primarily held in limited partnership interests and consolidated subsidiaries.
The active management of market risk is integral to our results of operations. We may use the following approaches to manage exposure to market risk within defined tolerance ranges:
| 1) | Rebalancing existing asset or liability portfolios |
| 2) | Changing the type of investments purchased in the future |
| 3) | Using derivative instruments to modify the market risk characteristics of existing assets and liabilities or assets expected to be purchased |
Overview In formulating and implementing guidelines for investing funds, we seek to earn attractive risk-adjusted returns that enhance our ability to offer competitive rates and prices to customers while contributing to stable profits and long-term capital growth. Accordingly, our investment decisions and objectives are informed by the underlying risks and product profiles. Investment policies define the overall framework for managing market and other investment risks, including accountability and controls over risk management activities. Subsidiaries that conduct investment activities follow policies that have been approved by their respective boards of directors and which specify the investment limits and strategies that are appropriate given the liquidity, surplus, product profile and regulatory requirements of the subsidiary. Executive oversight of investment activities is conducted primarily through the subsidiaries’ boards of directors and legal entity investment committees. The Enterprise Risk and Return Council (“ERRC”) oversees the aggregate risk of Allstate and its subsidiaries. Working in conjunction with the board or the investment committee of each subsidiary, as applicable, the ERRC evaluates the risk tolerance of each subsidiary and determines the aggregate risk tolerance of the enterprise.
For life and annuity products, the asset-liability management (“ALM”) policies further define the overall framework for managing market and investment risks and are approved by the subsidiaries’ respective boards of directors. ALM focuses on strategies to enhance yields, mitigate market risks and optimize capital to improve profitability and returns while incorporating future expected cash requirements to repay liabilities. These ALM policies specify limits, ranges and/or targets for investments that best meet
business objectives in light of the unique demands and characteristics of the product liabilities and are intended to result in a prudent, methodical and effective adjudication of market risk and return.
We use widely-accepted quantitative and qualitative approaches to measure, monitor and manage market risk. We evaluate our market risk exposure using multiple measures including but not limited to:
| • Duration, a measure of the price sensitivity of assets and liabilities to changes in interest rates |
| • Value-at-risk, a statistical estimate of the probability that the change in fair value of a portfolio will exceed a certain amount over a given time horizon |
| • Scenario analysis, an estimate of the potential changes in the fair value of a portfolio that could occur under hypothetical market conditions defined by changes to multiple market risk factors: interest rates, credit spreads, equity prices or currency exchange rates |
| • Sensitivity analysis, an estimate of the potential changes in the fair value of a portfolio that could occur using hypothetical shocks to a market risk factor. The selection of measures used in our sensitivity analysis should not be construed as our prediction of future market events, but only as an illustration of the potential effect of such an event. |
In general, we establish investment portfolio asset allocation and market risk limits based upon a combination of these measures. The asset allocation limits place restrictions on the total funds that may be invested within an asset class. Comprehensive day-to-day management of market risk within defined tolerance ranges occurs as portfolio managers buy and sell within their respective markets based upon the acceptable boundaries established by investment policies. Although we apply a similar overall philosophy to market risk, the underlying business frameworks and the accounting and regulatory environments may differ between our products and therefore affect investment decisions and risk parameters.
Interest rate risk is the risk that we will incur a loss due to adverse changes in interest rates relative to the characteristics of our interest-bearing assets and liabilities. Interest rate risk includes risks related to changes in U.S. Treasury yields and other key risk-free reference yields. This risk arises from many of our primary activities, as we invest substantial funds in interest-sensitive assets and issue interest-sensitive liabilities. Changes in interest rates can have favorable and unfavorable effects on our results. For example, increases in rates can improve investment income, but decrease the fair value of our fixed income securities portfolio and increase policyholder surrenders requiring us to liquidate assets. Decreases in rates could increase the fair value of our fixed income securities portfolio while decreasing investment income due to reinvesting at lower market yields and accelerating pay-downs and prepayments of certain investments.
For our corporate debt, we monitor market interest rates and evaluate refinancing opportunities
Market Risk 2019 Form 10-K
as maturity dates approach. To mitigate this risk, we ladder the maturity dates of our debt. For our noncumulative perpetual preferred stock, we monitor market dividend rates and evaluate opportunities to redeem or refinance on or after specified dates. For further detail regarding our debt and our preferred stock, see Note 12 of the consolidated financial statements and the Capital Resources and Liquidity section of this Item.
We manage the interest rate risk in our assets relative to the interest rate risk in our liabilities and our assessment of overall economic and capital risk. One of the measures used to quantify this exposure is duration. The difference in the duration of our assets relative to our liabilities is our duration gap. To calculate the duration gap between assets and liabilities, we project asset and liability cash flows and calculate their net present value using a risk-free market interest rate adjusted for credit quality, sector attributes, liquidity and other specific risks. Duration is calculated by revaluing these cash flows at alternative interest rates and determining the percentage change in aggregate fair value. The cash flows used in this calculation include the expected maturity and repricing characteristics of our derivative financial instruments, all other financial instruments, and certain other items including, unearned premiums, claims and claims expense reserves, annuity liabilities and other interest-sensitive liabilities.
The projections include assumptions (based upon historical market experience and our experience) that reflect the effect of changing interest rates on the prepayment, lapse, leverage and/or option features of instruments, where applicable. The preceding assumptions relate primarily to callable municipal and corporate bonds, fixed rate single and flexible premium deferred annuities, mortgage-backed securities and municipal housing bonds. Additionally, the calculations include assumptions regarding the renewal of property and casualty products.
As of December 31, 2019, the difference between our asset and liability duration was a (1.48) gap compared to a (1.16) gap as of December 31, 2018. The calculation excludes traditional and interest-sensitive life insurance and accident and health insurance products that are not considered financial instruments. A negative duration gap indicates that the fair value of our liabilities is more sensitive to interest rate movements than the fair value of our assets, while a positive duration gap indicates that the fair value of our assets is more sensitive to interest rate movements than the fair value of our liabilities. Due to the relatively short duration of our property and casualty liabilities, primarily related to auto and homeowners claims, the investments generally maintain a positive duration gap between assets and liabilities. In contrast, for our annuity products the duration gap may be positive or negative as the assets and liabilities vary based on the characteristics of the products in-force and investing activity. As of December 31, 2019, property and casualty products had a positive duration gap while annuity products had a negative duration gap.
To reduce the risk that investment returns are below levels required to meet the funding needs of certain liabilities, we are executing our performance-based strategy that supplements market risk with idiosyncratic risk. We are using these investments, in addition to public equity securities, to support a portion of our property and casualty products and long-term annuity liabilities. Shorter-term annuity liabilities will continue to be invested in market-based investments to generate cash flows that will fund future claims, benefits and expenses, and that will earn stable returns across a wide variety of interest rate and economic scenarios. Performance-based investments and public equity securities are generally not interest-bearing; accordingly, using them to support interest-bearing liabilities contributes toward a negative duration gap.
| Interest rate shock analysis (1) | ||||||||
| As of December 31, | ||||||||
| ($ in millions) | 2019 | 2018 | ||||||
| Increase in fair value of the assets net of liabilities (2) | $ | 1,209 | $ | 889 |
| (1) | Represents an immediate, parallel increase of 100 basis points based on information and assumptions used in the duration calculations and market interest rates as of December 31, 2019. |
| (2) | Estimate excludes traditional and interest-sensitive life insurance and accident and health insurance products that are not considered financial instruments. The assets supporting these products totaled $12.14 billion and $11.07 billion as of December 31, 2019 and 2018, respectively. Based on assumptions described above, these assets would decrease in value by $649 million as of December 31, 2019 compared to a decrease of $593 million as of December 31, 2018. |
To the extent that conditions differ from the assumptions we used in these calculations, duration and rate shock measures could be significantly impacted. Additionally, our calculations assume the current relationship between short-term and long-term interest rates (the term structure of interest rates) will remain constant over time. As a result, these calculations may not fully capture the effect of non-parallel changes in the term structure of interest rates and/or large changes in interest rates.
Credit spread risk is the risk that we will incur a loss due to adverse changes in credit spreads (“spreads”). Credit spread is the additional yield on fixed income securities and loans above the risk-free rate (typically referenced as the yield on U.S. Treasury securities) that market participants require to compensate them for assuming credit, liquidity and/or prepayment risks. The magnitude of the spread will depend on the likelihood that a particular issuer will default. This risk arises from many of our primary activities, as we invest substantial funds in spread-sensitive fixed income assets. We manage the spread risk in our assets. One of the measures used to quantify this exposure is spread duration. Spread duration measures the price sensitivity of the assets to changes in spreads. For example, if spreads increase 100 basis points, the fair value of an asset exhibiting a
The Allstate Corporation 91
2019 Form 10-K Market Risk
spread duration of 5 is expected to decrease in value by 5%.
Spread duration is calculated similarly to interest rate duration. As of December 31, 2019, the spread duration was 4.60 compared to 4.28 as of December 31, 2018.
| Credit spread shock analysis (1) | ||||||||
| As of December 31, | ||||||||
| ($ in millions) | 2019 | 2018 | ||||||
| Decrease in net fair value of the assets (2) | $ | 2,877 | $ | 2,493 |
| (1) | Represents an immediate, parallel increase of 100 basis points across all asset classes, industry sectors and credit ratings based on information and assumptions used in the spread duration calculations and market interest rates as of December 31, 2019. |
| (2) | Reflects effects of tactical positions that include the use of credit default swaps to manage spread risk. |
Equity price risk is the risk that we will incur losses due to adverse changes in the general levels of the markets.
Equity investments As of December 31, 2019, we held $7.28 billion in equity securities, excluding those with fixed income securities as their underlying investments, and limited partnership interests where the underlying assets are predominately public equity securities, compared to $5.29 billion as of December 31, 2018. 80.4% of the common stocks and other investments with public equity risk supported property and casualty products as of December 31, 2019, compared to 73.2% as of December 31, 2018. As of December 31, 2019, these investments had an equity market portfolio beta of 1.02, compared to a beta of 1.00 as of December 31, 2018. Beta represents a widely used methodology to describe, quantitatively, an investment’s market risk characteristics relative to an index such as the Standard & Poor’s 500 Composite Price Index (“S&P 500”).
| Change in S&P 500 by 10% | ||||||||
| As of December 31, | ||||||||
| ($ in millions) | 2019 | 2018 | ||||||
| Change in net fair value of equity investments | $ | 742 | $ | 527 |
We periodically use put options to reduce equity price risk or call options to adjust our equity risk profile. Put options provide an offset to declines in equity market values below a targeted level, while call options provide participation in equity market appreciation above a targeted level. Options can expire, terminate early or the option can be exercised. If the equity index does not fall below the put’s strike price or rise above the call’s strike price, the maximum loss on purchased puts and calls is limited to the amount of the premium paid.
Limited partnership interests As of December 31, 2019, we held $7.17 billion in limited partnership interests excluding those limited partnership interests
where the underlying assets are predominately public equity securities compared to $6.86 billion as of December 31, 2018. 56.7% of the limited partnership interests supported property and casualty products as of December 31, 2019, compared to 53.9% as of December 31, 2018. These investments are primarily comprised of private equity and real estate funds. These investments are idiosyncratic in nature and a greater portion of the return is derived from asset operating performance. They are not actively traded, and valuation changes typically reflect the performance of the underlying asset.
| Change in private market valuations by 10% | ||||||||
| As of December 31, | ||||||||
| ($ in millions) | 2019 | 2018 | ||||||
| Change in net fair value of limited partnership interests | $ | 717 | $ | 686 |
For limited partnership interests, quarterly changes in fair values may not be highly correlated to equity indices in the short-term and changes in value of these investments are generally recognized on a three-month delay due to the availability of the related investee financial statements. The illustrations noted above may not reflect our actual experience if the future composition of the portfolio (hence its beta) and correlation relationships differ from the historical relationships.
Separate Accounts As of December 31, 2019 and 2018, we had separate account assets related to variable annuity and variable life contracts with account values totaling $3.04 billion and $2.81 billion, respectively. Equity risk exists for contract charges based on separate account balances and guarantees for death and/or income benefits provided by our variable products.
In 2006, we disposed of substantially all of the variable annuity business through reinsurance agreements with The Prudential Insurance Company of America, a subsidiary of Prudential Financial Inc. and therefore mitigated this aspect of our risk. Equity risk for our variable life business relates to contract charges and policyholder benefits. Total variable life contract charges, including reinsurance assumed, for 2019 and 2018 were $45 million and $44 million, respectively. Separate account liabilities related to variable life contracts were $85 million and $68 million as of December 31, 2019 and 2018, respectively.
Equity-indexed Life and Annuity Liabilities As of December 31, 2019 and 2018, we had $1.92 billion and $1.83 billion, respectively, in equity-indexed life and annuity liabilities that provide customers with interest crediting rates based on the performance of the S&P 500. We hedge the majority of the risk associated with these liabilities using equity-indexed options and futures and eurodollar futures, maintaining risk within specified value-at-risk limits.
Market Risk 2019 Form 10-K
Foreign currency exchange rate risk is the risk that we will incur economic losses due to adverse changes in foreign currency exchange rates. This risk primarily arises from our foreign equity investments, including common stocks, limited partnership interests, and our Canadian, Northern Ireland and Indian operations. We use foreign currency derivative contracts to partially offset this risk.
As of December 31, 2019, we had $2.80 billion in foreign currency denominated equity investments, including the impact of foreign currency derivative contracts, $1.08 billion net investment in our foreign subsidiaries, primarily related to our Canadian operations, and $113 million in unhedged non-U.S. dollar fixed income securities. These amounts were $2.10 billion, $860 million, and $96 million, respectively, as of December 31, 2018.
| Change in foreign currency exchange rates (1) | ||||||||
| As of December 31, | ||||||||
| ($ in millions) | 2019 | 2018 | ||||||
| Decrease in value of foreign currency denominated instruments | $ | 402 | $ | 306 |
| (1) | Represents a 10% immediate unfavorable change in each of the foreign currency exchange rates to which we are exposed based on information and assumptions used, including the impact of foreign currency derivative contracts. |
The modeling technique we use to report our currency exposure does not take into account correlation among foreign currency exchange rates. Even though we believe it is very unlikely that all of the foreign currency exchange rates that we are exposed to would simultaneously decrease by 10%, we nonetheless stress test our portfolio under this and other hypothetical extreme adverse market scenarios. Our actual experience may differ from these results because of assumptions we have used or because significant liquidity and market events could occur that we did not foresee.
The Allstate Corporation 93
2019 Form 10-K Capital Resources and Liquidity
Capital Resources and Liquidity
Capital resources consist of shareholders’ equity and debt, representing funds deployed or available to be deployed to support business operations or for general corporate purposes.
| Capital resources | ||||||||||||
| As of December 31, | ||||||||||||
| ($ in millions) | 2019 | 2018 | 2017 | |||||||||
| Preferred stock, common stock, treasury stock, retained income and other shareholders’ equity items | $ | 24,048 | $ | 21,194 | $ | 20,662 | ||||||
| Accumulated other comprehensive (loss) income | 1,950 | 118 | 1,889 | |||||||||
| Total shareholders’ equity | 25,998 | 21,312 | 22,551 | |||||||||
| Debt | 6,631 | 6,451 | 6,350 | |||||||||
| Total capital resources | $ | 32,629 | $ | 27,763 | $ | 28,901 | ||||||
| Ratio of debt to shareholders’ equity | 25.5 | % | 30.3 | % | 28.2 | % | ||||||
| Ratio of debt to capital resources | 20.3 | % | 23.2 | % | 22.0 | % |
Shareholders’ equity increased in 2019, primarily due to net income, increased net unrealized capital gains on investments and issuance of preferred stock, partially offset by common share repurchases and dividends paid to shareholders. In 2019, we paid dividends of $653 million and $134 million related to our common and preferred shares, respectively. Shareholders’ equity decreased in 2018, primarily due to decreased net unrealized capital gains on investments, common share repurchases and dividends paid to shareholders, partially offset by net income and issuance of preferred stock.
Common share repurchases As of December 31, 2019, there was $259 million remaining on the $3.00 billion common share repurchase program. In January 2020, we completed the $3.00 billion share repurchase program that commenced in November 2018. On February 6, 2020, the Board authorized a new $3.00 billion common share repurchase program that is expected to be completed by the end of 2021.
In November 2019, we entered into an ASR agreement with Goldman Sachs & Co. LLC (“Goldman Sachs”) to purchase $500 million of our outstanding common stock. Under the ASR agreement, we paid $500 million upfront and initially acquired 4.0 million shares. The ASR agreement settled on January 8, 2020, and we repurchased a total of 4.6 million shares at an average price of $109.51.
During 2019, we repurchased 16.4 million common shares for $1.81 billion. The common share repurchases were completed through open market transactions and ASR agreements.
Since 1995, we have acquired 724 million shares of our common stock at a cost of $35.18 billion, primarily as part of various stock repurchase programs. We have reissued 144 million common shares since 1995, primarily associated with our equity incentive plans, the 1999 acquisition of American Heritage Life Investment Corporation and the 2001 redemption of certain mandatorily redeemable preferred securities. Since 1995, total common shares outstanding has decreased by 580 million shares or 64.5%, primarily due to our repurchase programs.
Common shareholder dividends On January 2, 2019, April 1, 2019, July 1, 2019, and October 1, 2019, we paid common shareholder dividends of $0.46, $0.50, $0.50 and $0.50, respectively. On November 15, 2019, we declared a common shareholder dividend of $0.50, payable on January 2, 2020. On February 20, 2020, we declared a common shareholder dividend of $0.54, payable on April 1, 2020.
Issuance and redemption of preferred stock On August 8, 2019, we issued 46,000 shares of 5.100% Fixed Rate Noncumulative Perpetual Preferred Stock, Series H for gross proceeds of $1.15 billion.
On October 15, 2019, we redeemed all 5,400 shares of our Fixed Rate Noncumulative Perpetual Preferred Stock, Series D, all 29,900 shares of our Fixed Rate Noncumulative Perpetual Preferred Stock, Series E, and all 10,000 shares of our Fixed Rate Noncumulative Perpetual Preferred Stock, Series F and the corresponding depository shares for $1.13 billion.
On November 8, 2019, we issued 12,000 shares of 4.750% Fixed Rate Noncumulative Perpetual Preferred Stock, Series I for gross proceeds of $300 million.
On January 15, 2020, we redeemed all 11,500 shares of Fixed Rate Noncumulative Preferred Stock, Series A and the corresponding depositary shares for $288 million.
For additional details on these transactions, see Note 12 of the consolidated financial statements.
Issuance and repayment of debt On June 10, 2019, we issued $500 million of 3.850% Senior Notes due 2049. Interest on the Senior Notes is payable semi-annually in arrears on February 10 and August 10 of each year, beginning on February 10, 2020. The Senior Notes are redeemable at any time at the applicable redemption price prior to the maturity date. The proceeds of this issuance are used for general corporate purposes.
On May 16, 2019, we repaid $317 million of 7.450% Senior Notes, Series B, at maturity.
Capital Resources and Liquidity 2019 Form 10-K
Financial ratings and strength
| Senior long-term debt, commercial paper and insurance financial strength ratings | ||||||
| As of December 31, 2019 | ||||||
| Moody’s | S&P Global Ratings | A.M. Best | ||||
| The Allstate Corporation (debt) | A3 | A- | a | |||
| The Allstate Corporation (short-term issuer) | P-2 | A-2 | AMB-1+ | |||
| Allstate Insurance Company (insurance financial strength) | Aa3 | AA- | A+ | |||
| Allstate Life Insurance Company (insurance financial strength) | A2 | A+ | A+ | |||
| Allstate Assurance Company (insurance financial strength) | A2 | N/A | A+ |
Our ratings are influenced by many factors including our operating and financial performance, asset quality, liquidity, asset/liability management, overall portfolio mix, financial leverage (i.e., debt), exposure to risks such as catastrophes and the current level of operating leverage. The preferred stock and subordinated debentures are viewed as having a common equity component by certain rating agencies and are given equity credit up to a pre-determined limit in our capital structure as determined by their respective methodologies. These respective methodologies consider the existence of certain terms and features in the instruments such as the noncumulative dividend feature in the preferred stock.
In May 2019, A.M. Best affirmed The Allstate Corporation’s debt and short-term issuer ratings of a and AMB-1+, respectively, and the insurer financial strength ratings of A+ for Allstate Insurance Company (“AIC”), Allstate Life Insurance Company (“ALIC”), and Allstate Assurance Company (“AAC”). The outlook for the ratings is stable.
In July 2019, Moody’s affirmed The Allstate Corporation’s debt and short-term issuer ratings of A3 and P-2, respectively, and the insurance financial strength rating of Aa3 for AIC. Moody’s downgraded ALIC and AAC insurance financial strength ratings to A2 from A1 reflecting Moody’s shift to a more standard single rating level positive adjustment for subsidiary company ratings. The outlook for the ratings is stable.
In December 2019, S&P Global affirmed The Allstate Corporation’s debt and short-term issuer ratings of A- and A-2, respectively, and the insurance financial strength ratings of AA- for AIC and A+ for ALIC. The outlook for the ratings is stable.
We have distinct and separately capitalized groups of subsidiaries licensed to sell property and casualty insurance that maintain separate group ratings. The ratings of these groups are influenced by the risks that relate specifically to each group. Many mortgage companies require property owners to have insurance from an insurance carrier with a secure financial strength rating from an accredited rating agency. In May 2019, A.M. Best affirmed the A rating of ANJ, which writes auto and homeowners insurance, and the A+ rating of North Light, our excess and surplus lines
carrier. The outlook for the ANJ rating and North Light rating is stable. ANJ also has a Financial Stability Rating® of A" from Demotech, which was affirmed in November 2019. In March 2019, A.M. Best upgraded the CKIC, which underwrites personal lines property insurance in Florida, rating to B+. CKIC also has a Financial Stability Rating of A’ from Demotech that was affirmed in November 2019. ANJ, North Light and CKIC do not have support agreements with AIC.
Allstate’s domestic property and casualty and life insurance subsidiaries prepare their statutory-basis financial statements in conformity with accounting practices prescribed or permitted by the insurance department of the applicable state of domicile. Statutory surplus is a measure that is often used as a basis for determining dividend paying capacity, operating leverage and premium growth capacity, and it is also reviewed by rating agencies in determining their ratings.
The property and casualty business is comprised of 29 insurance companies, each of which has individual company dividend limitations. As of December 31, 2019, total statutory surplus is $20.40 billion compared to $18.15 billion as of December 31, 2018. Property and casualty subsidiaries surplus was $16.19 billion as of December 31, 2019, compared to $14.33 billion as of December 31, 2018. Life insurance subsidiaries surplus was $4.21 billion as of December 31, 2019, compared to $3.82 billion as of December 31, 2018.
The National Association of Insurance Commissioners (“NAIC”) has developed financial relationships or tests known as the Insurance Regulatory Information System to assist state insurance regulators in monitoring the financial condition of insurance companies and identifying companies that require special attention or actions by state insurance regulators. The NAIC analyzes financial data provided by insurance companies using prescribed ratios, each with defined “usual ranges”. Additional regulatory scrutiny may occur if a company’s ratios fall outside the usual ranges for four or more of the ratios. Our domestic insurance companies have no significant departure from these ranges.
The Allstate Corporation 95
2019 Form 10-K Capital Resources and Liquidity
Liquidity sources and uses Our potential sources and uses of funds principally include the following activities below.
| Activities for potential sources of funds | ||||||||||||
| Property- Liability | Service Businesses | Allstate Life | Allstate Benefits | Allstate Annuities | Corporate and Other | |||||||
| Receipt of insurance premiums | ü | ü | ü | ü | ||||||||
| Recurring service fees | ü | ü | ü | |||||||||
| Contractholder fund deposits | ü | ü | ü | |||||||||
| Reinsurance and indemnification program recoveries | ü | ü | ü | ü | ü | |||||||
| Receipts of principal, interest and dividends on investments | ü | ü | ü | ü | ü | ü | ||||||
| Sales of investments | ü | ü | ü | ü | ü | ü | ||||||
| Funds from securities lending, commercial paper and line of credit agreements | ü | ü | ü | ü | ||||||||
| Intercompany loans | ü | ü | ü | ü | ü | ü | ||||||
| Capital contributions from parent | ü | ü | ü | ü | ü | ü | ||||||
| Dividends or return of capital from subsidiaries | ü | ü | ü | ü | ü | ü | ||||||
| Tax refunds/settlements | ü | ü | ü | ü | ü | ü | ||||||
| Funds from periodic issuance of additional securities | ü | |||||||||||
| Receipt of intercompany settlements related to employee benefit plans | ü |
| Activities for potential uses of funds | ||||||||||||
| Property- Liability | Service Businesses | Allstate Life | Allstate Benefits | Allstate Annuities | Corporate and Other | |||||||
| Payment of claims and related expenses | ü | ü | ||||||||||
| Payment of contract benefits, surrenders and withdrawals | ü | ü | ü | |||||||||
| Reinsurance cessions and indemnification program payments | ü | ü | ü | ü | ü | |||||||
| Operating costs and expenses | ü | ü | ü | ü | ü | ü | ||||||
| Purchase of investments | ü | ü | ü | ü | ü | ü | ||||||
| Repayment of securities lending, commercial paper and line of credit agreements | ü | ü | ü | ü | ||||||||
| Payment or repayment of intercompany loans | ü | ü | ü | ü | ü | ü | ||||||
| Capital contributions to subsidiaries | ü | ü | ü | ü | ü | ü | ||||||
| Dividends or return of capital to shareholders/parent company | ü | ü | ü | ü | ü | ü | ||||||
| Tax payments/settlements | ü | ü | ü | ü | ü | ü | ||||||
| Common share repurchases | ü | |||||||||||
| Debt service expenses and repayment | ü | ü | ||||||||||
| Payments related to employee benefit plans | ü | ü | ü | ü | ü | ü | ||||||
| Payments for acquisitions | ü | ü | ü | ü | ü | ü |
We actively manage our financial position and liquidity levels in light of changing market, economic, and business conditions. Liquidity is managed at both the entity and enterprise level across the Company and is assessed on both base and stressed level liquidity needs. We believe we have sufficient liquidity to meet these needs. Additionally, we have existing intercompany agreements in place that facilitate liquidity management across the Company to enhance flexibility.
As of December 31, 2019, we held $12.79 billion of cash, U.S. government and agencies fixed income securities, and public equity securities (excluding non-redeemable preferred stocks and foreign equities) which, under normal market conditions, we would
expect to be able to liquidate within one week. In addition, we regularly estimate how much of the total portfolio, which includes high quality corporate fixed income and municipal holdings, can be reasonably liquidated within one quarter. These estimates are subject to considerable uncertainty associated with evolving market conditions. As of December 31, 2019, cash and estimated liquidity available within one quarter, under normal market conditions and at current market prices, was $27.25 billion.
Certain remote events and circumstances could constrain our liquidity. Those events and circumstances include, for example, a catastrophe resulting in extraordinary losses, a downgrade in our senior long-term debt ratings to non-investment grade
Capital Resources and Liquidity 2019 Form 10-K
status, or a downgrade in AIC’s or ALIC’s financial strength ratings. The rating agencies also consider the interdependence of our individually rated entities; therefore, a rating change in one entity could potentially affect the ratings of other related entities.
The Allstate Corporation is party to an Amended and Restated Intercompany Liquidity Agreement (“Liquidity Agreement”) with certain subsidiaries, which include, but are not limited to, ALIC and AIC. The Liquidity Agreement allows for short-term advances of funds to be made between parties for liquidity and other general corporate purposes. The Liquidity Agreement does not establish a commitment to advance funds on the part of any party. ALIC and AIC each serve as a lender and borrower, certain other subsidiaries serve only as borrowers, and the Corporation serves only as a lender. AIC also has a capital support agreement with ALIC. Under the capital support agreement, AIC is committed to providing capital to ALIC to maintain an adequate capital level. The maximum amount of potential funding under each of these agreements is $1.00 billion.
In addition to the Liquidity Agreement, the Corporation also has an intercompany loan agreement with certain of its subsidiaries, which include, but are not limited to, AIC and ALIC. The amount of intercompany loans available to the Corporation’s subsidiaries is at the discretion of the Corporation. The maximum amount of loans the Corporation will have outstanding to all its eligible subsidiaries at any given point in time is limited to $1.00 billion. The Corporation may use commercial paper borrowings, bank lines of credit and securities lending to fund intercompany borrowings.
Parent company capital capacity At the parent holding company level, we have deployable assets totaling $2.30 billion as of December 31, 2019, comprising cash and investments that are generally saleable within one quarter. Deployable assets increased by the proceeds from the Preferred Stock, Series I issuance, which were subsequently used for the Series A redemption that occurred on January 15, 2020. The substantial earnings capacity of the operating subsidiaries is the primary source of capital generation for the Corporation.
The payment of dividends by AIC to The Allstate Corporation is limited by Illinois insurance law to formula amounts based on statutory net income and statutory surplus, as well as the timing and amount of dividends paid in the preceding twelve months. Based on the greater of 2019 statutory net income or 10% of statutory surplus, the maximum amount of dividends that AIC will be able to pay, without prior Illinois Department of Insurance approval, at a given point in time in 2020 is estimated at $3.73 billion, less dividends paid during the preceding twelve months measured at that point in time. Notification and approval of intercompany lending activities are also required by the Illinois Department of Insurance for those transactions that exceed formula amounts based on statutory admitted assets and statutory surplus.
These holding company assets and subsidiary dividends provide funds for the parent company’s fixed charges and other corporate purposes.
Intercompany dividends were paid in 2019, 2018 and 2017 between the following companies: AIC, Allstate Insurance Holdings, LLC (“AIH”), the Corporation, ALIC, American Heritage Life Insurance Company (“AHL”) and Allstate Financial Insurance Holdings Corporation (“AFIHC”).
| Intercompany dividends | ||||||||||||
| ($ in millions) | 2019 | 2018 | 2017 | |||||||||
| AIC to AIH | $ | 2,732 | $ | 2,874 | $ | 1,555 | ||||||
| AIH to the Corporation | 2,747 | 2,897 | 1,613 | |||||||||
| ALIC to AIC | 75 | 250 | 600 | |||||||||
| AHL to AFIHC | 80 | 55 | 70 | |||||||||
| AFIHC to the Corporation | 50 | — | — |
Dividends may not be paid or declared on our common stock and shares of common stock may not be repurchased unless the full dividends for the latest completed dividend period on our preferred stock have been declared and paid or provided for.
We are prohibited from declaring or paying dividends on our Series G preferred stock if we fail to meet specified capital adequacy, net income or shareholders’ equity levels, except out of the net proceeds of common stock issued during the 90 days prior to the date of declaration. As of December 31, 2019, we satisfied all of the tests with no current restrictions on the payment of preferred stock dividends. There were no capital contributions paid by the Corporation to AIC or capital contributions by AIC to ALIC in 2019, 2018 or 2017.
The terms of our outstanding subordinated debentures also prohibit us from declaring or paying any dividends or distributions on our common or preferred stock or redeeming, purchasing, acquiring, or making liquidation payments on our common stock or preferred stock if we have elected to defer interest payments on the subordinated debentures, subject to certain limited exceptions. In 2019, we did not defer interest payments on the subordinated debentures.
Additional resources to support liquidity are as follows:
| • | The Corporation has access to a commercial paper facility with a borrowing limit of $1.00 billion to cover short-term cash needs. As of December 31, 2019, there were no balances outstanding and therefore the remaining borrowing capacity was $1.00 billion. |
| • | The Corporation, AIC and ALIC have access to a $1.00 billion unsecured revolving credit facility that is available for short-term liquidity requirements. The maturity date of this facility is April 2021. The facility is fully subscribed among 11 lenders with the largest commitment being $115 million. The commitments of the lenders are several and no lender is responsible for any other lender’s commitment if such lender fails to make a loan |
The Allstate Corporation 97
2019 Form 10-K Capital Resources and Liquidity
under the facility. This facility contains an increase provision that would allow up to an additional $500 million of borrowing. This facility has a financial covenant requiring that we not exceed a 37.5% debt to capitalization ratio as defined in the agreement. This ratio was 15.9% as of December 31, 2019. Although the right to borrow under the facility is not subject to a minimum rating requirement, the costs of maintaining the facility and borrowing under it are based on the ratings of our senior unsecured, unguaranteed long-term debt. There were no borrowings under the credit facility during 2019.
| • | The Corporation has access to a universal shelf registration statement with the Securities and Exchange Commission that expires in 2021. We can use this shelf registration to issue an unspecified amount of debt securities, common stock (including 581 million shares of treasury stock as of December 31, 2019), preferred stock, depositary shares, warrants, stock purchase contracts, stock purchase units and securities of trust subsidiaries. The specific terms of any securities we issue under this registration statement will be provided in the applicable prospectus supplements. |
Liquidity exposure Contractholder funds were $17.69 billion as of December 31, 2019.
| Contractholder funds by contractual withdrawal provisions | |||||||
| ($ in millions) | December 31, 2019 | Percent to total | |||||
| Not subject to discretionary withdrawal | $ | 2,718 | 15.4 | % | |||
| Subject to discretionary withdrawal with adjustments: | |||||||
| Specified surrender charges (1) | 4,760 | 26.9 | |||||
| Market value adjustments (2) | 808 | 4.6 | |||||
| Subject to discretionary withdrawal without adjustments (3) | 9,406 | 53.1 | |||||
| Total contractholder funds (4) | $ | 17,692 | 100.0 | % |
| (1) | Includes $1.46 billion of liabilities with a contractual surrender charge of less than 5% of the account balance. |
| (2) | $369 million of the contracts with market value adjusted surrenders have a 30-45 day period at the end of their initial and subsequent interest rate guarantee periods (which are typically 1, 5, 7 or 10 years) during which there is no surrender charge or market value adjustment. $168 million of these contracts have their 30-45 day window period in 2020. |
| (3) | 89% of these contracts have a minimum interest crediting rate guarantee of 3% or higher. |
| (4) | Includes $698 million of contractholder funds on variable annuities reinsured to The Prudential Insurance Company of America, a subsidiary of Prudential Financial Inc., in 2006. |
Retail life and annuity products may be surrendered by customers for a variety of reasons. Reasons unique to individual customers include a current or unexpected need for cash or a change in life insurance coverage needs. Other key factors that may impact the likelihood of customer surrender include the level of the contract surrender charge, the length of time the contract has been in force, distribution channel, market interest rates, equity market conditions and potential tax implications.
In addition, the propensity for retail life insurance policies to lapse is lower than it is for fixed annuities because of the need for the insured to be re-underwritten upon policy replacement.
The surrender and partial withdrawal rate on deferred fixed annuities and interest-sensitive life insurance products, based on the beginning of year contractholder funds, was 6.0% in 2019 and 7.2% in 2018. We strive to promptly pay customers who request cash surrenders; however, statutory regulations generally provide up to six months in most states to fulfill surrender requests.
Our asset-liability management practices enable us to manage the differences between the cash flows generated by our investment portfolio and the expected cash flow requirements of our life insurance and annuity product obligations.
Capital Resources and Liquidity 2019 Form 10-K
Contractual obligations and commitments Our contractual obligations as of December 31, 2019, and the payments due by period are shown in the following table.
| Contractual obligations and payments due by period | ||||||||||||||||||||
| As of December 31, 2019 | ||||||||||||||||||||
| ($ in millions) | Total | Less than 1 year | 1 to 3 years | Over 3 years to 5 years | Over 5 years | |||||||||||||||
| Liabilities for collateral (1) | $ | 1,829 | $ | 1,829 | $ | — | $ | — | $ | — | ||||||||||
| Contractholder funds (2) | 35,751 | 2,058 | 3,903 | 3,561 | 26,229 | |||||||||||||||
| Reserve for life-contingent contract benefits (2) | 38,446 | 1,449 | 2,642 | 2,424 | 31,931 | |||||||||||||||
| Long-term debt (3) | 13,869 | 316 | 872 | 1,335 | 11,346 | |||||||||||||||
| Operating leases (4) | 644 | 133 | 223 | 151 | 137 | |||||||||||||||
| Unconditional purchase obligations (4) | 590 | 192 | 239 | 109 | 50 | |||||||||||||||
| Defined benefit pension plans and other postretirement benefit plans (4)(5) | 967 | 47 | 111 | 115 | 694 | |||||||||||||||
| Reserve for property and casualty insurance claims and claims expense (6) | 27,712 | 12,317 | 8,707 | 3,085 | 3,603 | |||||||||||||||
| Other liabilities and accrued expenses (7)(8) | 5,320 | 5,025 | 266 | 17 | 12 | |||||||||||||||
| Net unrecognized tax benefits (9) | 70 | 58 | 12 | — | — | |||||||||||||||
| Total contractual cash obligations | $ | 125,198 | $ | 23,424 | $ | 16,975 | $ | 10,797 | $ | 74,002 |
| (1) | Liabilities for collateral are typically fully secured with cash or short-term investments. We manage our short-term liquidity position to ensure the availability of a sufficient amount of liquid assets to extinguish short-term liabilities as they come due in the normal course of business, including utilizing potential sources of liquidity as disclosed previously. |
| (2) | Contractholder funds represent interest-bearing liabilities arising from the sale of products such as interest-sensitive life and fixed annuities, including immediate annuities without life contingencies. The reserve for life-contingent contract benefits relates primarily to traditional life insurance, immediate annuities with life contingencies and voluntary accident and health insurance. These amounts reflect the present value of estimated cash payments to be made to contractholders and policyholders. Certain of these contracts, such as immediate annuities without life contingencies, involve payment obligations where the amount and timing of the payment are essentially fixed and determinable. These amounts relate to (i) policies or contracts where we are currently making payments and will continue to do so and (ii) contracts where the timing of a portion or all of the payments has been determined by the contract. Other contracts, such as interest-sensitive life, fixed deferred annuities, traditional life insurance and voluntary accident and health insurance, involve payment obligations where a portion or all of the amount and timing of future payments is uncertain. For these contracts, we are not currently making payments and will not make payments until (i) the occurrence of an insurable event such as death or illness or (ii) the occurrence of a payment triggering event such as the surrender or partial withdrawal on a policy or deposit contract, which is outside of our control. For immediate annuities with life contingencies, the amount of future payments is uncertain since payments will continue as long as the annuitant lives. We have estimated the timing of payments related to these contracts based on historical experience and our expectation of future payment patterns. Uncertainties relating to these liabilities include mortality, morbidity, expenses, customer lapse and withdrawal activity, estimated additional deposits for interest-sensitive life contracts, and renewal premium for life policies, which may significantly impact both the timing and amount of future payments. Such cash outflows reflect adjustments for the estimated timing of mortality, retirement, and other appropriate factors, but are undiscounted with respect to interest. As a result, the sum of the cash outflows shown for all years in the table exceeds the corresponding liabilities of $17.69 billion for contractholder funds and $12.30 billion for reserve for life-contingent contract benefits as included in the Consolidated Statements of Financial Position as of December 31, 2019. The liability amount in the Consolidated Statements of Financial Position reflects the discounting for interest as well as adjustments for the timing of other factors as described above. Future premium collections are not included in the amounts presented in the table above. |
| (3) | Amount differs from the balance presented on the Consolidated Statements of Financial Position as of December 31, 2019, because the long-term debt amount above includes interest and excludes debt issuance costs. |
| (4) | Our payment obligations relating to operating leases, unconditional purchase obligations and pension and other postretirement benefits (“OPEB”) contributions are managed within the structure of our intermediate to long-term liquidity management program. |
| (5) | The pension plans’ obligations in the next 12 months represent our planned contributions to certain unfunded non-qualified plans where the benefit obligation exceeds the assets, and the remaining years’ contributions are projected based on the average remaining service period using the current underfunded status of the plans. The OPEB plans’ obligations are estimated based on the expected benefits to be paid. These liabilities are discounted with respect to interest, and as a result the sum of the cash outflows shown for all years in the table exceeds the corresponding liability amount of $534 million included in other liabilities and accrued expenses on the Consolidated Statements of Financial Position. |
| (6) | Reserve for property and casualty insurance claims and claims expense is an estimate of amounts necessary to settle all outstanding claims, including claims that have been IBNR as of the balance sheet date. We have estimated the timing of these payments based on our historical experience and our expectation of future payment patterns. However, the timing of these payments may vary significantly from the amounts shown above, especially for IBNR claims. The ultimate cost of losses may vary materially from recorded amounts that are our best estimates. |
| (7) | Other liabilities primarily include accrued expenses and certain benefit obligations and claim payments and other checks outstanding. Certain of these long-term liabilities are discounted with respect to interest, as a result, the sum of the cash outflows shown for all years in the table may exceed the corresponding liability amount. |
The Allstate Corporation 99
2019 Form 10-K Capital Resources and Liquidity
| (8) | Balance sheet liabilities not included in the table above include unearned and advance premiums of $16.13 billion and gross deferred tax liabilities of $2.35 billion. These items were excluded as they do not meet the definition of a contractual liability as we are not contractually obligated to pay these amounts to third parties. Rather, they represent an accounting mechanism that allows us to present our financial statements on an accrual basis. In addition, other liabilities of $280 million were not included in the table above because they did not represent a contractual obligation or the amount and timing of their eventual payment was sufficiently uncertain. |
| (9) | Net unrecognized tax benefits represent our potential future obligation to the taxing authority for a tax position that was not recognized in the consolidated financial statements. We believe it is reasonably possible that a decrease of up to $58 million in unrecognized tax benefits may occur within the next twelve months due to IRS settlements. The resolution of this obligation may be for an amount different than what we have accrued. |
| Contractual commitments and periods in which commitments expire | ||||||||||||||||||||
| As of December 31, 2019 | ||||||||||||||||||||
| ($ in millions) | Total | Less than 1 year | 1 to 3 years | Over 3 years to 5 years | Over 5 years | |||||||||||||||
| Other commitments – conditional | $ | 205 | $ | 91 | $ | 46 | $ | 8 | $ | 60 | ||||||||||
| Other commitments – unconditional | 2,889 | 284 | 250 | 385 | 1,970 | |||||||||||||||
| Total commitments | $ | 3,094 | $ | 375 | $ | 296 | $ | 393 | $ | 2,030 |
Contractual commitments represent investment commitments such as private placements, limited partnership interests and other loans. Limited partnership interests are typically funded over the commitment period which is shorter than the contractual expiration date of the partnership and as a result, the actual timing of the funding may vary.
We have agreements in place for services we conduct, generally at cost, between subsidiaries relating to insurance, reinsurance, loans and capitalization. All material intercompany transactions have been appropriately eliminated in consolidation. Intercompany transactions among insurance subsidiaries and affiliates have been approved by the appropriate departments of insurance as required.
For a more detailed discussion of our off-balance sheet arrangements, see Note 7 of the consolidated financial statements.
100 www.allstate.com
Enterprise Risk and Return Management 2019 Form 10-K
Enterprise Risk and Return Management
In addition to the normal risks of the business, Allstate is subject to significant risks as an insurer and a provider of other products and services. These risks are discussed in more detail in the Risk Factors section of this document. We regularly identify, measure, manage, monitor and report all significant risks. Major categories of enterprise risk are strategic, insurance, investment, financial, operational and culture.
Allstate manages these risks through an Enterprise Risk and Return Management (“ERRM”) framework that includes governance, processes, culture, and activities that are performed on an integrated, enterprise-wide basis, following our risk and return principles. Our legal and capital structures are designed to manage capital and solvency on a legal entity basis. Our risk-return principles define how we operate and guide risk and return decision making. These principles state that our priority is to maintain a strong foundation by protecting solvency, complying with laws and acting with integrity. Building upon this foundation, we strive to build strategic value and optimize risk and return.
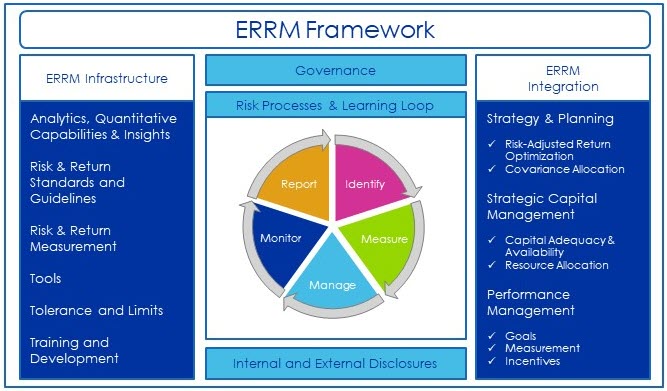
Governance ERRM governance includes board oversight, an executive management committee, and enterprise and market-facing business chief risk officers.
| • | The Allstate Corporation Board of Directors (“Allstate Board”) has overall responsibility for oversight of Management’s design and implementation of ERRM. |
| • | The Risk and Return Committee (“RRC”) of the Allstate Board oversees effectiveness of the ERRM program, governance structure and risk-related decision-making, while focusing on the Company’s overall risk profile. |
| • | The Audit Committee oversees the effectiveness of internal controls over financial reporting, disclosure controls and procedures as well as management’s risk control framework and cybersecurity program. |
| • | The ERRC, directs ERRM by establishing risk and return targets, determining economic capital levels and monitoring integrated strategies and actions from an enterprise risk and return perspective. |
The ERRC consists of Allstate’s chief executive officer, vice chair, chief financial officer, chief risk officer and other senior leaders.
| • | Other key committees work with the ERRC to direct ERRM activities, including the Operating Committee, the Operational Risk Council, the Information Security Council, the Corporate Asset Liability Committee, liability governance committees, and investment committees. |
Key risks are assessed and reported through comprehensive ERRM reports prepared for senior management and the RRC. The risk summary report communicates alignment of Allstate’s risk profile with risk and return principles while providing a perspective on risk position. Discussion promotes active engagement with management and the RRC. Internal controls over key risks are managed and reported to senior management and the Audit Committee of the Company through a semiannual risk control dashboard. Annually, we review risks related to the strategic plan, operating plan, and incentive compensation programs with the Allstate Board.
The Allstate Corporation 101
2019 Form 10-K Enterprise Risk and Return Management
Framework We apply these principles using an integrated ERRM framework that focuses on assessment, transparency and dialogue. Our framework provides a comprehensive view of risks and is used by senior management and business managers to drive risk-return based decisions. We continually validate and improve our ERRM practices by benchmarking and obtaining external perspectives.
Management and the ERRC rely on internal and external perspectives to determine an appropriate level of target economic capital. Internal perspectives include enterprise solvency and volatility assessments, stress scenarios, model assumptions, and management judgment. External considerations include NAIC risk-based capital as well as S&P’s, Moody’s, and A.M. Best’s capital adequacy measurement. Our economic capital reflects management’s view of the aggregate level of capital necessary to satisfy stakeholder interests, manage Allstate’s risk profile and maintain financial strength. The impact of strategic initiatives on enterprise risk is evaluated through the economic capital framework.
The NAIC has adopted the Risk Management and Own Risk and Solvency Assessment Model Act (“ORSA Model Act”), which has been enacted by our insurance subsidiaries’ domiciliary states. The ORSA Model Act requires that insurers maintain a risk management framework and conduct an internal own risk and solvency assessment of the insurer’s material risks in normal and stressed environments. Results of the assessment are filed annually.
Allstate’s risk appetite is measured through our economic capital framework. The enterprise risk appetite is cascaded into individual risk limits which set boundaries on the amount of risk we are willing to accept from one specific risk category before escalating for further management discussion and action. Risk limits are established based upon expected returns, volatility, potential tail losses, and impact on the enterprise portfolio. To effectively operate within risk limits and for risk-return optimization, business units establish risk limits and capital targets specific to their businesses. Allstate’s risk management strategies adapt to changes in business and market environments.
Process Our ERRM framework establishes a basis for transparency and dialogue across the enterprise and for continuous learning by embedding our risk and return management culture of identifying, assessing, managing, monitoring and reporting risks within the organization. Allstate designs business and enterprise strategies that seek to optimize risk-adjusted returns on capital. Risks are managed at both the legal entity and enterprise level.
A summary of our process to manage each of our major risk categories follows:
Strategic risk and return management addresses loss associated with inadequate or flawed business planning or strategy setting, including product mix, mergers or acquisitions and market positioning, and unexpected changes within the market or regulatory
environment in which Allstate operates. This includes reputational risk, which is the potential for negative publicity regarding a company’s conduct or business practices to adversely impact its profitability, operations, consumer base, or require costly litigation and other defensive measures.
We manage strategic risk through the Allstate Board and senior management strategy reviews that include a risk and return assessment of our strategic plans and ongoing monitoring of our strategic actions, key assumptions and the external competitive environment. Using the ERRM framework, Allstate designs strategies that seek to optimize risk-adjusted returns on economic capital for risk types including interest rate risk, credit risk, equity investments, including those with idiosyncratic return potential, auto profitability, and growing property exposure.
Insurance risk and return management addresses fluctuations in the timing, frequency, and severity of benefits, expenses, and premiums relative to the return expectations inclusive of systemic risk, concentration of insurance exposures, policy terms, reinsurance coverage, and claims handling practices.
Insurance risk exposures include our operating results and financial condition, claims frequency and severity, catastrophes and severe weather, and mortality and morbidity risk.
Insurance risk exposures are measured and monitored with different approaches including:
| • | Stochastic methods: measures and monitors risks such as natural catastrophes and severe weather. We develop probabilistic estimates of risk based on our exposures, historical observed volatility and/or industry-recognized models in the case of catastrophe risk. |
| • | Scenario analysis: measures and monitors risks and estimated losses due to extreme but plausible insurance-related events such as multiple hurricanes and/or wildfires. Scenarios evaluated include combined multiple event scenarios across risk categories and time periods, considering the effects of macroeconomic conditions. |
Investment risk and return management addresses financial loss due to changes in the valuations of assets held in the Allstate investment portfolio, as well as liability valuation within the Life and Annuity business. Such losses may be caused by macro developments, such as changes to interest rates, credit spreads, and equity price levels, or could be specific to individual investments in the portfolio. These losses can encompass both daily market volatility and permanent impairments of capital due to credit defaults and equity write-downs.
Investment risk exposures include interest rate risk, credit spread risk, equity price risk and foreign currency exchange rate risk.
Investment risk exposures are measured and monitored in a number of ways including:
| • | Sensitivity analysis: measures the impact from a unit change in a market risk input. |
102 www.allstate.com
Enterprise Risk and Return Management 2019 Form 10-K
| • | Stochastic and probabilistic estimation of potential losses: combines portfolio risk exposures with historical or recent market volatilities and correlations to assess the potential range of future investment results. |
| • | Scenario analysis: measures material adverse outcomes such as shock scenarios applied to credit, public and private equity markets. |
Some of the stress scenarios are a combination of multiple scenarios across risk categories and over multiple time periods, considering the effects of macroeconomic conditions.
Financial risk and return management addresses the risk of insufficient cash flows to meet corporate or policyholder needs, risk of inadequate aggregate capital or capital within any subsidiary, inability to access capital markets, credit risk that arises when an external party fails to meet a contractual obligation such as reinsurance for ceded claims, or risk associated with a business counterparty default.
We actively manage our capital and liquidity levels in light of changing market, economic, and business conditions. Our capital position, capital generation capacity, and targeted risk profile provide strategic and financial flexibility.
We generally assess solvency on a statutory accounting basis, but also consider holding company capital and liquidity needs. Current enterprise capital, which exceeds economic targeted levels, is based on a combination of statutory surplus and deployable assets at the parent holding company level.
Operational risk and return management addresses loss as a result of the failure of people, processes, systems or culture. Operational risk exposures include human capital, privacy, regulatory compliance, ethics, fraud, system availability, cybersecurity, data quality, disaster recovery and business continuity.
Operational risk is managed at the enterprise and market-facing business levels, through an integrated Operational Risk and Return Management (“ORRM”) program, with resources throughout the enterprise identifying, measuring, monitoring, managing, and reporting on operational risks at a detailed level.
From time to time, we engage independent advisors to assess and consult on operational risks. We also perform assessments of the quality of our operational risk program and identify opportunities to strengthen our internal controls.
 Culture risk and return management addresses the potential for loss of stakeholder value from a suboptimal work environment, missed opportunities, or ineffective risk management practices. Allstate defines organization culture as a self-sustaining system of shared values, principles and priorities that shape beliefs, drive behavior and influence decision-making within an organization.
Culture is managed based on a set of core cultural elements that have been established as a basis for assessment and measurement. Results of culture risk assessment are reported to the ERRC and RRC throughout the year.
The Allstate Corporation 103
2019 Form 10-K Application of Critical Accounting Estimates
Applica****tion of Critical Accounting Est****imates
The preparation of financial statements in conformity with GAAP requires management to adopt accounting policies and make estimates and assumptions that affect amounts reported in the consolidated financial statements. The most critical estimates, presented in the order they appear in the Consolidated Statements of Financial Position, include those used in determining:
| • | Fair value of financial assets |
| • | Impairment of fixed income securities |
| • | Deferred policy acquisition costs amortization |
| • | Evaluation of goodwill for impairment |
| • | Reserve for property and casualty insurance claims and claims expense estimation |
| • | Reserve for life-contingent contract benefits estimation |
| • | Pension and other postretirement plans net costs and assumptions |
In making these determinations, management makes subjective and complex judgments that frequently require estimates about matters that are inherently uncertain. Many of these policies, estimates and related judgments are common in the insurance and financial services industries; others are specific to our businesses and operations. It is reasonably likely that changes in these estimates could occur from period to period and result in a material impact on our consolidated financial statements.
A summary of each of these critical accounting estimates follows. For a more detailed discussion of the effect of these estimates on our consolidated financial statements, and the judgments and assumptions related to these estimates, see the referenced sections of this document. For a more detailed summary of our significant accounting policies, see the notes to the consolidated financial statements.
Fair value of financial assets Fair value is defined as the price that would be received to sell an asset or paid to transfer a liability in an orderly transaction between market participants at the measurement date. We are responsible for the determination of fair value of financial assets and the supporting assumptions and methodologies. We use independent third-party valuation service providers, broker quotes and internal pricing methods to determine fair values. We obtain or calculate only one single quote or price for each financial instrument.
Valuation service providers typically obtain data about market transactions and other key valuation model inputs from multiple sources and, through the use of proprietary models, produce valuation information in the form of a single fair value for individual fixed income and other securities for which a fair value has been requested under the terms of our agreements. The inputs used by the valuation service providers include, but are not limited to, market prices
from recently completed transactions and transactions of comparable securities, interest rate yield curves, credit spreads, liquidity spreads, currency rates, and other information, as applicable. Credit and liquidity spreads are typically implied from completed transactions and transactions of comparable securities. Valuation service providers also use proprietary discounted cash flow models that are widely accepted in the financial services industry and similar to those used by other market participants to value the same financial instruments. The valuation models take into account, among other things, market observable information as of the measurement date, as described above, as well as the specific attributes of the security being valued including its term, interest rate, credit rating, industry sector, and where applicable, collateral quality and other issue or issuer specific information. Executing valuation models effectively requires seasoned professional judgment and experience. For certain equity securities, valuation service providers provide market quotations for completed transactions on the measurement date. In cases where market transactions or other market observable data is limited, the extent to which judgment is applied varies inversely with the availability of market observable information.
For certain of our financial assets measured at fair value, where our valuation service providers cannot provide fair value determinations, we obtain a single non-binding price quote from a broker familiar with the security who, similar to our valuation service providers, may consider transactions or activity in similar securities among other information. The brokers providing price quotes are generally from the brokerage divisions of financial institutions with market making, underwriting and distribution expertise regarding the security subject to valuation.
The fair value of certain financial assets, including privately placed corporate fixed income securities and free-standing derivatives, for which our valuation service providers or brokers do not provide fair value determinations, is developed using valuation methods and models widely accepted in the financial services industry. Our internal pricing methods are primarily based on models using discounted cash flow methodologies that develop a single best estimate of fair value. Our models generally incorporate inputs that we believe are representative of inputs other market participants would use to determine fair value of the same instruments, including yield curves, quoted market prices of comparable securities or instruments, published credit spreads, and other applicable market data as well as instrument-specific characteristics that include, but are not limited to, coupon rates, expected cash flows, sector of the issuer, and call provisions. Because judgment is required in developing the fair values of these financial assets, they may differ from the amount actually received to sell an asset in an orderly transaction between market participants at the measurement date. Moreover, the use of different valuation assumptions may have a material effect on the financial assets’ fair values.
104 www.allstate.com
Application of Critical Accounting Estimates 2019 Form 10-K
For most of our financial assets measured at fair value, all significant inputs are based on or corroborated by market observable data, and significant management judgment does not affect the periodic determination of fair value. The determination of fair value using discounted cash flow models involves management judgment when significant model inputs are not based on or corroborated by market observable data. However, where market observable data is available, it takes precedence, and as a result, no range of reasonably likely inputs exists from which the basis of a sensitivity analysis could be constructed.
We gain assurance that our financial assets are appropriately valued through the execution of various processes and controls designed to ensure the overall reasonableness and consistent application of valuation methodologies, including inputs and assumptions, and compliance with accounting standards. For fair values received from third parties or internally estimated, our processes and controls are designed to ensure that the valuation methodologies are appropriate and consistently applied, the inputs and assumptions are reasonable and consistent with the objective of determining fair value, and the fair values are accurately recorded. For example, on a continuing basis, we assess the reasonableness of individual fair values that have stale security prices or that exceed certain thresholds as compared to previous fair values received from valuation service providers or brokers or derived from internal models. We perform procedures to understand and assess the methodologies, processes and controls of valuation service providers.
In addition, we may validate the reasonableness of fair values by comparing information obtained from valuation service providers or brokers to other third-party valuation sources for selected securities. We perform ongoing price validation procedures such as back-testing of actual sales, which corroborate the various inputs used in internal models to market observable data. When fair value determinations are expected to be more variable, we validate them through reviews by members of management who have relevant expertise and who are independent of those charged with executing investment transactions.
We also perform an analysis to determine whether there has been a significant decrease in the volume and level of activity for the asset when compared to normal market activity, and if so, whether transactions may not be orderly. Among the indicators we consider in determining whether a significant decrease in the volume and level of market activity for a specific asset has occurred include the level of new issuances in the primary market, trading volume in the secondary market, level of credit spreads over historical levels, bid-ask spread, and price consensuses among market participants and sources. If evidence indicates that prices are based on transactions that are not orderly, we place little, if any, weight on the transaction price and will estimate fair value using an internal model. As of December 31, 2019 and 2018, we did not adjust fair values provided by our valuation service providers or brokers or substitute them with an internal model for such securities.
| Fixed income, equity securities and short-term investments by source of fair value determination | |||||||
| December 31, 2019 | |||||||
| ($ in millions) | Fair value | Percent to total | |||||
| Fair value based on internal sources | $ | 2,611 | 3.7 | % | |||
| Fair value based on external sources (1) | 68,851 | 96.3 | |||||
| Total | $ | 71,462 | 100.0 | % |
| (1) | Includes $373 million that are valued using broker quotes and $269 million that are valued using quoted prices or quoted net asset values from deal sponsors. |
For additional detail on fair value measurements, see Note 6 of the consolidated financial statements.
Impairment of fixed income securities For fixed income securities classified as available-for-sale, the difference between fair value and amortized cost, net of certain other items and deferred income taxes (as disclosed in Note 5 of the consolidated financial statements), is reported as a component of AOCI on the Consolidated Statements of Financial Position and is not reflected in the operating results of any period until reclassified to net income upon the consummation of a transaction with an unrelated third party or when a write-down is recorded due to an other-than-temporary decline in fair value. We have a comprehensive portfolio monitoring process to identify and evaluate each fixed income security whose carrying value may be other-than-temporarily impaired.
For each fixed income security in an unrealized loss position, we assess whether management with the
appropriate authority has made the decision to sell or whether it is more likely than not we will be required to sell the security before recovery of the amortized cost basis for reasons such as liquidity, contractual or regulatory purposes. If a security meets either of these criteria, the security’s decline in fair value is considered other than temporary and is recorded in earnings.
If we have not made the decision to sell the fixed income security and it is not more likely than not we will be required to sell the fixed income security before recovery of its amortized cost basis, we evaluate whether we expect to receive cash flows sufficient to recover the entire amortized cost basis of the security. We use our best estimate of future cash flows expected to be collected from the fixed income security, discounted at the security’s original or current effective rate, as appropriate, to calculate a recovery value and determine whether a credit loss exists. The determination of cash flow estimates is inherently subjective, and methodologies may vary depending on
The Allstate Corporation 105
2019 Form 10-K Application of Critical Accounting Estimates
facts and circumstances specific to the security. All reasonably available information relevant to the collectability of the security, including past events, current conditions, and reasonable and supportable assumptions and forecasts, is considered when developing the estimate of cash flows expected to be collected. That information generally includes, but is not limited to, the remaining payment terms of the security, prepayment speeds, foreign exchange rates, the financial condition and future earnings potential of the issue or issuer, expected defaults, expected recoveries, the value of underlying collateral, vintage, geographic concentration, available reserves or escrows, current subordination levels, third-party guarantees and other credit enhancements. Other information, such as industry analyst reports and forecasts, sector credit ratings, financial condition of the bond insurer for insured fixed income securities, and other market data relevant to the realizability of contractual cash flows, may also be considered. The estimated fair value of collateral will be used to estimate recovery value if we determine that the security is dependent on the liquidation of collateral for ultimate settlement. If the estimated recovery value is less than the amortized cost of the security, a credit loss exists and an other-than-temporary impairment for the difference between the estimated recovery value and amortized cost is recorded in earnings. The portion of the unrealized loss related to factors other than credit remains classified in AOCI. If we determine that the fixed income security does not have sufficient cash flow or other information to estimate a recovery value for the security, we may conclude that the entire decline in fair value is deemed to be credit related and the loss is recorded in earnings.
Once assumptions and estimates are made, any number of changes in facts and circumstances could cause us to subsequently determine that a fixed income security is other-than-temporarily impaired, including: 1) general economic conditions that are worse than previously forecast or that have a greater adverse effect on a particular issuer or industry sector than originally estimated; 2) changes in the facts and circumstances related to a particular issue or issuer’s ability to meet all of its contractual obligations; and 3) changes in facts and circumstances that result in management’s decision to sell or result in our assessment that it is more likely than not we will be required to sell before recovery of the amortized cost basis. Changes in assumptions, facts and circumstances could result in additional charges to earnings in future periods to the extent that losses are realized. The charge to earnings, while potentially significant to net income, would not have a significant effect on shareholders’ equity, since our fixed income securities are designated as available-for-sale and carried at fair value and as a result, any related unrealized loss, net of deferred income taxes and related DAC, deferred sales inducement costs and reserves for life-contingent contract benefits, would already be reflected as a component of AOCI in shareholders’ equity.
The determination of the amount of other-than-temporary impairment is an inherently subjective
process based on periodic evaluations of the factors described above. Such evaluations and assessments are revised as conditions change and new information becomes available. We update our evaluations regularly and reflect changes in other-than-temporary impairments in our results of operations as such evaluations are revised. The use of different methodologies and assumptions in the determination of the amount of other-than-temporary impairments may have a material effect on the amounts recognized and presented within the consolidated financial statements.
For additional detail on investment impairments, see Note 5 of the consolidated financial statements.
Deferred policy acquisition costs amortization We incur significant costs in connection with acquiring insurance policies and investment contracts. In accordance with GAAP, costs that are related directly to the successful acquisition of new or renewal insurance policies and investment contracts are deferred and recorded as an asset on the Consolidated Statements of Financial Position.
DAC related to property and casualty contracts is amortized into income as premiums are earned, typically over periods of six or twelve months for personal lines policies or generally one to five years for protection plans and other contracts (primarily related to finance and insurance products).
DAC related to traditional life and voluntary accident and health insurance is amortized over the premium paying period of the related policies in proportion to the estimated revenues on such business. Significant assumptions relating to estimated premiums, investment returns, as well as mortality, persistency and expenses to administer the business are established at the time the policy is issued and are generally not revised during the life of the policy. The assumptions for determining the timing and amount of DAC amortization are consistent with the assumptions used to calculate the reserve for life-contingent contract benefits. Any deviations from projected business in force resulting from actual policy terminations differing from expected levels and any estimated premium deficiencies may result in a change to the rate of amortization in the period such events occur. Generally, the amortization periods for these policies approximate the estimated lives of the policies. The recovery of DAC is dependent upon the future profitability of the business.
We periodically review the adequacy of reserves and recoverability of DAC using actual experience and current assumptions. We evaluate our traditional life insurance products, immediate annuities with life contingencies, and voluntary accident and health insurance products individually. In the event actual experience and current assumptions are adverse compared to the original assumptions and a premium deficiency is determined to exist, any remaining unamortized DAC balance must be expensed to the extent not recoverable and a premium deficiency reserve may be required if the remaining DAC balance is insufficient to absorb the deficiency. In 2019 and
106 www.allstate.com
Application of Critical Accounting Estimates 2019 Form 10-K
2018, our reviews concluded that no premium deficiency adjustments were necessary. For additional detail on reserve adequacy, see the Reserve for life-contingent contract benefits estimation section.
DAC related to interest-sensitive life insurance is amortized in proportion to the incidence of the total present value of gross profits, which includes both actual historical gross profits (“AGP”) and estimated future gross profits (“EGP”) expected to be earned over the estimated lives of the contracts. The amortization is net of interest on the prior period DAC balance using rates established at the inception of the contracts. Actual amortization periods generally range from 15-30 years; however, incorporating estimates of the rate of customer surrenders, partial withdrawals and deaths generally results in the majority of the DAC being amortized during the surrender charge period, which is typically 10-20 years for interest-sensitive life. The rate of DAC amortization is reestimated and adjusted by a cumulative charge or credit to income when there is a difference between the incidence of actual versus expected gross profits in a reporting period or when there is a change in total EGP.
AGP and EGP primarily consist of the following components: contract charges for the cost of insurance less mortality costs and other benefits (benefit margin); investment income and realized capital gains and losses less interest credited (investment margin); and surrender and other contract charges less maintenance expenses (expense margin). The principal assumptions for determining the amount of EGP are mortality, persistency, expenses, investment returns, including capital gains and losses on assets supporting contract liabilities, interest crediting rates to contractholders, and the effects of any hedges. These assumptions are reasonably likely to have the greatest impact on the amount of DAC amortization. Changes in these assumptions can be offsetting and we are unable to reasonably predict their future movements or offsetting impacts over time.
Each reporting period, DAC amortization is recognized in proportion to AGP for that period adjusted for interest on the prior period DAC balance.
This amortization process includes an assessment of AGP compared to EGP, the actual amount of business remaining in force and realized capital gains and losses on investments supporting the product liability. The impact of realized capital gains and losses on amortization of DAC depends upon which product liability is supported by the assets that give rise to the gain or loss. If the AGP is greater than EGP in the period, but the total EGP is unchanged, the amount of DAC amortization will generally increase, resulting in a current period decrease to earnings. The opposite result generally occurs when the AGP is less than the EGP in the period, but the total EGP is unchanged. However, when DAC amortization or a component of gross profits for a quarterly period is potentially negative (which would result in an increase of the DAC balance) as a result of negative AGP, the specific facts and circumstances surrounding the potential negative amortization are considered to determine whether it is appropriate for recognition in the consolidated financial statements. Negative amortization is only recorded when the increased DAC balance is determined to be recoverable based on facts and circumstances. For products whose supporting investments are exposed to capital losses in excess of our expectations which may cause periodic AGP to become temporarily negative, EGP and AGP utilized in DAC amortization may be modified to exclude the excess capital losses.
Annually, we review and update the assumptions underlying the projections of EGP, including mortality, persistency, expenses, investment returns, comprising investment income and realized capital gains and losses, interest crediting rates and the effect of any hedges, using our experience and industry experience. At each reporting period, we assess whether any revisions to assumptions used to determine DAC amortization are required. These reviews and updates may result in amortization acceleration or deceleration, which are referred to as “DAC unlocking”. If the update of assumptions causes total EGP to increase, the rate of DAC amortization will generally decrease, resulting in a current period increase to earnings. A decrease to earnings generally occurs when the assumption update causes the total EGP to decrease.
| Effect on DAC amortization of changes in assumptions relating to gross profit components | ||||||||
| For the years ended December 31, | ||||||||
| ($ in millions) | 2019 | 2018 | ||||||
| Investment margin | $ | 23 | $ | 10 | ||||
| Benefit margin | 38 | (11 | ) | |||||
| Expense margin | (1 | ) | 2 | |||||
| Net acceleration | $ | 60 | $ | 1 |
In 2019, DAC amortization acceleration for changes in the investment margin component of EGP was due to lower projected future interest rates and investment returns compared to our previous expectations. The acceleration related to benefit margin was due to decreased projected interest rates that result in lower projected policyholder account values which increases benefits on guaranteed products and more refined policy level information and assumptions.
In 2018, DAC amortization acceleration for changes in the investment margin component of EGP related to interest-sensitive life insurance and was due to lower projected investment returns. The deceleration related to benefit margin primarily related to interest-sensitive life insurance and was due to a decrease in projected mortality.
The Allstate Corporation 107
2019 Form 10-K Application of Critical Accounting Estimates
The following table displays the sensitivity of reasonably likely changes in assumptions included in the gross profit components of investment margin or
benefit margin to amortization of the DAC balance as of December 31, 2019.
| ($ in millions) | Increase/(reduction) | |||
| Increase in future investment margins of 25 basis points | $ | 52 | ||
| Decrease in future investment margins of 25 basis points | (57) | |||
| Decrease in future life mortality by 1% | $ | 14 | ||
| Increase in future life mortality by 1% | (14) |
Any potential changes in assumptions discussed above are measured without consideration of correlation among assumptions. Therefore, it would be inappropriate to add them together in an attempt to estimate overall variability in amortization**.**
For additional detail related to DAC, see the Allstate Life Segment section of the MD&A.
Evaluation of goodwill for impairment Goodwill represents the excess of amounts paid for acquiring businesses over the fair value of the net assets acquired, less any impairment of goodwill recognized. Goodwill is recognized when acquired and allocated to reporting units based on which unit is expected to benefit from the synergies of the business combination. Our goodwill reporting units are equivalent to our reportable segments: Allstate Protection, Service Businesses, Allstate Life and Allstate Benefits to which goodwill has been assigned.
Upon acquisition, the purchase price of the acquired business is assumed to be its fair value. Subsequently, we estimate the fair value of our businesses in each goodwill reporting unit, utilizing a combination of widely accepted valuation techniques including a stock price and market capitalization analysis, discounted cash flow (“DCF”) calculations and an estimate of a business’s fair value using market to book multiples derived from peer company analysis. The stock price and market capitalization analysis takes into consideration the quoted market price of our outstanding common stock and includes a control premium, derived from relevant historical acquisition activity, in determining the estimated fair value of the consolidated entity before allocating that fair value to individual reporting units. The DCF analysis utilizes long term assumptions for revenues, investment income, benefits, claims, other operating expenses and income taxes to produce projections of both income and cash flows available for dividends that are present valued using the weighted average cost of capital. Market to book multiples represent the mean market to book multiple for selected peer companies with operations similar to our goodwill reporting units to which the multiple is applied. The outputs from these methods are weighted based on the nature of the business and the relative amount of market observable assumptions supporting the estimates. The computed values are then weighted to reflect the fair value estimate based on the specific attributes of each goodwill reporting unit.
Estimating the fair value of reporting units is a subjective process that involves the use of significant estimates by management. Changes in market inputs
or other events impacting the fair value of these businesses, including discount rates, operating results, investment returns, strategies and growth rate assumptions, among other factors, could result in goodwill impairments, resulting in a charge to income. Certain of our goodwill reporting units are comprised of a combination of legacy and acquired businesses and as a result have substantial internally generated and unrecognized intangibles and fair values that significantly exceed their carrying values. Our Service Businesses goodwill reporting unit is more heavily comprised of newly acquired businesses and as a result does not have a significant excess of fair value over its carrying value attributable to internally generated unrecognized intangibles. Therefore, this reporting unit may be more susceptible to potential future goodwill impairment based on changes to growth or margin assumptions.
The most significant assumptions utilized in the determination of the estimated fair value of the Service Businesses reporting unit are the earnings growth rate and discount rate. The growth rate utilized in our fair value estimates is consistent with our plans to grow these businesses more rapidly over the near-term with more moderated growth rates in later years.
The discount rate, which is consistent with the weighted average cost of capital expected by a market participant, is based upon industry specific required rates of return, including consideration of both debt and equity components of the capital structure. Our discount rate may be impacted by changes in the risk-free rate, cost of debt, equity risk premium and entity specific risks.
Changes in our growth assumptions, including the risk of loss of key customers, or adverse changes in the discount rates could result in a decline in fair value and result in a goodwill impairment charge.
Reserve for property and casualty insurance claims and claims expense estimation Reserves are established to provide for the estimated costs of paying claims and claims expenses under insurance policies we have issued. Underwriting results are significantly influenced by estimates of property and casualty insurance claims and claims expense reserves. These reserves are an estimate of amounts necessary to settle all outstanding claims, including IBNR, as of the financial statement date.
Characteristics of reserves Reserves are established independently of business segment management for each business segment and line of business based on estimates of the ultimate cost to
108 www.allstate.com
Application of Critical Accounting Estimates 2019 Form 10-K
settle claims, less losses that have been paid. The significant lines of business are auto, homeowners, and other personal lines for Allstate Protection, and asbestos, environmental, and other discontinued lines for Discontinued Lines and Coverages. Allstate Protection’s claims are typically reported promptly with relatively little reporting lag between the date of occurrence and the date the loss is reported. Auto and homeowners liability losses generally take an average of about two years to settle, while auto physical damage, homeowners property and other personal lines have an average settlement time of less than one year. Discontinued Lines and Coverages involve long-tail losses, such as those related to asbestos and environmental claims, which often involve substantial reporting lags and extended times to settle.
Reserves are the difference between the estimated ultimate cost of losses incurred and the amount of paid losses as of the reporting date. Reserves are estimated for both reported and unreported claims, and include estimates of all expenses associated with processing and settling all incurred claims. We update most of our reserve estimates quarterly and as new information becomes available or as events emerge that may affect the resolution of unsettled claims. Changes in prior reserve estimates (reserve reestimates), which may be material, are determined by comparing updated estimates of ultimate losses to prior estimates, with the differences recorded as property and casualty insurance claims and claims expense in the Consolidated Statements of Operations in the period such changes are determined. Estimating the ultimate cost of claims and claims expenses is an inherently uncertain and complex process involving a high degree of judgment and is subject to the evaluation of numerous variables.
The actuarial methods used to develop reserve estimates Reserve estimates are derived by using several different actuarial estimation methods that are variations on one primary actuarial technique. The actuarial technique is known as a “chain ladder” estimation process in which historical loss patterns are applied to actual paid losses and reported losses (paid losses plus individual case reserves established by claim adjusters) for an accident year or a report year to create an estimate of how losses are likely to develop over time. An accident year refers to classifying claims based on the year in which the claims occurred. A report year refers to classifying claims based on the year in which the claims are reported. Both classifications are used to prepare estimates of required reserves for payments to be made in the future. The key assumptions affecting our reserve estimates comprise data elements including claim counts, paid losses, case reserves, and development factors calculated with this data.
See Discontinued and Lines and Coverages reserve estimates section for specific disclosures of industry and actuarial best practices for this segment.
In the chain ladder estimation technique, a ratio (development factor) is calculated which compares current period results to results in the prior period for
each accident year. A multi-year average development factor, based on historical results, is usually multiplied by the current period experience to estimate the development of losses of each accident year into the next time period. The development factors for the future time periods for each accident year are compounded over the remaining future periods to calculate an estimate of ultimate losses for each accident year. The implicit assumption of this technique is that an average of historical development factors is predictive of future loss development, as the significant size of our experience database achieves a high degree of statistical credibility in actuarial projections of this type. The effects of inflation are implicitly considered in the reserving process, the implicit assumption being that a multi-year average development factor includes an adequate provision. The development factor estimation methodology may require modification when data changes due to changing claim reporting practices, changing claim settlement patterns, external regulatory or financial influences, or contractual coverage changes. In these situations, actuarial estimation techniques are applied to appropriately modify the “chain ladder” assumptions. These actuarial techniques are necessary to analyze the effects of changing loss data to develop modified development factor selections. The actuarial estimation techniques include exclusion of unusual losses or aberrations and adjustment of historical data to present conditions. Actuarially modified patterns of development are calculated with the adjusted historical data. Actuarial judgment is then applied to make appropriate development factor assumptions needed to develop a best estimate of gross ultimate losses. These developments are discussed further in the Allstate brand loss ratio disclosures in the Allstate Protection Segment and the Claims and Claims Expense Reserves sections of the MD&A.
How reserve estimates are established and updated Reserve estimates are developed at a very detailed level, and the results of these numerous micro-level best estimates are aggregated to form a consolidated reserve estimate. For example, over one thousand actuarial estimates of the types described above are prepared each quarter to estimate losses for each line of insurance, major components of losses (such as coverages and perils), major states or groups of states and for reported losses and IBNR. The actuarial methods described above are used to analyze the settlement patterns of claims by determining the development factors for specific data elements that are necessary components of a reserve estimation process. Development factors are calculated quarterly and periodically throughout the year for data elements such as claim counts reported and settled, paid losses, and paid losses combined with case reserves. The calculation of development factors from changes in these data elements also impacts claim severity trends. The historical development patterns for these data elements are used as the assumptions to calculate reserve estimates.
Often, several different estimates are prepared for each detailed component, incorporating alternative
The Allstate Corporation 109
2019 Form 10-K Application of Critical Accounting Estimates
analyses of changing claim settlement patterns and other influences on losses, from which we select our best estimate for each component, occasionally incorporating additional analyses and actuarial judgment, as described above. These micro-level estimates are not based on a single set of assumptions. Actuarial judgments that may be applied to these components of certain micro-level estimates generally do not have a material impact on the consolidated level of reserves. Moreover, this detailed micro-level process does not permit or result in a compilation of a company-wide roll up to generate a range of needed loss reserves that would be meaningful. Based on our review of these estimates, our best estimate of required reserves for each state/line/coverage component is recorded for each accident year, and the required reserves for each component are summed to create the reserve balance carried on our Consolidated Statements of Financial Position.
Reserves are reestimated quarterly and periodically throughout the year, by combining historical results with current actual results to calculate new development factors. This process continuously incorporates the historic and latest actual trends, and other underlying changes in the data elements used to calculate reserve estimates. New development factors are likely to differ from previous development factors used in prior reserve estimates because actual results
(claims reported or settled, losses paid, or changes to case reserves) occur differently than the implied assumptions contained in the previous development factor calculations. If claims reported, paid losses, or case reserve changes are greater or less than the levels estimated by previous development factors, reserve reestimates increase or decrease. When actual development of these data elements is different than the historical development pattern used in a prior period reserve estimate, a new reserve is determined. The difference between indicated reserves based on new reserve estimates and recorded reserves (the previous estimate) is the amount of reserve reestimate and is recognized as an increase or decrease in claims and claims expense in the Consolidated Statements of Operations. Total net reserve reestimates, after-tax, favorable impact on net income applicable to common shareholders were 2.2%, 10.0% and 9.5% in 2019, 2018 and 2017, respectively. The 3-year average of net reserve reestimates as a percentage of total reserves was a favorable 2.1% for Allstate Protection, an unfavorable 6.9% for Discontinued Lines and Coverages and a favorable 1.1% for Service Businesses, each of these results being consistent within a reasonable actuarial tolerance for the respective businesses. A more detailed discussion of reserve reestimates is presented in the Claims and Claims Expense Reserves section of the MD&A.
| Net claims and claims expense reserves by segment and line of business | ||||||||||||
| As of December 31, | ||||||||||||
| ($ in millions) | 2019 | 2018 | 2017 | |||||||||
| Allstate Protection | ||||||||||||
| Auto | $ | 14,728 | $ | 14,378 | $ | 14,051 | ||||||
| Homeowners | 2,138 | 2,157 | 2,205 | |||||||||
| Other lines | 2,530 | 2,290 | 2,105 | |||||||||
| Total Allstate Protection | 19,396 | 18,825 | 18,361 | |||||||||
| Discontinued Lines and Coverages | ||||||||||||
| Asbestos | 810 | 866 | 884 | |||||||||
| Environmental | 179 | 170 | 166 | |||||||||
| Other discontinued lines | 376 | 355 | 357 | |||||||||
| Total Discontinued Lines and Coverages | 1,365 | 1,391 | 1,407 | |||||||||
| Total Service Businesses | 39 | 52 | 86 | |||||||||
| Total net claims and claims expense reserves | $ | 20,800 | $ | 20,268 | $ | 19,854 |
Allstate Protection reserve estimate
Factors affecting reserve estimates Reserve estimates are developed based on the processes and historical development trends described above. These estimates are considered in conjunction with known facts and interpretations of circumstances and factors including our experience with similar cases, actual claims paid, historical trends involving claim payment patterns and pending levels of unpaid claims, loss management programs, product mix and contractual terms, changes in law and regulation, judicial decisions, and economic conditions. When we experience changes of the type previously mentioned, we may need to apply actuarial judgment in the determination and selection of development factors considered more reflective of the new trends, such as combining shorter or longer periods of historical results with current actual results to produce development factors based
on two-year, three-year, or longer development periods to reestimate our reserves. For example, if a legal change is expected to have a significant impact on the development of claim severity for a coverage which is part of a particular line of insurance in a specific state, actuarial judgment is applied to determine appropriate development factors that will most accurately reflect the expected impact on that specific estimate. Another example would be when a change in economic conditions is expected to affect the cost of repairs to damaged autos or property for a particular line, coverage, or state, actuarial judgment is applied to determine appropriate development factors to use in the reserve estimate that will most accurately reflect the expected impacts on severity development.
110 www.allstate.com
Application of Critical Accounting Estimates 2019 Form 10-K
As claims are reported, for certain liability claims of sufficient size and complexity, the field adjusting staff establishes case reserve estimates of ultimate cost, based on their assessment of facts and circumstances related to each individual claim. For other claims which occur in large volumes and settle in a relatively short time frame, it is not practical or efficient to set case reserves for each claim, and a statistical case reserve is set for these claims based on estimation techniques described above. In the normal course of business, we may also supplement our claims processes by utilizing third-party adjusters, appraisers, engineers, inspectors, and other professionals and information sources to assess and settle catastrophe and non-catastrophe related claims.
Historically, the case reserves set by the field adjusting staff have not proven to be an entirely accurate estimate of the ultimate cost of claims. To provide for this, a development reserve is estimated using the processes described above and allocated to pending claims as a supplement to case reserves. Typically, the case, including statistical case, and supplemental development reserves comprise about 90% of total reserves.
Another major component of reserves is IBNR, which comprises about 10% of total reserves. IBNR can be a small percentage of reserves for relatively short-term claims, such as auto physical damage claims, or a large percentage of reserves for claims that have uncertain payout requirements over a long period of time, such as auto injury and MCCA claims. All major components of reserves are affected by changes in claim frequency as well as claim severity.
Generally, the initial reserves for a new accident year are established based on actual claim frequency and severity assumptions for different business segments, lines and coverages based on historical relationships to relevant inflation indicators. Reserves for prior accident years are statistically determined using processes described above. Changes in auto claim frequency may result from changes in mix of business, the rate of distracted driving, miles driven or other macroeconomic factors. Changes in auto current year claim severity are generally influenced by inflation in the medical and auto repair sectors of the economy and the effectiveness and efficiency of our claim practices. We mitigate these effects through various loss management programs. Injury claims are affected largely by medical cost inflation while physical damage claims are affected largely by auto repair cost inflation and used car prices. For auto physical damage coverages, we monitor our rate of increase in average cost per claim against the auto maintenance, repair, parts and equipment price indices. We believe our claim settlement initiatives, such as improvements to the claim review and settlement process, the use of special investigative units to detect fraud and handle suspect claims, litigation management and defense strategies, as well as various other loss management initiatives underway, contribute to the mitigation of injury and physical damage severity trends.
Changes in homeowners current year claim severity are generally influenced by inflation in the cost
of building materials, the cost of construction and property repair services, the cost of replacing home furnishings and other contents, the types of claims that qualify for coverage, deductibles, other economic and environmental factors and the effectiveness and efficiency of our claim practices. We employ various loss management programs to mitigate the effect of these factors.
As loss experience for the current year develops for each type of loss, it is monitored relative to initial assumptions until it is judged to have sufficient statistical credibility. From that point in time and forward, reserves are reestimated using statistical actuarial processes to reflect the impact actual loss trends have on development factors incorporated into the actuarial estimation processes. Statistical credibility is usually achieved by the end of the first calendar year; however, when trends for the current accident year exceed initial assumptions sooner, they are usually determined to be credible, and reserves are increased accordingly.
The very detailed processes for developing reserve estimates, and the lack of a need and existence of a common set of assumptions or development factors, limits aggregate reserve level testing for variability of data elements. However, by applying standard actuarial methods to consolidated historic accident year loss data for major loss types, comprising auto injury losses, auto physical damage losses and homeowner losses, we develop variability analyses consistent with the way we develop reserves by measuring the potential variability of development factors, as described in the section titled “Potential Reserve Estimate Variability” below.
Causes of reserve estimate uncertainty Since reserves are estimates of unpaid portions of claims and claims expenses that have occurred, including IBNR losses, the establishment of appropriate reserves, including reserves for catastrophe losses, requires regular reevaluation and refinement of estimates to determine our ultimate loss estimate.
At each reporting date, the highest degree of uncertainty in estimates for most of our losses from ongoing businesses arise from claims remaining to be settled for the current accident year and the most recent preceding accident year. The greatest degree of uncertainty exists in the current accident year because the current accident year contains the greatest proportion of losses that have not been reported or settled but must be estimated as of the current reporting date. Most of these losses relate to damaged property such as automobiles and homes, and medical care for injuries from accidents. During the first year after the end of an accident year, a large portion of the total losses for that accident year are settled. When accident year losses paid through the end of the first year following the initial accident year are incorporated into updated actuarial estimates, the trends inherent in the settlement of claims emerge more clearly. Consequently, this is the point in time at which we tend to make our largest reestimates of losses for an accident year. After the second year, the losses that we pay for an accident year typically relate
The Allstate Corporation 111
2019 Form 10-K Application of Critical Accounting Estimates
to claims that are more difficult to settle, such as those involving serious injuries or litigation. Private passenger auto insurance provides a good illustration of the uncertainty of future loss estimates: our typical annual percentage payout of reserves remaining at December 31 for an accident year is approximately 45% in the first year after the end of the accident year, 20% in the second year, 15% in the third year, 10% in the fourth year, and the remaining 10% thereafter.
Reserves for catastrophe losses Catastrophe losses are an inherent risk of the property and casualty insurance industry that have contributed, and will continue to contribute, to potentially material year-to-year fluctuations in our results of operations and financial position. We define a “catastrophe” as an event that produces pre-tax losses before reinsurance in excess of $1 million and involves multiple first party policyholders, or a winter weather event that produces a number of claims in excess of a preset, per-event threshold of average claims in a specific area, occurring within a certain amount of time following the event. Catastrophes are caused by various natural events including high winds, winter storms and freezes, tornadoes, hailstorms, wildfires, tropical storms, hurricanes, earthquakes and volcanoes. We are also exposed to man-made catastrophic events, such as certain types of terrorism or industrial accidents. The nature and level of catastrophes in any period cannot be reliably predicted.
The estimation of claims and claims expense reserves for catastrophe losses also comprises estimates of losses from reported claims and IBNR, primarily for damage to property. In general, our estimates for catastrophe reserves are based on claim adjuster inspections and the application of historical loss development factors as described above. However, depending on the nature of the catastrophe, the estimation process can be further complicated. For example, for hurricanes, complications could include the inability of insureds to promptly report losses, limitations placed on claims adjusting staff affecting their ability to inspect losses, determining whether losses are covered by our homeowners policy (generally for damage caused by wind or wind driven rain) or specifically excluded coverage caused by flood, estimating additional living expenses, and assessing the impact of demand surge, exposure to mold damage, and the effects of numerous other considerations, including the timing of a catastrophe in relation to other events, such as at or near the end of a financial reporting period, which can affect the availability of information needed to estimate reserves for that reporting period. In these situations, we may need to adapt our practices to accommodate these circumstances in order to determine a best estimate of our losses from a catastrophe. For example, to complete estimates for certain areas affected by catastrophes not yet inspected by our claims adjusting staff, or where we believed our historical loss development factors were not predictive, we rely on analysis of actual claim notices received compared to total PIF, as well as visual, governmental and third-party information, including aerial photos, using satellites, aircrafts and drones, area observations, and
data on wind speed and flood depth to the extent available.
Potential reserve estimate variability The aggregation of numerous micro-level estimates for each business segment, line of insurance, major components of losses (such as coverages and perils), and major states or groups of states for reported losses and IBNR forms the reserve liability recorded in the Consolidated Statements of Financial Position. Because of this detailed approach to developing our reserve estimates, there is not a single set of assumptions that determines our reserve estimates at the consolidated level. Given the numerous micro-level estimates for reported losses and IBNR, management does not believe the processes that we follow will produce a statistically credible or reliable actuarial reserve range that would be meaningful. Reserve estimates, by their very nature, are very complex to determine and subject to significant judgment, and do not represent an exact determination for each outstanding claim. Accordingly, as actual claims, paid losses, and/or case reserve results emerge, our estimate of the ultimate cost to settle will be different than previously estimated.
To develop a statistical indication of potential reserve variability within reasonably likely possible outcomes, an actuarial technique (stochastic modeling) is applied to the countrywide consolidated data elements for paid losses and paid losses combined with case reserves separately for injury losses, auto physical damage losses, and homeowners losses excluding catastrophe losses. Based on the combined historical variability of the development factors calculated for these data elements, an estimate of the standard error or standard deviation around these reserve estimates is calculated within each accident year for the last twelve years for each type of loss. The variability of these reserve estimates within one standard deviation of the mean (a measure of frequency of dispersion often viewed to be an acceptable level of accuracy) is believed by management to represent a reasonable and statistically probable measure of potential variability. Based on our products and coverages, historical experience, the statistical credibility of our extensive data and stochastic modeling of actuarial chain ladder methodologies used to develop reserve estimates, we estimate that the potential variability of our Allstate Protection reserves, excluding reserves for catastrophe losses, within a reasonable probability of other possible outcomes, may be approximately plus or minus 4%, or plus or minus $800 million in net income applicable to common shareholders. A lower level of variability exists for auto injury losses, which comprise approximately 80% of reserves, due to their relatively stable development patterns over a longer duration of time required to settle claims. Other types of losses, such as auto physical damage, homeowners losses and other personal lines losses, which comprise about 20% of reserves, tend to have greater variability but are settled in a much shorter period of time. Although this evaluation reflects most reasonably likely outcomes, it is possible the final outcome may fall below or above these amounts. Historical variability of reserve
112 www.allstate.com
Application of Critical Accounting Estimates 2019 Form 10-K
estimates is reported in the Claims and Claims Expense Reserves section of the MD&A.
Reserves for Michigan and New Jersey unlimited personal injury protection Claims and claims expense reserves include reserves for Michigan mandatory unlimited personal injury protection coverage to insureds involved in qualifying motor vehicle accidents. The administration of this program is through the MCCA, a state-mandated, non-profit association of which all insurers actively writing automobile coverage in Michigan are members.
The process employed to estimate MCCA covered losses involves a number of activities including the comprehensive review and interpretation of MCCA actuarial reports, other MCCA members’ reports and our personal injury protection loss trends which have increased in severity over time. A significant portion of incurred claim reserves can be attributed to a small number of catastrophic claims and thus a large portion of the recoverable is similarly concentrated. We conduct comprehensive claim file reviews to develop case reserve type estimates of specific claims, which inform our view of future claim development and longevity of claimants. Each year, we update the actuarial estimate of our ultimate reserves and recoverables. We report our paid and unpaid claims based on MCCA requirements. The MCCA develops its own reserving estimates based on its own reserve methodologies, which may not align with our estimations. The MCCA does not provide member companies with its estimate of a company’s claim costs. We continue to update each comprehensive claim file case reserve estimate when there is a significant change in the status of the claimant, or once every three years if there have been no significant changes.
We provide similar personal injury protection coverage in New Jersey for auto policies issued or renewed in New Jersey prior to 1991 that is administered by PLIGA. We use similar actuarial estimating techniques as for the MCCA exposures to estimate loss reserves for unlimited personal injury protection coverage for policies covered by PLIGA. We continue to update our estimates for these claims as the status of claimant’s changes. However, unlimited coverage was no longer offered after 1991; therefore, no new claimants are being added.
Reserve estimates are confidential and proprietary and by their nature are very complex to determine and subject to significant judgments. Reserve estimates do not represent an exact determination for each outstanding claim. Claims may be subject to litigation. As actual claims, paid losses and/or case reserve results emerge, our estimate of the ultimate cost to settle may be materially greater or less than previously estimated amounts.
For additional information related to indemnification recoverables, see Item 1 - Regulation, Indemnification Programs and Note 10 of the consolidated financial statements.
Adequacy of reserve estimates We believe our net claims and claims expense reserves are appropriately
established based on available methodologies, facts, technology, laws and regulations. We calculate and record a single best reserve estimate, in conformance with generally accepted actuarial standards and practices, for each line of insurance, its components (coverages and perils) and state, for reported losses and for IBNR losses, and as a result we believe that no other estimate is better than our recorded amount. Due to the uncertainties involved, the ultimate cost of losses may vary materially from recorded amounts, which are based on our best estimates.
Discontinued Lines and Coverages reserve estimates
Characteristics of Discontinued Lines exposure Our exposure to asbestos, environmental and other discontinued lines claims arise principally from assumed reinsurance coverage written during the 1960s through the mid-1980s, including reinsurance on primary insurance written on large U.S. companies, and from direct excess commercial insurance written from 1972 through 1985, including substantial excess general liability coverages on large U.S. companies. Additional exposure stems from direct primary commercial insurance written during the 1960s through the mid-1980s. Asbestos claims relate primarily to bodily injuries asserted by claimants who were exposed to asbestos or products containing asbestos. Environmental claims relate primarily to pollution and related clean-up costs. Other discontinued lines exposures primarily relate to general liability and product liability mass tort claims, such as those for medical devices and other products, workers’ compensation claims and claims for various other coverage exposures other than asbestos and environmental.
In 1986, the general liability policy form used by us and others in the property and casualty industry was amended to introduce an “absolute pollution exclusion,” which excluded coverage for environmental damage claims, and to add an asbestos exclusion. Most general liability policies issued prior to 1987 contain annual aggregate limits for product liability coverage. General liability policies issued in 1987 and thereafter contain annual aggregate limits for product liability coverage and annual aggregate limits for all coverages. Our experience to date is that these policy form changes have limited the extent of our exposure to environmental and asbestos claim risks.
Our exposure to liability for asbestos, environmental and other discontinued lines losses manifests differently depending on whether it arises from assumed reinsurance coverage, direct excess commercial insurance or direct primary commercial insurance. The direct insurance coverage we provided that covered asbestos, environmental and other discontinued lines was substantially “excess” in nature.
Direct excess commercial insurance and reinsurance involve coverage written by us for specific layers of protection above retentions and other insurance plans. The nature of excess coverage and reinsurance provided to other insurers limits our exposure to loss to specific layers of protection in excess of policyholder retention on primary insurance
The Allstate Corporation 113
2019 Form 10-K Application of Critical Accounting Estimates
plans. Our exposure is further limited by the significant reinsurance that we had purchased on our direct excess business.
Our assumed reinsurance business involved writing generally small participations in other insurers’ reinsurance programs. The reinsured losses in which we participate may be a proportion of all eligible losses or eligible losses in excess of defined retentions. The majority of our assumed reinsurance exposure, approximately 85%, is for excess of loss coverage, while the remaining 15% is for pro-rata coverage.
Our direct primary commercial insurance business did not include coverage to large asbestos manufacturers. This business comprises a cross section of policyholders engaged in many diverse business sectors throughout the country.
How reserve estimates are established and updated We conduct an annual review in the third quarter to evaluate, establish and adjust as necessary, asbestos, environmental and other discontinued lines reserves. Changes to reserves are recorded in the reporting period in which they are determined. Using established industry and actuarial best practices and assuming no change in the regulatory or economic environment, this detailed and comprehensive methodology determines asbestos reserves based on assessments of the characteristics of exposure (i.e. claim activity, potential liability, jurisdiction, products versus non-products exposure) presented by individual policyholders, and determines environmental reserves based on assessments of the characteristics of exposure (i.e. environmental damages, respective shares of liability of potentially responsible parties, appropriateness and cost of remediation) to pollution and related clean-up costs. The number and cost of these claims are affected by advertising by trial lawyers seeking asbestos plaintiffs, and entities with asbestos exposure seeking bankruptcy protection as a result of asbestos liabilities, initially causing a delay in the reporting of claims, often followed by an acceleration and an increase in claims and claims expenses as settlements occur.
After evaluating our insureds’ probable liabilities for asbestos and/or environmental claims, we evaluate our insureds’ coverage programs for such claims. We consider our insureds’ total available insurance coverage, including the coverage we issued. We also consider relevant judicial interpretations of policy language and applicable coverage defenses or determinations, if any.
Evaluation of both the insureds’ estimated liabilities and our exposure to the insureds depends heavily on an analysis of the relevant legal issues and litigation environment. This analysis is conducted by our specialized claims adjusting staff and legal counsel. Based on these evaluations, case reserves are established by claims adjusting staff and actuarial analysis is employed to develop an IBNR reserve, which includes estimated potential reserve development and claims that have occurred but have not been reported. As of December 31, 2019 and 2018, IBNR was 49% and 50%, respectively, of combined net asbestos and environmental reserves.
For both asbestos and environmental reserves, we also evaluate our historical direct net loss and expense paid and incurred experience to assess any emerging trends, fluctuations or characteristics suggested by the aggregate paid and incurred activity.
Other Discontinued Lines and Coverages
Characteristics of other exposures Other mass torts includes direct excess commercial and reinsurance general liability coverage provided for cumulative injury losses other than asbestos and environmental. Workers’ compensation and commercial and other include run-off from discontinued direct primary, direct excess commercial and reinsurance commercial insurance operations of various coverage exposures other than asbestos and environmental. Reserves are based on considerations similar to those described above, as they relate to the characteristics of specific individual coverage exposures.
| Reserves for other discontinued lines | ||||||||
| As of December 31, | ||||||||
| ($ in millions) | 2019 | 2018 | ||||||
| Other mass torts | $ | 177 | $ | 148 | ||||
| Workers’ compensation | 66 | 69 | ||||||
| Commercial and other | 133 | 138 | ||||||
| Other discontinued lines | $ | 376 | $ | 355 |
Potential reserve estimate variability Establishing Discontinued Lines and Coverages net loss reserves for asbestos, environmental and other discontinued lines claims is subject to uncertainties that are much greater than those presented by other types of property and casualty claims. Among the complications are lack of historical data, long reporting delays, uncertainty as to the number and identity of insureds with potential exposure and unresolved legal issues regarding policy coverage; unresolved legal issues regarding the determination, availability and timing of exhaustion of policy limits; plaintiffs’ evolving and expanding theories
of liability; availability and collectability of recoveries from reinsurance; retrospectively determined premiums and other contractual agreements; estimates of the extent and timing of any contractual liability; the impact of bankruptcy protection sought by various asbestos producers and other asbestos defendants; and other uncertainties. There are also complex legal issues concerning the interpretation of various insurance policy provisions and whether those losses are covered, or were ever intended to be covered, and could be recoverable through retrospectively determined premium, reinsurance or
114 www.allstate.com
Application of Critical Accounting Estimates 2019 Form 10-K
other contractual agreements. Courts have reached different and sometimes inconsistent conclusions as to when losses are deemed to have occurred and which policies provide coverage; what types of losses are covered; whether there is an insurer obligation to defend; how policy limits are determined; how policy exclusions and conditions are applied and interpreted; and whether clean-up costs represent insured property damage. Our reserves for asbestos and environmental exposures could be affected by tort reform, class action litigation, and other potential legislation and judicial decisions. Environmental exposures could also be affected by a change in the existing federal Superfund law and similar state statutes. There can be no assurance that any reform legislation will be enacted or that any such legislation will provide for a fair, effective and cost-efficient system for settlement of asbestos or environmental claims. We believe these issues are not likely to be resolved in the near future, and the ultimate costs may vary materially from the amounts currently recorded resulting in material changes in loss reserves. Historical variability of reserve estimates is demonstrated in the Claims and Claims Expense Reserves section of the MD&A.
Adequacy of reserve estimates Management believes its net loss reserves for asbestos, environmental and other discontinued lines exposures are appropriately established based on available facts, technology, laws, regulations, and assessments of other pertinent factors and characteristics of exposure (i.e. claim activity, potential liability, jurisdiction, products versus non-products exposure) presented by individual policyholders, assuming no change in the legal, legislative or economic environment. Due to the uncertainties and factors described above, management believes it is not practicable to develop a meaningful range for any such additional net loss reserves that may be required.
Further discussion of reserve estimates For further discussion of these estimates and quantification of the impact of reserve estimates, reserve reestimates and assumptions, see Notes 8 and 14 of the consolidated financial statements and the Claims and Claims Expense Reserves section of the MD&A.
Reserve for life-contingent contract benefits estimation Due to the long-term nature of traditional life insurance, life-contingent immediate annuities and voluntary accident and health insurance products, benefits are payable over many years; accordingly, the reserves are calculated as the present value of future expected benefits to be paid, reduced by the present value of future expected net premiums. Long-term actuarial assumptions of future investment yields, mortality, morbidity, policy terminations and expenses are used when establishing the reserve for life-contingent contract benefits payable under these insurance policies. These assumptions, which for traditional life insurance are applied using the net level
premium method, include provisions for adverse deviation and generally vary by characteristics such as type of coverage, year of issue and policy duration. Future investment yield assumptions are determined based upon prevailing investment yields as well as estimated reinvestment yields. Mortality, morbidity and policy termination assumptions are based on our experience and industry experience. Expense assumptions include the estimated effects of inflation and expenses to be incurred beyond the premium-paying period. These assumptions are established at the time the policy is issued, are consistent with assumptions for determining DAC amortization for these policies, and are generally not changed during the policy coverage period. However, if actual experience emerges in a manner that is significantly adverse relative to the original assumptions, adjustments to DAC or reserves may be required resulting in a charge to earnings which could have a material effect on our operating results and financial condition.
We periodically review the adequacy of reserves and recoverability of DAC using actual experience and current assumptions. In the event actual experience and current assumptions are adverse compared to the original assumptions and a premium deficiency is determined to exist, any remaining unamortized DAC balance must be expensed to the extent not recoverable and the establishment of a premium deficiency reserve may be required.
We evaluate our traditional life insurance products, immediate annuities with life contingencies, and voluntary accident and health insurance individually. In 2019 and 2018, our reviews concluded that no premium deficiency adjustments were necessary. As of December 31, 2019, traditional life insurance and accident and health insurance both have a substantial sufficiency.
As of December 31, 2019, there is marginal sufficiency in the evaluation of immediate annuities with life contingencies which has been adversely impacted primarily by sub-standard structured settlement mortality expectations, where annuitants are living longer than originally anticipated, and the impact of interest rates, which are lower than originally anticipated and are expected to remain low for an extended period. The sufficiency represents approximately 3% of applicable reserves for Allstate Annuities as of December 31, 2019. Additional reserves may be required in future periods if mortality and interest rates continue to develop in a manner that results in a premium deficiency.
The following table displays the sensitivity of permanent changes in the future investment yield assumption included in the annuity premium deficiency evaluation to the sufficiency balance as of December 31, 2019.
| ($ in millions) | Increase/(reduction) in sufficiency | Change in sufficiency as a percentage of applicable reserves | ||
| Increase in future investment yields of 25 basis points | $200 | 3% | ||
| Decrease in future investment yields of 25 basis points | $(211) | (3)% |
The Allstate Corporation 115
2019 Form 10-K Application of Critical Accounting Estimates
We also review these policies for circumstances where projected profits would be recognized in early years followed by projected losses in later years. In 2019 and 2018, our reviews concluded that there were no projected losses following projected profits in each long-term projection.
We will continue to monitor the experience of our traditional life insurance and immediate annuities. We periodically complete comprehensive mortality studies for our structured settlement annuities with life contingencies to determine whether annuitants are living for a longer period than originally estimated. We anticipate that investment and reinvestment yields, mortality, and policy terminations are the factors that would be most likely to require premium deficiency adjustments to reserves or related DAC. Mortality rates and investment and reinvestment yields are the factors that would be most likely to require a profits followed by losses liability accrual.
For further detail on the reserve for life-contingent contract benefits, see Note 9 of the consolidated financial statements.
Pension and other postretirement plans net costs and assumptions Our defined benefit pension plans cover most full-time employees, certain part-time employees and employee-agents. Benefits are based primarily on a cash balance formula; however, certain participants have a significant portion of their benefits attributable to a former final average pay formula. 88% of the projected benefit obligation (“PBO”) of our primary qualified employee plan is related to the former final average pay formula. See Note 17 of the consolidated financial statements for a discussion of these plans and their effect on the consolidated financial statements.
Our pension and other postretirement benefit costs are calculated using various actuarial assumptions and methodologies. These assumptions include discount rates, health care cost trend rates, inflation, expected returns on plan assets, mortality and other factors. The assumptions utilized in recording the obligations under our pension plans represent our best estimates and we believe they are reasonable based on information as to historical experience and performance as well as other factors that might cause future expectations to differ from past trends.
Net costs for our defined benefit plans are recognized on the Consolidated Statements of Operations and consist of two elements: 1) costs comprised of service and interest costs, expected return of plan assets and amortization of prior service credit which are reported in property and casualty claims and claims expense, operating costs and expenses, net investment income and, if applicable, restructuring charges and 2) remeasurement gains and losses comprised of changes in actuarial assumptions and the difference between actual and expected returns on plan assets which are recognized immediately in earnings as part of pension and other postretirement remeasurement gains and losses.
We recognize expected returns on plan assets using an unadjusted fair value method. Our policy is to remeasure our pension and postretirement plans on a quarterly basis. We immediately recognize remeasurement of projected benefit obligation and plan assets in earnings as it provides greater transparency of our economic obligations in accounting results and better aligns the recognition of the effects of economic and interest rate changes on pension and other postretirement plan assets and liabilities in the year in which the gains and losses are incurred.
Differences in actual experience or changes in assumptions affect our pension and other postretirement obligations, plan assets and expenses. The primary factors contributing to pension and postretirement remeasurement gains and losses are 1) changes in the discount rate used to value pension and postretirement obligations as of the measurement date, 2) differences between the expected and the actual return on plan assets, 3) changes in demographic assumptions, including mortality and participant experience.
Pension and other postretirement service cost, interest cost, expected return on plan assets and amortization of prior service credits are allocated to our reportable segments. The pension and other postretirement remeasurement gains and losses are reported in the Corporate and Other segment.
Impact of assumption changes to net cost for pension and other postretirement plans Due to changes in assumptions and the difference between actual and expected returns on plan assets as described below, we recognized pension and other postretirement remeasurement losses of $114 million in 2019 compared to $468 million in 2018.
The discount rate is based on rates at which expected pension benefits attributable to past employee service could effectively be settled on a present value basis at the measurement date. We develop the assumed discount rate by utilizing the weighted average yield of a theoretical dedicated portfolio derived from non-callable bonds and bonds with a make-whole provision available in the Bloomberg corporate bond universe having ratings of at least “AA” by S&P or at least “Aa” by Moody’s on the measurement date with cash flows that match expected plan benefit requirements. Significant changes in discount rates, such as those caused by changes in the credit spreads, yield curve, the mix of bonds available in the market, the duration of selected bonds and expected benefit payments, may result in volatility in pension cost. The weighted average discount rate used to measure the benefit obligation decreased to 3.31% in 2019 compared to 4.31% in 2018. Pension and other postretirement remeasurement losses due to declines in the weighted average discount rate were $633 million in 2019 compared to gains of $392 million in 2018.
The expected long-term rate of return on plan assets reflects the average rate of earnings expected on plan assets. While this rate reflects long-term
116 www.allstate.com
Application of Critical Accounting Estimates 2019 Form 10-K
assumptions and is consistent with long-term historical returns, sustained changes in the market or changes in the mix of plan assets may lead to revisions in the assumed long-term rate of return on plan assets that may result in variability of pension cost. Differences between the actual return on plan assets and the expected long-term rate of return on plan assets are immediately recognized through earnings upon remeasurement. Short-term asset performance can differ significantly from the expected rate of return, especially in volatile markets. In 2019, the actual return on plan assets compared to our expected return was a gain of $832 million compared to a loss of $727 million in 2018. The improvement was primarily due to strong equity market performance and declines in interest rates which increased the fair value of our fixed income investments.
We complete periodic evaluations of demographic information and historical experience that affects our pension and other postretirement obligations to identify any required changes to long-term actuarial
assumptions and methodologies. Demographic assumptions affect both our pension and postretirement plans and include elements such as retirement rates and participation rates in our postretirement programs, among other factors. These actuarial assumption updates affect our pension and other postretirement obligations and are incorporated into our best estimates of these assumptions. Actuarial assumption updates that affect our pension and other postretirement obligations resulted in remeasurement losses of $313 million in 2019 compared to losses of $133 million in 2018.
The assumed health care trend rate represents the rate at which health care costs are assumed to increase and is based on historical and expected experience. Assumed health care cost trend rates have a significant effect on the amounts reported for the postretirement health care plans. An increase in the trend rate would increase our obligation and expense.
| Sensitivity of assumption changes included in the calculation of net cost as of December 31, 2019 | ||||||
| ($ in millions) | Basis/percentage point change | Increase (decrease) to net cost | ||||
| Pension plans discount rate | +100 basis points | $ | (842 | ) | ||
| -100 basis points | 1,045 | |||||
| Expected long-term rate of return on assets | +100 basis points | (59 | ) | |||
| -100 basis points | 59 | |||||
| Postretirement plans assumed health care cost trend rate | +1% | 27 | ||||
| -1% | (23 | ) |
The Allstate Corporation 117
2019 Form 10-K
Regulation and Legal Proceedings
We are subject to extensive regulation and we are involved in various legal and regulatory actions, all of which have an effect on specific aspects of our business. For a detailed discussion of the legal and regulatory actions in which we are involved, see Note 14 of the consolidated financial statements.
Pending Accounting Standards
There are several pending accounting standards that we have not implemented because the implementation date has not yet occurred. For a discussion of these pending standards, see Note 2 of the consolidated financial statements.
The effect of implementing certain accounting standards on our financial results and financial condition is often based in part on market conditions at the time of implementation of the standard and other factors we are unable to determine prior to implementation. For this reason, we are sometimes unable to estimate the effect of certain pending accounting standards until the relevant authoritative body finalizes these standards or until we implement them.
Previous: Item 6. Selected Financial Data · Next: Item 7A. Quantitative and Qualitative Disclosures About Market Risk