 filings.tools
Item 5. Market for Registrant’s Common Equity, Related Stockholder Matters and Issuer Purchases of Equity Securities
4K characters. Original on sec.gov · Markdown
Item 5. Market for Registrant’s Common Equity, Related Stockholder Matters and Issuer Purchases of Equity Securities
Market Information
Applied’s common stock is traded on the NASDAQ Global Select Market under the symbol AMAT. As of December 7, 2018, there were 2,854 registered holders of Applied common stock.
Performance Graph
The performance graph below shows the five-year cumulative total stockholder return on Applied common stock during the period from October 27, 2013 through October 28, 2018. This is compared with the cumulative total return of the Standard & Poor’s 500 Stock Index and the RDG Semiconductor Composite Index over the same period. The comparison assumes $100 was invested on October 27, 2013 in Applied common stock and in each of the foregoing indices and assumes reinvestment of dividends, if any. Dollar amounts in the graph are rounded to the nearest whole dollar. The performance shown in the graph represents past performance and should not be considered an indication of future performance.
COMPARISON OF 5 YEAR CUMULATIVE TOTAL RETURN*
Among Applied Materials, Inc., the S&P 500 Index
and the RDG Semiconductor Composite Index
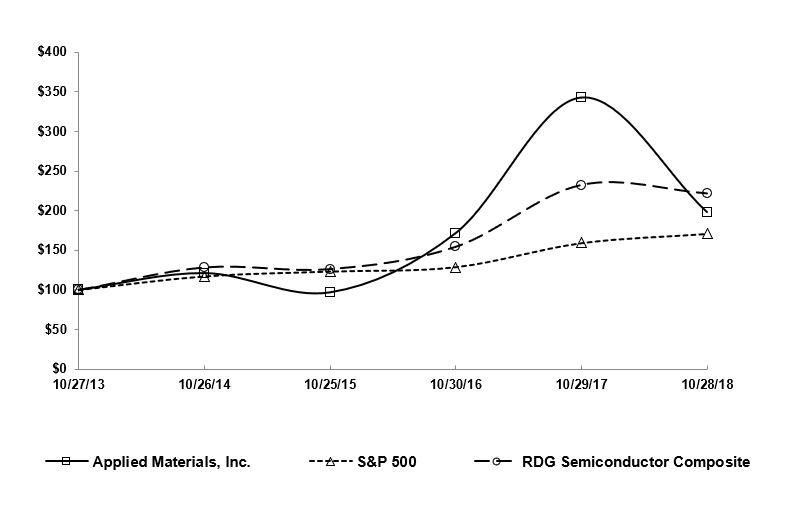
*Assumes $100 invested on 10/27/13 in stock or 10/31/13 in index, including reinvestment of dividends.
Indexes calculated on month-end basis.
Copyright© 2018 Standard & Poor’s, a division of S&P global. All rights reserved.
| 10/27/2013 | 10/26/2014 | 10/25/2015 | 10/30/2016 | 10/29/2017 | 10/28/2018 | ||||||||||||
| Applied Materials | 100.00 | 121.04 | 96.67 | 171.69 | 343.16 | 198.27 | |||||||||||
| S&P 500 Index | 100.00 | 117.27 | 123.37 | 128.93 | 159.40 | 171.11 | |||||||||||
| RDG Semiconductor Composite Index | 100.00 | 128.42 | 126.26 | 154.41 | 232.29 | 221.61 |
Issuer Purchases of Equity Securities
The following table provides information as of October 28, 2018 with respect to the shares of common stock repurchased by Applied during the fourth quarter of fiscal 2018 pursuant to a publicly announced stock repurchase program approved by the Board of Directors in February 2018, which authorized up to an aggregate of $6.0 billion in repurchases.
| Period | Total Number of Shares Purchased | Average Price Paid per Share | Aggregate Price Paid | Total Number of Shares Purchased as Part of Publicly Announced Programs * | Maximum Dollar Value of Shares That May Yet be Purchased Under the Programs | ||||||||||||
| (In millions, except per share amounts) | |||||||||||||||||
| Month #1 | |||||||||||||||||
| (July 30, 2018 to August 26, 2018) | 7.9 | $ | 46.69 | $ | 369 | 7.9 | $ | 4,709 | |||||||||
| Month #2 | |||||||||||||||||
| (August 27, 2018 to September 23, 2018) | 3.7 | $ | 40.13 | 148 | 3.7 | $ | 4,561 | ||||||||||
| Month #3 | |||||||||||||||||
| (September 24, 2018 to October 28, 2018) | 6.5 | $ | 35.78 | 234 | 6.5 | $ | 4,327 | ||||||||||
| Total | 18.1 | $ | 41.43 | $ | 751 | 18.1 |
Previous: Item 4. Mine Safety Disclosures · Next: Item 6. Selected Financial Data