 filings.tools
Item 5. MARKET FOR REGISTRANT’S COMMON EQUITY, RELATED STOCKHOLDER MATTERS AND ISSUER PURCHASES OF EQUITY SECURITIES
4K characters. Original on sec.gov · Markdown
Item 5. MARKET FOR REGISTRANT’S COMMON EQUITY, RELATED STOCKHOLDER MATTERS AND ISSUER PURCHASES OF EQUITY SECURITIES
Our common stock is listed on The NASDAQ Capital Market (NASDAQ) under the symbol “AMD”. On February 23, 2018, there were 5,962 registered holders of our common stock, and the closing price of our common stock was $12.07 per share as reported on NASDAQ.
The following table sets forth on a per share basis the high and low intra-day sales prices on NASDAQ for our common stock for the periods indicated:
| High | Low | ||||||
| Fiscal Year 2017 Quarters Ended: | |||||||
| April 1, 2017 | $ | 15.55 | $ | 9.42 | |||
| July 1, 2017 | $ | 14.74 | $ | 9.85 | |||
| September 30, 2017 | $ | 15.65 | $ | 11.86 | |||
| December 30, 2017 | $ | 14.41 | $ | 9.70 | |||
| High | Low | ||||||
| Fiscal Year 2016 Quarters Ended: | |||||||
| March 26, 2016 | $ | 3.06 | $ | 1.75 | |||
| June 25, 2016 | $ | 5.52 | $ | 2.60 | |||
| September 24, 2016 | $ | 8.00 | $ | 4.65 | |||
| December 31, 2016 | $ | 12.42 | $ | 6.22 |
Currently, we do not have any plans to pay dividends on our common stock. Under the terms of our indentures for our 6.75% Senior Notes due 2019 (6.75% Notes), 7.50% Senior Notes due 2022 (7.50% Notes) and 7.00% Senior Notes due 2024 (7.00% Notes), we are prohibited from paying cash dividends if the aggregate amount of dividends and other restricted payments made by us since entering into each indenture would exceed the sum of specified financial measures including fifty percent of consolidated net income as that term is defined in the indentures. We are prohibited from paying cash dividends on our common stock when certain payment conditions (Payment Conditions) are not satisfied. The Payment Conditions include that (i) no default or event of default exists and (ii) at all times during the 45 consecutive days immediately prior to such transaction, event or payment and on a pro forma basis after giving effect to such transaction, event or payment and any incurrence or repayment of indebtedness in connection therewith, the Loan Parties’(as defined in the Amended and Restated Loan Agreement) excess available cash is greater than the greater of 20% of the total commitment amount and $100 million.
For information about our equity compensation plans, see Part III, Item 11, below.
Performance Graph
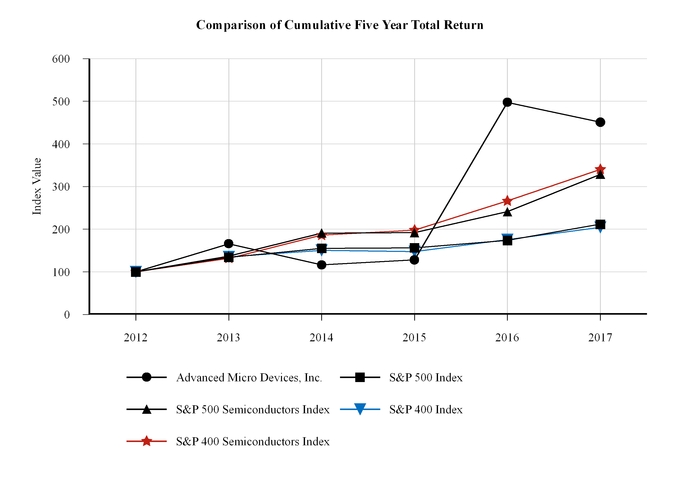
Comparison of Five-Year Cumulative Total Returns
Advanced Micro Devices, S&P 500 and 400 Indicies and S&P 500 and 400 Semiconductor Indices
The following graph shows a five-year comparison of cumulative total return on our common stock, the S&P 500 and 400 Indicies and the S&P 500 and 400 Semiconductor Indices from December 29, 2012 through December 30, 2017. The past performance of our common stock is no indication of future performance.
| Base Period | Years Ending | |||||
| Company / Index | 12/29/2012 | 12/28/2013 | 12/27/2014 | 12/26/2015 | 12/31/2016 | 12/30/2017 |
| Advanced Micro Devices, Inc. | 100 | 165.79 | 116.23 | 128.07 | 497.37 | 450.88 |
| S&P 500 Index | 100 | 134.11 | 155.24 | 156.43 | 173.74 | 211.67 |
| S&P 500 Semiconductors Index | 100 | 137.05 | 190.98 | 191.87 | 241.07 | 328.63 |
| S&P 400 Index | 100 | 134.98 | 150.40 | 147.40 | 175.86 | 204.43 |
| S&P 400 Semiconductors Index | 100 | 131.78 | 185.99 | 198.09 | 266.20 | 340.33 |
Previous: Item 4. MINE SAFETY DISCLOSURES · Next: Item 6. SELECTED FINANCIAL DATA