 filings.tools
Item 5. MARKET FOR REGISTRANT’S COMMON EQUITY, RELATED STOCKHOLDER MATTERS AND ISSUER PURCHASES OF EQUITY SECURITIES
4K characters. Original on sec.gov · Markdown
Item 5. MARKET FOR REGISTRANT’S COMMON EQUITY, RELATED STOCKHOLDER MATTERS AND ISSUER PURCHASES OF EQUITY SECURITIES
Our common stock is listed on The NASDAQ Global Select Market (NASDAQ) under the symbol “AMD”. On January 25, 2024, there were 4,909 registered holders of our common stock, and the closing price of our common stock was $180.33 per share as reported on NASDAQ.
Issuer Purchases of Equity Securities
We have an approved stock repurchase program authorizing repurchases of up to $12 billion of our common stock (Repurchase Program). We expect to fund repurchases through cash generated from operations. Our Repurchase Program does not obligate us to acquire any common stock, has no termination date and may be suspended or discontinued at any time. The following table provides information relating to our repurchase of common stock during the fourth quarter of fiscal year 2023:
| Date of Repurchase | Total Number of Shares Repurchased | Average Price Paid per Share | Total Number of Shares Repurchased as Part of Publicly Announced Plans or Programs | Approximate Dollar Value of Shares That May Yet be Purchased Under the Publicly Announced Plans or Programs | |||||||||||||||||||
| (In millions) | |||||||||||||||||||||||
| Oct 1, 2023 - Oct 28, 2023 | — | $ | — | — | $ | 5,788 | |||||||||||||||||
| Oct 29, 2023 - Nov 25, 2023 | 781,106 | $ | 119.59 | 781,106 | $ | 5,694 | |||||||||||||||||
| Nov 26, 2023 - Dec 30, 2023 | 1,164,316 | $ | 119.99 | 1,164,316 | $ | 5,555 | |||||||||||||||||
| Total | 1,945,422 | 1,945,422 |
Equity Award Share Withholding
Shares of common stock withheld as payment of withholding taxes in connection with the vesting or exercise of equity awards are also treated as common stock repurchases. Those withheld shares of common stock are not considered common stock repurchases under an authorized common stock repurchase plan. During fiscal year 2023, we withheld 4 million shares at an average price of $110.51 per share as payment of withholding taxes in connection with the vesting and exercise of equity awards.
For information about our equity compensation plans, see Part III, Item 11, below.
Performance Graph
Comparison of Five-Year Cumulative Total Returns
Advanced Micro Devices, S&P 500 Index and S&P 500 Semiconductors Index
The following graph shows a five-year comparison of cumulative total return on our common stock, the S&P 500 Index and the S&P 500 Semiconductors Index from December 29, 2018 through December 30, 2023, assuming reinvestment of dividends. The past performance of our common stock is no indication of future performance.
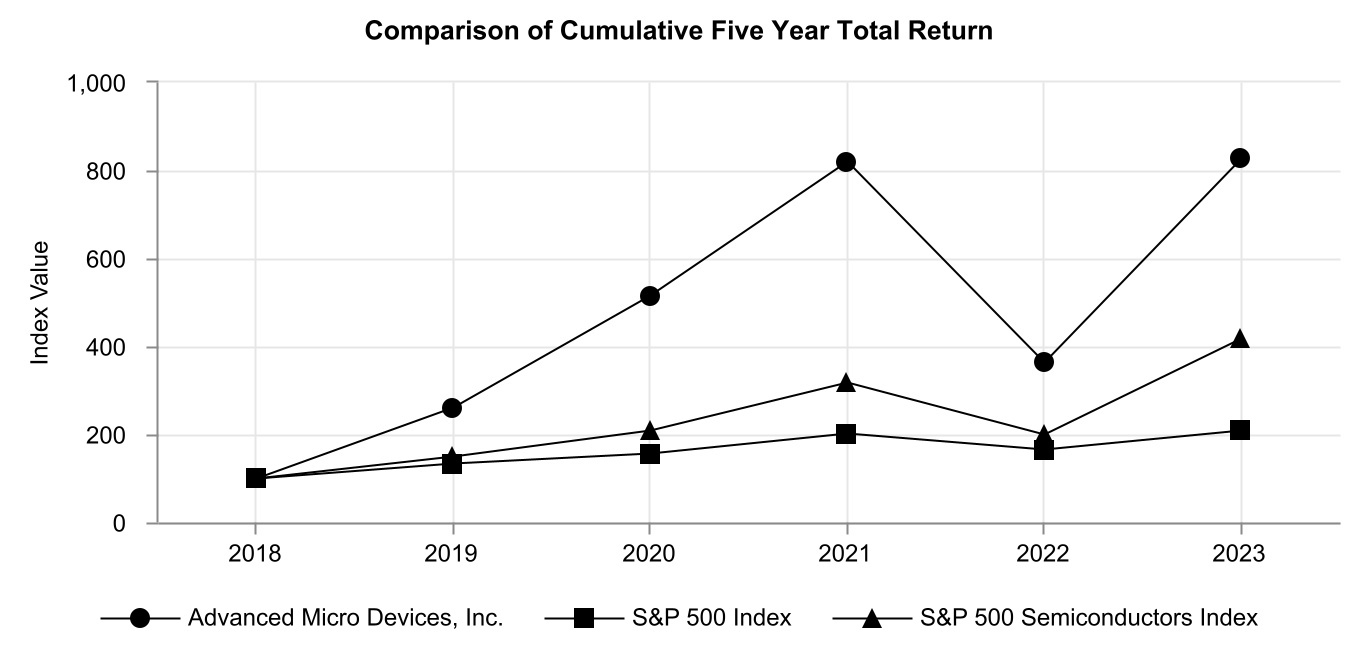
| Base Period | Years Ended | |||||||||||||||||||
| Company / Index | 12/29/2018 | 12/28/2019 | 12/26/2020 | 12/25/2021 | 12/31/2022 | 12/30/2023 | ||||||||||||||
| Advanced Micro Devices, Inc. | $100 | $ | 259 | $ | 515 | $ | 820 | $ | 363 | $ | 827 | |||||||||
| S&P 500 Index | $100 | $ | 133 | $ | 155 | $ | 200 | $ | 165 | $ | 209 | |||||||||
| S&P 500 Semiconductors Index | $100 | $ | 148 | $ | 208 | $ | 317 | $ | 198 | $ | 417 |
Unregistered Sales of Equity Securities
None.
Previous: Item 4. MINE SAFETY DISCLOSURES · Next: Item 6. [RESERVED]