 filings.tools
Item 5. MARKET FOR REGISTRANT’S COMMON EQUITY, RELATED STOCKHOLDER MATTERS AND ISSUER PURCHASES OF EQUITY SECURITIES
4K characters. Original on sec.gov · Markdown
Item 5. MARKET FOR REGISTRANT’S COMMON EQUITY, RELATED STOCKHOLDER MATTERS AND ISSUER PURCHASES OF EQUITY SECURITIES
Common stock
Our common stock trades on the NASDAQ Global Select Market under the symbol AMGN. As of February 7, 2019, there were approximately 5,760 holders of record of our common stock.
Performance graph
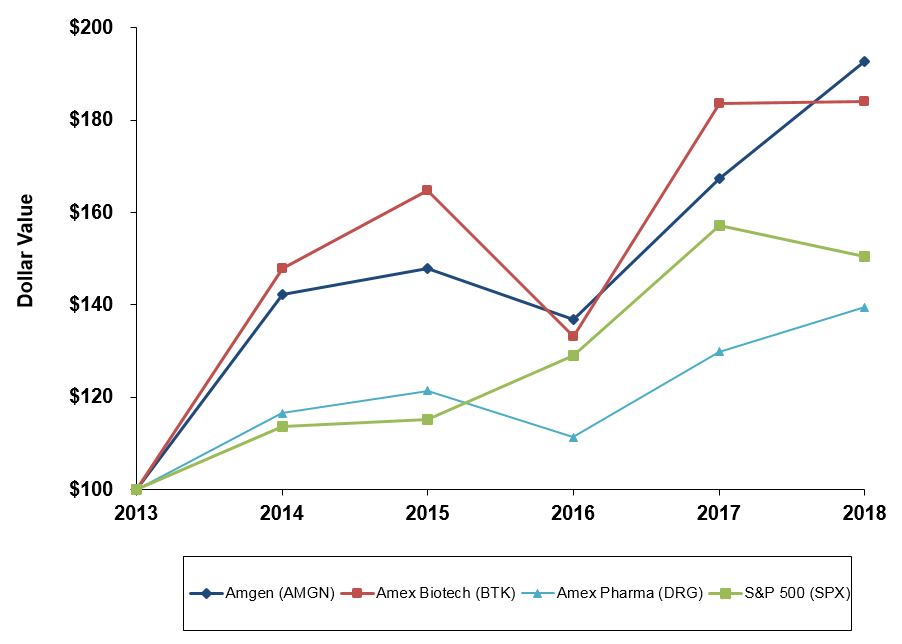
The following graph shows the value of an investment of $100 on December 31, 2013, in each of Amgen common stock, the Amex Biotech Index, the Amex Pharmaceutical Index and Standard & Poor’s 500 Index (S&P 500). All values assume reinvestment of the pretax value of dividends and are calculated as of December 31 of each year. The historical stock price performance of the Company’s common stock shown in the performance graph is not necessarily indicative of future stock price performance.
| Amgen vs. Amex Biotech, Amex Pharmaceutical and S&P 500 Indices |
| Comparison of Five-Year Cumulative Total Return |
| Value of Investment of $100 on December 31, 2013 |
| 12/31/2013 | 12/31/2014 | 12/31/2015 | 12/31/2016 | 12/31/2017 | 12/31/2018 | ||||||
| Amgen (AMGN) | $100.00 | $142.32 | $147.97 | $136.80 | $167.33 | $192.57 | |||||
| Amex Biotech (BTK) | $100.00 | $147.91 | $164.76 | $133.21 | $183.58 | $184.07 | |||||
| Amex Pharmaceutical (DRG) | $100.00 | $116.58 | $121.45 | $111.32 | $129.83 | $139.50 | |||||
| S&P 500 (SPX) | $100.00 | $113.68 | $115.24 | $129.02 | $157.26 | $150.39 |
The material in this performance graph is not soliciting material, is not deemed filed with the SEC, and is not incorporated by reference in any filing of the Company under the Securities Act or the Exchange Act, whether made on, before or after the date of this filing and irrespective of any general incorporation language in such filing.
Stock repurchase program
During the three months and year ended December 31, 2018, we had one outstanding stock repurchase program, under which the repurchasing activity was as follows:
| Total number of shares purchased | Average price paid per share(1) | Total number of shares purchased as part of publicly announced program | Maximum dollar value that may yet be purchased under the program(2) | |||||||||||
| October 1 - October 31 | 4,151,700 | $ | 198.37 | 4,151,700 | $ | 2,855,891,358 | ||||||||
| November 1 - November 30 | 2,461,000 | $ | 195.19 | 2,461,000 | $ | 2,375,524,842 | ||||||||
| December 1 - December 31 | 4,508,700 | $ | 190.99 | 4,508,700 | $ | 5,114,429,813 | ||||||||
| 11,121,400 | $ | 194.67 | 11,121,400 | |||||||||||
| January 1 - December 31 | 94,473,223 | $ | 189.00 | 94,473,223 |
| (1) | Average price paid per share includes related expenses. |
| (2) | In December 2018, our Board of Directors increased the amount authorized under our stock repurchase program by an additional $3.6 billion. |
Dividends
For the years ended December 31, 2018 and 2017, we paid quarterly dividends. We expect to continue to pay quarterly dividends, although the amount and timing of any future dividends are subject to approval by our Board of Directors. Additional information required by this item is incorporated herein by reference to Part IV—Note 17, Stockholders’ equity, to the Consolidated Financial Statements.
Securities Authorized for Issuance Under Existing Equity Compensation Plans
Information about securities authorized for issuance under existing equity compensation plans is incorporated by reference from Item 12—Securities Authorized for Issuance Under Existing Equity Compensation Plans.
Previous: Item 4. MINE SAFETY DISCLOSURES · Next: Item 6. SELECTED FINANCIAL DATA