 filings.tools
Item 5. MARKET FOR REGISTRANT’S COMMON EQUITY, RELATED STOCKHOLDER MATTERS,
3K characters. Original on sec.gov · Markdown
Item 5. MARKET FOR REGISTRANT’S COMMON EQUITY, RELATED STOCKHOLDER MATTERS,
AND ISSUER PURCHASES OF EQUITY SECURITIES
Our common stock is listed on the New York Stock Exchange under the symbol "APD." As of 31 October 2019, there were 5,166 record holders of our common stock.
Cash dividends on the Company’s common stock are paid quarterly. It is our expectation that we will continue to pay cash dividends in the future at comparable or increased levels. The Board of Directors determines whether to declare dividends and the timing and amount based on financial condition and other factors it deems relevant. Dividend information for each quarter of fiscal years 2019 and 2018 is summarized below:
| 2019 | 2018 | |||||
| First quarter | $1.10 | $.95 | ||||
| Second quarter | 1.16 | 1.10 | ||||
| Third quarter | 1.16 | 1.10 | ||||
| Fourth quarter | 1.16 | 1.10 | ||||
| Total | $4.58 | $4.25 |
Purchases of Equity Securities by the Issuer
On 15 September 2011, the Board of Directors authorized the repurchase of up to $1.0 billion of our outstanding common stock. This program does not have a stated expiration date. We repurchase shares pursuant to Rules 10b5-1 and 10b-18 under the Securities Exchange Act of 1934, as amended, through repurchase agreements established with one or more brokers. There were no purchases of stock during fiscal year 2019. At 30 September 2019, $485.3 million in share repurchase authorization remained. Additional purchases will be completed at the Company’s discretion while maintaining sufficient funds for investing in its businesses and growth opportunities.
Performance Graph
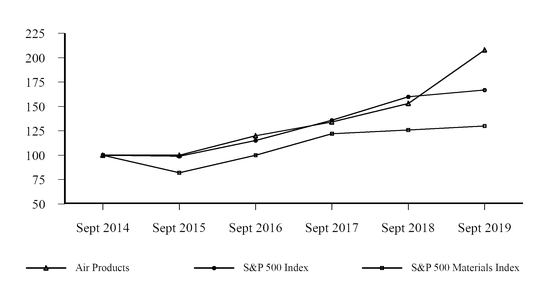
The performance graph below compares the five-year cumulative returns of the Company’s common stock with those of the Standard & Poor’s 500 Index (S&P 500 Index) and the Standard & Poor’s 500 Materials Index (S&P 500 Materials Index). The figures assume an initial investment of $100 and the reinvestment of all dividends.
COMPARISON OF FIVE YEAR CUMULATIVE SHAREHOLDER RETURN
Air Products, S&P 500 Index, and S&P 500 Materials Index
Comparative Growth of a $100 Investment
(Assumes Reinvestment of All Dividends)
| Sept 2014 | Sept 2015 | Sept 2016 | Sept 2017 | Sept 2018 | Sept 2019 | |
| Air Products | 100 | 100 | 120 | 134 | 153 | 208 |
| S&P 500 Index | 100 | 99 | 115 | 136 | 160 | 167 |
| S&P 500 Materials Index | 100 | 82 | 100 | 122 | 126 | 130 |
Previous: Item 4. MINE SAFETY DISCLOSURES · Next: Item 6. SELECTED FINANCIAL DATA