 filings.tools
Item 2. MANAGEMENT’S DISCUSSION AND ANALYSIS OF FINANCIAL CONDITION AND RESULTS OF OPERATIONS
242K characters. Original on sec.gov · Markdown
Item 2. MANAGEMENT’S DISCUSSION AND ANALYSIS OF FINANCIAL CONDITION AND RESULTS OF OPERATIONS
The following discussion should be read in conjunction with Apollo Global Management, Inc.’s condensed consolidated financial statements and the related notes within this quarterly report. This discussion contains forward-looking statements that are subject to known and unknown risks and uncertainties. Actual results and the timing of events may differ significantly from those expressed or implied in such forward-looking statements due to a number of factors, including those included in the section entitled “Item 1A. Risk Factors” in the 2022 Annual Report. The highlights listed below have had significant effects on many items within our condensed consolidated financial statements and affect the comparison of the current period’s activity with those of prior periods. Target returns included in this report are presented gross and do not account for fees, expenses and taxes, which will reduce returns. Target returns are neither guarantees nor predictions or projections of future performance. There can be no assurance that target returns will be achieved or that Apollo will be successful in implementing the applicable strategy. Actual gross and net returns for funds managed by Apollo, and individual investors participating directly or indirectly in funds managed by Apollo, may vary significantly from the target returns set forth herein.
General
Our Businesses
Founded in 1990, Apollo is a high-growth, global alternative asset manager and a retirement services provider. Apollo conducts its business primarily in the United States through the following three reportable segments: Asset Management, Retirement Services and Principal Investing. These business segments are differentiated based on the investment services they provide as well as varying investing strategies. As of March 31, 2023, Apollo had a team of 2,567 employees and Athene had 1,848 employees.
Asset Management
Our Asset Management segment focuses on three investing strategies: yield, hybrid and equity. We have a flexible mandate in many of the funds we manage which enables the funds to invest opportunistically across a company’s capital structure. We raise, invest and manage funds, accounts and other vehicles on behalf of some of the world’s most prominent pension, endowment and sovereign wealth funds and insurance companies, as well as other institutional and individual investors. As of March 31, 2023, we had total AUM of $598 billion.
The yield, hybrid and equity investing strategies of our Asset Management segment reflect the range of investment capabilities across our platform based on relative risk and return. As an asset manager, we earn fees for providing investment management services and expertise to our client base. The amount of fees charged for managing these assets depends on the underlying investment strategy, liquidity profile, and, ultimately, our ability to generate returns for our clients. We also earn capital solutions fees as part of our growing capital solutions business and as part of monitoring and deployment activity alongside our sizeable private equity franchise. After expenses, we call the resulting earnings stream “Fee Related Earnings” or “FRE”, which represents the primary performance measure for the Asset Management segment.
Yield
Yield is our largest asset management strategy with $438 billion of AUM as of March 31, 2023. Our yield strategy focuses on generating excess returns through high-quality credit underwriting and origination. Beyond participation in the traditional issuance and secondary credit markets, through our origination platforms and corporate solutions capabilities we seek to originate attractive and safe-yielding assets for the investors in the funds we manage. Within our yield strategy, we target 4% to 10% returns for our clients. Since inception, the total return yield fund has generated a 5% gross Return on Equity (“ROE”) and 4% net ROE annualized through March 31, 2023.
Hybrid
Our hybrid strategy, with $59 billion of AUM as of March 31, 2023, brings together our capabilities across debt and equity to seek to offer a differentiated risk-adjusted return with an emphasis on structured downside protected opportunities across asset classes. We target 8% to 15% returns within our hybrid strategy by pursuing investments in all market environments, deploying capital during both periods of dislocation and market strength, and focusing on different investing strategies and asset classes.
The flagship hybrid credit hedge fund we manage has generated an 11% gross ROE and a 7% net ROE annualized and the hybrid value funds we manage have generated a 20% gross IRR and a 16% net IRR from inception through March 31, 2023.
Equity
Our equity strategy manages $101 billion of AUM as of March 31, 2023. Our equity strategy emphasizes flexibility, complexity, and purchase price discipline to drive opportunistic-like returns for our clients throughout market cycles. Apollo’s equity team has experience across sectors, industries, and geographies in both private equity and real estate equity. Our control equity transactions are principally buyouts, corporate carveouts and distressed investments, while the real estate funds we manage generally transact in single asset, portfolio and platform acquisitions. Within our equity strategy, we target upwards of 15% returns in the funds we manage. We have consistently produced attractive long-term investment returns in the traditional private equity funds we manage, generating a 39% gross IRR and a 24% net IRR on a compound annual basis from inception through March 31, 2023.
Retirement Services
Our retirement services business is conducted by Athene, a leading financial services company that specializes in issuing, reinsuring and acquiring retirement savings products designed for the increasing number of individuals and institutions seeking to fund retirement needs. Athene’s primary product line is annuities, which include fixed, payout and group annuities issued in conjunction with pension group annuity transactions. Athene also offers funding agreements, which are comprised of funding agreements issued under its FABN and FABR programs, funding agreements issued to the FHLB and repurchase agreements with an original maturity exceeding one year. Our asset management business provides a full suite of services for Athene’s investment portfolio, including direct investment management, asset allocation, merger and acquisition asset diligence and certain operational support services, including investment compliance, tax, legal and risk management support.
Our retirement services business focuses on generating spread income by combining the two core competencies of (1) sourcing long-term, persistent liabilities and (2) using the global scale and reach of our asset management business to actively source or originate assets with Athene’s preferred risk and return characteristics. Athene’s investment philosophy is to invest a portion of its assets in securities that earn an incremental yield by taking measured liquidity and complexity risk and capitalizing on its long-dated funding profile to prudently achieve higher net investment earned rates, rather than assuming incremental credit risk. A cornerstone of Athene’s investment philosophy is that given the operating leverage inherent in its business, modest investment outperformance can translate to outsized return performance. Because Athene maintains discipline in underwriting attractively priced liabilities, it has the ability to invest in a broad range of high-quality assets to generate attractive earnings.
Principal Investing
Our Principal Investing segment is comprised of our realized performance fee income, realized investment income from our balance sheet investments, and certain allocable expenses related to corporate functions supporting the entire company. The Principal Investing segment also includes our growth capital and liquidity resources at AGM. We expect to deploy capital into strategic investments over time that will help accelerate the growth of our Asset Management segment, by broadening our investment management and/or product distribution capabilities or increasing the efficiency of our operations. We believe these investments will translate into greater compounded annual growth of Fee Related Earnings.
Given the cyclical nature of performance fees, earnings from our Principal Investing segment, or Principal Investing Income (“PII”), are inherently more volatile in nature than earnings from the Asset Management and Retirement Services segments. We earn fees based on the investment performance of the funds we manage and compensate our employees, primarily investment professionals, with a meaningful portion of these proceeds to align our team with the investors in the funds we manage and incentivize them to deliver strong investment performance over time. We expect to increase the proportion of performance fee income we pay to our employees over time, and as such proportion increases, we expect PII to represent a relatively smaller portion of our total company earnings.
The diagram below depicts our current organizational structure:

Note: The organizational structure chart above depicts a simplified version of the Apollo structure. It does not include all legal entities in the structure.
(1)Includes direct and indirect ownership by AGM.
Business Environment
Economic and Market Conditions
Our asset management and retirement services businesses are affected by the condition of global financial markets and the economy. Price fluctuations within equity, credit, commodity, foreign exchange markets, as well as interest rates and global inflation, which may be volatile and mixed across geographies, can significantly impact the performance of our business, including, but not limited to, the valuation of investments, including those of the funds we manage, and related income we may recognize.
Adverse economic conditions may result from domestic and global economic and political developments, including plateauing or decreasing economic growth and business activity, civil unrest, geopolitical tensions or military action, such as the armed conflict between Ukraine and Russia and corresponding sanctions imposed by the United States and other countries, and new or evolving legal and regulatory requirements on business investment, hiring, migration, labor supply and global supply chains.
We carefully monitor economic and market conditions that could potentially give rise to global market volatility and affect our business operations, investment portfolios and derivatives, which includes global inflation. In recent months, the global financial system has been experiencing increased volatility due to the failure of certain financial institutions, primarily U.S. regional banks. The current macroeconomic environment, recent bank failures and consolidations, changes in business and consumer behavior and other events affecting financial institutions, have also contributed to volatility in the commercial real estate market, and concerns regarding commercial real estate liquidity, financing availability and asset values, particularly in the office subsector. The potential impacts of rising interest rates and continued deposit outflows on global markets, financial institutions and macroeconomic conditions, generally, remain uncertain. Episodes of increased economic and market volatility may continue to occur and could worsen if there are additional instances of actual or threatened bank failures. For further information on the risks related to market or economic conditions and commercial real estate, see the section entitled “Item 1A. Risk Factors” in the 2022 Annual Report.
U.S. inflation receded during the first quarter of 2023, however the U.S. Federal Reserve continued its interest rate hiking cycle given Consumer Price Index (“CPI”) persisting above the 2% target. The U.S. Bureau of Labor Statistics reported that the annual U.S. inflation rate edged down to 5.0% as of March 31, 2023, compared to 6.5% as of December 31, 2022, as action
from the U.S. Federal Reserve continues to temper inflation. While declining, the heightened U.S. inflation rate persists due to a combination of supply and demand factors. As a result, in March 2023, the Federal Reserve raised the benchmark interest rate to a target range of 4.75% to 5.00%, up from a target range of 4.25% to 4.50% in December 2022, which marks two consecutive interest rate hikes to start 2023.
Equity market performance continued to rebound during the first quarter while credit markets underperformed. In the U.S., the S&P 500 Index increased by 7.0% during the first quarter of 2023, following an increase of 7.1% during the fourth quarter of 2022. Global equity markets also increased during the quarter, with the MSCI All Country World ex USA Index increasing 8.2%, following an increase of 16.3% in the fourth quarter of 2022.
Conditions in the credit markets have a significant impact on our business. Credit markets were positive in the first quarter of 2023, with the BofAML HY Master II Index increasing by 3.7%, while the S&P/LSTA Leveraged Loan Index increased by 2.9%.
In terms of economic conditions in the U.S., the Bureau of Economic Analysis reported real GDP increased at an annual rate of 1.1% in the first quarter of 2023, following an increase of 2.6% in the fourth quarter of 2022. As of April 2023, the International Monetary Fund estimated that the U.S. economy will expand by 1.6% in 2023 and 1.1% in 2024. The U.S. Bureau of Labor Statistics reported that the U.S. unemployment rate remained at 3.5% as of March 31, 2023.
Foreign exchange rates can materially impact the valuations of our investments and those of the funds we manage that are denominated in currencies other than the U.S. dollar. The U.S. dollar weakened in the first quarter of 2023 compared to the euro and the British pound. Relative to the U.S. dollar, the euro appreciated 1.3% during the first quarter of 2023, after appreciating 9.2% in the fourth quarter of 2022, while the British pound appreciated 2.1% in the first quarter of 2023, after appreciating 8.2% in the fourth quarter of 2022. Oil finished a volatile quarter down 5.7% as the general downward trend from 2022 was reversed in late March by a surprise cut from OPEC, after appreciating by 1.0% during the fourth quarter of 2022.
We are actively monitoring the developments in Ukraine resulting from the Russia/Ukraine conflict and the economic sanctions and restrictions imposed against Russia, Belarus, and certain Russian and Belarussian entities and individuals. The Company continues to (i) identify and assess any exposure to designated persons or entities across the Company’s business; (ii) ensure existing surveillance and controls are calibrated to the evolving sanctions; and (iii) ensure appropriate levels of communication across the Company, and with other relevant market participants, as appropriate.
As of March 31, 2023, the funds we manage have no investments that would cause Apollo or any Apollo managed fund to be in violation of current international sanctions, and we believe the direct exposure of investment portfolios of the funds we manage to Russia and Ukraine is insignificant. The Company and the funds we manage do not intend to make any new material investments in Russia, and have appropriate controls in place to ensure review of any new exposure.
Institutional investors continue to allocate capital towards alternative investment managers in search of more attractive returns, and we believe the business environment remains generally accommodative to raise larger successor funds, launch new products, and pursue attractive strategic growth opportunities.
Interest Rate Environment
Rates experienced a volatile start to 2023 as U.S. 10-year Treasury yields rose through the start of March reaching 4.08% before declining to 3.48% at the end of the quarter. Given the Federal Reserve’s continued focus on curbing inflation and recessionary concerns, it is difficult to predict the level of interest rates and the shape of the yield curve.
With respect to Retirement Services, Athene’s investment portfolio consists predominantly of fixed maturity investments. If prevailing interest rates were to rise, we believe the yield on Athene’s new investment purchases may also rise and Athene’s investment income from floating rate investments would increase, while the value of Athene’s existing investments may decline. If prevailing interest rates were to decline significantly, the yield on Athene’s new investment purchases may decline and Athene’s investment income from floating rate investments would decrease, while the value of Athene’s existing investments may increase.
Athene addresses interest rate risk through managing the duration of the liabilities it sources with assets it acquires through asset liability management (“ALM”) modeling. As part of its investment strategy, Athene purchases floating rate investments, which are expected to perform well in a rising interest rate environment and are expected to underperform in a declining rate
environment. As of March 31, 2023, Athene’s net invested asset portfolio included $41.7 billion of floating rate investments, or 20% of its net invested assets, and its net reserve liabilities included $14.5 billion of floating rate liabilities at notional, or 7% of its net invested assets, resulting in $27.2 billion of net floating rate assets, or 13% of its net invested assets.
If prevailing interest rates were to rise, we believe Athene’s products would be more attractive to consumers and its sales would likely increase. If prevailing interest rates were to decline, it is likely that Athene’s products would be less attractive to consumers and Athene’s sales would likely decrease. In periods of prolonged low interest rates, the net investment spread may be negatively impacted by reduced investment income to the extent that Athene is unable to adequately reduce policyholder crediting rates due to policyholder guarantees in the form of minimum crediting rates or otherwise due to market conditions. A significant majority of Athene’s deferred annuity products have crediting rates that it may reset annually upon renewal following the expiration of the current guaranteed period. While Athene has the contractual ability to lower these crediting rates to the guaranteed minimum levels, its willingness to do so may be limited by competitive pressures.
See “Part I—Item 3. Quantitative and Qualitative Disclosures About Market Risk,” in this report and “Part II—Item 7A. Quantitative and Qualitative Disclosures About Market Risk,” in our 2022 Annual Report, which include a discussion regarding interest rate and other significant risks and Athene’s strategies for managing these risks.
Overview of Results of Operations
Financial Measures under U.S. GAAP - Asset Management
The following discussion of financial measures under U.S. GAAP is based on Apollo’s asset management business as of March 31, 2023.
Revenues
Management Fees
The significant growth of the assets we manage has had a positive effect on our revenues. Management fees are typically calculated based upon any of “net asset value,” “gross assets,” “adjusted par asset value,” “adjusted costs of all unrealized portfolio investments,” “capital commitments,” “invested capital,” “adjusted assets,” “capital contributions,” or “stockholders’ equity,” each as defined in the applicable limited partnership agreement and/or management agreement of the unconsolidated funds or accounts.
Advisory and Transaction Fees, Net
As a result of providing advisory services with respect to actual and potential investments, we are entitled to receive fees for transactions related to the acquisition and, in certain instances, disposition and financing of companies, some of which are portfolio companies of the funds we manage, as well as fees for ongoing monitoring of portfolio company operations and directors’ fees. We also receive advisory fees for advisory services provided to certain funds. In addition, monitoring fees are generated on certain structured portfolio company investments. Under the terms of the limited partnership agreements for certain funds, the management fee payable by the funds may be subject to a reduction based on a certain percentage (up to 100%) of such advisory and transaction fees, net of applicable broken deal costs (“Management Fee Offset”). Such amounts are presented as a reduction to advisory and transaction fees, net, in the condensed consolidated statements of operations (see note 2 to our condensed consolidated financial statements for more detail on advisory and transaction fees, net).
Performance Fees
The general partners of the funds we manage are entitled to an incentive return of normally up to 20% of the total returns of a fund’s capital, depending upon performance of the underlying funds and subject to preferred returns and high water marks, as applicable. Performance fees, categorized as performance allocations, are accounted for as an equity method investment, and effectively, the performance fees for any period are based upon an assumed liquidation of the funds’ assets at the reporting date, and distribution of the net proceeds in accordance with the funds’ allocation provisions. Performance fees categorized as incentive fees, which are not accounted for as an equity method investment, are deferred until fees are probable to not be significantly reversed. The majority of performance fees are comprised of performance allocations.
As of March 31, 2023, approximately 45% of the value of the investments of the funds we manage, on a gross basis, was determined using market-based valuation methods (i.e., reliance on broker or listed exchange quotes) and the remaining 55% was determined primarily by comparable company and industry multiples or discounted cash flow models. See “Item 1A. Risk Factors—Risks Relating to Our Asset Management Business—The performance of the funds we manage, and our performance, may be adversely affected by the financial performance of portfolio companies of the funds we manage and the industries in which the funds we manage invest” in the 2022 Annual Report for discussion regarding certain industry-specific risks that could affect the fair value of certain of the portfolio company investments of the funds we manage.
In certain funds we manage, generally in our equity strategy, the Company does not earn performance fees until the investors have achieved cumulative investment returns on invested capital (including management fees and expenses) in excess of an 8% hurdle rate. Additionally, certain of the yield and hybrid funds we manage have various performance fee rates and hurdle rates. Certain of the yield and hybrid funds we manage allocate performance fees to the general partner in a similar manner as the equity funds. In certain funds we manage, as long as the investors achieve their priority returns, there is a catch-up formula whereby the Company earns a priority return for a portion of the return until the Company’s performance fees equate to its performance fee rate for that fund; thereafter, the Company participates in returns from the fund at the performance fee rate. Performance fees, categorized as performance allocations, are subject to reversal to the extent that the performance fees distributed exceed the amount due to the general partner based on a fund’s cumulative investment returns. The Company recognizes potential repayment of previously received performance fees as a general partner obligation representing all amounts previously distributed to the general partner that would need to be repaid to the Apollo funds if these funds were to be liquidated based on the current fair value of the underlying fund’s investments as of the reporting date. The actual general partner obligation, however, would not become payable or realized until the end of a fund’s life or as otherwise set forth in the respective limited partnership agreement of the fund.
The table below presents an analysis of Apollo’s (i) performance fees receivable on an unconsolidated basis and (ii) realized and unrealized performance fees:
| As of March 31, | Performance Fees for the Three Months Ended March 31, 2023 | ||||||||||||||||||||||||||||||||||||||||||||||||||||||||||||||||||||||||||||||||||
| 2023 | |||||||||||||||||||||||||||||||||||||||||||||||||||||||||||||||||||||||||||||||||||
| (in millions) | Performance Fees Receivable on an Unconsolidated Basis | Unrealized | Realized | Total | |||||||||||||||||||||||||||||||||||||||||||||||||||||||||||||||||||||||||||||||
| AIOF I and II | $ | 10.1 | $ | (0.7) | $ | — | $ | (0.7) | |||||||||||||||||||||||||||||||||||||||||||||||||||||||||||||||||||||||||||
| ANRP I, II and III1 | 29.4 | (15.1) | 0.4 | (14.7) | |||||||||||||||||||||||||||||||||||||||||||||||||||||||||||||||||||||||||||||||
| EPF Funds1 | 69.4 | (2.6) | — | (2.6) | |||||||||||||||||||||||||||||||||||||||||||||||||||||||||||||||||||||||||||||||
| FCI Funds | 139.0 | 0.8 | — | 0.8 | |||||||||||||||||||||||||||||||||||||||||||||||||||||||||||||||||||||||||||||||
| Fund IX | 1,560.6 | 298.8 | 23.4 | 322.2 | |||||||||||||||||||||||||||||||||||||||||||||||||||||||||||||||||||||||||||||||
| Fund VIII | 202.0 | (167.2) | 118.3 | (48.9) | |||||||||||||||||||||||||||||||||||||||||||||||||||||||||||||||||||||||||||||||
| Fund VII2 | 39.8 | (0.7) | 0.6 | (0.1) | |||||||||||||||||||||||||||||||||||||||||||||||||||||||||||||||||||||||||||||||
| Fund VI | 19.3 | (0.1) | 1.7 | 1.6 | |||||||||||||||||||||||||||||||||||||||||||||||||||||||||||||||||||||||||||||||
| Fund IV and Fund V1 | — | (0.1) | — | (0.1) | |||||||||||||||||||||||||||||||||||||||||||||||||||||||||||||||||||||||||||||||
| HVF I | 43.3 | (0.5) | 11.3 | 10.8 | |||||||||||||||||||||||||||||||||||||||||||||||||||||||||||||||||||||||||||||||
| Real Estate Equity | 62.7 | (1.3) | 0.2 | (1.1) | |||||||||||||||||||||||||||||||||||||||||||||||||||||||||||||||||||||||||||||||
| Corporate Credit | 24.4 | 6.2 | 8.8 | 15.0 | |||||||||||||||||||||||||||||||||||||||||||||||||||||||||||||||||||||||||||||||
| Structured Finance and ABS | 76.6 | 7.7 | 7.8 | 15.5 | |||||||||||||||||||||||||||||||||||||||||||||||||||||||||||||||||||||||||||||||
| Direct Origination | 161.1 | 11.6 | 10.4 | 22.0 | |||||||||||||||||||||||||||||||||||||||||||||||||||||||||||||||||||||||||||||||
| Other1,3 | 480.9 | 98.9 | 7.5 | 106.4 | |||||||||||||||||||||||||||||||||||||||||||||||||||||||||||||||||||||||||||||||
| Total | $ | 2,918.6 | $ | 235.7 | $ | 190.4 | $ | 426.1 | |||||||||||||||||||||||||||||||||||||||||||||||||||||||||||||||||||||||||||
| Total, net of profit sharing payable4/expense | $ | 1,498.5 | $ | 102.4 | $ | 32.9 | $ | 135.3 | |||||||||||||||||||||||||||||||||||||||||||||||||||||||||||||||||||||||||||
| 1 As of March 31, 2023, certain funds had $119.4 million in general partner obligations to return previously distributed performance fees. The fair value gain on investments and income at the fund level needed to reverse the general partner obligations was $1.7 billion as of March 31, 2023. | |||||||||||||||||||||||||||||||||||||||||||||||||||||||||||||||||||||||||||||||||||
| 2 As of March 31, 2023, the remaining investments and escrow cash of Fund VII was valued at 110% of the fund’s unreturned capital, which was below the required escrow ratio of 115%. As a result, the fund is required to place in escrow current and future performance fee distributions to the general partner until the specified return ratio of 115% is met (at the time of a future distribution) or upon liquidation. As of March 31, 2023, Fund VII had $85.5 million of gross performance fees or $48.7 million net of profit sharing, in escrow. With respect to Fund VII, realized performance fees currently distributed to the general partner are limited to potential tax distributions and interest on escrow balances per the fund’s partnership agreements. Performance fees receivable as of March 31, 2023 and realized performance fees for the three months ended March 31, 2023 include interest earned on escrow balances that is not subject to contingent repayment. | |||||||||||||||||||||||||||||||||||||||||||||||||||||||||||||||||||||||||||||||||||
| 3 Other includes certain SIAs. | |||||||||||||||||||||||||||||||||||||||||||||||||||||||||||||||||||||||||||||||||||
| 4 There was a corresponding profit sharing payable of $1.4 billion as of March 31, 2023, including profit sharing payable related to amounts in escrow and contingent consideration obligations of $53.2 million. |
The general partners of certain of the funds we manage accrue performance fees, categorized as performance allocations, when the fair value of investments exceeds the cost basis of the individual investors’ investments in the fund, including any allocable share of expenses incurred in connection with such investments, which we refer to as “high water marks.” These high water marks are applied on an individual investor basis. Certain of the funds we manage have investors with various high water marks, the achievement of which is subject to market conditions and investment performance.
Performance fees from certain funds we manage are subject to contingent repayment by the general partner in the event of future losses to the extent that the cumulative performance fees distributed from inception to date exceeds the amount computed as due to the general partner at the final distribution. These general partner obligations, if applicable, are included in due to related parties on the condensed consolidated statements of financial condition.
The following table summarizes our performance fees since inception through March 31, 2023:
| Performance Fees Since Inception****1 | |||||||||||||||||||||||||||||
| Undistributed by Fund and Recognized | Distributed by Fund and Recognized****2 | Total Undistributed and Distributed by Fund and Recognized****3 | General Partner Obligation****3 | Maximum Performance Fees Subject to Potential Reversal****4 | |||||||||||||||||||||||||
| (in millions) | |||||||||||||||||||||||||||||
| AIOF I and II | $ | 10.1 | $ | 58.4 | $ | 68.5 | $ | — | $ | 37.9 | |||||||||||||||||||
| ANRP I, II and III | 29.4 | 159.1 | 188.5 | 32.0 | 33.5 | ||||||||||||||||||||||||
| EPF Funds | 69.4 | 488.7 | 558.1 | 42.4 | 311.7 | ||||||||||||||||||||||||
| FCI Funds | 139.0 | 24.2 | 163.2 | — | 139.0 | ||||||||||||||||||||||||
| Fund IX | 1,560.6 | 612.9 | 2,173.5 | — | 1,942.2 | ||||||||||||||||||||||||
| Fund VIII | 202.0 | 1,779.1 | 1,981.1 | — | 1,348.3 | ||||||||||||||||||||||||
| Fund VII | 39.8 | 3,225.7 | 3,265.5 | — | 13.1 | ||||||||||||||||||||||||
| Fund VI | 19.3 | 1,663.9 | 1,683.2 | — | — | ||||||||||||||||||||||||
| Fund IV and Fund V | — | 2,053.1 | 2,053.1 | 31.4 | — | ||||||||||||||||||||||||
| HVF I | 43.3 | 212.6 | 255.9 | — | 149.0 | ||||||||||||||||||||||||
| Real Estate Equity | 62.7 | 75.6 | 138.3 | 1.2 | 74.3 | ||||||||||||||||||||||||
| Corporate Credit | 24.4 | 928.0 | 952.4 | — | 16.2 | ||||||||||||||||||||||||
| Structured Finance and ABS | 76.6 | 52.3 | 128.9 | — | 69.3 | ||||||||||||||||||||||||
| Direct Origination | 161.1 | 77.1 | 238.2 | — | 145.8 | ||||||||||||||||||||||||
| Other5 | 480.9 | 1,691.3 | 2,172.2 | 12.4 | 651.6 | ||||||||||||||||||||||||
| Total | $ | 2,918.6 | $ | 13,102.0 | $ | 16,020.6 | $ | 119.4 | $ | 4,931.9 | |||||||||||||||||||
| 1 Certain funds are denominated in euros and historical figures are translated into U.S. dollars at an exchange rate of €1.00 to $1.08 as of March 31, 2023. Certain funds are denominated in pounds sterling and historical figures are translated into U.S. dollars at an exchange rate of £1.00 to $1.23 as of March 31, 2023. | |||||||||||||||||||||||||||||
| 2 Amounts in “Distributed by Fund and Recognized” for the Citi Property Investors (“CPI”), Gulf Stream Asset Management, LLC (“Gulf Stream”), Stone Tower Capital LLC and its related companies (“Stone Tower”) funds and SIAs are presented for activity subsequent to the respective acquisition dates. Amounts exclude certain performance fees from business development companies and Redding Ridge Holdings LP (“Redding Ridge Holdings”), an affiliate of Redding Ridge. | |||||||||||||||||||||||||||||
| 3 Amounts were computed based on the fair value of fund investments on March 31, 2023. Performance fees have been allocated to and recognized by the general partner. Based on the amount allocated, a portion is subject to potential reversal or, to the extent applicable, has been reduced by the general partner obligation to return previously distributed performance fees at March 31, 2023. The actual determination and any required payment of any such general partner obligation would not take place until the final disposition of the fund’s investments based on contractual termination of the fund. | |||||||||||||||||||||||||||||
| 4 Represents the amount of performance fees that would be reversed if remaining fund investments became worthless on March 31, 2023. Amounts subject to potential reversal of performance fees include amounts undistributed by a fund (i.e., the performance fees receivable), as well as a portion of the amounts that have been distributed by a fund, net of taxes and not subject to a general partner obligation to return previously distributed performance fees, except for those funds that are gross of taxes as defined in the respective funds’ governing documents. | |||||||||||||||||||||||||||||
| 5 Other includes certain SIAs. |
Expenses
Compensation and Benefits
The most significant expense in our asset management business is compensation and benefits expense. This consists of fixed salary, discretionary and non-discretionary bonuses, profit sharing expense associated with the performance fees earned and compensation expense associated with the vesting of non-cash equity-based awards.
Our compensation arrangements with certain employees contain a significant performance-based incentive component. Therefore, as our net revenues increase, our compensation costs rise. Our compensation costs also reflect the increased investment in people as we expand geographically and create new funds.
In addition, certain professionals and selected other individuals have a profit sharing interest in the performance fees earned in order to better align their interests with our own and with those of the investors in the funds we manage. Profit sharing expense is part of our compensation and benefits expense and is generally based upon a fixed percentage of performance fees. Certain of our performance-based incentive arrangements provide for compensation based on realized performance fees which includes fees earned by the general partners of the funds we manage under the applicable fund limited partnership agreements based
upon transactions that have closed or other rights to incentive income cash that have become fixed in the applicable calendar year period. Profit sharing expense can reverse during periods when there is a decline in performance fees that were previously recognized. Profit sharing amounts are normally distributed to employees after the corresponding investment gains have been realized and generally before preferred returns are achieved for the investors. Therefore, changes in our unrealized performance fees have the same effect on our profit sharing expense. Profit sharing expense increases when unrealized performance fees increase. Realizations only impact profit sharing expense to the extent that the effects on investments have not been recognized previously. If losses on other investments within a fund are subsequently realized, the profit sharing amounts previously distributed are normally subject to a general partner obligation to return performance fees previously distributed back to the funds. This general partner obligation due to the funds would be realized only when the fund is liquidated, which generally occurs at the end of the fund’s term. However, indemnification obligations also exist for realized gains with respect to Fund IV, Fund V and Fund VI, which, although our Former Managing Partners and Contributing Partners would remain personally liable, may indemnify our Former Managing Partners and Contributing Partners for 17.5% to 100% of the previously distributed profits regardless of the fund’s future performance. See note 17 to our condensed consolidated financial statements for further information regarding the Company’s indemnification liability.
The Company grants equity awards to certain employees, including RSUs and restricted shares of common stock, that generally vest and become exercisable in quarterly installments or annual installments depending on the award terms. In some instances, vesting of an RSU is also subject to the Company’s receipt of performance fees, within prescribed periods, sufficient to cover the associated equity-based compensation expense. See note 14 to our condensed consolidated financial statements for further discussion of equity-based compensation.
Other expenses
The balance of our other expenses includes interest, placement fees, and general, administrative and other operating expenses. Interest expense consists primarily of interest related to the 2024 Senior Notes, the 2026 Senior Notes, the 2029 Senior Notes, the 2030 Senior Notes, the 2048 Senior Notes and the 2050 Subordinated Notes as discussed in note 13 to our condensed consolidated financial statements. Placement fees are incurred in connection with our capital raising activities. In cases where the limited partners of the funds are determined to be the customer in an arrangement, placement fees may be capitalized as a cost to acquire a customer contract, and amortized over the life of the customer contract. General, administrative and other expenses includes occupancy expense, depreciation and amortization, professional fees and costs related to travel, information technology and administration. Occupancy expense represents charges related to office leases and associated expenses, such as utilities and maintenance fees. Depreciation and amortization of fixed assets is normally calculated using the straight-line method over their estimated useful lives, ranging from two to sixteen years, taking into consideration any residual value. Leasehold improvements are amortized over the shorter of the useful life of the asset or the expected term of the lease. Intangible assets are amortized based on the future cash flows over the expected useful lives of the assets.
Other Income (Loss)
Net Gains (Losses) from Investment Activities
Net gains (losses) from investment activities include both realized gains and losses and the change in unrealized gains and losses in our investment portfolio between the opening reporting date and the closing reporting date. Net unrealized gains (losses) are a result of changes in the fair value of unrealized investments and reversal of unrealized gains (losses) due to dispositions of investments during the reporting period. Significant judgment and estimation goes into the assumptions that drive these models and the actual values realized with respect to investments could be materially different from values obtained based on the use of those models. The valuation methodologies applied impact the reported value of investment company holdings and their underlying portfolios in our condensed consolidated financial statements.
Net Gains (Losses) from Investment Activities of Consolidated Variable Interest Entities (“VIEs”)
Changes in the fair value of the consolidated VIEs’ assets and liabilities and related interest, dividend and other income and expenses subsequent to consolidation are presented within net gains (losses) from investment activities of consolidated variable interest entities and are attributable to non-controlling interests in the condensed consolidated statements of operations.
Other Income (Losses), Net
Other income (losses), net includes gains (losses) arising from the remeasurement of foreign currency denominated assets and liabilities, remeasurement of the tax receivable agreement liability and other miscellaneous non-operating income and expenses.
Financial Measures under U.S. GAAP - Retirement Services
The following discussion of financial measures under U.S. GAAP is based on the Company’s retirement services business which is operated by Athene as of March 31, 2023.
Revenues
Premiums
Premiums for long-duration contracts, including products with fixed and guaranteed premiums and benefits, are recognized as revenue when due from policyholders. Insurance revenues are reported net of reinsurance ceded.
Product charges
Revenues for universal life-type policies and investment contracts, including surrender and market value adjustments, costs of insurance, policy administration, GMDB, GLWB and no-lapse guarantee charges, are earned when assessed against policyholder account balances during the period.
Net investment income
Net investment income is a significant component of Athene’s total revenues. Athene recognizes investment income as it accrues or is legally due, net of investment management and custody fees. Investment income on fixed maturity securities includes coupon interest, as well as the amortization of any premium and the accretion of any discount. Investment income on equity securities represents dividend income and preferred coupon interest.
Investment related gains (losses)
Investment related gains (losses) primarily consist of (i) realized gains and losses on sales of investments, (ii) unrealized gains or losses relating to identified risks within AFS securities in fair value hedging relationships, (iii) gains and losses on trading securities, (iv) gains and losses on equity securities, (v) change in the fair value of the embedded derivatives and derivatives not designated as a hedge, (vi) change in fair value of mortgage loan assets and (vii) allowance for expected credit losses recorded through the provision for credit losses.
Expenses
Interest sensitive contract benefits
Universal life-type policies and investment contracts include traditional deferred annuities, indexed annuities consisting of fixed indexed and index-linked variable annuities in the accumulation phase, funding agreements, immediate annuities without significant mortality risk (which include pension group annuities without life contingencies), universal life insurance, and other investment contracts inclusive of assumed endowments without significant mortality risk. Liabilities for traditional fixed annuities, universal life insurance and funding agreements are carried at the account balances without reduction for potential surrender or withdrawal charges, except for a block of universal life business ceded to Global Atlantic which is carried at fair value. Fixed indexed annuity, index-linked variable annuity and indexed universal life insurance contracts contain an embedded derivative. Benefit reserves for fixed indexed annuity, index-linked variable annuity and indexed universal life insurance contracts are reported as the sum of the fair value of the embedded derivative and the host (or guaranteed) component of the contracts. Liabilities for immediate annuities without significant mortality risk are calculated as the present value of future liability cash flows and policy maintenance expenses discounted at contractual interest rates. Certain contracts are offered with additional contract features that meet the definition of a market risk benefit. See —Market risk benefits remeasurement (gains) losses below for further information.
Changes in the interest sensitive contract liabilities, excluding deposits and withdrawals, are recorded in interest sensitive contract benefits or product charges on the condensed consolidated statements of operations.
Future policy and other policy benefits
Athene issues contracts classified as long-duration, which include term and whole life, accident and health, disability, and immediate annuities with life contingencies (which include pension group annuities with life contingencies). Liabilities for nonparticipating long-duration contracts are established as the estimated present value of benefits Athene expects to pay to or on behalf of the policyholder and related expenses less the present value of the net premiums to be collected, referred to as the net premium ratio. Liabilities for nonparticipating long-duration contracts are established using accepted actuarial valuation methods which require the use of assumptions related to discount rate, expenses, longevity, mortality, morbidity, persistency and other policyholder behavior. The liability for nonparticipating long-duration contracts is discounted using an upper-medium grade fixed income instrument yield aligned to the duration of the liability.
Changes in the value of the liability for nonparticipating long-duration contracts due to changes in the discount rate are recognized as a component of OCI on the condensed consolidated statements of comprehensive income (loss). The change in the liability for the remeasurement gain or loss and all other changes in the liability are recorded in future policy and other policy benefits on the condensed consolidated statements of operations.
Future policy benefits include liabilities for no-lapse guarantees on universal life insurance and fixed indexed universal life insurance that do not meet the criteria to be classified and accounted for as a market risk benefit. Each reporting period, expected excess benefits and assessments are updated with actual benefits and assessments and the liability balance is adjusted due to the OCI effects of unrealized investment gains and losses on AFS securities.
Changes in the liabilities associated with no-lapse guarantees, other than the adjustment for the OCI effects of unrealized investment gains and losses on AFS securities, are recorded in future policy and other policy benefits on the condensed consolidated statements of operations.
Market risk benefits remeasurement (gains) losses
Market risk benefits represent contracts or contract features that both provide protection to the contract holder from, and expose the insurance entity to, other-than-nominal capital market risk. Athene issues and reinsures deferred annuity contracts which contain GLWB and GMDB riders that meet the criteria for, and are classified as, market risk benefits.
Market risk benefits are measured at fair value at the contract level and may be recorded as a liability or an asset, which are included in market risk benefits or other assets, respectively, on the condensed consolidated statements of financial condition. Fees and assessments that are collectible from the policyholder at contract inception are allocated to the extent they are attributable to the market risk benefit. If the fees are sufficient to cover the projected benefits, a non-option based valuation model is used. If the fees are insufficient to cover the projected benefits, an option-based valuation model is used to compute the market risk benefit liability at contract inception, with an equal and offsetting adjustment recognized in interest sensitive contract liabilities.
Changes in fair value of market risk benefits are recorded in market risk benefits remeasurement (gains) losses on the condensed consolidated statements of operations, excluding portions attributed to changes in instrument-specific credit risk, which are recorded in OCI on the condensed consolidated statements of comprehensive income (loss). Ceded market risk benefits are measured at fair value and recorded within reinsurance recoverable on the condensed consolidated statements of financial condition.
Amortization of deferred acquisition costs, deferred sales inducements, and value of business acquired
Costs related directly to the successful acquisition of new, or the renewal of existing, insurance or investment contracts are deferred. These costs consist of commissions and policy issuance costs, as well as sales inducements credited to policyholder account balances, and are included in deferred acquisition costs, deferred sales inducements and value of business acquired on the condensed consolidated statements of financial condition.
Deferred costs related to universal life-type policies and investment contracts with significant revenue streams from sources other than investment of the policyholder funds are grouped into cohorts based on issue year and contract type and amortized on
a constant level basis over the expected term of the related contracts. The cohorts and assumptions used for the amortization of deferred costs are consistent with those used in estimating the related liabilities for these contracts. Deferred costs related to investment contracts without significant revenue streams from sources other than investment of the policyholder funds are amortized using the effective interest method. The effective interest method amortizes the deferred costs by discounting the future liability cash flows at a break-even rate. VOBA associated with acquired contracts is amortized in relation to applicable policyholder liabilities. Significant assumptions that impact VOBA amortization are consistent with those that impact the measurement of policyholder liabilities.
Amortization of DAC, DSI and VOBA is included in amortization of deferred acquisition costs, deferred sales inducements and value of business acquired on the condensed consolidated statements of operations.
Policy and other operating expenses
Policy and other operating expenses includes normal operating expenses, policy acquisition expenses, interest expense, dividends to policyholders, integration, restructuring and other non-operating expenses, and stock compensation expenses.
Other Financial Measures under U.S. GAAP
Income Taxes
Significant judgment is required in determining the provision for income taxes and in evaluating income tax positions, including evaluating uncertainties. We recognize the income tax benefits of uncertain tax positions only where the position is “more likely than not” to be sustained upon examination, including resolution of any related appeals or litigation, based on the technical merits of the positions. The tax benefit is measured as the largest amount of benefit that has a greater than 50% likelihood of being realized upon ultimate settlement. If a tax position is not considered more likely than not to be sustained, then no benefits of the position are recognized. The Company’s income tax positions are reviewed and evaluated quarterly to determine whether or not we have uncertain tax positions that require financial statement recognition or de-recognition.
Deferred tax assets and liabilities are recognized for the expected future tax consequences, using currently enacted tax rates, of differences between the carrying amount of assets and liabilities and their respective tax basis. The effect on deferred tax assets and liabilities of a change in tax rates is recognized in income in the period when the change is enacted. Deferred tax assets are reduced by a valuation allowance when it is more likely than not that some portion or all of the deferred tax assets will not be realized.
Non-Controlling Interests
For entities that are consolidated, but not 100% owned, a portion of the income or loss and corresponding equity is allocated to owners other than Apollo. The aggregate of the income or loss and corresponding equity that is not owned by the Company is included in non-controlling interests in the condensed consolidated financial statements. Non-controlling interests primarily include limited partner interests in certain consolidated funds and VIEs. Prior to the Mergers on January 1, 2022, the non-controlling interests relating to Apollo Global Management, Inc. also included the ownership interest in the Apollo Operating Group held by the Former Managing Partners and Contributing Partners through their limited partner interests in AP Professional Holdings, L.P. and the non-controlling interest in the Apollo Operating Group held by Athene.
The authoritative guidance for non-controlling interests in the condensed consolidated financial statements requires reporting entities to present non-controlling interest as equity and provides guidance on the accounting for transactions between an entity and non-controlling interests. According to the guidance, (1) non-controlling interests are presented as a separate component of stockholders’ equity on the Company’s condensed consolidated statements of financial condition, (2) net income (loss) includes the net income (loss) attributable to the non-controlling interest holders on the Company’s condensed consolidated statements of operations, (3) the primary components of non-controlling interest are separately presented in the Company’s condensed consolidated statements of changes in stockholders’ equity to clearly distinguish the interests in the Apollo Operating Group and other ownership interests in the consolidated entities and (4) profits and losses are allocated to non-controlling interests in proportion to their ownership interests regardless of their basis.
Results of Operations
Below is a discussion of our condensed consolidated statements of operations for the three months ended March 31, 2023 and 2022. For additional analysis of the factors that affected our results at the segment level, see “—Segment Analysis” below:
| For the Three Months ended March 31, | Total Change | Percentage Change | |||||||||||||||||||||||||||||||||||||||||||||||||||||||||||||||||||||
| 2023 | 2022 | ||||||||||||||||||||||||||||||||||||||||||||||||||||||||||||||||||||||
| (In millions) | |||||||||||||||||||||||||||||||||||||||||||||||||||||||||||||||||||||||
| Revenues | |||||||||||||||||||||||||||||||||||||||||||||||||||||||||||||||||||||||
| Asset Management | |||||||||||||||||||||||||||||||||||||||||||||||||||||||||||||||||||||||
| Management fees | $ | 414 | $ | 336 | $ | 78 | 23.2% | ||||||||||||||||||||||||||||||||||||||||||||||||||||||||||||||||
| Advisory and transaction fees, net | 155 | 66 | 89 | 134.8 | |||||||||||||||||||||||||||||||||||||||||||||||||||||||||||||||||||
| Investment income (loss) | 452 | 701 | (249) | (35.5) | |||||||||||||||||||||||||||||||||||||||||||||||||||||||||||||||||||
| Incentive fees | 15 | 6 | 9 | 150.0 | |||||||||||||||||||||||||||||||||||||||||||||||||||||||||||||||||||
| 1,036 | 1,109 | (73) | (6.6) | ||||||||||||||||||||||||||||||||||||||||||||||||||||||||||||||||||||
| Retirement Services | |||||||||||||||||||||||||||||||||||||||||||||||||||||||||||||||||||||||
| Premiums | 96 | 2,110 | (2,014) | (95.5) | |||||||||||||||||||||||||||||||||||||||||||||||||||||||||||||||||||
| Product charges | 198 | 166 | 32 | 19.3 | |||||||||||||||||||||||||||||||||||||||||||||||||||||||||||||||||||
| Net investment income | 2,612 | 1,731 | 881 | 50.9 | |||||||||||||||||||||||||||||||||||||||||||||||||||||||||||||||||||
| Investment related gains (losses) | 1,065 | (4,230) | 5,295 | NM | |||||||||||||||||||||||||||||||||||||||||||||||||||||||||||||||||||
| Revenues of consolidated variable interest entities | 281 | (21) | 302 | NM | |||||||||||||||||||||||||||||||||||||||||||||||||||||||||||||||||||
| Other revenues | 13 | (3) | 16 | NM | |||||||||||||||||||||||||||||||||||||||||||||||||||||||||||||||||||
| 4,265 | (247) | 4,512 | NM | ||||||||||||||||||||||||||||||||||||||||||||||||||||||||||||||||||||
| Total Revenues | 5,301 | 862 | 4,439 | NM | |||||||||||||||||||||||||||||||||||||||||||||||||||||||||||||||||||
| Expenses | |||||||||||||||||||||||||||||||||||||||||||||||||||||||||||||||||||||||
| Asset Management | |||||||||||||||||||||||||||||||||||||||||||||||||||||||||||||||||||||||
| Compensation and benefits: | |||||||||||||||||||||||||||||||||||||||||||||||||||||||||||||||||||||||
| Salary, bonus and benefits | 255 | 218 | 37 | 17.0 | |||||||||||||||||||||||||||||||||||||||||||||||||||||||||||||||||||
| Equity-based compensation | 124 | 156 | (32) | (20.5) | |||||||||||||||||||||||||||||||||||||||||||||||||||||||||||||||||||
| Profit sharing expense | 291 | 360 | (69) | (19.2) | |||||||||||||||||||||||||||||||||||||||||||||||||||||||||||||||||||
| Total compensation and benefits | 670 | 734 | (64) | (8.7) | |||||||||||||||||||||||||||||||||||||||||||||||||||||||||||||||||||
| Interest expense | 31 | 32 | (1) | (3.1) | |||||||||||||||||||||||||||||||||||||||||||||||||||||||||||||||||||
| General, administrative and other | 197 | 148 | 49 | 33.1 | |||||||||||||||||||||||||||||||||||||||||||||||||||||||||||||||||||
| 898 | 914 | (16) | (1.8) | ||||||||||||||||||||||||||||||||||||||||||||||||||||||||||||||||||||
| Retirement Services | |||||||||||||||||||||||||||||||||||||||||||||||||||||||||||||||||||||||
| Interest sensitive contract benefits | 1,289 | (99) | 1,388 | NM | |||||||||||||||||||||||||||||||||||||||||||||||||||||||||||||||||||
| Future policy and other policy benefits | 466 | 2,184 | (1,718) | (78.7) | |||||||||||||||||||||||||||||||||||||||||||||||||||||||||||||||||||
| Market risk benefits remeasurement (gains) losses | 346 | (622) | 968 | NM | |||||||||||||||||||||||||||||||||||||||||||||||||||||||||||||||||||
| Amortization of deferred acquisition costs, deferred sales inducements and value of business acquired | 138 | 98 | 40 | 40.8 | |||||||||||||||||||||||||||||||||||||||||||||||||||||||||||||||||||
| Policy and other operating expenses | 437 | 309 | 128 | 41.4 | |||||||||||||||||||||||||||||||||||||||||||||||||||||||||||||||||||
| 2,676 | 1,870 | 806 | 43.1 | ||||||||||||||||||||||||||||||||||||||||||||||||||||||||||||||||||||
| Total Expenses | 3,574 | 2,784 | 790 | 28.4 |
| For the Three Months ended March 31, | Total Change | Percentage Change | |||||||||||||||||||||||||||||||||||||||||||||||||||||||||||||||||||||
| 2023 | 2022 | ||||||||||||||||||||||||||||||||||||||||||||||||||||||||||||||||||||||
| (In millions) | |||||||||||||||||||||||||||||||||||||||||||||||||||||||||||||||||||||||
| Other income (loss) – Asset Management | |||||||||||||||||||||||||||||||||||||||||||||||||||||||||||||||||||||||
| Net gains (losses) from investment activities | (2) | 34 | (36) | NM | |||||||||||||||||||||||||||||||||||||||||||||||||||||||||||||||||||
| Net gains (losses) from investment activities of consolidated variable interest entities | 34 | 367 | (333) | (90.7) | |||||||||||||||||||||||||||||||||||||||||||||||||||||||||||||||||||
| Other income (loss), net | 32 | (23) | 55 | NM | |||||||||||||||||||||||||||||||||||||||||||||||||||||||||||||||||||
| Total Other income (loss) | 64 | 378 | (314) | (83.1) | |||||||||||||||||||||||||||||||||||||||||||||||||||||||||||||||||||
| Income (loss) before income tax (provision) benefit | 1,791 | (1,544) | 3,335 | NM | |||||||||||||||||||||||||||||||||||||||||||||||||||||||||||||||||||
| Income tax (provision) benefit | (253) | 485 | (738) | NM | |||||||||||||||||||||||||||||||||||||||||||||||||||||||||||||||||||
| Net income (loss) | 1,538 | (1,059) | 2,597 | NM | |||||||||||||||||||||||||||||||||||||||||||||||||||||||||||||||||||
| Net (income) loss attributable to non-controlling interests | (528) | 658 | (1,186) | NM | |||||||||||||||||||||||||||||||||||||||||||||||||||||||||||||||||||
| Net income (loss) available to Apollo Global Management, Inc. common stockholders | $ | 1,010 | $ | (401) | $ | 1,411 | NM | ||||||||||||||||||||||||||||||||||||||||||||||||||||||||||||||||
| Note: “NM” denotes not meaningful. Changes from negative to positive amounts and positive to negative amounts are not considered meaningful. Increases or decreases from zero and changes greater than 500% are also not considered meaningful. |
Three Months Ended March 31, 2023 Compared to Three Months Ended March 31, 2022
In this section, references to 2023 refer to the three months ended March 31, 2023 and references to 2022 refer to the three months ended March 31, 2022.
Asset Management
Revenues
Revenues were $1,036 million in 2023, a decrease of $73 million from $1,109 million in 2022, primarily driven by lower investment income (loss). Investment income decreased $249 million in 2023 to $452 million compared to $701 million in 2022. The decrease in investment income of $249 million in 2023 was driven by decreases in principal investment income and performance allocations of $122 million and $127 million, respectively.
The decrease in principal investment income in 2023 was driven by the depreciation in value of investments held by certain funds we manage in which the Company has a direct interest, as a result of the equity market volatility in 2023.
Significant drivers for performance allocations in 2022 were performance allocations earned from Fund IX of $470 million, primarily as a result of fund appreciation and realization activity, partially offset by performance allocation losses from Fund VIII of $77 million, as a result of fund depreciation as a result of the equity market volatility in 2022. Significant drivers for performance allocations in 2023 were performance allocations primarily earned from Fund IX of $330 million, partially offset by performance allocation losses from Fund VIII of $51 million, as a result of continued equity market volatility in 2023.
See below for details on the respective funds’ performance allocations in 2023.
The performance allocations earned from Fund IX in 2023 were primarily driven by appreciation of the fund’s investments in the leisure and media, telecom and technology sectors.
The performance allocation losses from Fund VIII in 2023 were primarily driven by depreciation and realization of the fund’s investments in the consumer services, media, telecom and technology and leisure sectors.
The decrease in investment income in 2023 was offset, in part, by increases in advisory and transaction fees, net and management fees of $89 million and $78 million, respectively. Advisory and transaction fees increased by $89 million to $155 million in 2023 from $66 million in 2022. Advisory and transaction fees earned during 2023 were primarily attributable to advisory and transaction fees earned from companies in the financial services, business services and consumer services sectors. Management fees increased by $78 million to $414 million in 2023 from $336 million in 2022 due to increases in management fees earned from ADREF and ADCF and MidCap Financial of $24 million and $13 million, respectively. The increases in management fees earned from ADREF and ADCF and MidCap Financial were driven by the management fee contribution from
the Griffin Capital U.S. asset management business and higher fee-generating AUM, respectively. Management fees also benefitted from the net impact of the commencement of Fund X’s fees and the fee basis step-down of Fund IX from committed to remaining invested capital, which added net fees of $15 million, inclusive of Fund X catch-up fees of $3 million.
Expenses
Expenses were $898 million in 2023, a decrease of $16 million from $914 million in 2022 due to a decrease in profit sharing expense of $69 million, resulting from the corresponding lower investment income during 2023. In any period, the blended profit sharing percentage is impacted by the respective profit sharing ratios of the funds generating performance allocations in the period. Additionally, there was a decrease in equity-based compensation expense of $32 million, offset by an increase in salary, bonus and benefits of $37 million due to accelerated headcount growth. Equity-based compensation expense, in any given period, is generally comprised of: i) performance grants which are tied to the Company’s receipt of performance fees, within prescribed periods and are typically recognized on an accelerated recognition method over the requisite service period to the extent the performance revenue metrics are met or deemed probable, and ii) the impact of the 2021 one-time grants awarded to the Co-Presidents, all of which vest on a cliff basis subject to continued employment over five years, and a portion of which also vest on the Company’s achievement of FRE and SRE per share metrics.
General, administrative and other expenses were $197 million in 2023, an increase of $49 million from $148 million in 2022. The increase in 2023 was primarily driven by increases in amortization expense from the Company’s commitment asset and other intangible assets, higher occupancy costs, and higher travel and entertainment expenses corresponding with the Company’s increased headcount.
Other Income (Loss)
Other income (loss) was $64 million in 2023, a decrease of $314 million from $378 million in 2022. This decrease was primarily driven by a decrease in net gains from investment activities of consolidated VIEs of $333 million. The net gains from investment activities of consolidated VIEs in 2022 were primarily attributable to income earned from the Company’s deconsolidated VIEs in 2022. Other income in 2023 was primarily attributable to net gains from consolidated VIEs and interest income earned on the Company’s money market funds and U.S. treasury securities, as a result of the rising interest rate environment.
Retirement Services
Revenues
Retirement Services revenues were $4.3 billion in 2023, an increase of $4.5 billion from $(247) million in 2022. The increase was primarily driven by an increase in investment related gains (losses), an increase in net investment income and an increase in revenues of consolidated VIEs, partially offset by a decrease in premiums.
Investment related gains (losses) were $1.1 billion in 2023, an increase of $5.3 billion from $(4.2) billion in 2022, primarily due to the changes in the fair value of reinsurance assets, FIA hedging derivatives, mortgage loans and trading securities, realized gains on AFS securities compared to realized losses in the prior year and a decrease in the provision for credit losses, partially offset by foreign exchange losses on derivatives. The change in fair value of reinsurance assets increased $3.1 billion, the change in fair value of mortgage loans increased $1.1 billion and the change in fair value of trading securities increased $285 million primarily driven by a decrease in U.S. Treasury rates and credit spread tightening in the current year compared to a significant increase in U.S. Treasury rates and credit spread widening in the prior year. The change in fair value of FIA hedging derivatives increased $1.1 billion primarily driven by the favorable performance of the indices upon which Athene’s call options are based. The largest percentage of Athene’s call options are based on the S&P 500 index, which increased 7.0% in 2023, compared to a decrease of 4.9% in 2022. The favorable change in realized gains and losses on AFS securities of $386 million was primarily related to foreign exchange impacts as foreign currencies strengthened against the U.S. dollar in comparison to the prior year. The favorable change in the provision for credit losses of $126 million was primarily due to unfavorable economics in the prior year, including impacts from the conflict between Russia and Ukraine and exposure to China’s real estate market. The increase in foreign exchange losses on derivatives reflects foreign currencies having strengthened against the U.S. dollar in comparison to the prior year.
Net investment income was $2.6 billion in 2023, an increase of $881 million from $1.7 billion in 2022, primarily driven by growth in Athene’s investment portfolio attributed to strong net flows during the previous twelve months as well as higher
floating rate income and higher new money rates related to higher short-term interest rates. These increases were partially offset by a decrease in alternative income due to less favorable alternative investment performance, the transfer, beginning in the second quarter of 2022, of a significant portion of Athene’s alternative investments to AAA, a consolidated VIE, and higher investment management fees driven by the strong growth in Athene’s investment portfolio.
Revenues of consolidated VIEs were $281 million in 2023, an increase of $302 million from $(21) million in 2022, primarily driven by unrealized gains on assets transferred to AAA beginning in the second quarter of 2022 as well as a favorable change in the fair value of mortgage loans held in VIEs related to a decrease in U.S. Treasury rates compared to an increase in the prior year.
Premiums were $96 million in 2023, a decrease of $2.0 billion from $2.1 billion in 2022, primarily driven by a $1.9 billion decrease in pension group annuity premiums compared to the prior year.
Expenses
Retirement Services expenses were $2.7 billion in 2023, an increase of $806 million from $1.9 billion in 2022. The increase was primarily driven by an increase in interest sensitive contract benefits, an increase in market risk benefits remeasurement (gains) losses and an increase in policy and other operating expenses, partially offset by a decrease in future policy and other policy benefits.
Interest sensitive contract benefits were $1.3 billion in 2023, an increase of $1.4 billion from $(99) million in 2022, primarily driven by an increase in the change in FIA fair value embedded derivatives of $1.5 billion, an increase in rates on deferred annuity issuances and existing floating rate funding agreements driven by the increase in U.S. Treasury rates and growth in the block of business. The change in the FIA fair value embedded derivatives was primarily due to the performance of the equity indices to which Athene’s FIA policies are linked. The largest percentage of its FIA policies are linked to the S&P 500 index, which increased 7.0% in 2023, compared to a decrease of 4.9% in 2022. The change in the FIA fair value embedded derivatives was also driven by the unfavorable change in discount rates used in Athene’s embedded derivative calculations as the current year experienced a decrease in discount rates compared to an increase in discount rates in the prior year, partially offset by the impact of rates on policyholder projected benefits.
Market risk benefits remeasurement (gains) losses were $346 million in 2023, an increase of $968 million from $(622) million in 2022, primarily driven by the unfavorable change in the fair value of market risk benefits. The change in fair value of market risk benefits increased $984 million compared to the prior year due to a decrease in the risk-free rate in the outer years of the curve. This was partially offset by a decrease of $73 million related to favorable equity market performance.
Policy and other operating expenses were $437 million in 2023, an increase of $128 million from $309 million in 2022, primarily driven by an increase in interest expense related to floating rate long-term repurchase agreements, as rates increased throughout the prior year, the increase in issuances of short-term repurchase agreements during the current quarter and the issuance of debt in the fourth quarter of the prior year, as well as an increase in general operating expenses related to growth in the business.
Future policy and other policy benefits were $466 million in 2023, a decrease of $1.7 billion from $2.2 billion in 2022, primarily driven by a $1.9 billion decrease in pension group annuity obligations, partially offset by an increase in the AmerUs Closed Block fair value liability. The change in the AmerUs Closed Block fair value liability was primarily due to unrealized gains on the underlying investments reflecting a decrease in U.S. Treasury rates and credit spreads tightening in the current year compared to an increase in U.S. Treasury rates and credit spreads widening in the prior year.
Income Tax (Provision) Benefit
The Company’s income tax (provision) benefit totaled $(253) million and $485 million in 2023 and 2022, respectively. The change to the provision was primarily related to the increase in pre-tax income and a one-time deferred tax benefit recognized in 2022 due to the Mergers. The provision for income taxes includes federal, state, local and foreign income taxes resulting in an effective income tax rate of 14.1% and 31.4% for 2023 and 2022, respectively. The most significant reconciling items between the U.S. federal statutory income tax rate and the effective income tax rate were due to the following: (i) a benefit realized from the derecognition of a deferred tax liability related to the Company’s historical holdings in Athene, (ii) foreign, state and local income taxes, including NYC UBT, (iii) income attributable to non-controlling interests and (iv) equity-based
compensation net of the limiting provisions for executive compensation under IRC Section 162(m) (see note 12 to the condensed consolidated financial statements for further details regarding the Company’s income tax provision).
Managing Business Performance - Key Segment and Non-U.S. GAAP Performance Measures
We believe that the presentation of Segment Income supplements a reader’s understanding of the economic operating performance of each of our segments.
Segment Income and Adjusted Net Income
Segment Income is the key performance measure used by management in evaluating the performance of the Asset Management, Retirement Services, and Principal Investing segments. See note 19 to the condensed consolidated financial statements for more details regarding the components of Segment Income and management’s consideration of Segment Income.
We believe that Segment Income is helpful for an understanding of our business and that investors should review the same supplemental financial measure that management uses to analyze our segment performance. This measure supplements and should be considered in addition to and not in lieu of the results of operations discussed above in “—Overview of Results of Operations” that have been prepared in accordance with U.S. GAAP.
Adjusted Net Income (“ANI”) represents Segment Income less HoldCo interest and other financing costs and estimated income taxes. For purposes of calculating the Adjusted Net Income tax rate, Segment Income is reduced by HoldCo interest and financing costs. Income taxes on FRE and PII represents the total current corporate, local, and non-U.S. taxes as well as the current payable under Apollo’s tax receivable agreement. Income taxes on FRE and PII excludes the impacts of deferred taxes and the remeasurement of the tax receivable agreement, which arise from changes in estimated future tax rates. Certain assumptions and methodologies that impact the implied FRE and PII income tax provision are similar to those used under U.S. GAAP. Specifically, certain deductions considered in the income tax provision under U.S. GAAP relating to transaction related charges, equity-based compensation, and tax deductible interest expense are taken into account for the implied tax provision. Income Taxes on SRE represent the total current and deferred tax expense or benefit on income before taxes adjusted to eliminate the impact of the tax expense or benefit associated with the non-operating adjustments. Management believes the methodologies used to compute income taxes on FRE, SRE, and PII are meaningful to each segment and increases comparability of income taxes between periods.
Fee Related Earnings, Spread Related Earnings and Principal Investing Income
Fee Related Earnings, or “FRE”, is a component of Segment Income that is used as a supplemental performance measure to assess the performance of the Asset Management segment.
Spread Related Earnings, or “SRE”, is a component of Segment Income that is used as a supplemental performance measure to assess the performance of the Retirement Services segment, excluding certain market volatility and certain expenses related to integration, restructuring, equity-based compensation, and other expenses.
Principal Investing Income, or “PII”, is a component of Segment Income that is used as a supplemental performance measure to assess the performance of the Principal Investing segment.
See note 19 to the condensed consolidated financial statements for more details regarding the components of FRE, SRE, and PII.
We use Segment Income, ANI, FRE, SRE and PII as measures of operating performance, not as measures of liquidity. These measures should not be considered in isolation or as a substitute for net income or other income data prepared in accordance with U.S. GAAP. The use of these measures without consideration of their related U.S. GAAP measures is not adequate due to the adjustments described above.
Net Invested Assets
In managing its business, Athene analyzes net invested assets, which does not correspond to total Athene investments, including investments in related parties, as disclosed in the condensed consolidated statements of financial condition and notes thereto. Net invested assets represent the investments that directly back its net reserve liabilities as well as surplus assets. Net invested
assets is used in the computation of net investment earned rate, which is used to analyze the profitability of Athene’s investment portfolio. Net invested assets includes (a) total investments on the condensed consolidated statements of financial condition with AFS securities at cost or amortized cost, excluding derivatives, (b) cash and cash equivalents and restricted cash, (c) investments in related parties, (d) accrued investment income, (e) VIE and VOE assets, liabilities and non-controlling interest adjustments, (f) net investment payables and receivables, (g) policy loans ceded (which offset the direct policy loans in total investments) and (h) an adjustment for the allowance for credit losses. Net invested assets excludes assets associated with funds withheld liabilities related to business exited through reinsurance agreements and derivative collateral (offsetting the related cash positions). Athene includes the underlying investments supporting its assumed funds withheld and modco agreements in its net invested assets calculation in order to match the assets with the income received. Athene believes the adjustments for reinsurance provide a view of the assets for which it has economic exposure. Net invested assets includes Athene’s proportionate share of ACRA investments, based on its economic ownership, but does not include the proportionate share of investments associated with the non-controlling interest. Net invested assets are averaged over the number of quarters in the relevant period to compute a net investment earned rate for such period. While Athene believes net invested assets is a meaningful financial metric and enhances the understanding of the underlying drivers of its investment portfolio, it should not be used as a substitute for Athene’s total investments, including related parties, presented under U.S. GAAP.
Segment Analysis
Discussed below are our results of operations for each of our reportable segments. They represent the segment information available and utilized by management to assess performance and to allocate resources. See note 19 to our condensed consolidated financial statements for more information regarding our segment reporting.
Asset Management
The following table presents Fee Related Earnings, the performance measure of our Asset Management segment.
| Three months ended March 31, | Total Change | Percentage Change | |||||||||||||||||||||||||||||||||||||||||||||||||||||||||||||||||||||
| 2023 | 2022 | ||||||||||||||||||||||||||||||||||||||||||||||||||||||||||||||||||||||
| (In millions) | |||||||||||||||||||||||||||||||||||||||||||||||||||||||||||||||||||||||
| Asset Management: | |||||||||||||||||||||||||||||||||||||||||||||||||||||||||||||||||||||||
| Management fees - Yield | $ | 379 | $ | 333 | $ | 46 | 13.8% | ||||||||||||||||||||||||||||||||||||||||||||||||||||||||||||||||
| Management fees - Hybrid | 57 | 48 | 9 | 18.8 | |||||||||||||||||||||||||||||||||||||||||||||||||||||||||||||||||||
| Management fees - Equity | 141 | 124 | 17 | 13.7 | |||||||||||||||||||||||||||||||||||||||||||||||||||||||||||||||||||
| Management fees | 577 | 505 | 72 | 14.3 | |||||||||||||||||||||||||||||||||||||||||||||||||||||||||||||||||||
| Capital solutions fees and other, net | 138 | 64 | 74 | 115.6 | |||||||||||||||||||||||||||||||||||||||||||||||||||||||||||||||||||
| Fee-related performance fees | 27 | 14 | 13 | 92.9 | |||||||||||||||||||||||||||||||||||||||||||||||||||||||||||||||||||
| Fee-related compensation | (211) | (175) | 36 | 20.6 | |||||||||||||||||||||||||||||||||||||||||||||||||||||||||||||||||||
| Other operating expenses | (134) | (98) | 36 | 36.7 | |||||||||||||||||||||||||||||||||||||||||||||||||||||||||||||||||||
| Fee Related Earnings (FRE) | $ | 397 | $ | 310 | $ | 87 | 28.1% |
In this section, references to 2023 refer to the three months ended March 31, 2023 and references to 2022 refer to the three months ended March 31, 2022.
Three Months Ended March 31, 2023 Compared to Three Months Ended March 31, 2022
FRE was $397 million in 2023, an increase of $87 million compared to $310 million in 2022. This increase was primarily attributable to increases in capital solutions fees and other, net and management fees. Capital solutions fees earned in 2023 were primarily attributable to fees earned from companies in the financial services, business services and consumer services sectors.
The increase in management fees was primarily attributable to management fees earned from Athene and ADREF and ADCF of $23 million and $19 million, respectively. The increases in management fees earned from Athene and ADREF and ADCF were driven by higher fee-generating AUM as a result of growth in Retirement Services clients and the management fee contribution from the Griffin Capital U.S. asset management business, respectively. Management fees also benefitted from the net impact of the commencement of Fund X’s fees and the fee basis step-down of Fund IX from committed to remaining invested capital, which added net fees of $15 million, inclusive of Fund X catch-up fees of $3 million.
The growth in revenues was offset, in part, by increases in fee-related compensation expense associated with the re-basing of cost structure to support the Company’s next phase of growth, as well as costs associated with the acquisition of Griffin Capital’s U.S. asset management business.
Asset Management Operating Metrics
We monitor certain operating metrics that are common to the alternative asset management industry and directly impact the performance of our Asset Management segment. These operating metrics include Assets Under Management, gross capital deployment and uncalled commitments.
Assets Under Management
The following presents Apollo’s Total AUM and Fee-Generating AUM by investing strategy (in billions):
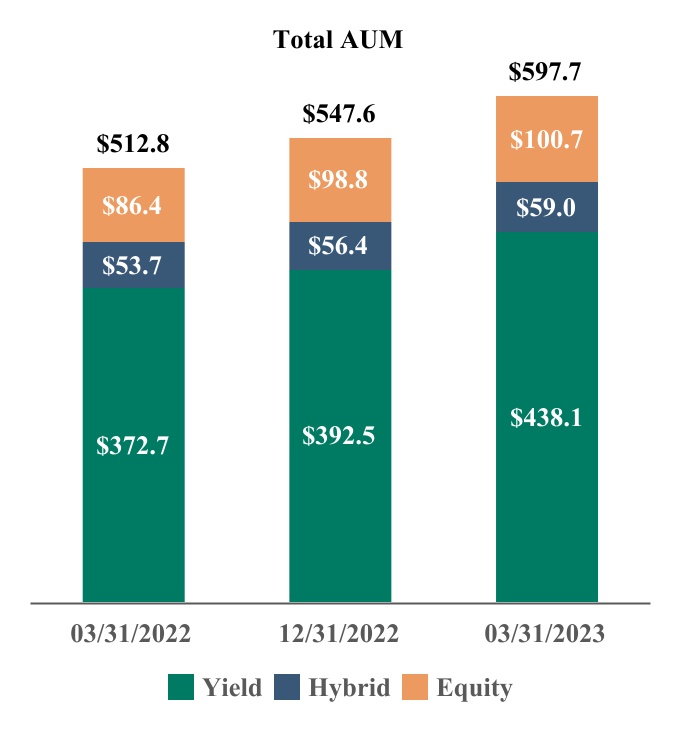
 Note: Totals may not add due to rounding.
The following presents Apollo’s AUM with Future Management Fee Potential by investing strategy (in billions):
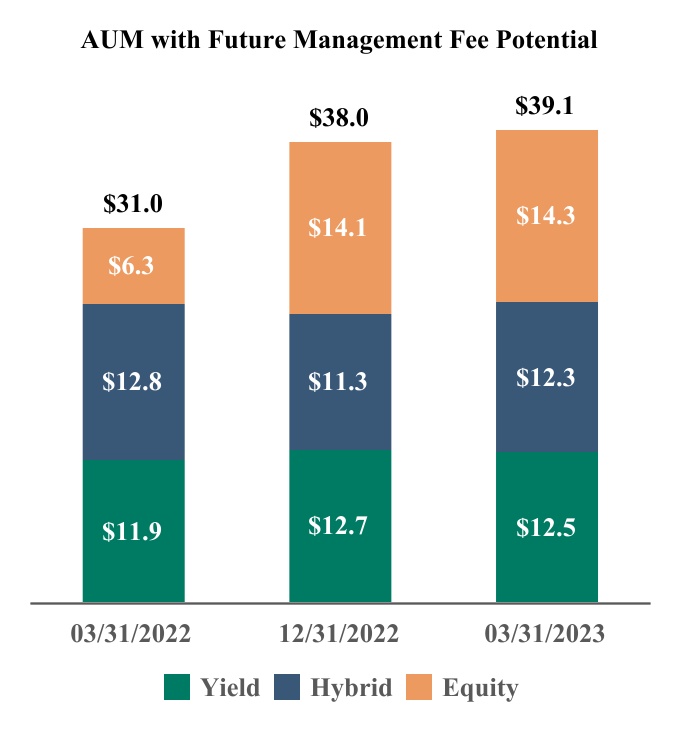
Note: Totals may not add due to rounding
The following tables present the components of Performance Fee-Eligible AUM for each of Apollo’s three investing strategies within the Asset Management segment:
| As of March 31, 2023 | |||||||||||||||||||||||
| Yield | Hybrid | Equity | Total | ||||||||||||||||||||
| (In millions) | |||||||||||||||||||||||
| Performance Fee-Generating AUM 1 | $ | 48,732 | $ | 22,254 | $ | 43,105 | $ | 114,091 | |||||||||||||||
| AUM Not Currently Generating Performance Fees | 7,151 | 8,251 | 3,844 | 19,246 | |||||||||||||||||||
| Uninvested Performance Fee-Eligible AUM | 6,441 | 13,214 | 30,508 | 50,163 | |||||||||||||||||||
| Total Performance Fee-Eligible AUM | $ | 62,324 | $ | 43,719 | $ | 77,457 | $ | 183,500 |
| As of March 31, 2022 | |||||||||||||||||||||||
| Yield | Hybrid | Equity | Total | ||||||||||||||||||||
| (In millions) | |||||||||||||||||||||||
| Performance Fee-Generating AUM 1 | $ | 37,000 | $ | 18,187 | $ | 41,482 | $ | 96,669 | |||||||||||||||
| AUM Not Currently Generating Performance Fees | 7,637 | 6,250 | 4,231 | 18,118 | |||||||||||||||||||
| Uninvested Performance Fee-Eligible AUM | 4,396 | 14,896 | 18,711 | 38,003 | |||||||||||||||||||
| Total Performance Fee-Eligible AUM | $ | 49,033 | $ | 39,333 | $ | 64,424 | $ | 152,790 |
| As of December 31, 2022 | |||||||||||||||||||||||
| Yield | Hybrid | Equity | Total | ||||||||||||||||||||
| (In millions) | |||||||||||||||||||||||
| Performance Fee-Generating AUM 1 | $ | 40,169 | $ | 12,177 | $ | 42,126 | $ | 94,472 | |||||||||||||||
| AUM Not Currently Generating Performance Fees | 15,912 | 17,777 | 3,166 | 36,855 | |||||||||||||||||||
| Uninvested Performance Fee-Eligible AUM | 4,628 | 12,839 | 30,836 | 48,303 | |||||||||||||||||||
| Total Performance Fee-Eligible AUM | $ | 60,709 | $ | 42,793 | $ | 76,128 | $ | 179,630 | |||||||||||||||
| 1 Performance Fee-Generating AUM of $4.2 billion, $5.2 billion and $3.9 billion as of March 31, 2023, March 31, 2022 and December 31, 2022, respectively, are above the hurdle rates or preferred returns and have been deferred to future periods when the fees are probable to not be significantly reversed. |
The components of Fee-Generating AUM by investing strategy are presented below:
| As of March 31, 2023 | |||||||||||||||||||||||
| Yield | Hybrid | Equity | Total | ||||||||||||||||||||
| (In millions) | |||||||||||||||||||||||
| Fee-Generating AUM based on capital commitments | $ | — | $ | 2,531 | $ | 20,641 | $ | 23,172 | |||||||||||||||
| Fee-Generating AUM based on invested capital | 3,350 | 10,277 | 26,701 | 40,328 | |||||||||||||||||||
| Fee-Generating AUM based on gross/adjusted assets | 322,465 | 4,829 | 596 | 327,890 | |||||||||||||||||||
| Fee-Generating AUM based on NAV | 42,422 | 10,844 | 551 | 53,817 | |||||||||||||||||||
| Total Fee-Generating AUM | $ | 368,237 | $ | 28,481 | $ | 48,489 | 1 | $ | 445,207 | ||||||||||||||
| 1 The weighted average remaining life of the traditional private equity funds as of March 31, 2023 was 74 months. |
| As of March 31, 2022 | |||||||||||||||||||||||
| Yield | Hybrid | Equity | Total | ||||||||||||||||||||
| (In millions) | |||||||||||||||||||||||
| Fee-Generating AUM based on capital commitments | $ | — | $ | 3,580 | $ | 27,348 | $ | 30,928 | |||||||||||||||
| Fee-Generating AUM based on invested capital | 2,448 | 7,533 | 12,790 | 22,771 | |||||||||||||||||||
| Fee-Generating AUM based on gross/adjusted assets | 275,373 | 4,913 | 546 | 280,832 | |||||||||||||||||||
| Fee-Generating AUM based on NAV | 33,497 | 7,475 | 216 | 41,188 | |||||||||||||||||||
| Total Fee-Generating AUM | $ | 311,318 | $ | 23,501 | $ | 40,900 | 1 | $ | 375,719 | ||||||||||||||
| 1 The weighted average remaining life of the traditional private equity funds at March 31, 2022 was 62 months. |
| As of December 31, 2022 | |||||||||||||||||||||||
| Yield | Hybrid | Equity | Total | ||||||||||||||||||||
| (In millions) | |||||||||||||||||||||||
| Fee-Generating AUM based on capital commitments | $ | — | $ | 2,531 | $ | 19,434 | $ | 21,965 | |||||||||||||||
| Fee-Generating AUM based on invested capital | 3,381 | 9,528 | 26,695 | 39,604 | |||||||||||||||||||
| Fee-Generating AUM based on gross/adjusted assets | 293,240 | 4,827 | 593 | 298,660 | |||||||||||||||||||
| Fee-Generating AUM based on NAV | 42,200 | 9,227 | 431 | 51,858 | |||||||||||||||||||
| Total Fee-Generating AUM | $ | 338,821 | $ | 26,113 | $ | 47,153 | 1 | $ | 412,087 | ||||||||||||||
| 1 The weighted average remaining life of the traditional private equity funds as of December 31, 2022 was 76 months. |
Apollo, through its consolidated subsidiary, ISG, provides asset management services to Athene with respect to assets in the accounts owned by or related to Athene (“Athene Accounts”), including asset allocation services, direct asset management services, asset and liability matching management, mergers and acquisitions, asset diligence, hedging and other asset management services and receives management fees for providing these services. The Company, through ISG, also provides sub-allocation services with respect to a portion of the assets in the Athene Accounts. Apollo, through its asset management business, managed or advised $247.8 billion, $236.0 billion and $217.6 billion of AUM on behalf of Athene as of March 31, 2023, December 31, 2022 and March 31, 2022, respectively.
Apollo, through ISGI, provides investment advisory services with respect to certain assets in certain portfolio companies of Apollo funds and sub-advises the Athora Accounts and broadly refers to “Athora Sub-Advised” assets as those assets in the
Athora Accounts which the Company explicitly sub-advises as well as those assets in the Athora Accounts which are invested directly in funds and investment vehicles Apollo manages. The Company refers to the portion of the Athora AUM that is not Athora Sub-Advised AUM as “Athora Non-Sub Advised” AUM. See note 17 to the condensed consolidated financial statements for more details regarding the fee arrangements with respect to the assets in the Athora Accounts. Apollo managed or advised $51.1 billion, $52.6 billion and $54.8 billion of AUM on behalf of Athora as of March 31, 2023, December 31, 2022 and March 31, 2022, respectively.
The following tables summarize changes in total AUM for each of Apollo’s three investing strategies within the Asset Management segment:
| Three months ended March 31, | |||||||||||||||||||||||||||||||||||||||||||||||
| 2023 | 2022 | ||||||||||||||||||||||||||||||||||||||||||||||
| Yield | Hybrid | Equity | Total | Yield | Hybrid | Equity | Total | ||||||||||||||||||||||||||||||||||||||||
| (in millions) | |||||||||||||||||||||||||||||||||||||||||||||||
| Change in Total AUM1: | |||||||||||||||||||||||||||||||||||||||||||||||
| Beginning of Period | $ | 392,466 | $ | 56,410 | $ | 98,771 | $ | 547,647 | $ | 360,289 | $ | 52,772 | $ | 84,491 | $ | 497,552 | |||||||||||||||||||||||||||||||
| Inflows | 51,071 | 3,158 | 2,540 | 56,769 | 26,859 | 2,439 | 1,359 | 30,657 | |||||||||||||||||||||||||||||||||||||||
| Outflows2 | (7,465) | (1,026) | (302) | (8,793) | (9,547) | (453) | — | (10,000) | |||||||||||||||||||||||||||||||||||||||
| Net Flows | 43,606 | 2,132 | 2,238 | 47,976 | 17,312 | 1,986 | 1,359 | 20,657 | |||||||||||||||||||||||||||||||||||||||
| Realizations | (1,184) | (659) | (1,486) | (3,329) | (626) | (1,640) | (2,246) | (4,512) | |||||||||||||||||||||||||||||||||||||||
| Market Activity3 | 3,182 | 1,072 | 1,181 | 5,435 | (4,279) | 622 | 2,803 | (854) | |||||||||||||||||||||||||||||||||||||||
| End of Period | $ | 438,070 | $ | 58,955 | $ | 100,704 | $ | 597,729 | $ | 372,696 | $ | 53,740 | $ | 86,407 | $ | 512,843 | |||||||||||||||||||||||||||||||
| 1 At the individual strategy level, inflows include new subscriptions, commitments, capital raised, other increases in available capital, purchases, acquisitions and portfolio company appreciation. Outflows represent redemptions, other decreases in available capital and portfolio company depreciation. Realizations represent fund distributions of realized proceeds. Market activity represents gains (losses), the impact of foreign exchange rate fluctuations and other income. | |||||||||||||||||||||||||||||||||||||||||||||||
| 2 Outflows for Total AUM include redemptions of $2.3 billion and $0.6 billion during the three months ended March 31, 2023 and 2022, respectively. | |||||||||||||||||||||||||||||||||||||||||||||||
| 3 Includes foreign exchange impacts of $1.0 billion and $(2.5) billion during the three months ended March 31, 2023 and 2022, respectively. |
Three Months Ended March 31, 2023
Total AUM was $597.7 billion at March 31, 2023, an increase of $50.1 billion, or 9.1%, compared to $547.6 billion at December 31, 2022. The net increase was primarily driven by Atlas, growth of our retirement services assets, and subscriptions across the platform; partially offset by distributions. More specifically, the net increase was due to:
- Net flows of $48.0 billion primarily attributable to:
*•*a $43.6 billion increase related to funds we manage in our yield strategy primarily consisting of (i) $36.9 billion related to Atlas, (ii) $7.1 billion related to the growth of our retirement services clients, and (iii) $1.8 billion of subscriptions mostly related to the corporate credit funds we manage; partially offsetting these increases were $(2.1) billion of redemptions primarily in the corporate credit funds we manage;
-
a $2.1 billion increase related to funds we manage in our hybrid strategy due to $2.4 billion of fundraising primarily across the financial credit instruments funds we manage; and
-
a $2.2 billion increase related to funds we manage in our equity strategy primarily consisting of $2.5 billion of fundraising primarily related to the traditional private equity funds we manage.
-
Realizations of $(3.3) billion primarily attributable to:
-
$(1.2) billion related to funds we manage in our yield strategy primarily consisting of $0.7 billion related to Athora;
-
$(0.7) billion related to funds we manage in our hybrid strategy primarily consisting of distributions from the hybrid value funds we manage; and
-
$(1.5) billion related to funds we manage in our equity strategy primarily consisting of distributions across the traditional private equity funds we manage.
-
Market activity of $5.4 billion primarily attributable to:
-
$3.2 billion related to funds we manage in our yield strategy primarily consisting of $3.0 billion related to our retirement services clients and $1.0 billion related to the corporate credit funds we manage; offset by ($1.4) billion driven by Athora;
-
$1.1 billion related to funds we manage in our hybrid strategy related to the hybrid credit funds we manage; and
-
$1.2 billion related to funds we manage in our equity strategy related to the traditional private equity funds we manage.
The following tables summarize changes in Fee-Generating AUM for each of Apollo’s three investing strategies within the Asset Management segment:
| Three months ended March 31, | |||||||||||||||||||||||||||||||||||||||||||||||
| 2023 | 2022 | ||||||||||||||||||||||||||||||||||||||||||||||
| Yield | Hybrid | Equity | Total | Yield | Hybrid | Equity | Total | ||||||||||||||||||||||||||||||||||||||||
| (in millions) | |||||||||||||||||||||||||||||||||||||||||||||||
| Change in Fee-Generating AUM1: | |||||||||||||||||||||||||||||||||||||||||||||||
| Beginning of Period | $ | 338,821 | $ | 26,113 | $ | 47,153 | $ | 412,087 | $ | 307,306 | $ | 21,845 | $ | 39,950 | $ | 369,101 | |||||||||||||||||||||||||||||||
| Inflows | 34,774 | 2,289 | 1,762 | 38,825 | 16,453 | 2,510 | 1,309 | 20,272 | |||||||||||||||||||||||||||||||||||||||
| Outflows2 | (8,208) | (261) | (89) | (8,558) | (8,773) | (299) | (70) | (9,142) | |||||||||||||||||||||||||||||||||||||||
| Net Flows | 26,566 | 2,028 | 1,673 | 30,267 | 7,680 | 2,211 | 1,239 | 11,130 | |||||||||||||||||||||||||||||||||||||||
| Realizations | (387) | (156) | (316) | (859) | (309) | (582) | (263) | (1,154) | |||||||||||||||||||||||||||||||||||||||
| Market Activity3 | 3,237 | 496 | (21) | 3,712 | (3,359) | 27 | (26) | (3,358) | |||||||||||||||||||||||||||||||||||||||
| End of Period | $ | 368,237 | $ | 28,481 | $ | 48,489 | $ | 445,207 | $ | 311,318 | $ | 23,501 | $ | 40,900 | $ | 375,719 | |||||||||||||||||||||||||||||||
| 1 At the individual strategy level, inflows include new subscriptions, commitments, capital raised, other increases in available capital, purchases, acquisitions and portfolio company appreciation. Outflows represent redemptions, other decreases in available capital and portfolio company depreciation. Realizations represent fund distributions of realized proceeds. Market activity represents gains (losses), the impact of foreign exchange rate fluctuations and other income. | |||||||||||||||||||||||||||||||||||||||||||||||
| 2 Outflows for Fee-Generating AUM include redemptions of $2.2 billion and $0.4 billion during the three months ended March 31, 2023 and 2022, respectively. | |||||||||||||||||||||||||||||||||||||||||||||||
| 3 Includes foreign exchange impacts of $0.7 billion and $(1.9) billion during the three months ended March 31, 2023 and 2022, respectively. |
Three Months Ended March 31, 2023
Total Fee-Generating AUM was $445.2 billion at March 31, 2023, an increase of $33.1 billion, or 8.0%, compared to $412.1 billion at December 31, 2022. The net increase was primarily driven by Atlas, growth of our retirement services client assets, deployment and fee commencement, and fundraising. More specifically, the net increase was due to:
- Net flows of $30.3 billion primarily attributable to:
*•*a $26.6 billion increase related to funds we manage in our yield strategy primarily consisting of (i) $20.0 billion related to Atlas, (ii) a $7.1 billion increase in AUM related to the growth of our retirement services clients, (ii) $0.9 billion of fee-generating capital deployment primarily related to the corporate credit funds we manage, and (iv) $1.0 billion of subscriptions primarily related to the corporate credit funds we manage; partially offset by $(2.1) billion of redemptions mostly related to the corporate credit funds we manage and $(0.6) billion of net transfers;
*•*a $2.0 billion increase related to funds we manage in our hybrid strategy primarily due to (i) $1.3 billion of fee-generating capital deployment across the hybrid credit and hybrid value funds we manage, (ii) $0.6 billion of transfers from the yield strategy, and (iii) $0.4 billion of subscriptions; and
*•*a $1.7 billion increase related to funds we manage in our equity strategy primarily related to (i) $0.5 billion of fee-generating capital deployment and (ii) $1.3 billion of fundraising.
-
Market Activity of $3.7 billion primarily attributable to funds we manage in our yield strategy, consisting of $3.0 billion related to our retirement services clients, partially offset by ($1.1) billion related to Athora.
-
Realizations of $(0.9) billion across the yield, hybrid and equity strategies.
Gross Capital Deployment and Uncalled Commitments
Gross capital deployment represents the gross capital that has been invested by the funds and accounts we manage during the relevant period, but excludes certain investment activities primarily related to hedging and cash management functions at the Company. Gross Capital Deployment is not reduced or netted down by sales or refinancings, and takes into account leverage used by the funds and accounts we manage in gaining exposure to the various investments that they have made.
Uncalled commitments, by contrast, represent unfunded capital commitments that certain of the funds we manage have received from fund investors to fund future or current fund investments and expenses.
Gross capital deployment and uncalled commitments are indicative of the pace and magnitude of fund capital that is deployed or will be deployed, and which therefore could result in future revenues that include management fees, transaction fees and performance fees to the extent they are fee-generating. Gross capital deployment and uncalled commitments can also give rise to future costs that are related to the hiring of additional resources to manage and account for the additional capital that is deployed or will be deployed. Management uses gross capital deployment and uncalled commitments as key operating metrics since we believe the results are measures of investment activities of the funds we manage.
The following presents gross capital deployment and uncalled commitments (in billions):

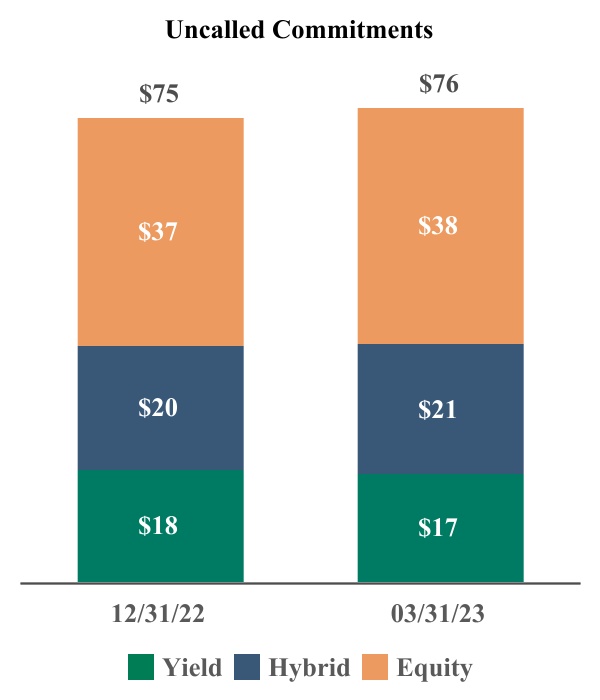
As of March 31, 2023 and December 31, 2022, Apollo had $52 billion and $51 billion of dry powder, respectively, which represents the amount of capital available for investment or reinvestment subject to the provisions of the applicable limited partnership agreements or other governing agreements of the funds, partnerships and accounts we manage. These amounts exclude uncalled commitments which can only be called for fund fees and expenses and commitments from perpetual capital vehicles.
Retirement Services
The following table presents Spread Related Earnings, the performance measure of our Retirement Services segment.
| Three months ended March 31, | Total Change | Percentage Change | |||||||||||||||||||||||||||||||||||||||||||||
| 2023 | 2022 | ||||||||||||||||||||||||||||||||||||||||||||||
| (In millions) | |||||||||||||||||||||||||||||||||||||||||||||||
| Retirement Services: | |||||||||||||||||||||||||||||||||||||||||||||||
| Fixed income and other investment income, net | $ | 1,957 | $ | 1,207 | $ | 750 | 62% | ||||||||||||||||||||||||||||||||||||||||
| Alternative investment income, net | 185 | 448 | (263) | (59) | |||||||||||||||||||||||||||||||||||||||||||
| Net investment earnings | 2,142 | 1,655 | 487 | 29 | |||||||||||||||||||||||||||||||||||||||||||
| Strategic capital management fees | 14 | 12 | 2 | 17 | |||||||||||||||||||||||||||||||||||||||||||
| Cost of funds | (1,235) | (822) | 413 | 50 | |||||||||||||||||||||||||||||||||||||||||||
| Net investment spread | 921 | 845 | 76 | 9 | |||||||||||||||||||||||||||||||||||||||||||
| Other operating expenses | (124) | (109) | 15 | 14 | |||||||||||||||||||||||||||||||||||||||||||
| Interest and other financing costs | (109) | (62) | 47 | 76 | |||||||||||||||||||||||||||||||||||||||||||
| Spread Related Earnings (SRE) | $ | 688 | $ | 674 | $ | 14 | 2 | ||||||||||||||||||||||||||||||||||||||||
In this section, references to 2023 refer to the three months ended March 31, 2023 and references to 2022 refer to the three months ended March 31, 2022.
Three Months Ended March 31, 2023 Compared to Three Months Ended March 31, 2022
Spread Related Earnings
SRE was $688 million in 2023, an increase of $14 million, or 2%, compared to $674 million in 2022. The increase in SRE was driven by higher net investment earnings, largely offset by higher cost of funds and interest and other financing costs. Net investment earnings increased $487 million primarily driven by higher floating rate income, $20.2 billion of growth in Athene’s average net invested assets and higher new money rates, partially offset by less favorable alternative investment performance, primarily related to real estate funds and Challenger Life Company Limited (Challenger), compared to the prior year. Cost of funds increased $413 million primarily driven by higher rates on deferred annuity, funding agreement and pension group annuity issuances as well as an increase in rates on existing floating rate funding agreements and growth in the block of business. Interest and other financing costs increased $47 million due to the increase in issuances of short term repurchase agreements during the quarter, as well as interest expense and preferred stock dividends related to Athene’s debt and preferred stock issuances in the fourth quarter of the prior year.
Net Investment Spread
| Three months ended March 31, | |||||||||||||||||||||||||||||||||||
| 2023 | 2022 | Change | |||||||||||||||||||||||||||||||||
| Fixed income and other net investment earned rate | 4.13 | % | 2.83 | % | 130bps | ||||||||||||||||||||||||||||||
| Alternative net investment earned rate | 6.12 | % | 16.61 | % | NM | ||||||||||||||||||||||||||||||
| Net investment earned rate | 4.25 | % | 3.65 | % | 60bps | ||||||||||||||||||||||||||||||
| Strategic capital management fees | 0.03 | % | 0.03 | % | 0bps | ||||||||||||||||||||||||||||||
| Cost of funds | (2.45) | % | (1.81) | % | 64bps | ||||||||||||||||||||||||||||||
| Net investment spread | 1.83 | % | 1.87 | % | (4)bps |
Net investment spread was 1.83% in 2023, a decrease of 4 basis points compared to 1.87% in 2022, driven by higher cost of funds, partially offset by a higher net investment earned rate.
Net investment earned rate was 4.25% in 2023, an increase of 60 basis points compared to 3.65% in 2022, primarily due to higher returns in Athene’s fixed income portfolio, partially offset by less favorable performance in its alternative investment portfolio. Fixed income and other net investment earned rate was 4.13% in 2023, an increase from 2.83% in 2022, primarily driven by higher floating rate income and higher new money rates. Alternative net investment earned rate was 6.12% in 2023, a
decrease from 16.61% in 2022, primarily driven by lower returns on real estate funds related to lower home price appreciation in comparison to the prior year as well as a decrease in share price on Athene’s investment in Challenger.
Cost of funds was 2.45% in 2023, an increase of 64 basis points compared to 1.81% in 2022, primarily driven by higher rates on deferred annuity, funding agreement and pension group annuity issuances as well as an increase in rates on existing floating rate funding agreements.
Investment Portfolio
Athene had investments, including related parties and VIEs, of $219.4 billion and $212.1 billion as of March 31, 2023 and December 31, 2022, respectively. Athene’s investment strategy seeks to achieve sustainable risk-adjusted returns through the disciplined management of its investment portfolio against its long-duration liabilities, coupled with the diversification of risk. The investment strategies focus primarily on a buy and hold asset allocation strategy that may be adjusted periodically in response to changing market conditions and the nature of Athene’s liability profile. Athene takes advantage of its generally persistent liability profile by identifying investment opportunities with an emphasis on earning incremental yield by taking liquidity and complexity risk rather than assuming incremental credit risk. Athene has selected a diverse array of primarily high-grade fixed income assets, including corporate bonds, structured securities and commercial and residential real estate loans, among others. Athene also maintains holdings in floating rate and less rate-sensitive instruments, including CLOs, non-agency RMBS and various types of structured products. In addition to its fixed income portfolio, Athene opportunistically allocates approximately 5% to 6% of its portfolio to alternative investments where it primarily focuses on fixed income-like, cash flow-based investments.
The following table presents the carrying values of Athene’s total investments, including related parties and VIEs:
| As of March 31, 2023 | As of December 31, 2022 | ||||||||||||||||||||||
| (In millions, except percentages) | Carrying Value | Percent of Total | Carrying Value | Percent of Total | |||||||||||||||||||
| AFS securities, at fair value | |||||||||||||||||||||||
| U.S. government and agencies | $ | 2,703 | 1.2 | % | $ | 2,577 | 1.2 | % | |||||||||||||||
| U.S. state, municipal and political subdivisions | 966 | 0.4 | % | 927 | 0.4 | % | |||||||||||||||||
| Foreign governments | 922 | 0.4 | % | 907 | 0.4 | % | |||||||||||||||||
| Corporate | 63,141 | 28.8 | % | 60,901 | 28.7 | % | |||||||||||||||||
| CLO | 17,566 | 8.0 | % | 16,493 | 7.8 | % | |||||||||||||||||
| ABS | 10,873 | 5.0 | % | 10,527 | 5.0 | % | |||||||||||||||||
| CMBS | 4,190 | 1.9 | % | 4,158 | 2.0 | % | |||||||||||||||||
| RMBS | 6,352 | 2.9 | % | 5,914 | 2.8 | % | |||||||||||||||||
| Total AFS securities, at fair value | 106,713 | 48.6 | % | 102,404 | 48.3 | % | |||||||||||||||||
| Trading securities, at fair value | 1,652 | 0.8 | % | 1,595 | 0.8 | % | |||||||||||||||||
| Equity securities | 1,368 | 0.6 | % | 1,487 | 0.7 | % | |||||||||||||||||
| Mortgage loans, at fair value | 29,949 | 13.6 | % | 27,454 | 12.9 | % | |||||||||||||||||
| Investment funds | 77 | — | % | 79 | — | % | |||||||||||||||||
| Policy loans | 339 | 0.2 | % | 347 | 0.2 | % | |||||||||||||||||
| Funds withheld at interest | 31,084 | 14.2 | % | 32,880 | 15.5 | % | |||||||||||||||||
| Derivative assets | 3,956 | 1.8 | % | 3,309 | 1.6 | % | |||||||||||||||||
| Short-term investments | 627 | 0.3 | % | 2,160 | 1.0 | % | |||||||||||||||||
| Other investments | 701 | 0.3 | % | 773 | 0.4 | % | |||||||||||||||||
| Total investments | 176,466 | 80.4 | % | 172,488 | 81.4 | % | |||||||||||||||||
| Investments in related parties | |||||||||||||||||||||||
| AFS securities, at fair value | |||||||||||||||||||||||
| Corporate | 1,127 | 0.5 | % | 982 | 0.5 | % | |||||||||||||||||
| CLO | 3,513 | 1.6 | % | 3,079 | 1.4 | % | |||||||||||||||||
| ABS | 7,226 | 3.3 | % | 5,760 | 2.7 | % | |||||||||||||||||
| Total AFS securities, at fair value | 11,866 | 5.4 | % | 9,821 | 4.6 | % | |||||||||||||||||
| Trading securities, at fair value | 885 | 0.4 | % | 878 | 0.4 | % | |||||||||||||||||
| Equity securities, at fair value | 251 | 0.1 | % | 279 | 0.1 | % | |||||||||||||||||
| Mortgage loans, at fair value | 1,324 | 0.6 | % | 1,302 | 0.6 | % | |||||||||||||||||
| Investment funds | 1,595 | 0.7 | % | 1,569 | 0.7 | % | |||||||||||||||||
| Funds withheld at interest | 9,462 | 4.3 | % | 9,808 | 4.6 | % |
| As of March 31, 2023 | As of December 31, 2022 | ||||||||||||||||||||||
| (In millions, except percentages) | Carrying Value | Percent of Total | Carrying Value | Percent of Total | |||||||||||||||||||
| Short-term investments | 1,043 | 0.5 | % | — | — | % | |||||||||||||||||
| Other investments | 338 | 0.2 | % | 303 | 0.2 | % | |||||||||||||||||
| Total related party investments | 26,764 | 12.2 | % | 23,960 | 11.2 | % | |||||||||||||||||
| Total investments, including related parties | 203,230 | 92.6 | % | 196,448 | 92.6 | % | |||||||||||||||||
| Investments owned by consolidated VIEs | |||||||||||||||||||||||
| Trading securities, at fair value | 1,069 | 0.5 | % | 1,063 | 0.5 | % | |||||||||||||||||
| Mortgage loans, at fair value | 2,119 | 1.0 | % | 2,055 | 1.0 | % | |||||||||||||||||
| Investment funds, at fair value | 12,880 | 5.9 | % | 12,480 | 5.9 | % | |||||||||||||||||
| Other investments, at fair value | 99 | — | % | 101 | — | % | |||||||||||||||||
| Total investments owned by consolidated VIEs | 16,167 | 7.4 | % | 15,699 | 7.4 | % | |||||||||||||||||
| Total investments, including related parties and VIEs | $ | 219,397 | 100.0 | % | $ | 212,147 | 100.0 | % |
The $7.3 billion increase in Athene’s total investments, including related parties and VIEs, as of March 31, 2023 compared to December 31, 2022 was primarily driven by growth from gross organic inflows of $11.9 billion in excess of gross liability outflows of $6.9 billion, unrealized gains on AFS securities in the three months ended March 31, 2023 of $2.1 billion resulting from the decrease in U.S. Treasury rates and credit spread tightening in the current year and the reinvestment of earnings.
Athene’s investment portfolio consists largely of high quality fixed maturity securities, loans and short-term investments, as well as additional opportunistic holdings in investment funds and other instruments, including equity holdings. Fixed maturity securities and loans include publicly issued corporate bonds, government and other sovereign bonds, privately placed corporate bonds and loans, mortgage loans, CMBS, RMBS, CLOs and ABS. A significant majority of Athene’s AFS portfolio, 96.0% and 95.8% as of March 31, 2023 and December 31, 2022, respectively, was invested in assets considered investment grade with a NAIC designation of 1 or 2.
Athene invests a portion of its investment portfolio in mortgage loans, which are generally comprised of high quality commercial first lien and mezzanine real estate loans. Athene has acquired mortgage loans through acquisitions and reinsurance arrangements, as well as through an active program to invest in new mortgage loans. It invests in CMLs on income producing properties, including hotels, apartments, retail and office buildings, and other commercial and industrial properties. Athene’s RML portfolio primarily consists of first lien RMLs collateralized by properties located in the U.S.
Funds withheld at interest represent a receivable for amounts contractually withheld by ceding companies in accordance with modco and funds withheld reinsurance agreements in which Athene acts as the reinsurer. Generally, assets equal to statutory reserves are withheld and legally owned by the ceding company.
While the substantial majority of Athene’s investment portfolio has been allocated to corporate bonds and structured credit products, a key component of Athene’s investment strategy is the opportunistic acquisition of investment funds with attractive risk and return profiles. Athene’s investment fund portfolio consists of funds that employ various strategies, including equity, hybrid and yield funds. Athene has a strong preference for assets that have some or all of the following characteristics, among others: (1) investments that constitute a direct investment or an investment in a fund with a high degree of co-investment; (2) investments with credit- or debt-like characteristics (for example, a stipulated maturity and par value), or alternatively, investments with reduced volatility when compared to pure equity; or (3) investments that Athene believes have less downside risk.
Athene holds derivatives for economic hedging purposes to reduce its exposure to the cash flow variability of assets and liabilities, equity market risk, interest rate risk, credit risk and foreign exchange risk. Athene’s primary use of derivative instruments relates to providing the income needed to fund the annual indexed credits on its FIA products. Athene primarily uses fixed indexed options to economically hedge indexed annuity products that guarantee the return of principal to the policyholder and credit interest based on a percentage of the gain in a specific market index.
Net Invested Assets
The following summarizes Athene’s net invested assets:
| As of March 31, 2023 | As of December 31, 2022 | ||||||||||||||||||||||
| (In millions, except percentages) | Net Invested Asset Value****1 | Percent of Total | Net Invested Asset Value****1 | Percent of Total | |||||||||||||||||||
| Corporate | $ | 80,701 | 39.0 | % | $ | 80,800 | 41.1 | % | |||||||||||||||
| CLO | 20,563 | 9.9 | % | 19,881 | 10.1 | % | |||||||||||||||||
| Credit | 101,264 | 48.9 | % | 100,681 | 51.2 | % | |||||||||||||||||
| CML | 24,306 | 11.8 | % | 23,750 | 12.1 | % | |||||||||||||||||
| RML | 12,306 | 6.0 | % | 11,147 | 5.7 | % | |||||||||||||||||
| RMBS | 7,550 | 3.7 | % | 7,363 | 3.7 | % | |||||||||||||||||
| CMBS | 4,463 | 2.2 | % | 4,495 | 2.3 | % | |||||||||||||||||
| Real estate | 48,625 | 23.7 | % | 46,755 | 23.8 | % | |||||||||||||||||
| ABS | 21,566 | 10.4 | % | 20,680 | 10.5 | % | |||||||||||||||||
| Alternative investments | 12,103 | 5.9 | % | 12,079 | 6.1 | % | |||||||||||||||||
| State, municipal, political subdivisions and foreign government | 2,703 | 1.3 | % | 2,715 | 1.4 | % | |||||||||||||||||
| Equity securities | 1,708 | 0.8 | % | 1,737 | 0.9 | % | |||||||||||||||||
| Short-term investments | 1,608 | 0.8 | % | 1,930 | 1.0 | % | |||||||||||||||||
| U.S. government and agencies | 2,685 | 1.3 | % | 2,691 | 1.4 | % | |||||||||||||||||
| Other investments | 42,373 | 20.5 | % | 41,832 | 21.3 | % | |||||||||||||||||
| Cash and equivalents | 12,672 | 6.1 | % | 5,481 | 2.8 | % | |||||||||||||||||
| Policy loans and other | 1,815 | 0.8 | % | 1,702 | 0.9 | % | |||||||||||||||||
| Net invested assets | $ | 206,749 | 100.0 | % | $ | 196,451 | 100.0 | % | |||||||||||||||
| 1 See Managing Business Performance - Key Segment and Non-U.S. GAAP Performance Measures for the definition of net invested assets. |
Athene’s net invested assets were $206.7 billion and $196.5 billion as of March 31, 2023 and December 31, 2022, respectively. The increase in net invested assets as of March 31, 2023 from December 31, 2022 was primarily driven by growth from net organic inflows of $11.9 billion in excess of net liability outflows of $5.5 billion, the issuance of $3.0 billion of short-term repurchase agreements during the quarter and reinvestment of earnings.
In managing its business, Athene utilizes net invested assets as presented in the above table. Net invested assets do not correspond to Athene’s total investments, including related parties, on the condensed consolidated statements of financial condition, as discussed previously in Managing Business Performance - Key Segment and Non-U.S. GAAP Performance Measures. Net invested assets represent Athene’s investments that directly back its net reserve liabilities and surplus assets. Athene believes this view of its portfolio provides a view of the assets for which it has economic exposure. Athene adjusts the presentation for funds withheld and modco transactions to include or exclude the underlying investments based upon the contractual transfer of economic exposure to such underlying investments. Athene also adjusts for VIEs to show the net investment in the funds, which are included in the alternative investments line above, as well as adjusting for the allowance for credit losses. Net invested assets includes Athene’s proportionate share of ACRA investments, based on its economic ownership, but excludes the proportionate share of investments associated with the non-controlling interest.
Net invested assets is utilized by management to evaluate Athene’s investment portfolio. Net invested assets is used in the computation of net investment earned rate, which allows Athene to analyze the profitability of its investment portfolio. Net invested assets is also used in Athene’s risk management processes for asset purchases, product design and underwriting, stress scenarios, liquidity, and ALM.
Principal Investing
The following table presents Principal Investing Income, the performance measure of our Principal Investing segment.
| Three months ended March 31, | Total Change | Percentage Change | |||||||||||||||||||||||||||||||||||||||||||||||||||||||||||||||||||||
| 2023 | 2022 | ||||||||||||||||||||||||||||||||||||||||||||||||||||||||||||||||||||||
| (In millions) | |||||||||||||||||||||||||||||||||||||||||||||||||||||||||||||||||||||||
| Principal Investing: | |||||||||||||||||||||||||||||||||||||||||||||||||||||||||||||||||||||||
| Realized performance fees | $ | 164 | $ | 127 | $ | 37 | 29.1% | ||||||||||||||||||||||||||||||||||||||||||||||||||||||||||||||||
| Realized investment income | 28 | 226 | (198) | (87.6) | |||||||||||||||||||||||||||||||||||||||||||||||||||||||||||||||||||
| Principal investing compensation | (170) | (156) | 14 | 9.0 | |||||||||||||||||||||||||||||||||||||||||||||||||||||||||||||||||||
| Other operating expenses | (14) | (10) | 4 | 40.0 | |||||||||||||||||||||||||||||||||||||||||||||||||||||||||||||||||||
| Principal Investing Income (PII) | $ | 8 | $ | 187 | $ | (179) | (95.7) |
As described in “Item 2. Management’s Discussion and Analysis of Financial Condition and Results of Operations—General”, earnings from our Principal Investing segment are inherently more volatile in nature than earnings from our Asset Management segment due to the intrinsic cyclical nature of performance fees, one of the key drivers of PII performance.
In this section, references to 2023 refer to the three months ended March 31, 2023 and references to 2022 refer to the three months ended March 31, 2022.
Three Months Ended March 31, 2023 Compared to Three Months Ended March 31, 2022
PII was $8 million in 2023, a decrease of $179 million, as compared to $187 million in 2022. This decrease was primarily attributable to reduced realized investment income and higher compensation expenses in 2023, offset, in part, by higher realized performance fees. The realized investment income in 2022 was primarily attributable to realized gains on certain investments in the funds Apollo manages that were transferred to Athene and subsequently transferred to AAA in the second quarter of 2022. Realized performance fees in 2023 were driven by realizations in Fund VIII and HVF I, which contributed to higher principal investing compensation costs. In any period, the blended profit sharing percentage is impacted by the respective profit sharing ratios of the funds generating performance allocations in the period. Additionally, included in principal investing compensation are expenses related to the Incentive Pool, a compensation program through which certain employees are allocated discretionary compensation based on realized performance fees in a given year. The Incentive Pool is separate from the fund related profit sharing expense and may result in greater variability in compensation and have a variable impact on the blended profit sharing percentage during a particular period.
The Historical Investment Performance of Our Funds
Below we present information relating to the historical performance of the funds we manage, including certain legacy Apollo funds that do not have a meaningful amount of unrealized investments, and in respect of which the general partner interest has not been contributed to us.
When considering the data presented below, you should note that the historical results of funds we manage are not indicative of the future results that you should expect from such funds, from any future funds we may raise or from your investment in our common stock.
An investment in our common stock is not an investment in any of the Apollo managed funds, and the assets and revenues of the funds we manage are not directly available to us. The historical and potential future returns of the funds we manage are not directly linked to returns on our common stock. Therefore, you should not conclude that continued positive performance of the funds we manage will necessarily result in positive returns on an investment in our common stock. However, poor performance of the funds that we manage would cause a decline in our revenue from such funds, and would therefore have a negative effect on our performance and in all likelihood the value of our common stock.
Moreover, the historical returns of funds we manage should not be considered indicative of the future results you should expect from such funds or from any future funds we may raise. There can be no assurance that any Apollo fund will continue to achieve the same results in the future.
Finally, our private equity IRRs have historically varied greatly from fund to fund. For example, Fund VI generated a 12% gross IRR and a 9% net IRR since its inception through March 31, 2023, while Fund V generated a 61% gross IRR and a 44% net IRR since its inception through March 31, 2023. Accordingly, the IRR going forward for any current or future fund may vary considerably from the historical IRR generated by any particular fund, or for our private equity funds as a whole. Future returns will also be affected by the applicable risks, including risks of the industries and businesses in which a particular fund invests. See “Item 1A. Risk Factors—Risks Relating to Our Asset Management Business—“Historical performance metrics are unreliable indicators of our current or future results of operations” in the 2022 Annual Report.
Investment Record
The following table summarizes the investment record by strategy of Apollo’s significant commitment-based funds that have a defined maturity date in which investors make a commitment to provide capital at the formation of such funds and deliver capital when called as investment opportunities become available.
All amounts are as of March 31, 2023, unless otherwise noted:
| (In millions, except IRR) | Vintage Year | Total AUM | Committed Capital | Total Invested Capital | Realized Value | Remaining Cost | Unrealized Value | Total Value | Gross IRR | Net IRR | |||||||||||||||||||||||||||||||||||||||||||||||||
| Equity: | |||||||||||||||||||||||||||||||||||||||||||||||||||||||||||
| Fund IX | 2018 | $ | 33,959 | $ | 24,729 | $ | 19,508 | $ | 8,199 | $ | 15,113 | $ | 24,774 | $ | 32,973 | 38 | % | 26 | % | ||||||||||||||||||||||||||||||||||||||||
| Fund VIII | 2013 | 9,831 | 18,377 | 16,523 | 21,790 | 5,279 | 6,859 | 28,649 | 15 | 11 | |||||||||||||||||||||||||||||||||||||||||||||||||
| Fund VII | 2008 | 406 | 14,677 | 16,461 | 34,214 | 16 | 67 | 34,281 | 33 | 25 | |||||||||||||||||||||||||||||||||||||||||||||||||
| Fund VI | 2006 | 367 | 10,136 | 12,457 | 21,136 | 405 | — | 21,136 | 12 | 9 | |||||||||||||||||||||||||||||||||||||||||||||||||
| Fund V | 2001 | 62 | 3,742 | 5,192 | 12,724 | 120 | — | 12,724 | 61 | 44 | |||||||||||||||||||||||||||||||||||||||||||||||||
| Fund I, II, III, IV & MIA1 | Various | 10 | 7,320 | 8,753 | 17,400 | — | — | 17,400 | 39 | 26 | |||||||||||||||||||||||||||||||||||||||||||||||||
| Traditional Private Equity Funds2 | $ | 44,635 | $ | 78,981 | $ | 78,894 | $ | 115,463 | $ | 20,933 | $ | 31,700 | $ | 147,163 | 39 | 24 | |||||||||||||||||||||||||||||||||||||||||||
| EPF IV3 | N/A | 2,355 | 2,346 | 490 | 4 | 487 | 522 | 526 | NM4 | NM4 | |||||||||||||||||||||||||||||||||||||||||||||||||
| EPF III | 2017 | 4,320 | 4,462 | 4,815 | 3,430 | 2,248 | 3,133 | 6,563 | 16 | 9 | |||||||||||||||||||||||||||||||||||||||||||||||||
| Total Equity | $ | 51,310 | $ | 85,789 | $ | 84,199 | $ | 118,897 | $ | 23,668 | $ | 35,355 | $ | 154,252 | |||||||||||||||||||||||||||||||||||||||||||||
| Hybrid: | |||||||||||||||||||||||||||||||||||||||||||||||||||||||||||
| AIOF II | 2021 | $ | 2,572 | $ | 2,542 | $ | 1,183 | $ | 299 | $ | 1,043 | $ | 1,174 | $ | 1,473 | 21 | % | 17 | % | ||||||||||||||||||||||||||||||||||||||||
| AIOF I | 2018 | 432 | 897 | 802 | 1,050 | 176 | 213 | 1,263 | 24 | 18 | |||||||||||||||||||||||||||||||||||||||||||||||||
| HVF II | 2022 | 4,582 | 4,592 | 2,322 | 16 | 2,311 | 2,349 | 2,365 | NM4 | NM4 | |||||||||||||||||||||||||||||||||||||||||||||||||
| HVF I | 2019 | 3,613 | 3,238 | 3,594 | 3,368 | 1,556 | 1,881 | 5,249 | 24 | 19 | |||||||||||||||||||||||||||||||||||||||||||||||||
| Accord V5 | 2022 | 1,940 | 1,922 | 1,751 | 802 | 970 | 974 | 1,776 | 4 | 2 | |||||||||||||||||||||||||||||||||||||||||||||||||
| Accord I, II, III, III B & IV5 | Various | — | 6,070 | 4,765 | 5,137 | — | — | 5,137 | 22 | 17 | |||||||||||||||||||||||||||||||||||||||||||||||||
| Accord+ | 2021 | 2,864 | 2,370 | 3,420 | 1,354 | 2,146 | 2,200 | 3,554 | NM4 | NM4 | |||||||||||||||||||||||||||||||||||||||||||||||||
| Total Hybrid | $ | 16,003 | $ | 21,631 | $ | 17,837 | $ | 12,026 | $ | 8,202 | $ | 8,791 | $ | 20,817 | |||||||||||||||||||||||||||||||||||||||||||||
| 1 The general partners and managers of Funds I, II and MIA, as well as the general partner of Fund III, were excluded assets in connection with the reorganization of the Company that occurred in 2007. As a result, Apollo did not receive the economics associated with these entities. The investment performance of these funds, combined with Fund IV, is presented to illustrate fund performance associated with Apollo’s investment professionals. | |||||||||||||||||||||||||||||||||||||||||||||||||||||||||||
| 2 Total IRR is calculated based on total cash flows for all funds presented. | |||||||||||||||||||||||||||||||||||||||||||||||||||||||||||
| 3 Vintage Year is not yet applicable as the fund has not had its final closing. | |||||||||||||||||||||||||||||||||||||||||||||||||||||||||||
| 4 Data has not been presented as the fund’s effective date is less than 24 months prior to the period indicated and such information was deemed not meaningful. | |||||||||||||||||||||||||||||||||||||||||||||||||||||||||||
| 5 Accord funds have investment periods shorter than 24 months, therefore Gross and Net IRR are presented after 12 months of investing. |
Equity
The following table summarizes the investment record for distressed investments made in our traditional private equity fund portfolios since the Company’s inception. All amounts are as of March 31, 2023:
| (In millions, except percentages) | Total Invested Capital | Total Value | Gross IRR | ||||||||||||||
| Distressed for Control | $ | 7,795 | $ | 18,874 | 29 | % | |||||||||||
| Non-Control Distressed | 6,302 | 10,780 | 71 | ||||||||||||||
| Total | 14,097 | 29,654 | 49 | ||||||||||||||
| Corporate Carve-outs, Opportunistic Buyouts and Other Credit1 | 64,797 | 117,509 | 21 | ||||||||||||||
| Total | $ | 78,894 | $ | 147,163 | 39 | % | |||||||||||
| 1 Other Credit is defined as investments in debt securities of issuers other than portfolio companies that are not considered to be distressed. |
The following tables provide additional detail on the composition of the Fund IX, Fund VIII and Fund VII private equity portfolios based on investment strategy. Amounts for Fund I, II, III, IV, V and VI are included in the table above but not presented below as their remaining value is less than $100 million or the fund has been liquidated and such information was deemed not meaningful. All amounts are as of March 31, 2023.
Fund IX1
| (In millions) | Total Invested Capital | Total Value | |||||||||
| Corporate Carve-outs | $ | 4,082 | $ | 9,286 | |||||||
| Opportunistic Buyouts | 14,642 | 21,330 | |||||||||
| Distressed2 | 784 | 2,357 | |||||||||
| Total | $ | 19,508 | $ | 32,973 |
Fund VIII1
| (In millions) | Total Invested Capital | Total Value | |||||||||
| Corporate Carve-outs | $ | 2,704 | $ | 7,025 | |||||||
| Opportunistic Buyouts | 13,252 | 20,870 | |||||||||
| Distressed2 | 567 | 754 | |||||||||
| Total | $ | 16,523 | $ | 28,649 |
Fund VII1
| (In millions) | Total Invested Capital | Total Value | |||||||||
| Corporate Carve-outs | $ | 2,539 | $ | 4,845 | |||||||
| Opportunistic Buyouts | 4,338 | 10,799 | |||||||||
| Distressed/Other Credit2 | 9,584 | 18,637 | |||||||||
| Total | $ | 16,461 | $ | 34,281 | |||||||
1Committed capital less unfunded capital commitments for Fund IX, Fund VIII and Fund VII were $16.9 billion, $17.8 billion and $14.7 billion, respectively, which represents capital commitments from limited partners to invest in such funds less capital that is available for investment or reinvestment subject to the provisions of the applicable governing agreements.
2The distressed investment strategy includes distressed for control, non-control distressed and other credit. Other Credit is defined as investments in debt securities of issuers other than portfolio companies that are not considered to be distressed.
Perpetual Capital
The following table summarizes the investment record for the perpetual capital vehicles we manage, excluding Athene and Athora-related assets:
| Total Returns****1 | |||||||||||||||||||||||||||||||||||||||||||||||
| IPO Year****2 | Total AUM | For the Three Months Ended March 31, 2023 | For the Three Months Ended March 31, 2022 | ||||||||||||||||||||||||||||||||||||||||||||
| (In millions) | |||||||||||||||||||||||||||||||||||||||||||||||
| MidCap Financial3 | N/A | $ | 13,090 | 6 | % | 5 | % | ||||||||||||||||||||||||||||||||||||||||
| AIF | 2013 | 348 | 3 | % | (5) | % | |||||||||||||||||||||||||||||||||||||||||
| AFT | 2011 | 361 | 5 | % | (8) | % | |||||||||||||||||||||||||||||||||||||||||
| MFIC | 2004 | 2,779 | 3 | % | 6 | % | |||||||||||||||||||||||||||||||||||||||||
| ADS4 | N/A | 6,016 | 5 | % | — | % | |||||||||||||||||||||||||||||||||||||||||
| ARI | 2009 | 9,553 | (10) | % | 6 | % | |||||||||||||||||||||||||||||||||||||||||
| ADREF5 | N/A | 7,211 | (1) | % | N/A | ||||||||||||||||||||||||||||||||||||||||||
| ADCF5 | N/A | 905 | 4 | % | N/A | ||||||||||||||||||||||||||||||||||||||||||
| Other6 | N/A | 2,067 | N/A | N/A | |||||||||||||||||||||||||||||||||||||||||||
| Total | $ | 42,330 | |||||||||||||||||||||||||||||||||||||||||||||
| 1 Total returns are based on the change in closing trading prices during the respective periods presented taking into account dividends and distributions, if any, as if they were reinvested without regard to commission. | |||||||||||||||||||||||||||||||||||||||||||||||
| 2 An initial public offering (“IPO”) year represents the year in which the vehicle commenced trading on a national securities exchange. | |||||||||||||||||||||||||||||||||||||||||||||||
| 3 MidCap Financial is not a publicly traded vehicle and therefore IPO year is not applicable. The returns presented are a gross return based on NAV. The net returns based on NAV were 5% and 4% for the three months ended March 31, 2023 and 2022, respectively. | |||||||||||||||||||||||||||||||||||||||||||||||
| 4 ADS is not a publicly traded vehicle and therefore IPO year is not applicable. AUM is as of December 31, 2022. The returns presented are net returns based on NAV. | |||||||||||||||||||||||||||||||||||||||||||||||
| 5 ADREF and ADCF are not publicly traded vehicles and therefore IPO years are not applicable. The returns presented are for their respective Class I shares and are net returns based on NAV. Returns are not presented for the three months ended March 31, 2022 as we did not advise these vehicles prior to the second quarter of 2022. | |||||||||||||||||||||||||||||||||||||||||||||||
| 6 Other includes, among others, AUM of $1.9 billion related to a publicly traded business development company from which Apollo earns investment-related service fees, but for which Apollo does not provide management or advisory services, as of December 31, 2022. Returns and IPO year are not provided for this AUM. |
Summary of Non-U.S. GAAP Measures
The table below sets forth a reconciliation of net income attributable to Apollo Global Management, Inc. common stockholders to Segment Income and Adjusted Net Income:
| Three months ended March 31, | ||||||||||||||||||||||||||||||||
| (In millions) | 2023 | 2022 | ||||||||||||||||||||||||||||||
| GAAP Net Income (Loss) Attributable to Apollo Global Management, Inc. | $ | 1,010 | $ | (401) | ||||||||||||||||||||||||||||
| Net income (loss) attributable to non-controlling interests | 528 | (658) | ||||||||||||||||||||||||||||||
| GAAP Net Income (Loss) | $ | 1,538 | $ | (1,059) | ||||||||||||||||||||||||||||
| Income tax provision (benefit) | 253 | (485) | ||||||||||||||||||||||||||||||
| GAAP Income (Loss) Before Income Tax Provision (Benefit) | $ | 1,791 | $ | (1,544) | ||||||||||||||||||||||||||||
| Asset Management Adjustments: | ||||||||||||||||||||||||||||||||
| Equity-based profit sharing expense and other1 | 67 | 97 | ||||||||||||||||||||||||||||||
| Equity-based compensation | 52 | 56 | ||||||||||||||||||||||||||||||
| Transaction-related charges2 | (3) | (1) | ||||||||||||||||||||||||||||||
| Merger-related transaction and integration costs3 | 7 | 18 | ||||||||||||||||||||||||||||||
| (Gains) losses from change in tax receivable agreement liability | — | 14 | ||||||||||||||||||||||||||||||
| Net (income) loss attributable to non-controlling interests in consolidated entities | (523) | 649 | ||||||||||||||||||||||||||||||
| Unrealized performance fees | (239) | (445) | ||||||||||||||||||||||||||||||
| Unrealized profit sharing expense | 135 | 191 | ||||||||||||||||||||||||||||||
| HoldCo interest and other financing costs4 | 21 | 39 | ||||||||||||||||||||||||||||||
| Unrealized principal investment income (loss) | (10) | 82 | ||||||||||||||||||||||||||||||
| Unrealized net (gains) losses from investment activities and other | 12 | (18) | ||||||||||||||||||||||||||||||
| Retirement Services Adjustments: | ||||||||||||||||||||||||||||||||
| Investment (gains) losses, net of offsets | (397) | 2,636 | ||||||||||||||||||||||||||||||
| Non-operating change in insurance liabilities and related derivatives | 135 | (649) | ||||||||||||||||||||||||||||||
| Integration, restructuring and other non-operating expenses | 29 | 34 | ||||||||||||||||||||||||||||||
| Equity-based compensation expense | 16 | 12 | ||||||||||||||||||||||||||||||
| Segment Income | 1,093 | 1,171 | ||||||||||||||||||||||||||||||
| HoldCo interest and other financing costs4 | (21) | (39) | ||||||||||||||||||||||||||||||
| Taxes and related payables | (227) | (215) | ||||||||||||||||||||||||||||||
| Adjusted Net Income | $ | 845 | $ | 917 | ||||||||||||||||||||||||||||
| 1 Equity-based profit sharing expense and other includes certain profit sharing arrangements in which a portion of performance fees distributed to the general partner are required to be used by employees of Apollo to purchase restricted shares of common stock or is delivered in the form of RSUs, which are granted under the Equity Plan. Equity-based profit sharing expense and other also includes performance grants which are tied to the Company’s receipt of performance fees, within prescribed periods, sufficient to cover the associated equity-based compensation expense. | ||||||||||||||||||||||||||||||||
| 2 Transaction-related charges include contingent consideration, equity-based compensation charges and the amortization of intangible assets and certain other charges associated with acquisitions, and restructuring charges. | ||||||||||||||||||||||||||||||||
| 3 Merger-related transaction and integration costs includes advisory services, technology integration, equity-based compensation charges and other costs associated with the Mergers. | ||||||||||||||||||||||||||||||||
| 4 Represents interest and other financing costs related to AGM not attributable to any specific segment. | ||||||||||||||||||||||||||||||||
The table below sets forth a reconciliation of common stock outstanding to our Adjusted Net Income Shares Outstanding:
| As of March 31, 2023 | As of December 31, 2022 | ||||||||||||||||
| Total GAAP Common Stock Outstanding | 567,394,604 | 570,276,188 | |||||||||||||||
| Non-GAAP Adjustments: | |||||||||||||||||
| Vested RSUs | 12,781,851 | 15,656,775 | |||||||||||||||
| Unvested RSUs Eligible for Dividend Equivalents | 16,301,241 | 12,827,921 | |||||||||||||||
| Adjusted Net Income Shares Outstanding | 596,477,696 | 598,760,884 |
The table below sets forth a reconciliation of Athene’s total investments, including related parties, to net invested assets:
| (In millions) | As of March 31, 2023 | As of December 31, 2022 | |||||||||
| Total investments, including related parties | $ | 203,230 | $ | 196,448 | |||||||
| Derivative assets | (3,956) | (3,309) | |||||||||
| Cash and cash equivalents (including restricted cash) | 14,992 | 8,407 | |||||||||
| Accrued investment income | 1,458 | 1,328 | |||||||||
| Net receivable (payable) for collateral on derivatives | (1,909) | (1,486) | |||||||||
| Reinsurance funds withheld and modified coinsurance | 942 | 1,423 | |||||||||
| VIE and VOE assets, liabilities and noncontrolling interest | 12,799 | 12,747 | |||||||||
| Unrealized (gains) losses | 19,782 | 22,284 | |||||||||
| Ceded policy loans | (175) | (179) | |||||||||
| Net investment receivables (payables) | 39 | 186 | |||||||||
| Allowance for credit losses | 521 | 471 | |||||||||
| Other investments | (50) | (10) | |||||||||
| Total adjustments to arrive at gross invested assets | 44,443 | 41,862 | |||||||||
| Gross invested assets | 247,673 | 238,310 | |||||||||
| ACRA noncontrolling interest | (40,924) | (41,859) | |||||||||
| Net invested assets | $ | 206,749 | $ | 196,451 |
Liquidity and Capital Resources
Overview
The Company primarily derives revenues and cash flows from the assets it manages and the retirement savings products it issues, reinsures and acquires. Based on management’s experience, we believe that the Company’s current liquidity position, together with the cash generated from revenues will be sufficient to meet the Company’s anticipated expenses and other working capital needs for at least the next 12 months. For the longer-term liquidity needs of the asset management business, we expect to continue to fund the asset management business’ operations through management fees and performance fees received. The principal sources of liquidity for the retirement services business, in the ordinary course of business, are operating cash flows and holdings of cash, cash equivalents and other readily marketable assets.
AGM is a holding company whose primary source of cash flow is distributions from its subsidiaries, which are expected to be sufficient to fund cash flow requirements based on current estimates of future obligations. AGM’s primary liquidity needs include the cash-flow requirements relating to its corporate activities, including its day-to-day operations, common stock dividend payments and strategic transactions, such as acquisitions.
At March 31, 2023, the Company had $15.1 billion of unrestricted cash and cash equivalents and $0.4 billion of U.S. Treasury securities, as well as $4.8 billion of available funds from the 2022 AMH credit facility, AHL credit facility, and AHL liquidity facility.
Primary Uses of Cash
Over the next 12 months, we expect the Company’s primary liquidity needs will be to:
-
support the future growth of Apollo’s businesses through strategic corporate investments;
-
pay the Company’s operating expenses, including, compensation, general, administrative, and other expenses;
-
make payments to policyholders for surrenders, withdrawals and payout benefits;
-
make interest and principal payments on funding agreements;
-
make payments to satisfy pension group annuity obligations and policy acquisition costs;
-
pay taxes and tax related payments;
-
pay cash dividends;
-
make payments related to the AOG Unit Payment;
-
repurchase common stock; and
-
make payments under the tax receivable agreement.
Over the long term, we believe we will be able to (i) grow Apollo’s Assets Under Management and generate positive investment performance in the funds we manage, which we expect will allow us to grow the Company’s management fees and performance fees and (ii) grow the investment portfolio of retirement services, in each case in amounts sufficient to cover our long-term liquidity requirements, which may include:
-
supporting the future growth of our businesses;
-
creating new or enhancing existing products and investment platforms;
-
making payments to policyholders;
-
pursuing new strategic corporate investment opportunities;
-
paying interest and principal on the Company’s financing arrangements;
-
repurchasing common stock;
-
making payments under the tax receivable agreement;
-
making payments related to the AOG Unit Payment; and
-
paying cash dividends.
Cash Flow Analysis
The section below discusses in more detail the Company’s primary sources and uses of cash and the primary drivers of cash flows within the Company’s condensed consolidated statements of cash flows:
| For the Three Months Ended March 31, | |||||||||||||||||
| (In millions) | 2023 | 2022 | |||||||||||||||
| Operating Activities | $ | 1,071 | $ | (3,993) | |||||||||||||
| Investing Activities | (5,640) | 3,103 | |||||||||||||||
| Financing Activities | 11,523 | 11,240 | |||||||||||||||
| Effect of exchange rate changes on cash and cash equivalents | 3 | (4) | |||||||||||||||
| Net Increase in Cash and Cash Equivalents, Restricted Cash and Cash Equivalents, and Cash and Cash Equivalents Held at Consolidated Variable Interest Entities | $ | 6,957 | $ | 10,346 |
The assets of our consolidated funds and VIEs, on a gross basis, could have a substantial effect on the accompanying statement of cash flows. Because our consolidated funds and VIEs are generally treated as investment companies for accounting purposes, their investing cash flow amounts are included in our cash flows from operating activities. The table below summarizes our condensed consolidated statements of cash flow by activity attributable to the Company and to our consolidated funds and VIEs.
| For the Three Months Ended March 31, | |||||||||||||||||
| (In millions) | 2023 | 2022 | |||||||||||||||
| Net cash provided by the Company's operating activities | $ | 351 | $ | 1,390 | |||||||||||||
| Net cash provided by (used in) the Consolidated Funds and VIEs operating activities | 720 | (5,383) | |||||||||||||||
| Net cash provided by (used in) operating activities | 1,071 | (3,993) | |||||||||||||||
| Net cash provided by (used in) the Company's investing activities | (5,280) | 2,326 | |||||||||||||||
| Net cash provided by (used in) the Consolidated Funds and VIEs investing activities | (360) | 777 | |||||||||||||||
| Net cash provided by (used in) investing activities | (5,640) | 3,103 | |||||||||||||||
| Net cash provided by the Company's financing activities | 11,563 | 6,240 | |||||||||||||||
| Net cash provided by (used in) the Consolidated Funds and VIEs financing activities | (40) | 5,000 | |||||||||||||||
| Net cash provided by financing activities | $ | 11,523 | $ | 11,240 |
Operating Activities
The Company’s operating activities support its Asset Management, Retirement Services and Principal Investing activities. The primary sources of cash within operating activities include: (a) management fees, (b) advisory and transaction fees, (c) realized performance revenues, (d) realized principal investment income, (e) investment sales from our consolidated funds and VIEs, (f) net investment income, (g) annuity considerations and (h) insurance premiums. The primary uses of cash within operating activities include: (a) compensation and non-compensation related expenses, (b) interest and taxes, (c) investment purchases from our consolidated funds and VIEs, (d) benefit payments and (e) other operating expenses.
-
During the three months ended March 31, 2023, cash provided by operating activities reflects cash inflows of management fees, advisory and transaction fees, realized performance revenues, realized principal investment income and net investment income, partially offset by cash used for pension group annuity withdrawals, net of premiums. Net cash provided by operating activities includes net cash provided by our consolidated funds and VIEs, which primarily includes net proceeds from the sale of VIEs’ investments, offset by purchases of VIEs’ investments.
-
During the three months ended March 31, 2022, cash used in operating activities primarily includes net cash used in our consolidated funds and VIEs for purchases of investments. Net cash provided by operating activities reflects cash inflows of management fees, advisory and transaction fees, realized performance revenues, and realized principal investment income, as well as cash received from pension group annuity transactions.
Investing Activities
The Company’s investing activities support the growth of its business. The primary sources of cash within investing activities include: (a) distributions from investments and (b) sales, maturities and repayments of investments. The primary uses of cash within investing activities include: (a) capital expenditures, (b) purchases and acquisitions of new investments, including purchases of U.S. Treasury securities and (c) equity method investments in the funds we manage.
-
During the three months ended March 31, 2023, cash used in investing activities primarily reflects the purchase of investments due to the deployment of significant cash inflows from Athene’s organic growth, partially offset by the sale, repayment and maturity of investments.
-
During the three months ended March 31, 2022, cash provided by investing activities primarily reflects Athene cash acquired as a result of the Mergers and the sale, repayment and maturity of investments. Net cash provided by investing activities also reflects the investing activities of our consolidated funds and VIEs, which primarily includes net proceeds from maturities of U.S. Treasury securities. Net cash used in investing activities is due to purchases of investments.
Financing Activities
The Company’s financing activities reflect its capital market transactions and transactions with equity holders. The primary sources of cash within financing activities includes: (a) proceeds from debt and preferred equity issuances, (b) inflows on
Athene’s investment-type policies, (c) changes of cash collateral posted for derivative transactions, and (d) capital contributions and proceeds from other borrowing activities. The primary uses of cash within financing activities include: (a) dividends, (b) payments under the tax receivable agreement, (c) share repurchases, (d) cash paid to settle tax withholding obligations in connection with net share settlements of equity-based awards, (e) repayments of debt, (f) withdrawals on Athene’s investment-type policies and (g) changes of cash collateral posted for derivative transactions.
-
During the three months ended March 31, 2023, cash provided by financing activities primarily reflects cash received from the strong organic inflows from retail, flow reinsurance and funding agreements, net of withdrawals, the issuance of short-term repurchase agreements and net capital contributions from non-controlling interests, partially offset by the payment of stock dividends. Cash provided by financing activities of our consolidated funds and VIEs primarily includes proceeds from the issuance of debt, offset by payments for borrowings under repurchase agreements.
-
During the three months ended March 31, 2022, cash provided by financing activities primarily reflects the strong organic inflows from retail and funding agreements, net of withdrawals. Cash provided by financing activities by our consolidated funds and VIEs primarily includes proceeds from the issuance of debt. Net cash used in financing activities includes repurchases of common stock and common stock dividends paid, as well as repayment of debt by our consolidated funds and VIEs.
Contractual Obligations, Commitments and Contingencies
For a summary and a description of the nature of the Company’s commitments, contingencies and contractual obligations, see note 18 to the condensed consolidated financial statements and “—Contractual Obligations, Commitments and Contingencies.” The Company’s commitments are primarily fulfilled through cash flows from operations and financing activities.
Consolidated Funds and VIEs
The Company manages its liquidity needs by evaluating unconsolidated cash flows; however, the Company’s financial statements reflect the financial position of Apollo as well as Apollo’s consolidated funds and VIEs (including SPACs). The primary sources and uses of cash at Apollo’s consolidated funds and VIEs include: (a) raising capital from their investors, which have been reflected historically as non-controlling interests of the consolidated subsidiaries in our financial statements, (b) using capital to make investments, (c) generating cash flows from operations through distributions, interest and the realization of investments, (d) distributing cash flow to investors, (e) issuing debt to finance investments (CLOs) and (f) raising capital through SPAC vehicles for future acquisition of targeted entities.
Dividends and Distributions
For information regarding the quarterly dividends and distributions that were made to common stockholders and non-controlling interest holders in the Apollo Operating Group and participating securities, see note 15 to the condensed consolidated financial statements. Although the Company currently expects to pay dividends, we may not pay dividends if, among other things, we do not have the cash necessary to pay the dividends. To the extent we do not have cash on hand sufficient to pay dividends, we may have to borrow funds to pay dividends, or we may determine not to pay dividends. The declaration, payment and determination of the amount of our dividends are at the sole discretion of our board of directors.
Because AGM is a holding company, the primary source of funds for AGM’s dividends is distributions from its operating subsidiaries, AAM and AHL, which are expected to be adequate to fund AGM’s dividends and other cash flow requirements based on current estimates of future obligations. The ability of these operating subsidiaries to make distributions to AGM will depend on satisfying applicable law with respect to such distributions, including surplus and minimum solvency requirements among others, as well as making prior distributions on the AAM and AHL outstanding preferred stock. Moreover, the ability of AAM and AHL to receive distributions from their own respective subsidiaries will continue to depend on applicable law with respect to such distributions.
On May 9, 2023, AGM declared a cash dividend of $0.43 per share of its common stock, which will be paid on May 31, 2023 to holders of record at the close of business on May 22, 2023.
Repurchase of Securities
Share Repurchase Program
For information regarding the Company’s share repurchase program, see note 15 to the condensed consolidated financial statements.
Repurchase of Other Securities
We may from time to time seek to retire or purchase our other outstanding debt or equity securities through cash purchases and/or exchanges for other securities, purchases in the open market, privately negotiated transactions or otherwise. Any such repurchases will be dependent upon several factors, including our liquidity requirements, contractual restrictions, general market conditions and applicable regulatory, legal and accounting factors. Whether or not we repurchase any of our other securities and the size and timing of any such repurchases will be determined at our discretion.
Asset Management Liquidity
Our asset management business requires limited capital resources to support the working capital or operating needs of the business. For the asset management business’ longer-term liquidity needs, we expect to continue to fund the asset management business’ operations through management fees and performance fees received. Liquidity needs are also met (to a limited extent) through proceeds from borrowings and equity issuances as described in notes 13 and 15 to the condensed consolidated financial statements, respectively. From time to time, if the Company determines that market conditions are favorable after taking into account our liquidity requirements, we may seek to raise proceeds through the issuance of additional debt or equity instruments.
At March 31, 2023, the asset management business had $1.3 billion of unrestricted cash and cash equivalents and $0.4 billion of U.S. Treasury securities as well as $1.0 billion of available funds from the 2022 AMH credit facility. The Company also has a registration statement on Form S-3 to provide it with access to the capital markets, subject to market conditions and other factors.
Future Debt Obligations
The asset management business had long-term debt of $2.8 billion at March 31, 2023, which includes notes with maturities in 2024, 2026, 2029, 2030, 2048 and 2050. See note 13 to the condensed consolidated financial statements for further information regarding the asset management business’ debt arrangements.
Future Cash Flows
Our ability to execute our business strategy, particularly our ability to increase our AUM, depends on our ability to establish new funds and to raise additional investor capital within such funds. Our liquidity will depend on a number of factors, such as our ability to project our financial performance, which is highly dependent on the funds we manage and our ability to manage our projected costs, fund performance, access to credit facilities, compliance with existing credit agreements, as well as industry and market trends. Also during economic downturns the funds we manage might experience cash flow issues or liquidate entirely. In these situations we might be asked to reduce or eliminate the management fee and performance fees we charge, which could adversely impact our cash flow in the future.
An increase in the fair value of the investments of the funds we manage, by contrast, could favorably impact our liquidity through higher management fees where the management fees are calculated based on the net asset value, gross assets or adjusted assets. Additionally, higher performance fees not yet realized would generally result when investments appreciate over their cost basis which would not have an impact on the asset management business’ cash flow until realized.
Consideration of Financing Arrangements
As noted above, in limited circumstances, the asset management business may issue debt or equity to supplement its liquidity. The decision to enter into a particular financing arrangement is made after careful consideration of various factors, including the asset management business’ cash flows from operations, future cash needs, current sources of liquidity, demand for the asset management business’ debt or equity, and prevailing interest rates.
Revolver Facility
Under the 2022 AMH credit facility, AMH may borrow in an aggregate amount not to exceed $1.0 billion and may incur incremental facilities in an aggregate amount not to exceed $250 million plus additional amounts so long as AMH is in compliance with a net leverage ratio not to exceed 4.00 to 1.00. Borrowings under the 2022 AMH credit facility may be used for working capital and general corporate purposes, including without limitation, permitted acquisitions. The 2022 AMH credit facility has a final maturity date of October 12, 2027.
Tax Receivable Agreement
The tax receivable agreement provides for the payment to the Former Managing Partners and Contributing Partners of 85% of the amount of cash savings, if any, in U.S. federal, state, local and foreign income taxes that AGM and its subsidiaries realize subject to the agreement. For more information regarding the tax receivable agreement, see note 17 to the condensed consolidated financial statements.
AOG Unit Payment
On December 31, 2021, holders of AOG Units (other than Athene and Apollo) sold and transferred a portion of such AOG Units to a wholly-owned subsidiary of the Company, in exchange for an amount equal to $3.66 multiplied by the total number of AOG Units held by such holders immediately prior to such transaction (such payment, the “AOG Unit Payment”). The remainder of the AOG Units held by such holders were exchanged for shares of AGM common stock concurrently with the consummation of the Mergers on January 1, 2022.
As of March 31, 2023, the outstanding AOG Unit Payment amount was $307 million, payable in equal quarterly installments through December 31, 2024. See note 17 for more information.
Athora
Athora is a strategic liabilities platform that acquires and reinsures traditional closed life insurance policies and provides capital and reinsurance solutions to insurers in Europe. In 2017, an AAM subsidiary made a €125 million commitment to Athora, which was fully drawn as of April 2020. An AAM subsidiary committed an incremental €58 million in 2020 to purchase new equity interests. Additionally, in 2021, an AAM subsidiary acquired approximately €21.9 million of new equity interests in Athora.
In December 2021, an AAM subsidiary committed an additional €250 million to purchase new equity interests to support Athora’s ongoing growth initiatives, of which €180 million was drawn as of March 31, 2023.
An AAM subsidiary and Athene are minority investors in Athora with a long-term strategic relationship. Through its share ownership, the AAM subsidiary has approximately 19.9% of the total voting power in Athora, and Athene holds shares in Athora representing 10% of the total voting power in Athora. In addition, Athora shares held by funds and other accounts managed by Apollo represent, in the aggregate, approximately 15.1% of the total voting power in Athora.
Fund Escrow
As of March 31, 2023, the remaining investments and escrow cash of Fund VII was valued at 110% of the fund’s unreturned capital which was below the required escrow ratio of 115%. As a result, the fund is required to place in escrow current and future performance fee distributions to the general partner until the specified return ratio of 115% is met (at the time of a future distribution) or upon liquidation. Realized performance fees currently distributed to the general partner are limited to potential tax distributions and interest on escrow balances per the fund’s partnership agreement.
Clawback
Performance fees from certain of the funds we manage are subject to contingent repayment by the general partner in the event of future losses to the extent that the cumulative performance fees distributed from inception to date exceeds the amount computed as due to the general partner at the final distribution. See “—Overview of Results of Operations—Performance Fees” for the maximum performance fees subject to potential reversal by each fund.
Indemnification Liability
The asset management business recorded an indemnification liability in the event that the Former Managing Partners, Contributing Partners and certain investment professionals are required to pay amounts in connection with a general partner obligation to return previously distributed performance fees. See note 17 to the condensed consolidated financial statements for further information regarding the asset management business’ indemnification liability.
Retirement Services Liquidity
There are two forms of liquidity relevant to our retirement services business: funding liquidity and balance sheet liquidity. Funding liquidity relates to the ability to fund operations. Balance sheet liquidity relates to the ability to liquidate or rebalance Athene’s balance sheet without incurring significant costs from fees, bid-offer spreads, or market impact. Athene manages its liquidity position by matching projected cash demands with adequate sources of cash and other liquid assets. The principal sources of liquidity for our retirement services business, in the ordinary course of business, are operating cash flows and holdings of cash, cash equivalents and other readily marketable assets.
Athene’s investment portfolio is structured to ensure a strong liquidity position over time to permit timely payment of policy and contract benefits without requiring asset sales at inopportune times or at depressed prices. In general, liquid assets include cash and cash equivalents, highly rated corporate bonds, unaffiliated preferred stock and public common stock, all of which generally have liquid markets with a large number of buyers. Assets included in modified coinsurance and funds withheld portfolios are available to fund the benefits for the associated obligations but are restricted from other uses. Although the investment portfolio of our retirement services business does contain assets that are generally considered illiquid for liquidity monitoring purposes (primarily mortgage loans, policy loans, real estate, investment funds, and affiliated common stock), there is some ability to raise cash from these assets if needed. Athene has access to additional liquidity through the $1.25 billion AHL credit facility, with potential increases up to $1.75 billion, the AHL liquidity facility with a borrowing capacity of $2.5 billion, with potential increases up to $3.0 billion, and $2.0 billion of committed repurchase facilities. On February 7, 2023, Athene borrowed $1.0 billion from the AHL liquidity facility for short-term cash flow needs, which was repaid in the first quarter of 2023. Both the AHL credit facility and AHL liquidity facility were undrawn as of March 31, 2023. Athene also has a registration statement on Form S-3 to provide it with access to the capital markets, subject to market conditions and other factors. Athene is also the counterparty to repurchase agreements with several different financial institutions, pursuant to which it may obtain short-term liquidity, to the extent available. In addition, through Athene’s membership in the FHLB, it is eligible to borrow under variable rate short-term federal funds arrangements to provide additional liquidity.
Athene proactively manages its liquidity position to meet cash needs while minimizing adverse impacts on investment returns. Athene analyzes its cash-flow liquidity over the upcoming 12 months by modeling potential demands on liquidity under a variety of scenarios, taking into account the provisions of its policies and contracts in force, its cash flow position, and the volume of cash and readily marketable securities in its portfolio.
Liquidity risk is monitored, managed and mitigated through a number of stress tests and analyses to assess Athene’s ability to meet its cash flow requirements, as well as the ability of its reinsurance and insurance subsidiaries to meet their collateral obligations, under various stress scenarios. Athene further seeks to mitigate liquidity risk by maintaining access to alternative, external sources of liquidity.
Insurance Subsidiaries’ Operating Liquidity
The primary cash flow sources for Athene’s insurance subsidiaries include retirement services product inflows (premiums and deposits), investment income, principal repayments on its investments, net transfers from separate accounts and financial product inflows. Uses of cash include investment purchases, payments to policyholders for surrenders, withdrawals and payout benefits, interest and principal payments on funding agreements, payments to satisfy pension group annuity obligations, policy acquisition costs and general operating costs.
Athene’s policyholder obligations are generally long-term in nature. However, policyholders may elect to withdraw some, or all, of their account value in amounts that exceed Athene’s estimates and assumptions over the life of an annuity contract. Athene includes provisions within its annuity policies, such as surrender charges and market value adjustments (“MVA”), which are intended to protect it from early withdrawals. As of March 31, 2023 and December 31, 2022, approximately 78% and 76%, respectively, of Athene’s deferred annuity liabilities were subject to penalty upon surrender. In addition, as of each of March 31, 2023 and December 31, 2022, approximately 60% of policies contained MVAs that may also have the effect of
limiting early withdrawals if interest rates increase, but may encourage early withdrawals by effectively subsidizing a portion of surrender charges when interest rates decrease. As of March 31, 2023, approximately 26% of Athene’s net reserve liabilities were generally non-surrenderable, including funding agreements, buy-out pension group annuities and payout annuities, while 57% were subject to penalty upon surrender.
Membership in Federal Home Loan Bank
Through its membership in the FHLB, Athene is eligible to borrow under variable rate short-term federal funds arrangements to provide additional liquidity. The borrowings must be secured by eligible collateral such as mortgage loans, eligible CMBS or RMBS, government or agency securities and guaranteed loans. As of March 31, 2023 and December 31, 2022, Athene had no outstanding borrowings under these arrangements.
Athene has issued funding agreements to the FHLB. These funding agreements were issued in an investment spread strategy, consistent with other investment spread operations. As of March 31, 2023 and December 31, 2022, Athene had funding agreements outstanding with the FHLB in the aggregate principal amount of $4.9 billion and $3.7 billion, respectively.
The maximum FHLB indebtedness by a member is determined by the amount of collateral pledged and cannot exceed a specified percentage of the member’s total statutory assets dependent on the internal credit rating assigned to the member by the FHLB. As of March 31, 2023, the total maximum borrowing capacity under the FHLB facilities was limited to $55.3 billion. However, Athene’s ability to borrow under the facilities is constrained by the availability of assets that qualify as eligible collateral under the facilities and certain other limitations. Considering these limitations, as of March 31, 2023 Athene had the ability to draw up to an estimated $5.9 billion, inclusive of borrowings then outstanding. This estimate is based on Athene’s internal analysis and assumptions and may not accurately measure collateral which is ultimately acceptable to the FHLB.
Securities Repurchase Agreements
Athene engages in repurchase transactions whereby it sells fixed income securities to third parties, primarily major brokerage firms or commercial banks, with a concurrent agreement to repurchase such securities at a determined future date. Athene requires that, at all times during the term of the repurchase agreements, it maintains sufficient cash or other liquid assets sufficient to allow it to fund substantially all of the repurchase price. Proceeds received from the sale of securities pursuant to these arrangements are generally invested in short-term investments or maintained in cash, with the offsetting obligation to repurchase the security included within payables for collateral on derivatives and securities to repurchase on the condensed consolidated statements of financial condition. As per the terms of the repurchase agreements, Athene monitors the market value of the securities sold and may be required to deliver additional collateral (which may be in the form of cash or additional securities) to the extent that the value of the securities sold decreases prior to the repurchase date.
As of March 31, 2023 and December 31, 2022, the payables for repurchase agreements were $7.8 billion and $4.7 billion, respectively, while the fair value of securities and collateral held by counterparties backing the repurchase agreements was $8.2 billion and $5.0 billion, respectively. As of March 31, 2023, payables for repurchase agreements were comprised of $4.9 billion of short-term and $2.9 billion of long-term repurchase agreements. As of December 31, 2022, payables for repurchase agreements were comprised of $1.9 billion of short-term and $2.9 billion of long-term repurchase agreements.
Dividends from Insurance Subsidiaries
AHL is a holding company whose primary liquidity needs include the cash-flow requirements relating to its corporate activities, including its day-to-day operations, debt servicing, preferred and common stock dividend payments and strategic transactions, such as acquisitions. The primary source of AHL’s cash flow is dividends from its subsidiaries, which are expected to be adequate to fund cash flow requirements based on current estimates of future obligations.
The ability of AHL’s insurance subsidiaries to pay dividends is limited by applicable laws and regulations of the jurisdictions where the subsidiaries are domiciled, as well as agreements entered into with regulators. These laws and regulations require, among other things, the insurance subsidiaries to maintain minimum solvency requirements and limit the amount of dividends these subsidiaries can pay.
Subject to these limitations and prior notification to the appropriate regulatory agency, Athene’s U.S. insurance subsidiaries are permitted to pay ordinary dividends based on calculations specified under insurance laws of the relevant state of domicile. Any distributions above the amount permitted by statute in any twelve month period are considered to be extraordinary dividends,
and require the approval of the appropriate regulator prior to payment. AHL does not currently plan on having the U.S. subsidiaries pay any dividends to their parents.
Dividends from AHL’s subsidiaries are projected to be the primary source of AHL’s liquidity. Under the Bermuda Insurance Act, each of Athene’s Bermuda insurance subsidiaries is prohibited from paying a dividend in an amount exceeding 25% of the prior year’s statutory capital and surplus, unless at least two members of the board of directors of the Bermuda insurance subsidiary and its principal representative in Bermuda sign and submit to the Bermuda Monetary Authority (“BMA”) an affidavit attesting that a dividend in excess of this amount would not cause the Bermuda insurance subsidiary to fail to meet its relevant margins. In certain instances, the Bermuda insurance subsidiary would also be required to provide prior notice to the BMA in advance of the payment of dividends. In the event that such an affidavit is submitted to the BMA in accordance with the Bermuda Insurance Act, and further subject to the Bermuda insurance subsidiary meeting its relevant margins, the Bermuda insurance subsidiary is permitted to distribute up to the sum of 100% of statutory surplus and an amount less than 15% of its total statutory capital. Distributions in excess of this amount require the approval of the BMA.
The maximum distribution permitted by law or contract is not necessarily indicative of the insurance subsidiaries’ actual ability to pay such distributions, which may be further restricted by business and other considerations, such as the impact of such distributions on surplus, which could affect Athene’s ratings or competitive position and the amount of premiums that can be written. Specifically, the level of capital needed to maintain desired financial strength ratings from rating agencies, including S&P, A.M. Best, Fitch and Moody’s, is of particular concern when determining the amount of capital available for distributions. AHL believes its insurance subsidiaries have sufficient statutory capital and surplus, combined with additional capital available to be provided by AHL, to meet their financial strength ratings objectives. Finally, state insurance laws and regulations require that the statutory surplus of Athene’s insurance subsidiaries following any dividend or distribution must be reasonable in relation to their outstanding liabilities and adequate for the insurance subsidiaries’ financial needs.
Other Sources of Funding
Athene may seek to secure additional funding at the AHL level by means other than dividends from subsidiaries, such as by drawing on the undrawn $1.25 billion AHL credit facility, drawing on the undrawn $2.5 billion AHL liquidity facility or by pursuing future issuances of debt or preference shares to third-party investors. The AHL credit facility contains various standard covenants with which Athene must comply, including maintaining a Consolidated Debt to Capitalization Ratio (as such term is defined in the AHL credit facility) of not greater than 35% at the end of any quarter, maintaining a minimum Consolidated Net Worth (as such term is defined in the AHL credit facility) of no less than $7.3 billion, and restrictions on the ability to incur debt and liens, in each case with certain exceptions. The AHL liquidity facility also contains various standard covenants with which Athene must comply, including maintaining an ALRe minimum Consolidated Net Worth (as such term is defined in the AHL liquidity facility) of no less than $9.3 billion and restrictions on the ability to incur debt and liens, in each case with certain exceptions.
Future Debt Obligations
Athene had long-term debt of $3.7 billion as of March 31, 2023, which includes notes with maturities in 2028, 2030, 2031, 2033, 2051, and 2052. See note 13 to the condensed consolidated financial statements for further information regarding Athene’s debt arrangements.
Capital
Athene believes it has a strong capital position and that it is well positioned to meet policyholder and other obligations. Athene measures capital sufficiency using an internal capital model which reflects management’s view on the various risks inherent to its business, the amount of capital required to support its core operating strategies and the amount of capital necessary to maintain its current ratings in a recessionary environment. The amount of capital required to support Athene’s core operating strategies is determined based upon internal modeling and analysis of economic risk, as well as inputs from rating agency capital models and consideration of both NAIC RBC and Bermuda capital requirements. Capital in excess of this required amount is considered excess equity capital, which is available to deploy. As of December 31, 2022, Athene’s U.S. RBC ratio was 387%, its Bermuda RBC ratio was 407% and its consolidated RBC ratio was 416%. The formulas for determining the amount of RBC specify various weighting factors that are applied to financial balances or various levels of activity based on the perceived degree of risk.
ACRA
ACRA 1 provides Athene with access to on-demand capital to support its growth strategies and capital deployment opportunities. ACRA 1 provides a capital source to fund both Athene’s inorganic and organic channels, including pension group annuity, funding agreement and retail channels. This strategic capital solution allows Athene the flexibility to simultaneously deploy capital across multiple accretive avenues, while maintaining a strong financial position.
Athene Co-Invest Reinsurance Affiliate Holding 2 Ltd. (together with its subsidiaries, ACRA 2) was established in December 2022 as another long-duration, on-demand capital vehicle. Athene currently owns 100% of ACRA 2’s economic and voting interests prior to the initial closing of ACRA 2, which is expected to occur on July 1, 2023.
Critical Accounting Estimates and Policies
Other than as described in this Item 2, there have been no material changes to the Company’s critical accounting estimates and policies from those previously disclosed in the 2022 Annual Report. The following updates and supplements the critical accounting estimates and policies in the 2022 Annual Report.
Future Policy Benefits
The future policy benefit liabilities associated with long duration contracts include term and whole-life products, accident and health, disability, and deferred and immediate annuities with life contingencies, which include pension group annuities with life contingencies. Liabilities for nonparticipating long duration contracts are established as the estimated present value of benefits Athene expects to pay to or on behalf of the policyholder and related expenses less the present value of the net premiums to be collected, referred to as the net premium ratio. For immediate annuities with life contingencies, the liability for future policy benefits is equal to the present value of future benefits and related expenses.
Liabilities for nonparticipating long-duration contracts are established using accepted actuarial valuation methods which require the use of assumptions related to discount rate, expenses and policyholder behavior. Athene bases certain key assumptions related to policyholder behavior on industry standard data, adjusted to align with company experience, if needed. All cash flow assumptions, apart from expense assumptions, are established at contract issuance and reviewed annually, or more frequently, if actual experience suggests a revision is necessary.
Immediate annuities with life contingencies, which include pension group annuities with life contingencies, represent the significant majority of Athene’s liabilities for future policy benefits. Significant assumptions include discount rates, assumptions for policyholder longevity and policyholder utilization for contracts with deferred lives. In general, the reserve for future policy benefits will decrease when longevity decreases, resulting in remeasurement gains in the condensed consolidated statements of operations. Changes in the discount rate in periods after a cohort has closed will not impact interest expense recognition within the condensed consolidated statements of operations. However, changes in the discount rate will impact the recorded reserve on the condensed consolidated statements of financial condition, with an offsetting unrealized gain or loss recorded to other comprehensive income (loss). Athene uses a single A rate to calculate the present value of reserves related to its immediate annuities with life contingencies.
For these limited-payment contracts where premiums are due over a significantly shorter period than the period over which benefits are provided, a deferred profit liability is established to the extent that gross premium exceeds the net premium reserve and included within future policy benefits. When the net premium ratio for the corresponding future policy benefit is updated for actual experience and changes to projected cash flow assumptions, both the future policy benefit reserve and deferred profit liability are retrospectively recalculated from the contract issuance date. Also included within the liability for future policy benefits is negative VOBA that was established for blocks of insurance contracts acquired through the Mergers. Negative VOBA related to immediate annuities with life contingencies is subsequently measured on a basis generally consistent with the deferred profit liability.
The increase (decrease) to future policy benefit reserves from hypothetical changes in discount rates is summarized as follows:
| (In millions) | March 31, 2023 | ||||
| +100 bps discount rate | $ | (2,667) | |||
| –100 bps discount rate | 3,106 |
Market Risk Benefits
Market risk benefits represent contracts or contract features that both provide protection to the contract holder from, and exposes the insurance entity to, other-than-nominal capital market risk. Athene issues and reinsures deferred annuity contracts, which includes both traditional deferred and indexed annuities, that contain GLWB and GMDB riders. These riders meet the criteria for and are classified as market risk benefits.
Market risk benefits are measured at fair value at the contract level and may be recorded as a liability or an asset. At contract inception, Athene assesses the fees and assessments that are collectible from the policyholder, which include explicit rider fees and other contract fees, and allocates them to the extent they are attributable to the market risk benefit. These attributed fees are used in the valuation of the market risk benefits and are never negative or exceed total explicit fees collectible from the policyholder. Athene is also required to project the expected benefits that will be required for the riders in excess of the projected account balance. Determining the projected benefits in excess of the projected account balance requires judgment for economic and actuarial assumptions, both of which are used in determining future policyholder account growth that will drive the amount of benefits required.
Economic assumptions include interest rates and implied equity volatilities throughout the duration of the liability. For riders on indexed annuities, this also includes assumptions about projected equity returns, which impact expected index credits on the next policy anniversary date and future equity option costs. When economic assumptions lead to an increase in expected future policy growth from higher interest and index crediting during the accumulation period, the higher projected account balance at the time of rider utilization decreases the inherent value of the rider as less payments for benefits are required in excess of the account balance. All else constant, the increase in the projected account balance will, therefore, result in a decrease to the market risk benefit liability or an increase if the market risk benefit is in an asset position with remeasurement gains recorded in the condensed consolidated statements of operations.
Policyholder behavior assumptions are established using accepted actuarial valuation methods to estimate decrements to policies with riders including lapses, full and partial withdrawals (surrender rate) and mortality and the utilization of the benefit riders. Base lapse rates consider the level of surrender charges and are dynamically adjusted based on the level of current interest rates relative to the guaranteed rates and the amount by which any rider guarantees are in a net positive position. Rider utilization assumptions consider the number and timing of policyholders electing the riders. Athene tracks and updates this assumption as experience emerges. Mortality assumptions are set at the product level and are generally based on standard industry tables with adjustments for historical experience and a provision for mortality improvement. While economic assumptions impact the projected account value and the benefits paid in excess of the account value, policyholder behavior assumptions, such as surrenders, impact the expected number of policies that will elect to utilize the rider. An expected increase in decrements and decrease in rider utilization, all else constant, will result in a decrease to the market risk benefit liability or an increase in the market risk benefit asset with remeasurement gains recorded in the condensed consolidated statements of operations.
All inputs, including expected fees and assessments and economic and policyholder behavior assumptions, are used to project excess benefits and fees over a range of risk-neutral, stochastic interest rate scenarios. For riders on indexed annuities, stochastic equity return scenarios are also included within the range. The discount rate used to present value the projected cash flows is a significant assumption, with the change in risk free rates expected to drive most of the movement in discount rates between periods. A risk margin is deducted from the discount rate to reflect the uncertainty in the projected cash flows, such as variations in policyholder behavior, and a credit spread is added to reflect Athene’s risk of nonperformance. If the discount rates used were to fluctuate, there would be a resulting change in reserves for the market risk benefits recorded through the condensed consolidated statements of operations, except for the portion related to the change in nonperformance risk, which is recorded through other comprehensive income (loss).
The increase (decrease) to the net market risk benefit balance from hypothetical changes in the discount rate is summarized as follows:
| (In millions) | March 31, 2023 | ||||
| +100 bps discount rate | $ | (718) | |||
| –100 bps discount rate | 890 |
Deferred Acquisition Costs, Deferred Sales Inducements, and Value of Business Acquired
DAC, DSI and VOBA are no longer considered critical accounting estimates as a result of the adoption of LDTI as of January 1, 2023.
Recent Accounting Pronouncements
A list of recent accounting pronouncements that are relevant to Apollo and its industries is included in note 2 to our condensed consolidated financial statements.
Contractual Obligations, Commitments and Contingencies
Fixed and determinable payments due in connection with the Company’s material contractual obligations are as follows as of March 31, 2023:
| 2023 | 2024 - 2025 | 2026 - 2027 | 2028 and Thereafter | Total | |||||||||||||||||||||||||
| (In millions) | |||||||||||||||||||||||||||||
| Asset Management | |||||||||||||||||||||||||||||
| Operating lease obligations1 | $ | 51 | $ | 153 | $ | 149 | $ | 547 | $ | 900 | |||||||||||||||||||
| Other long-term obligations2 | 12 | 1 | — | — | 13 | ||||||||||||||||||||||||
| 2022 AMH credit facility3 | 1 | 2 | 1 | — | 4 | ||||||||||||||||||||||||
| Debt obligations3 | 90 | 740 | 662 | 2,498 | 3,990 | ||||||||||||||||||||||||
| AOG Unit payment 4 | 132 | 175 | — | — | 307 | ||||||||||||||||||||||||
| 286 | 1,071 | 812 | 3,045 | 5,214 | |||||||||||||||||||||||||
| Retirement Services | |||||||||||||||||||||||||||||
| Interest sensitive contract liabilities | 15,102 | 39,863 | 35,625 | 90,510 | 181,100 | ||||||||||||||||||||||||
| Future policy benefits | 1,606 | 4,301 | 4,302 | 32,281 | 42,490 | ||||||||||||||||||||||||
| Market risk benefits | — | — | — | 5,721 | 5,721 | ||||||||||||||||||||||||
| Other policy claims and benefits | 124 | — | — | — | 124 | ||||||||||||||||||||||||
| Dividends payable to policyholders | 3 | 10 | 9 | 75 | 97 | ||||||||||||||||||||||||
| Debt3 | 110 | 306 | 306 | 4,592 | 5,314 | ||||||||||||||||||||||||
| Securities to repurchase5 | 5,086 | 1,385 | 1,935 | — | 8,406 | ||||||||||||||||||||||||
| 22,031 | 45,865 | 42,177 | 133,179 | 243,252 | |||||||||||||||||||||||||
| Obligations | $ | 22,317 | $ | 46,936 | $ | 42,989 | $ | 136,224 | $ | 248,466 | |||||||||||||||||||
| 1 Operating lease obligations excludes $225 million of other operating expenses associated with operating leases. | |||||||||||||||||||||||||||||
| 2 Includes (i) payments on management service agreements related to certain assets and (ii) payments with respect to certain consulting agreements entered into by the Company. Note that a significant portion of these costs are reimbursable by funds. | |||||||||||||||||||||||||||||
| 3 The obligations for debt payments include contractual maturities of principal and estimated future interest payments based on the terms of the debt agreements. See note 13 of the condensed consolidated financial statements for further discussion of these debt obligations. | |||||||||||||||||||||||||||||
| 4 On December 31, 2021, each holder of AOG Units (other than those held by the Company and Athene) sold a portion of their limited partnership interests to the Company in exchange for the AOG Unit Payment. See note 17 to the condensed consolidated financial statements for more information. | |||||||||||||||||||||||||||||
| 5 The obligations for securities for repurchase payments include contractual maturities of principal and estimated future interest payments based on the terms of the agreements. Future interest payments on floating rate repurchase agreements were calculated using the March 31, 2023 interest rate. |
Note: Due to the fact that the timing of certain amounts to be paid cannot be determined or for other reasons discussed below, the following contractual commitments have not been presented in the table above.
(i)As noted previously, the tax receivable agreement requires us to pay to our Former Managing Partners and Contributing Partners 85% of any tax savings received by AGM and its subsidiaries from our step-up in tax basis. The tax savings achieved may not ensure that we have sufficient cash available to pay this liability and we might be required to incur additional debt to satisfy this liability.
(ii)Debt amounts related to the consolidated VIEs are not presented in the table above as the Company is not a guarantor of these non-recourse liabilities.
(iii)In connection with the Stone Tower acquisition, Apollo agreed to pay the former owners of Stone Tower a specified percentage of any future performance fees earned from certain of the Stone Tower funds, CLOs and strategic investment accounts. In connection with the acquisition of Griffin Capital’s U.S. asset management business on May 3, 2022, Apollo agreed to pay the former owners certain share-based consideration contingent on specified AUM and capital raising thresholds. These contingent consideration liabilities are remeasured to fair value at each reporting period until the obligations are satisfied. See note 18 to the condensed consolidated financial statements for further information regarding the contingent consideration liabilities.
(iv)Commitments from certain of our subsidiaries to contribute to the funds we manage and certain related parties.
Atlas Securitized Products Holdings LP
On February 8, 2023, the Company and CS undertook the first close of their previously announced transaction whereby certain subsidiaries of Atlas acquired certain assets of the CS Securitized Products Group (the “Transaction”). Under the terms of the Transaction, Atlas has agreed to pay CS $3.3 billion, $0.4 billion of which is deferred until February 8, 2026, and $2.9 billion of which is deferred until February 8, 2028. This deferred purchase price is an obligation first of Atlas, second of AAA, third of AAM, fourth of AHL and fifth of AARe. Each of AARe and AAM has issued an assurance letter to CS for the full deferred purchase obligation amount of $3.3 billion. In exchange for the purchase price, Atlas expects to receive, by the Transaction’s final close, approximately $0.4 billion in cash and a portfolio of senior secured warehouse assets, subject to debt, with approximately $1 billion of tangible equity value (to the extent that the warehouse assets received by Atlas constitute less than $1 billion of tangible equity value, the amount of cash is expected to increase by an offsetting amount). These warehouse assets are senior secured assets at industry standard loan-to-value ratios, structured to investment grade-equivalent criteria, and were approved by Atlas in connection with this Transaction. In addition, Atlas has received an investment management contract to manage certain unrelated assets on behalf of CS, providing for quarterly payments expected to total approximately $1.1 billion net to Atlas over 5 years. Finally, Atlas shall also benefit generally from the net spread earned on its assets in excess of its cost of financing. As a result, the fair value of the liability related to the Company’s assurance letter is not material to the condensed consolidated financial statements.
Previous: Item 1A. UNAUDITED SUPPLEMENTAL PRESENTATION OF STATEMENTS OF FINANCIAL CONDITION · Next: Item 3. QUANTITATIVE AND QUALITATIVE DISCLOSURES ABOUT MARKET RISK