 filings.tools
Aptiv 10-K 2018-12-31
Filed 2019-02-04. 21 sections, 683K characters. Original on sec.gov · Markdown · JSON
Cover and table of contents
10-K 1 aptv1231201810k.htm 10-K
UNITED STATES
SECURITIES AND EXCHANGE COMMISSION
Washington, D.C. 20549
FORM 10-K
| x | ANNUAL REPORT PURSUANT TO SECTION 13 OR 15(d) OF THE SECURITIES EXCHANGE ACT OF 1934 |
For the fiscal year ended December 31, 2018
OR
| ¨ | TRANSITION REPORT PURSUANT TO SECTION 13 OR 15(d) OF THE SECURITIES EXCHANGE ACT OF 1934 |
For the transition period from to .
Commission file number: 001-35346
APTIV PLC
(Exact name of registrant as specified in its charter)
| Jersey | 98-1029562 | |
| (State or other jurisdiction of | (I.R.S. Employer | |
| incorporation or organization) | Identification No.) |
5 Hanover Quay
Grand Canal Dock
Dublin 2, Ireland
(Address of principal executive offices)
353-1-259-7013
(Registrant’s telephone number, including area code)
Securities registered pursuant to Section 12(b) of the Act:
| Title of each class | Name of each exchange on which registered | |
| Ordinary Shares. $0.01 par value per share | New York Stock Exchange |
Securities registered pursuant to Section 12(g) of the Act: None
Indicate by check mark if the registrant is a well-known seasoned issuer, as defined in Rule 405 of the Securities Act. Yes x. No ¨.
Indicate by check mark if the registrant is not required to file reports pursuant to Section 13 or Section 15(d) of the Act. Yes ¨. No x.
Indicate by check mark whether the registrant (1) has filed all reports required to be filed by Section 13 or 15(d) of the Securities Exchange Act of 1934 during the preceding 12 months (or for such shorter period that the registrant was required to file such reports), and (2) has been subject to such filing requirements for the past 90 days. Yes x. No ¨.
Indicate by check mark whether the registrant has submitted electronically every Interactive Data File required to be submitted pursuant to Rule 405 of Regulation S-T (§232.405 of this chapter) during the preceding 12 months (or for such shorter period that the registrant was required to submit such files). Yes x. No ¨.
Indicate by check mark if disclosure of delinquent filers pursuant to Item 405 of Regulation S-K (§229.405 of this chapter) is not contained herein, and will not be contained, to the best of registrant’s knowledge, in definitive proxy or information statements incorporated by reference in Part III of this Form 10-K or any amendment to this Form 10-K. x.
Indicate by check mark whether the registrant is a large accelerated filer, an accelerated filer, a non-accelerated filer, a smaller reporting company, or an emerging growth company. See the definitions of “large accelerated filer,” “accelerated filer,” “smaller reporting company,” and “emerging growth company” in Rule 12b-2 of the Exchange Act.
| Large accelerated filer x. | Accelerated filer ¨. |
| Non-accelerated filer ¨. | Smaller reporting company ¨. |
| Emerging growth company ¨. |
If an emerging growth company, indicate by the check mark if the registrant has elected not to use the extended transition period for complying with any new or revised financial accounting standards provided pursuant to Section 13(a) of the Exchange Act. ¨.
Indicate by check mark whether the registrant is a shell company (as defined in Rule 12b-2 of the Exchange Act). Yes ¨. No x.
The aggregate market value of the ordinary shares held by non-affiliates of the registrant as of June 30, 2018, the last business day of the registrant’s most recently completed second fiscal quarter, was $24,136,537,262 (based on the closing sale price of the registrant’s ordinary shares on that date as reported on the New York Stock Exchange).
The number of the registrant’s ordinary shares outstanding, $0.01 par value per share as of January 25, 2019, was 260,034,563.
DOCUMENTS INCORPORATED BY REFERENCE
Portions of the registrant’s definitive Proxy Statement related to the 2019 Annual Shareholders Meeting to be filed subsequently are incorporated by reference into Part III of this Form 10-K.
APTIV PLC
INDEX
CAUTIONARY STATEMENT REGARDING FORWARD-LOOKING INFORMATION
This Annual Report on Form 10-K, including the exhibits being filed as part of this report, as well as other statements made by Aptiv PLC (“Aptiv,” the “Company,” “we,” “us” and “our”), contain forward-looking statements that reflect, when made, the Company’s current views with respect to current events and financial performance. Such forward-looking statements are subject to many risks, uncertainties and factors relating to the Company’s operations and business environment, which may cause the actual results of the Company to be materially different from any future results, express or implied, by such forward-looking statements. All statements that address future operating, financial or business performance or the Company’s strategies or expectations are forward-looking statements. In some cases, you can identify these statements by forward-looking words such as “may,” “might,” “will,” “should,” “expects,” “plans,” “intends,” “anticipates,” “believes,” “estimates,” “predicts,” “projects,” “potential,” “outlook” or “continue,” and other comparable terminology. Factors that could cause actual results to differ materially from these forward-looking statements include, but are not limited to, the following: global and regional economic conditions, including conditions affecting the credit market and resulting from the United Kingdom referendum in which voters approved an exit from the European Union, commonly referred to as “Brexit,” scheduled to become effective on March 29, 2019; fluctuations in interest rates and foreign currency exchange rates; the cyclical nature of global automotive sales and production; the potential disruptions in the supply of and changes in the competitive environment for raw material integral to the Company’s products; the Company’s ability to maintain contracts that are critical to its operations; potential changes to beneficial free trade laws and regulations such as the North American Free Trade Agreement and its anticipated successor agreement, the United States-Mexico-Canada Agreement which is still subject to approval; the ability of the Company to integrate and realize the benefits of recent acquisitions; the ability of the Company to attract, motivate and/or retain key executives; the ability of the Company to avoid or continue to operate during a strike, or partial work stoppage or slow down by any of its unionized employees or those of its principal customers; and the ability of the Company to attract and retain customers. Additional factors are discussed under the captions “Risk Factors” and “Management’s Discussion and Analysis of Financial Condition and Results of Operations” in the Company’s filings with the Securities and Exchange Commission. New risks and uncertainties arise from time to time, and it is impossible for us to predict these events or how they may affect the Company. It should be remembered that the price of the ordinary shares and any income from them can go down as well as up. Aptiv disclaims any intention or obligation to update or revise any forward-looking statements, whether as a result of new information, future events and/or otherwise, except as may be required by law.
PART I
Item 1. BUSINESS
“Aptiv,” the “Company,” “we,” “us” and “our” refer to Aptiv PLC, a public limited company formed under the laws of Jersey on May 19, 2011 as Delphi Automotive PLC, which, through its subsidiaries, acquired certain assets of the former Delphi Corporation (now known as DPH Holdings Corp. (“DPHH”)) and completed an initial public offering on November 22, 2011. On December 4, 2017 (the “Distribution Date”), the Company completed the separation (the “Separation”) of its former Powertrain Systems segment by distributing to Aptiv shareholders on a pro rata basis all of the issued and outstanding ordinary shares of Delphi Technologies PLC (“Delphi Technologies”), a public limited company formed to hold the spun-off business. To effect the Separation, the Company distributed to its shareholders one ordinary share of Delphi Technologies for every three Aptiv ordinary shares outstanding as of November 22, 2017, the record date for the distribution. Following the Separation, the remaining company changed its name to Aptiv PLC and New York Stock Exchange (“NYSE”) symbol to “APTV.”
The completion of the Separation positioned Aptiv as a leading global technology and mobility company primarily serving the automotive sector. We design and manufacture vehicle components and provide electrical, electronic and active safety technology solutions to the global automotive and commercial vehicle markets, creating the software and hardware foundation for vehicle features and functionality. We enable and deliver end-to-end smart mobility solutions, active safety and autonomous driving technologies and provide enhanced user experience and connected services. Our Advanced Safety and User Experience segment is focused on providing the necessary software and advanced computing platforms, and our Signal and Power Solutions segment is focused on providing the requisite networking architecture required to support the integrated systems in today’s complex vehicles. Together, our businesses develop the ‘brain’ and the ‘nervous system’ of increasingly complex vehicles, providing integration of the vehicle into its operating environment.
We are one of the largest vehicle component manufacturers, and our customers include all 25 of the largest automotive original equipment manufacturers (“OEMs”) in the world. We operate 126 major manufacturing facilities and 15 major technical centers utilizing a regional service model that enables us to efficiently and effectively serve our global customers from best cost countries. We have a presence in 44 countries and have approximately 18,600 scientists, engineers and technicians focused on developing market relevant product solutions for our customers.
We are focused on growing and improving the profitability of our businesses, and have implemented a strategy designed to position the Company to deliver industry-leading long-term shareholder returns. This strategy includes disciplined investing in our business to grow and enhance our product offerings, strategically focusing our portfolio in high-technology, high-growth spaces in order to meet consumer preferences and leveraging an industry-leading cost structure to expand our operating margins. In line with the long-term growth in emerging markets, we have been increasing our focus on these markets, particularly in China, where we have a major manufacturing base and strong customer relationships.
Website Access to Company’s Reports
Aptiv’s website address is aptiv.com. Our Annual Reports on Form 10-K, Quarterly Reports on Form 10-Q, Current Reports on Form 8-K and amendments to those reports filed or furnished pursuant to Section 13(a) or 15(d) of the Securities Exchange Act of 1934 (the “Exchange Act”) are available free of charge through our website as soon as reasonably practicable after they are electronically filed with, or furnished to, the Securities and Exchange Commission (“SEC”). Our reports filed prior to December 4, 2017 were under the name of Delphi Automotive PLC.
Our Company
We believe the automotive industry is being shaped by rapidly increasing consumer demand for new mobility solutions, advanced technologies and vehicle connectivity, as well as increasing government regulation related to vehicle safety, fuel efficiency and emissions control. These industry mega-trends, which we refer to as “Safe,” “Green” and “Connected,” are driving higher growth in products that address these trends than growth in the automotive industry overall. We have organized our business into two diversified segments, which enable us to develop technology solutions and manufacture highly-engineered products that enable our customers to respond to these mega-trends:
| • | Signal and Power Solutions—This segment provides complete design, manufacture and assembly of the vehicle’s electrical architecture, including engineered component products, connectors, wiring assemblies and harnesses, cable management, electrical centers and hybrid high voltage and safety distribution systems. Our products provide the critical signal distribution and computing power backbone that supports increased vehicle content and electrification, reduced emissions and higher fuel economy. |
| • | Advanced Safety and User Experience—This segment provides critical components, systems and advanced software development for passenger safety, security, comfort and vehicle operation, including body controls, infotainment and |
connectivity systems, active and passive safety electronics, autonomous driving software and technologies and systems integration. Our products increase vehicle connectivity, reduce driver distraction and enhance vehicle safety.
We previously reported the results of our former Powertrain Systems and Thermal Systems businesses as segments. The Powertrain Systems segment provided gasoline and diesel engine management systems including fuel handling, fuel injection, combustion, electronic controls, test and validation capabilities, electric and hybrid electric vehicle power electronics and aftermarket components. As described above, we completed the spin-off of the Powertrain Systems segment into a new, independent public company named Delphi Technologies PLC on December 4, 2017.
The Thermal Systems business provided powertrain cooling and heating, ventilating and air conditioning (“HVAC”) systems, such as compressors, systems and controls, and heat exchangers for vehicle markets. As part of our strategy to focus on a high-growth product portfolio, we completed the sale of the wholly owned Thermal Systems business to MAHLE GmbH on June 30, 2015.
The assets and liabilities, operating results and operating and investing cash flows for the previously reported Powertrain Systems and Thermal Systems segments are presented as discontinued operations separate from the Company’s continuing operations for all periods presented, as further described in Note 25. Discontinued Operations to the audited consolidated financial statements herein. Our description and discussion of financial amounts within this Item 1. Business reflect the results of continuing operations, unless otherwise noted.
Refer to Results of Operations by Segment in Item 7. Management’s Discussion and Analysis and Note 23. Segment Reporting to the audited consolidated financial statements, included in Item 8. Financial Statements and Supplementary Data, of this Annual Report for financial information about our business segments.
Our business is diversified across end-markets, regions, customers, vehicle platforms and products. Our customer base includes all 25 of the largest automotive OEMs in the world, and in 2018, 27% of our net sales came from the Asia Pacific region, which we have identified as a key market likely to experience substantial long-term growth. Our ten largest platforms in 2018 were with eight different OEMs. In addition, in 2018 our products were found in 19 of the 20 top-selling vehicle models in the United States (“U.S.”), in 18 of the 20 top-selling vehicle models in Europe and in 14 of the 20 top-selling vehicle models in China. We have also entered into collaborative arrangements with mobility providers and with smart cities such as Boston and Singapore as we develop solutions for the evolving nature of the mobility industry.
We have established a worldwide design and manufacturing footprint with a regional service model that enables us to efficiently and effectively serve our global customers from best cost countries. This regional model is structured primarily to service the North American market from Mexico, the South American market from Brazil, the European market from Eastern Europe and North Africa, and the Asia Pacific market from China. Our global scale and regional service model enables us to engineer globally and execute regionally to serve the largest OEMs, which are seeking suppliers that can serve them on a worldwide basis. Our footprint also enables us to adapt to the regional design variations the global OEMs require and serve the emerging market OEMs.
Our Industry
The automotive technology and components industry provides components, systems, subsystems and modules to OEMs for the manufacture of new vehicles, as well as to the aftermarket for use as replacement parts for current production and older vehicles. Overall, we expect long-term growth of global vehicle sales and production in the OEM market. In 2018, the industry experienced decreased global customer sales and production schedules. While North American vehicle production in 2018 remained flat as compared to the reduced volumes experienced in the region in 2017, increased market volatility and economic uncertainty has resulted in decreases in vehicle production of 1% in Europe and 4% in China as compared to 2017. Vehicle production in South America, our smallest region, increased 4% in 2018, which follows an increase of 21% in the region in 2017. Demand for automotive components in the OEM market is generally a function of the number of new vehicles produced in response to consumer demand, which is primarily driven by macro-economic factors such as credit availability, interest rates, fuel prices, consumer confidence, employment and other trends. Although OEM demand is tied to actual vehicle production, participants in the automotive technology and components industry also have the opportunity to grow through increasing product content per vehicle by further penetrating business with existing customers and in existing markets, gaining new customers and increasing their presence in global markets. We believe that evolving entrants into the global transportation industry such as mobility providers and smart cities will provide additional markets for our advanced technologies. We believe that as a company with a global presence and advanced technology, engineering, manufacturing and customer support capabilities, we are well-positioned to benefit from these opportunities.
We believe that continuously increasing societal demands have created the three “mega-trends” that serve as the basis for the next wave of market-driven automotive technology advancement. We aim to continue developing leading edge technology focused on addressing these mega-trends, and apply that technology toward products with sustainable margins that enable our customers, both OEMs and others, to produce distinctive market-leading products. We have identified a core portfolio of
products that draw on our technical strengths and align with these mega-trends where we believe we can provide differentiation to our customers.
Safe. The first mega-trend, “Safe,” represents technologies aimed not just at protecting vehicle occupants when a crash occurs, but those that actually proactively reduce the risk of a crash occurring. OEMs continue to focus on improving occupant and pedestrian safety in order to meet increasingly stringent regulatory requirements in various markets, such as a notice issued by the U.S. National Highway Traffic Safety Administration which updated its five-star rating system to include automatic emergency braking systems as a recommended safety technology, beginning with model year 2018. As a result, suppliers are focused on developing technologies aimed at protecting vehicle occupants when a crash occurs, as well as advanced driver assistance systems that reduce driver distractions and automated safety features that proactively mitigate the risk of a crash occurring. Examples of new and alternative technologies that incorporate sophisticated detection and advanced software for collision avoidance include lane departure warning systems, adaptive cruise control, gesture control and automatic braking.
Green. The second mega-trend, “Green,” represents technologies designed to help reduce emissions, increase fuel economy and minimize the environmental impact of vehicles. Green is a key mega-trend today because of the convergence of several issues: climate change, volatility in oil prices, an increasing number of vehicles in use worldwide and recent and pending regulation in the U.S. and overseas regarding fuel economy and greenhouse gas emissions. OEMs continue to focus on improving fuel efficiency and reducing emissions in order to meet increasingly stringent regulatory requirements in various markets. On a worldwide basis, the relevant authorities in the European Union, the U.S., China, India, Japan, Brazil, South Korea and Argentina have already instituted regulations requiring further reductions in emissions and/or increased fuel economy through 2018. In many cases, other authorities have initiated legislation or regulation that would further tighten the standards through 2020 and beyond. Based on the current regulatory environment, we believe that OEMs, including those in the U.S. and China, will be subject to requirements for even greater reductions in carbon dioxide (“CO2”) emissions over the next ten years. These standards will require meaningful innovation as OEMs and suppliers are forced to find ways to improve engine management, electrical power consumption, vehicle weight and integration of alternative technologies (e.g., electric/hybrid propulsion). As a result, suppliers are developing innovations that result in significant improvements in fuel economy, emissions and performance from gasoline and diesel internal combustion engines, and permit engine downsizing without loss of performance. At the same time, suppliers are also developing and marketing new and alternative technologies that support hybrid vehicles, electric vehicles and fuel cell products to improve fuel economy and emissions. We are developing key enabling technologies in the areas of vehicle charging and vehicle power distribution and control that are essential to the introduction of our customers’ electrified vehicle platforms. We are also enabling the trend towards vehicle electrification with high voltage electrification solutions that reduce CO2 emissions and increase fuel economy, making the world greener.
Connected. The third mega-trend, “Connected,” represents technologies designed to seamlessly integrate today’s highly complex vehicles into the electronic operating environment, and provide drivers with connectivity to the global information network. The technology content of vehicles continues to increase as consumers demand greater safety, personalization, infotainment, productivity and convenience while driving, which in turn leads to increasing demand for electrical architecture as a foundation for this content. Also with increased smart device usage in vehicles, driver distractions can be dramatically increased, which in turn results in greater risk of accidents. We are pioneering vehicle-to-vehicle (V2V) and vehicle-to-infrastructure (V2I) communication technologies which enable vehicles to detect and signal danger, reducing vehicle collisions and improving driver safety, while also maintaining connectivity to an increasing number of devices inside and outside of vehicles. We also utilize advanced connectivity solutions such as over-the-air (OTA) technology that enable vehicles to receive software updates remotely and collect market-relevant data from connected vehicles.
We expect these mega-trends to continue to create growth and opportunity for us. We believe we are well-positioned to provide solutions and products to OEMs to expand the electronic and technological content of their vehicles. We also believe electronics integration, which generally refers to products and systems that combine integrated circuits, software algorithms, sensor technologies and mechanical components within the vehicle will allow OEMs to achieve substantial reductions in weight and mechanical complexity, resulting in easier assembly, enhanced fuel economy, improved emissions control and better vehicle performance.
Convergence of Safe, Green and Connected Solutions in New Mobility and Autonomous Driving
The combination of advanced technologies being developed within these mega-trends is also contributing to increasing industry development of autonomous driving technologies, leading to a fully automated driving experience. We expect automated driving technologies will provide strong societal benefit as well as the opportunity for long-term growth for our product offerings in this space, including new potential customers such as mobility providers and smart cities that require solutions to increasing urban mobility challenges. Societal benefits of increased vehicle automation include enhanced safety
(resulting from collision avoidance and improved vehicle control), environmental improvements (a reduction in CO2 emissions resulting from optimized driving behavior), labor cost savings and improved productivity (as a result of alternate uses for drive time). Growth opportunities in this space result from increased content, additional computing power and software requirements, enhanced connectivity systems and increased electrification and interconnects. We believe the complexity of these systems will also require ongoing software support services, as these vehicle systems will be continuously upgraded with new features and performance enhancements.
We are continuing to invest in the automated driving space, and have continued to develop market-leading automated driving platform solutions such as automated driving software, key active safety sensing technologies and our Multi-Domain Controller, which fuses information from sensing systems as well as mapping and navigation data to make driving decisions. We believe we are well-aligned with industry technology trends that will result in sustainable future growth in this space, and have partnered with other leaders in the field to advance the pace of development and commercialization of these technologies. We have entered into a collaborative arrangement with Mobileye N.V. to develop the Centralized Sensing Localization and Planning (“CSLP”) system, a complete turn-key fully autonomous driving platform for our OEM customers and mobility partners, with the goal of being application ready in 2019 and production ready in the 2021 to 2022 time frame. We also entered into a collaborative arrangement with Intel Corporation and the BMW Group to develop and deploy automated driving technology. Additionally, in 2017 we acquired nuTonomy, Inc. in order to further accelerate our commercialization of automated driving solutions. The acquisition of nuTonomy is the latest in a series of investments we have made to expand our position in the new mobility space, including the previous acquisitions of automated driving software developer Ottomatika and data service companies Control-Tec and Movimento.
We believe the increasing societal demand for mobility on demand (“MoD”) services will accelerate the development of autonomous driving technologies, strongly benefiting the MoD space. In 2018, we announced a partnership with Lyft, Inc. (“Lyft”) by launching a fleet of autonomous vehicles in Las Vegas which operate on Aptiv’s fully-integrated autonomous driving platform and are available to the public on the Lyft network. This partnership leverages our connected services capabilities and Lyft’s ride-hailing experience to provide valuable insights on self-driving fleet operations and management. In addition, we have entered into agreements with the Singapore Land Transport Authority and with the city of Boston to develop fully-autonomous vehicles and associated infrastructure as part of automated MoD pilots. As a result of our substantial investments and strategic partnerships, we believe we are well-aligned with industry technology trends that will result in sustainable future growth in these evolving areas.
To guide our product strategies and investments in technology with a focus on developing advanced technologies to drive growth within the Safe, Green and Connected mega-trends, we utilize and benefit from our Technology Advisory Council, a panel of prominent global technology thought leaders.
Standardization of Sourcing by OEMs
Many OEMs are adopting global vehicle platforms to increase standardization, reduce per unit cost and increase capital efficiency and profitability. As a result, OEMs are selecting suppliers that have the capability to manufacture products on a worldwide basis as well as the flexibility to adapt to regional variations. Suppliers with global scale and strong design, engineering and manufacturing capabilities, are best positioned to benefit from this trend. OEMs are also increasingly looking to their suppliers to simplify vehicle design and assembly processes to reduce costs. As a result, suppliers that sell vehicle components directly to manufacturers (Tier I suppliers) have assumed many of the design, engineering, research and development and assembly functions traditionally performed by vehicle manufacturers. Suppliers that can provide fully-engineered solutions, systems and pre-assembled combinations of component parts are positioned to leverage the trend toward system sourcing.
Shorter Product Development Cycles
As a result of government regulations and customer preferences, OEMs are requiring suppliers to respond faster with new designs and product innovations. While these trends are more prevalent in mature markets, the emerging markets are advancing rapidly towards the regulatory standards and consumer preferences of the more mature markets. Suppliers with strong technologies, robust global engineering and development capabilities will be best positioned to meet OEM demands for rapid innovation.
Products
Our organizational structure and management reporting support the management of these core product lines:
Signal and Power Solutions. This segment provides complete design, manufacture and assembly of the vehicle’s electrical architecture, including connectors, wiring assemblies and harnesses, cable management, electrical centers and hybrid high voltage and safety distribution systems. Our products provide the critical signal distribution and computing power backbone that supports increased vehicle content and electrification, reduced emissions and higher fuel economy.
| • | High quality connectors are engineered primarily for use in the automotive and related markets, but also have applications in the aerospace, military and telematics sectors. |
| • | Electrical centers provide centralized electrical power and signal distribution and all of the associated circuit protection and switching devices, thereby optimizing the overall vehicle electrical system. |
| • | Distribution systems, including hybrid high voltage systems, are integrated into one optimized vehicle electrical system that can utilize smaller cable and gauge sizes and ultra-thin wall insulation (which product line makes up approximately 44%, 47% and 50% of our total revenue for the years ended December 31, 2018, 2017 and 2016, respectively). |
Advanced Safety and User Experience. This segment provides critical components, systems and advanced software development for passenger safety, security, comfort and vehicle operation, including body controls, infotainment and connectivity systems, active and passive safety electronics and autonomous driving technologies. Our products increase vehicle connectivity, reduce driver distraction and enhance vehicle safety.
| • | Electronic controls products primarily consist of body computers and security systems. |
| • | The infotainment and driver interface portfolio primarily consists of receivers, digital receivers, satellite audio receivers and navigation systems. |
| • | Active and passive safety electronics and advanced driver assistance systems primarily include occupant detection systems, collision warning systems and collision sensing, as well as vision, radar, Light Detection and Ranging (“LIDAR”) and other sensing technologies and multi-domain controllers that enable active safety features such as adaptive cruise control, lane departure warning and auto braking. |
Competition
Although the overall number of our top competitors has decreased due to ongoing industry consolidation, the automotive technology and components industry remains extremely competitive. Furthermore, the rapidly evolving nature of the markets in which we compete has attracted, and may continue to attract, new entrants, particularly in best cost countries such as China and in areas of evolving vehicle technologies such as automated driving and mobility solutions, which has attracted competitors from outside the traditional automotive industry. OEMs rigorously evaluate suppliers on the basis of product quality, price, reliability and timeliness of delivery, product design capability, technical expertise and development capability, new product innovation, financial viability, application of lean principles, operational flexibility, customer service and overall management. In addition, our customers generally require that we demonstrate improved efficiencies, through cost reductions and/or price improvement, on a year-over-year basis.
Our competitors in each of our operating segments are as follows:
| Segment | Competitors |
| Signal and Power Solutions | • Draexlmaier Automotive |
| • Lear Corporation | |
| • Leoni AG | |
| • Molex Inc. (a subsidiary of Koch Industries, Inc.) | |
| • Sumitomo Corporation | |
| • TE Connectivity, Ltd. | |
| • Yazaki Corporation | |
| Advanced Safety and User Experience | • Alpine Electronics |
| • Bosch Group | |
| • Continental AG | |
| • Denso Corporation | |
| • Hyundai Mobis | |
| • Magna International | |
| • Panasonic Corporation | |
| • Harman International (a subsidiary of Samsung Electronics) | |
| • Valeo | |
| • Veoneer, Inc. | |
| • Visteon Corporation | |
| • ZF Friedrichshafen AG |
Customers
We sell our products and services to the major global OEMs in every region of the world. The following table provides the percentage of net sales to our largest customers for the year ended December 31, 2018:
| Customer | Percentage of Net Sales |
| GM | 11% |
| Volkswagen Group (“VW”) | 9% |
| Fiat Chrysler Automobiles N.V. (“FCA”) | 9% |
| Ford Motor Company (“Ford”) | 7% |
| SAIC General Motors Corporation Limited | 5% |
| PSA Peugeot Citroën (“PSA”) | 5% |
| Geely Automobile Holdings Limited | 4% |
| Daimler AG (“Daimler”) | 4% |
| Toyota Motor Corporation | 3% |
| Renault-Nissan | 2% |
Supply Relationships with Our Customers
We typically supply products to our OEM customers through purchase orders, which are generally governed by general terms and conditions established by each OEM. Although the terms and conditions vary from customer to customer, they typically contemplate a relationship under which our customers place orders for their requirements of specific components supplied for particular vehicles but are not required to purchase any minimum amount of products from us. These relationships typically extend over the life of the related vehicle. Prices are negotiated with respect to each business award, which may be subject to adjustments under certain circumstances, such as commodity or foreign exchange escalation/de-escalation clauses or for cost reductions achieved by us. The terms and conditions typically provide that we are subject to a warranty on the products supplied; in most cases, the duration of such warranty is coterminous with the warranty offered by the OEM to the end-user of the vehicle. We may also be obligated to share in all or a part of recall costs if the OEM recalls its vehicles for defects attributable to our products.
Individual purchase orders are terminable for cause or non-performance and, in most cases, upon our insolvency and certain change of control events. In addition, many of our OEM customers have the option to terminate for convenience on certain programs, which permits our customers to impose pressure on pricing during the life of the vehicle program, and issue purchase contracts for less than the duration of the vehicle program, which potentially reduces our profit margins and increases the risk of our losing future sales under those purchase contracts. Additionally, our largest customer, GM, expressly reserves a right to terminate for competitiveness on certain of our long-term supply contracts. We manufacture and ship based on customer release schedules, normally provided on a weekly basis, which can vary due to cyclical automobile production or dealer inventory levels.
Although customer programs typically extend to future periods, and although there is an expectation that we will supply certain levels of OEM production during such future periods, customer agreements including applicable terms and conditions do not necessarily constitute firm orders. Firm orders are generally limited to specific and authorized customer purchase order releases placed with our manufacturing and distribution centers for actual production and order fulfillment. Firm orders are typically fulfilled as promptly as possible from the conversion of available raw materials, sub-components and work-in-process inventory for OEM orders and from current on-hand finished goods inventory for aftermarket orders. The dollar amount of such purchase order releases on hand and not processed at any point in time is not believed to be significant based upon the time frame involved.
Materials
We procure our raw materials from a variety of suppliers around the world. Generally, we seek to obtain materials in the region in which our products are manufactured in order to minimize transportation and other costs. The most significant raw materials we use to manufacture our products include copper and resins. As of December 31, 2018, we have not experienced any significant shortages of raw materials and normally do not carry inventories of such raw materials in excess of those reasonably required to meet our production and shipping schedules.
Commodity cost volatility, most notably related to copper, petroleum-based resin products and fuel, is a challenge for us and our industry. We are continually seeking to manage these and other material-related cost pressures using a combination of strategies, including working with our suppliers to mitigate costs, seeking alternative product designs and material
specifications, combining our purchase requirements with our customers and/or suppliers, changing suppliers, hedging of certain commodities and other means. In the case of copper, which primarily affects our Signal and Power Solutions segment, contract clauses have enabled us to pass on some of the price increases to our customers and thereby partially offset the impact of increased commodity costs on operating income for the related products. However, other than in the case of copper, our overall success in passing commodity cost increases on to our customers has been limited. We will continue our efforts to pass market-driven commodity cost increases to our customers in an effort to mitigate all or some of the adverse earnings impacts, including by seeking to renegotiate terms as contracts with our customers expire.
Seasonality
Our business is moderately seasonal, as our primary North American customers historically reduce production during the month of July and halt operations for approximately one week in December. Our European customers generally reduce production during the months of July and August and for one week in December. Shut-down periods in the rest of the world generally vary by country. In addition, automotive production is traditionally reduced in the months of July, August and September due to the launch of component production for new vehicle models. Accordingly, our results reflect this seasonality.
Employees
As of December 31, 2018, we employed approximately 143,000 people; 25,000 salaried employees and 118,000 hourly employees. In addition, we maintain an alternative workforce of 19,000 contract and temporary workers. Certain of our employees are represented worldwide by numerous unions and works councils, including the International Union of Electronic, Electrical, Salaried, Machine and Furniture Workers - Communications Workers of America (“IUE-CWA”) and the Confederacion De Trabajadores Mexicanos. In the U.S., certain of our employees are represented by only the IUE-CWA, with which we have competitive wage and benefit packages.
Environmental Compliance
We are subject to the requirements of U.S. federal, state and local, and non-U.S., environmental and safety and health laws and regulations. These include laws regulating air emissions, water discharge, hazardous materials and waste management. We have an environmental management structure designed to facilitate and support our compliance with these requirements globally. Although it is our intent to comply with all such requirements and regulations, we cannot provide assurance that we are at all times in compliance. Environmental requirements are complex, change frequently and have tended to become more stringent over time. Accordingly, we cannot ensure that environmental requirements will not change or become more stringent over time or that our eventual environmental costs and liabilities will not be material.
Certain environmental laws assess liability on current or previous owners or operators of real property for the cost of removal or remediation of hazardous substances. In addition to clean-up actions brought by U.S. federal, state, local and non-U.S. agencies, plaintiffs could raise personal injury or other private claims due to the presence of hazardous substances on or from a property. At this time, we are involved in various stages of investigation and cleanup related to environmental remediation matters at certain of our present and former facilities. In addition, there may be soil or groundwater contamination at several of our properties resulting from historical, ongoing or nearby activities.
At December 31, 2018, 2017 and 2016, the undiscounted reserve for environmental investigation and remediation was approximately $4 million, $4 million and $5 million, respectively. We cannot ensure that our eventual environmental remediation costs and liabilities will not exceed the amount of our current reserves. In the event that such liabilities were to significantly exceed the amounts recorded, our results of operations could be materially affected.
SUPPLEMENTARY ITEM. EXECUTIVE OFFICERS OF THE REGISTRANT
The name, age (as of February 1, 2019), current positions and description of business experience of each of our executive officers are listed below. Our executive officers are elected annually by the Board of Directors and hold office until their successors are elected and qualified or until the officer’s resignation or removal. Positions noted below reflect current service to Aptiv PLC and prior service to Delphi Automotive PLC and Delphi Automotive LLP. Other than Mr. Massaro, Mr. De Vos, Mr. Paja and Ms. Trickett, each officer listed below as a senior vice president was a vice president until February 2012.
Kevin P. Clark, 56, is president and chief executive officer (CEO) of Aptiv and is a member of the company’s board of directors. Mr. Clark was named president and CEO and became a member of the board in March 2015. Previously, Mr. Clark was chief operating officer (COO) from October 2014 to March 2015. Prior to the COO position, Mr. Clark was chief financial officer and executive vice president from February 2013. He was appointed vice president and chief financial officer in July 2010. Previously, Mr. Clark was a founding partner of Liberty Lane Partners, LLC, a private-equity investment firm focused on building and improving middle-market companies. Prior to Liberty Lane Partners, Mr. Clark served as the chief financial officer of Fisher-Scientific International Inc., a manufacturer, distributor and service provider to the global healthcare market. Mr. Clark served as Fisher-Scientific’s chief financial officer from the company’s initial public offering in 2001 through the completion of its merger with Thermo Electron Corporation in 2006. Prior to becoming chief financial officer, Mr. Clark served as Fisher-Scientific’s corporate controller and treasurer.
Joseph R. Massaro, 49, is senior vice president and chief financial officer of Aptiv, a position he has held since March 2016. Mr. Massaro joined the Company in October 2013 as vice president, Internal Audit, and in September 2014 was appointed to the position of vice president, Corporate Controller. Previously, Mr. Massaro was a managing director at Liberty Lane Partners from 2008 to 2010. He also served as chief financial officer of inVentiv Health Inc. from 2010 to 2013, a Liberty Lane portfolio company. Prior to Liberty Lane, he served in a variety of finance and operational roles at Thermo Fisher Scientific from 2002 to 2007, including senior vice president of Global Business Services where his responsibilities included the global sourcing and information technology functions. Prior to the merger with Thermo Electron, he also served as vice president and corporate controller of Fisher Scientific and held several other senior finance positions.
Majdi Abulaban, 55, is senior vice president of Aptiv and president of Aptiv Signal and Power Solutions, effective February 2012 and president of Aptiv’s Engineered Components Group, effective February 2017. He also continues to serve as president of Aptiv Asia Pacific. Mr. Abulaban was most recently president of the Connection Systems product business unit for Signal and Power Solutions. Mr. Abulaban was appointed managing director for the former Packard Electric Systems’ Asia Pacific operations and became chairman of the board for Delphi Packard Electric Systems Co., Ltd, (China) in July 2002. He previously held a variety of assignments, including business line executive for cockpits at the former Safety & Interior division and director of Asia Pacific Operations for Thermal Systems.
Allan J. Brazier, 52, is vice president and chief accounting officer of Aptiv, a position he has held since February 2011. Mr. Brazier joined the Company in June 2005 as senior manager of technical accounting and reporting, and most recently served as assistant controller of technical accounting and reporting. Prior to joining Aptiv, Mr. Brazier was employed for seventeen years in financial roles of increasing responsibility at various companies. Mr. Brazier is a Certified Public Accountant and began his career with the international public accounting firm of KPMG.
Glen De Vos, 58, is senior vice president and chief technology officer of Aptiv, effective March 2017, and has responsibility for Aptiv’s innovation and global technologies. In November 2017, he was also named president of Aptiv’s Mobility and Services Group. Mr. De Vos was most recently vice president of Software and Services for Aptiv’s Advanced Safety and User Experience segment, located at the Company’s Silicon Valley Lab in Mountain View, California from 2016 to 2017. He began his Aptiv career with Advanced Safety and User Experience in 1992, and following several progressive engineering and managerial roles in infotainment and user experience, was named vice president, Global Engineering for Advanced Safety and User Experience in 2012.
David Paja, 49, is senior vice president of Aptiv and president of Advanced Safety and User Experience, effective February 2017. He was most recently president of Honeywell Security & Fire, a global leader in electronic detection and prevention technologies for residential, commercial, and industrial applications from 2015 to 2017. From 2012 to 2014, he served Honeywell’s Transportation Systems segment as vice president and general manager for China and India. Mr. Paja was instrumental in enhancing Honeywell’s Internet of Things capabilities with advanced software and connectivity technologies, serving millions of connected homes and buildings worldwide. He began his Honeywell career in 2003 and held several leadership positions of increasing responsibility. Before joining Honeywell, Mr. Paja held several positions at Valeo Automotive.
David M. Sherbin, 59, is senior vice president, general counsel, chief compliance officer and secretary of Aptiv. He was named to his current position in October 2009 and previously was vice president, general counsel from October 2005 to October 2009. He was appointed chief compliance officer in January 2006. Prior to joining Aptiv, Mr. Sherbin was vice president, general counsel and secretary for PulteGroup, Inc., a national homebuilder, from January 2005 through September
- Mr. Sherbin joined Federal-Mogul Corporation in 1997 and was named senior vice president, general counsel, secretary and chief compliance officer in 2003.
Mariya Trickett, 36, is senior vice president and chief human resources officer of Aptiv, effective September 2018. She joined Aptiv from Dana Incorporated, where she was most recently senior vice president of human resources from 2016 to 2018. In addition, she was a managing director of Dana Europe AG from 2013 to 2018. Prior to assuming the senior vice president of human resources position, she served as senior director of human resources for Dana’s global Off-Highway Driveline Technologies business, while also supporting the Aftermarket Group and all of Dana’s European operations from 2015 to 2016. From 2013 to 2015, Ms. Trickett worked as director of H.R. for Off-Highway Driveline Technologies, and senior H.R. manager for Europe from 2011 to 2013. She began her Dana career in 2007, and held roles supporting Dana’s sales and purchasing organizations, and worked in global compensation and international mobility.
Item 1A. RISK FACTORS
Set forth below are certain risks and uncertainties that could adversely affect our results of operations or financial condition and cause our actual results to differ materially from those expressed in forward-looking statements made by the Company. Also refer to the Cautionary Statement Regarding Forward-Looking Information in this Annual Report.
Risks Related to Business Environment and Economic Conditions
The cyclical nature of automotive sales and production can adversely affect our business.
Our business is directly related to automotive sales and automotive vehicle production by our customers. Automotive sales and production are highly cyclical and, in addition to general economic conditions, also depend on other factors, such as consumer confidence and consumer preferences. Lower global automotive sales would be expected to result in substantially all of our automotive OEM customers lowering vehicle production schedules, which has a direct impact on our earnings and cash flows. In addition, automotive sales and production can be affected by labor relations issues, regulatory requirements, trade agreements, the availability of consumer financing and other factors. Economic declines that result in a significant reduction in automotive sales and production by our customers have in the past had, and may in the future have, an adverse effect on our business, results of operations and financial condition.
Our sales are also affected by inventory levels and OEMs’ production levels. We cannot predict when OEMs will decide to increase or decrease inventory levels or whether new inventory levels will approximate historical inventory levels. Uncertainty and other unexpected fluctuations could have a material adverse effect on our business and financial condition.
A prolonged economic downturn or economic uncertainty could adversely affect our business and cause us to require additional sources of financing, which may not be available.
Our sensitivity to economic cycles and any related fluctuation in the businesses of our customers or potential customers may have a material adverse effect on our financial condition, results of operations or cash flows. Due to overall global economic conditions in 2018, the automotive industry experienced decreased global customer sales and production schedules. Compared to 2017, vehicle production in 2018 remained flat in North America and decreased by 1% in Europe and 4% in China. Vehicle production in South America, our smallest region, increased 4% as compared to 2017. As a result, we have experienced and may continue to experience reductions in orders from OEM customers in certain regions. Uncertainty relating to global or regional economic conditions may have an adverse impact on our business. A prolonged downturn in the global or regional automotive industry, or a significant change in product mix due to consumer demand, could require us to shut down plants or result in impairment charges, restructuring actions or changes in our valuation allowances against deferred tax assets, which could be material to our financial condition and results of operations. If global economic conditions deteriorate or economic uncertainty increases, our customers and potential customers may experience deterioration of their businesses, which may result in the delay or cancellation of plans to purchase our products. If vehicle production were to remain at low levels for an extended period of time or if cash losses for customer defaults rise, our cash flow could be adversely impacted, which could result in our needing to seek additional financing to continue our operations. There can be no assurance that we would be able to secure such financing on terms acceptable to us, or at all.
Any changes in consumer credit availability or cost of borrowing could adversely affect our business.
Declines in the availability of consumer credit and increases in consumer borrowing costs have negatively impacted global automotive sales and resulted in lower production volumes in the past. Substantial declines in automotive sales and production by our customers could have a material adverse effect on our business, results of operations and financial condition.
A drop in the market share and changes in product mix offered by our customers can impact our revenues.
We are dependent on the continued growth, viability and financial stability of our customers. Our customers generally are OEMs in the automotive industry. This industry is subject to rapid technological change, vigorous competition, short product life cycles and cyclical and reduced consumer demand patterns. When our customers are adversely affected by these factors, we may be similarly affected to the extent that our customers reduce the volume of orders for our products. As a result of changes impacting our customers, sales mix can shift which may have either favorable or unfavorable impact on revenue and would include shifts in regional growth, shifts in OEM sales demand, as well as shifts in consumer demand related to vehicle segment purchases and content penetration. For instance, a shift in sales demand favoring a particular OEMs’ vehicle model for which we do not have a supply contract may negatively impact our revenue. A shift in regional sales demand toward certain markets could favorably impact the sales of those of our customers that have a large market share in those regions, which in turn would be expected to have a favorable impact on our revenue.
The mix of vehicle offerings by our OEM customers also impacts our sales. A decrease in consumer demand for specific types of vehicles where we have traditionally provided significant content could have a significant effect on our business and
financial condition. Our sales of products in the regions in which our customers operate also depend on the success of these customers in those regions.
We operate in the highly competitive automotive technology and component supply industry, and are dependent on the acceptance of new product introductions for continued growth.
The global automotive technology and component supply industry is highly competitive. Competition is based primarily on price, technology, quality, delivery and overall customer service. There can be no assurance that our products will be able to compete successfully with the products of our competitors. Furthermore, the rapidly evolving nature of the markets in which we compete has attracted, and may continue to attract, new entrants, particularly in countries such as China or in areas of evolving vehicle technologies such as automated driving technologies, which have attracted new entrants from outside the traditional automotive supply industry. Additionally, consolidation in the automotive industry may lead to decreased product purchases from us. As a result, our sales levels and margins could be adversely affected by pricing pressures from OEMs and pricing actions of competitors. These factors led to selective resourcing of business to competitors in the past and may also do so in the future.
In addition, any of our competitors may foresee the course of market development more accurately than us, develop products that are superior to our products, have the ability to produce similar products at a lower cost than us, adapt more quickly than us to new technologies or evolving customer requirements or develop or introduce new products or solutions before we do, particularly related to potential transformative technologies such as autonomous driving solutions. As a result, our products may not be able to compete successfully with their products. These trends may adversely affect our sales as well as the profit margins on our products. If we do not continue to innovate to develop or acquire new and compelling products that capitalize upon new technologies, this could have a material adverse impact on our results of operations.
If we do not respond appropriatel
Showing the first 8K of 66K characters. Open the full section
Item 1B. UNRESOLVED STAFF COMMENTS
We have no unresolved SEC staff comments to report.
Item 2. PROPERTIES
As of December 31, 2018, we owned or leased 126 major manufacturing sites and 15 major technical centers. A manufacturing site may include multiple plants and may be wholly or partially owned or leased. We also have many smaller manufacturing sites, sales offices, warehouses, engineering centers, joint ventures and other investments strategically located throughout the world. We have a presence in 44 countries. The following table shows the regional distribution of our major manufacturing sites by the operating segment that uses such facilities:
| North America | Europe, Middle East & Africa | Asia Pacific | South America | Total | ||||||||||
| Signal and Power Solutions | 45 | 33 | 33 | 5 | 116 | |||||||||
| Advanced Safety and User Experience | 2 | 5 | 3 | — | 10 | |||||||||
| Total | 47 | 38 | 36 | 5 | 126 |
In addition to these manufacturing sites, we had 15 major technical centers: eight in North America; two in Europe, Middle East and Africa; and five in Asia Pacific.
Of our 126 major manufacturing sites and 15 major technical centers, which include facilities owned or leased by our consolidated subsidiaries, 61 are primarily owned and 80 are primarily leased.
We frequently review our real estate portfolio and develop footprint strategies to support our customers’ global plans, while at the same time supporting our technical needs and controlling operating expenses. We believe our evolving portfolio will meet current and anticipated future needs.
Item 3. LEGAL PROCEEDINGS
We are from time to time subject to various actions, claims, suits, government investigations, and other proceedings incidental to our business, including those arising out of alleged defects, breach of contracts, competition and antitrust matters, product warranties, intellectual property matters, personal injury claims and employment-related matters. It is our opinion that the outcome of such matters will not have a material adverse impact on our consolidated financial position, results of operations, or cash flows. With respect to warranty matters, although we cannot ensure that the future costs of warranty claims by customers will not be material, we believe our established reserves are adequate to cover potential warranty settlements. However, the final amounts required to resolve these matters could differ materially from our recorded estimates.
Brazil Matters
Aptiv conducts business operations in Brazil that are subject to the Brazilian federal labor, social security, environmental, tax and customs laws, as well as a variety of state and local laws. While Aptiv believes it complies with such laws, they are complex, subject to varying interpretations, and the Company is often engaged in litigation with government agencies regarding the application of these laws to particular circumstances. As of December 31, 2018, the majority of claims asserted against Aptiv in Brazil relate to such litigation. The remaining claims in Brazil relate to commercial and labor litigation with private parties. As of December 31, 2018, claims totaling approximately $145 million (using December 31, 2018 foreign currency rates) have been asserted against Aptiv in Brazil. As of December 31, 2018, the Company maintains accruals for these asserted claims of $30 million (using December 31, 2018 foreign currency rates). The amounts accrued represent claims that are deemed probable of loss and are reasonably estimable based on the Company’s analyses and assessment of the asserted claims and prior experience with similar matters. While the Company believes its accruals are adequate, the final amounts required to resolve these matters could differ materially from the Company’s recorded estimates and Aptiv’s results of
operations could be materially affected. The Company estimates the reasonably possible loss in excess of the amounts accrued related to these claims to be zero to $115 million.
Item 4. MINE SAFETY DISCLOSURES
Not applicable.
PART II
Item 5. MARKET FOR REGISTRANT’S COMMON EQUITY, RELATED STOCKHOLDER MATTERS AND ISSUER PURCHASES OF EQUITY SECURITIES
Our ordinary shares have been publicly traded since November 17, 2011 when our ordinary shares were listed and began trading on the New York Stock Exchange (“NYSE”) under the symbol “DLPH.” On December 4, 2017, following the spin-off of Delphi Technologies, the Company changed its name to Aptiv PLC and its NYSE symbol to “APTV.”
As of January 25, 2019, there were 2 shareholders of record of our ordinary shares.
The following graph reflects the comparative changes in the value from December 31, 2013 through December 31, 2018, assuming an initial investment of $100 and the reinvestment of dividends, if any in (1) our ordinary shares, (2) the S&P 500 index and (3) the Automotive Peer Group. Historical share prices of our ordinary shares have been adjusted to reflect the Separation. Historical performance may not be indicative of future shareholder returns.
Stock Performance Graph
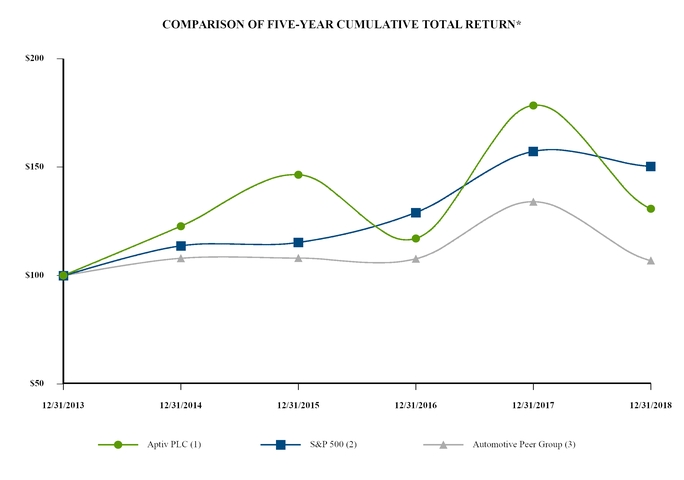
- $100 invested on December 31, 2013 in our stock or in the relevant index, including reinvestment of dividends. Fiscal year ended December 31, 2018.
| (1) | Aptiv PLC, adjusted for the distribution of Delphi Technologies on December 4, 2017 |
| (2) | S&P 500 – Standard & Poor’s 500 Total Return Index |
| (3) | Automotive Peer Group – Adient Plc, American Axle & Manufacturing Holdings Inc, Aptiv PLC, Borgwarner Inc, Cooper Tire & Rubber Co, Cooper-standard Holdings Inc, Dana Inc, Dorman Products Inc, Ford Motor Co, Garrett Motion Inc., General Motors Co, Gentex Corp, Gentherm Inc, Genuine Parts Co, Goodyear Tire & Rubber Co, Lear Corp, Lkq Corp, Meritor Inc, Motorcar Parts Of America Inc, Standard Motor Products Inc, Stoneridge Inc, Superior Industries International Inc, Tenneco Inc, Tesla Inc, Tower International Inc, Visteon Corp, Wabco Holdings Inc |
| Company Index | December 31, 2013 | December 31, 2014 | December 31, 2015 | December 31, 2016 | December 31, 2017 | December 31, 2018 | ||||||||||||||||||
| Aptiv PLC (1) | $ | 100.00 | $ | 122.75 | $ | 146.49 | $ | 117.11 | $ | 178.46 | $ | 130.80 | ||||||||||||
| S&P 500 (2) | 100.00 | 113.69 | 115.26 | 129.05 | 157.22 | 150.33 | ||||||||||||||||||
| Automotive Peer Group (3) | 100.00 | 107.96 | 108.05 | 107.72 | 134.04 | 106.89 |
Equity Compensation Plan Information
The table below contains information about securities authorized for issuance under equity compensation plans. The features of these plans are discussed further in Note 21. Share-Based Compensation to our consolidated financial statements.
| Plan Category | Number of Securities to be Issued Upon Exercise of Outstanding Options, Warrants and Rights (a) | Weighted-Average Exercise Price of Outstanding Options, Warrants and Rights (b) | Number of Securities Remaining Available for Future Issuance Under Equity Compensation Plans (excluding securities reflected in column (a)) (c) | ||||||||||
| Equity compensation plans approved by security holders | 2,265,586 | (1) | $ | — | (2) | 15,572,059 | (3) | ||||||
| Equity compensation plans not approved by security holders | — | — | — | ||||||||||
| Total | 2,265,586 | — | 15,572,059 |
| (1) | Includes (a) 23,932 outstanding restricted stock units granted to our Board of Directors and (b) 2,241,654 outstanding time- and performance-based restricted stock units granted to our executives. All grants were made under the Aptiv PLC Long Term Incentive Plan, as amended and restated effective April 23, 2015 (the “PLC LTIP”). Includes accrued dividend equivalents. |
| (2) | The restricted stock units have no exercise price. |
| (3) | Remaining shares available under the PLC LTIP. |
Repurchase of Equity Securities
A summary of our ordinary shares repurchased during the quarter ended December 31, 2018, is shown below:
| Period | Total Number of Shares Purchased (1) | Average Price Paid per Share (2) | Total Number of Shares Purchased as Part of Publicly Announced Plans or Programs | Approximate Dollar Value of Shares that May Yet be Purchased Under the Program (in millions) (3) | ||||||||||
| October 1, 2018 to October 31, 2018 | 535,964 | $ | 79.32 | 535,964 | $ | 725 | ||||||||
| November 1, 2018 to November 30, 2018 | 1,030,049 | 72.74 | 1,030,049 | 650 | ||||||||||
| December 1, 2018 to December 31, 2018 | 2,451,220 | 65.27 | 2,451,220 | 490 | ||||||||||
| Total | 4,017,233 | 69.06 | 4,017,233 |
| (1) | The total number of shares purchased under the Board authorized plans described below. |
| (2) | Excluding commissions. |
| (3) | In January 2019, the Board of Directors authorized a share repurchase program of up to $2.0 billion. This program will commence following the completion of the previously announced share repurchase program of $1.5 billion, which was approved by the Board of Directors in April 2016. The timing of repurchases is dependent on price, market conditions and applicable regulatory requirements. |
Item 6. SELECTED FINANCIAL DATA
The following selected consolidated financial data were derived from our audited consolidated financial statements and should be read in conjunction with, and are qualified by reference to, Item 7. Management’s Discussion and Analysis of Financial Condition and Results of Operations and the consolidated financial statements and notes thereto included elsewhere in this Annual Report. The financial information presented may not be indicative of our future performance.
The assets and liabilities and operating results for the previously reported Powertrain Systems and Thermal Systems segments have been reclassified as discontinued operations separate from the Company’s continuing operations for all periods presented. For further information regarding discontinued operations, see Note 25. Discontinued Operations to the audited consolidated financial statements included herein.
| Year Ended December 31, | |||||||||||||||||||
| 2018 | 2017 | 2016 | 2015 (1) | 2014 | |||||||||||||||
| (dollars and shares in millions, except per share data) | |||||||||||||||||||
| Statements of operations data: | |||||||||||||||||||
| Net sales | $ | 14,435 | $ | 12,884 | $ | 12,274 | $ | 10,864 | $ | 11,083 | |||||||||
| Depreciation and amortization (2) | 676 | 546 | 489 | 344 | 338 | ||||||||||||||
| Operating income | 1,473 | 1,416 | 1,539 | 1,235 | 1,225 | ||||||||||||||
| Interest expense | (141 | ) | (140 | ) | (155 | ) | (124 | ) | (131 | ) | |||||||||
| Income from continuing operations | 1,107 | 1,063 | 868 | 852 | 927 | ||||||||||||||
| Income from discontinued operations, net of tax | — | 365 | 458 | 683 | 513 | ||||||||||||||
| Net income | 1,107 | 1,428 | 1,326 | 1,535 | 1,440 | ||||||||||||||
| Net income attributable to noncontrolling interest | 40 | 73 | 69 | 85 | 89 | ||||||||||||||
| Net income attributable to Aptiv | 1,067 | 1,355 | 1,257 | 1,450 | 1,351 | ||||||||||||||
| Net income per share data: | |||||||||||||||||||
| Basic net income per share: | |||||||||||||||||||
| Continuing operations | $ | 4.04 | $ | 3.82 | $ | 3.05 | $ | 2.85 | $ | 2.97 | |||||||||
| Discontinued operations | — | 1.25 | 1.55 | 2.23 | 1.53 | ||||||||||||||
| Basic net income per share attributable to Aptiv | $ | 4.04 | $ | 5.07 | $ | 4.60 | $ | 5.08 | $ | 4.50 | |||||||||
| Diluted net income per share: | |||||||||||||||||||
| Continuing operations | $ | 4.02 | $ | 3.81 | $ | 3.05 | $ | 2.84 | $ | 2.95 | |||||||||
| Discontinued operations | — | 1.25 | 1.54 | 2.22 | 1.53 | ||||||||||||||
| Diluted net income per share attributable to Aptiv | $ | 4.02 | $ | 5.06 | $ | 4.59 | $ | 5.06 | $ | 4.48 | |||||||||
| Weighted average shares outstanding | 264 | 267 | 273 | 285 | 300 | ||||||||||||||
| Cash dividends declared and paid | $ | 0.88 | $ | 1.16 | $ | 1.16 | $ | 1.00 | $ | 1.00 | |||||||||
| Other financial data: | |||||||||||||||||||
| Capital expenditures | $ | 846 | $ | 698 | $ | 657 | $ | 503 | $ | 457 | |||||||||
| Adjusted operating income (3) | 1,751 | 1,594 | 1,623 | 1,360 | 1,340 | ||||||||||||||
| Adjusted operating income margin (4) | 12.1 | % | 12.4 | % | 13.2 | % | 12.5 | % | 12.1 | % | |||||||||
| Net cash provided by operating activities (5) | $ | 1,628 | $ | 1,468 | $ | 1,941 | $ | 1,703 | $ | 2,135 | |||||||||
| Net cash used in investing activities (5) | (2,048 | ) | (1,252 | ) | (578 | ) | (1,699 | ) | (1,186 | ) | |||||||||
| Net cash (used in) provided by financing activities (5) | (555 | ) | 456 | (1,081 | ) | (284 | ) | (1,398 | ) |
| As of December 31, | |||||||||||||||||||
| 2018 | 2017 | 2016 | 2015 | 2014 | |||||||||||||||
| (in millions, except employee data) | |||||||||||||||||||
| Balance sheet and employment data: | |||||||||||||||||||
| Cash and cash equivalents | $ | 567 | $ | 1,596 | $ | 737 | $ | 427 | $ | 698 | |||||||||
| Total assets | $ | 12,480 | $ | 12,169 | $ | 12,292 | $ | 11,973 | $ | 10,721 | |||||||||
| Total debt | $ | 4,344 | $ | 4,149 | $ | 3,963 | $ | 3,976 | $ | 2,389 | |||||||||
| Working capital, as defined (6) | $ | 1,430 | $ | 1,296 | $ | 1,169 | $ | 943 | $ | 713 | |||||||||
| Shareholders’ equity | $ | 3,670 | $ | 3,517 | $ | 2,763 | $ | 2,733 | $ | 3,013 | |||||||||
| Global employees (7) | 143,000 | 129,000 | 145,000 | 139,000 | 127,000 |
| (1) | On December 18, 2015, we completed the acquisition of HellermannTyton Group PLC, a leading global manufacturer of high-performance and innovative cable management solutions. Given the timing of the acquisition it is not fully reflected in our 2015 results and impacts comparability to 2016 results. |
| (2) | Includes long-lived and intangible asset impairments. |
| (3) | Adjusted Operating Income represents net income before interest expense, other income (expense), net, income tax expense, equity income (loss), net of tax, income (loss) from discontinued operations, net of tax, restructuring, other acquisition and portfolio project costs (which includes costs incurred to integrate acquired businesses and to plan and execute product portfolio transformation actions, including business and product acquisitions and divestitures), asset impairments, gains (losses) on business divestitures and deferred compensation related to acquisitions. Adjusted Operating Income is presented as a supplemental measure of the Company’s financial performance which management believes is useful to investors in assessing the Company’s ongoing financial performance that, when reconciled to the corresponding U.S. GAAP measure, provides improved comparability between periods through the exclusion of certain items that management believes are not indicative of the Company’s core operating performance and which may obscure underlying business results and trends. Our management utilizes Adjusted Operating Income in its financial decision making process, to evaluate performance of the Company and for internal reporting, planning and forecasting purposes. Management also utilizes Adjusted Operating Income as the key performance measure of segment income or loss and for planning and forecasting purposes to allocate resources to our segments, as management also believes this measure is most reflective of the operational profitability or loss of our operating segments. Adjusted Operating Income should not be considered a substitute for results prepared in accordance with U.S. GAAP and should not be considered an alternative to net income attributable to Aptiv, which is the most directly comparable financial measure to Adjusted Operating Income that is in accordance with U.S. GAAP. Adjusted Operating Income, as determined and measured by Aptiv, should also not be compared to similarly titled measures reported by other companies. |
| The reconciliation of Adjusted Operating Income to operating income includes restructuring, other acquisition and portfolio project costs (which includes costs incurred to integrate acquired businesses and to plan and execute product portfolio transformation actions, including business and product acquisitions and divestitures), asset impairments, gains (losses) on business divestitures and deferred compensation related to acquisitions. The reconciliation of Adjusted Operating Income to net income (loss) attributable to the Company is as follows: |
| Year Ended December 31, | |||||||||||||||||||
| 2018 | 2017 | 2016 | 2015 | 2014 | |||||||||||||||
| (in millions) | |||||||||||||||||||
| Net income attributable to Aptiv | $ | 1,067 | $ | 1,355 | $ | 1,257 | $ | 1,450 | $ | 1,351 | |||||||||
| Net income attributable to noncontrolling interest | 40 | 73 | 69 | 85 | 89 | ||||||||||||||
| Income from discontinued operations, net of tax | — | (365 | ) | (458 | ) | (683 | ) | (513 | ) | ||||||||||
| Income from continuing operations | 1,107 | 1,063 | 868 | 852 | 927 | ||||||||||||||
| Equity income, net of tax | (23 | ) | (31 | ) | (35 | ) | (16 | ) | (21 | ) | |||||||||
| Income tax expense | 250 | 223 | 167 | 161 | 146 | ||||||||||||||
| Other (income) expense, net (a) | (2 | ) | 21 | 384 | 114 | 42 | |||||||||||||
| Interest expense | 141 | 140 | 155 | 124 | 131 | ||||||||||||||
| Operating income (b) | 1,473 | 1,416 | 1,539 | 1,235 | 1,225 | ||||||||||||||
| Restructuring | 109 | 129 | 167 | 65 | 88 | ||||||||||||||
| Other acquisition and portfolio project costs | 78 | 28 | 57 | 45 | 20 | ||||||||||||||
| Asset impairments | 34 | 9 | 1 | 7 | 7 | ||||||||||||||
| (Gain) loss on business divestitures, net | — | — | (141 | ) | 8 | — | |||||||||||||
| Deferred compensation related to nuTonomy acquisition | 57 | 12 | — | — | — | ||||||||||||||
| Adjusted operating income (b) | $ | 1,751 | $ | 1,594 | $ | 1,623 | $ | 1,360 | $ | 1,340 |
| (a) | During the year ended December 31, 2016, the Company recorded a reserve of $300 million for litigation related to general unsecured claims against DPHH, as further described in Note 13. Commitments and Contingencies to the audited consolidated financial statements included herein. |
| (b) | On December 30, 2016, we completed the sale of our Mechatronics business, as further described in Note 20. Acquisitions and Divestitures to the audited consolidated financial statements included herein. Given the timing of the divestiture, the operating results of this business are reflected in our 2016 results and impacts comparability to 2017 results. |
| (4) | Adjusted operating income margin is defined as adjusted operating income as a percentage of net sales. |
| (5) | Includes amounts attributable to discontinued operations. |
| (6) | Working capital is calculated herein as accounts receivable plus inventories less accounts payable. |
| (7) | Excludes temporary and contract workers. As of December 31, 2018, we employed approximately 19,000 temporary and contract workers. Periods prior to December 31, 2017 include employees of discontinued operations. |
Item 7. MANAGEMENT’S DISCUSSION AND ANALYSIS OF FINANCIAL CONDITION AND RESULTS OF OPERATIONS
The following management’s discussion and analysis of financial condition and results of operations (“MD&A”) is intended to help you understand the business operations and financial condition of the Company for the three year period ended December 31, 2018. This discussion should be read in conjunction with Item 8. Financial Statements and Supplementary Data. Our MD&A is presented in seven sections:
| • | Executive Overview |
| • | Consolidated Results of Operations |
| • | Results of Operations by Segment |
| • | Liquidity and Capital Resources |
| • | Off-Balance Sheet Arrangements and Other Matters |
| • | Significant Accounting Policies and Critical Accounting Estimates |
| • | Recently Issued Accounting Pronouncements |
Within the MD&A, “Aptiv,” the “Company,” “we,” “us” and “our” refer to Aptiv PLC, a public limited company formed under the laws of Jersey on May 19, 2011 as Delphi Automotive PLC, which, through its subsidiaries, acquired certain assets of the former Delphi Corporation (now known as DPH Holdings Corp. (“DPHH”)) and completed an initial public offering on November 22, 2011. On December 4, 2017 (the “Distribution Date”), the Company completed the separation (the “Separation”) of its former Powertrain Systems segment by distributing to Aptiv shareholders on a pro rata basis all of the issued and outstanding ordinary shares of Delphi Technologies PLC (“Delphi Technologies”), a public limited company formed to hold the spun-off business. To effect the Separation, the Company distributed to its shareholders one ordinary share of Delphi Technologies for every three Aptiv ordinary shares outstanding as of November 22, 2017, the record date for the distribution. Following the Separation, the remaining company changed its name to Aptiv PLC and New York Stock Exchange (“NYSE”) symbol to “APTV.” Aptiv did not retain any equity interest in Delphi Technologies. Delphi Technologies’ historical financial results through the Distribution Date are reflected in the Company’s consolidated financial statements as a discontinued operation, as more fully described in Note 25. Discontinued Operations to the audited consolidated financial statements included herein. The completion of the Separation positioned Aptiv as a new mobility provider focused on solving the complex challenges associated with safer, greener and more connected transportation. At the core of our capabilities is the software and vehicle architecture expertise that enables the advanced safety, automated driving, user experience, and connected services that are enabling the future of mobility.
Also as described in Note 25. Discontinued Operations to the audited consolidated financial statements included herein, on March 31, 2016, we completed the final step of our strategy to divest our former Thermal Systems business through the sale of our ownership interest in the Shanghai Delphi Automotive Air Conditioning (“SDAAC”) joint venture for net cash proceeds of $62 million. Previously, on June 30, 2015 we completed the sale of the Company’s wholly owned Thermal Systems business to MAHLE GmbH (“MAHLE”) for net cash proceeds of approximately $660 million, and on September 24, 2015 we completed the sale of our interest in the Korea Delphi Automotive Systems Corporation (“KDAC”) joint venture to a separate buyer for net cash proceeds of $70 million. The SDAAC and KDAC joint ventures were previously reported within the Thermal Systems segment. Proceeds from the sale were used to fund growth initiatives, including acquisitions, as well as share repurchases.
As the disposal of both the Powertrain Systems and Thermal Systems businesses represented strategic shifts that will have a major effect on the Company’s operations and financial results, the assets and liabilities, operating results, and operating and investing cash flows for the previously reported Powertrain Systems and Thermal Systems segments are presented as discontinued operations separate from the Company’s continuing operations for all periods presented. This Management’s Discussion and Analysis reflects the results of continuing operations, unless otherwise noted.
Executive Overview
Our Business
We are a leading global technology and mobility company primarily serving the automotive sector. We design and manufacture vehicle components and provide electrical, electronic and active safety technology solutions to the global automotive market, creating the software and hardware foundation for vehicle features and functionality. We enable and deliver end-to-end smart mobility solutions, active safety and autonomous driving technologies and provide enhanced user experience and connected services. Our Advanced Safety and User Experience segment is focused on providing the necessary software and advanced computing platforms, and our Signal and Power Solutions segment is focused on providing the requisite networking architecture required to support the integrated systems in today’s complex vehicles. Together, our businesses develop the ‘brain’ and the ‘nervous system’ of increasingly complex vehicles, providing integration of the vehicle into its operating environment.
We are one of the largest vehicle component manufacturers, and our customers include all 25 of the largest automotive original equipment manufacturers (“OEMs”) in the world.
Business Strategy
We believe the Company is well-positioned for growth from increasing global vehicle production volumes, increased demand for our Safe, Green and Connected products which are being added to vehicle content, and new business wins with existing and new customers. We are focused on accelerating the commercialization of active safety, autonomous driving, enhanced user experiences and connected services, providing the software, advanced computing platforms and networking architecture required to do so. We have successfully created a competitive cost structure while investing in research and development to grow our product offerings, which are aligned with the high-growth industry mega-trends, and re-aligned our manufacturing footprint into an efficient, low-cost regional service model, focused on increasing our profit margins.
Our achievements in 2018 included the following:
| • | Accelerating our end-market diversification strategy through the acquisition of Winchester Interconnect, a leading provider of advanced interconnect solutions for harsh environment applications; |
| • | Further strengthening our leadership position in Asia Pacific and expanding our range of specialized connectors and cable management solutions through the acquisition of KUM; |
| • | Extending leadership position in perception systems by complementing our portfolio with enhanced interior sensing capabilities through investment in Affectiva, Inc., a leader in human perception artificial intelligence technology; |
| • | Announcing a partnership with Lyft, Inc. by launching a fleet of autonomous vehicles in Las Vegas which operate on Aptiv’s fully-integrated autonomous driving platform and are available to the public on the Lyft network; |
| • | Generating gross business bookings of $22 billion, based upon expected volumes and pricing; |
| • | Generating $1.6 billion of cash from continuing operations and net income of $1.1 billion; and |
| • | Maximizing our operational flexibility and profitability at all points in the normal automotive business cycle, by having approximately 96% of our hourly workforce based in best cost countries and approximately 13% of our hourly workforce composed of temporary employees. |
Our strategy is to build on these accomplishments and continue to develop and ma
Showing the first 8K of 183K characters. Open the full section
Item 7A. QUANTITATIVE AND QUALITATIVE DISCLOSURES ABOUT MARKET RISK
We are exposed to market risks from changes in currency exchange rates and certain commodity prices. In order to manage these risks, we operate a centralized risk management program that consists of entering into a variety of derivative contracts with the intent of mitigating our risk to fluctuations in currency exchange rates and commodity prices. We do not enter into derivative transactions for speculative or trading purposes.
A discussion of our accounting policies for derivative instruments is included in Note 2. Significant Accounting Policies to the audited consolidated financial statements included herein and further disclosure is provided in Note 17. Derivatives and Hedging Activities to the audited consolidated financial statements included herein. We maintain risk management control systems to monitor exchange and commodity risks and related hedge positions. Positions are monitored using a variety of analytical techniques including market value and sensitivity analysis. The following analyses are based on sensitivity tests, which assume instantaneous, parallel shifts in currency exchange rates and commodity prices. For options and instruments with non-linear returns, appropriate models are utilized to determine the impact of shifts in rates and prices.
We have currency exposures related to buying, selling and financing in currencies other than the local currencies in which we operate. Historically, we have reduced our exposure through financial instruments (hedges) that provide offsets or limits to our exposures, which are opposite to the underlying transactions. We also face an inherent business risk of exposure to commodity prices risks, and have historically offset our exposure, particularly to changes in the price of various non-ferrous metals used in our manufacturing operations, through fixed price purchase agreements, commodity swaps and option contracts. We continue to manage our exposures to changes in currency rates and commodity prices using these derivative instruments.
Currency Exchange Rate Risk
Currency exposures may impact future earnings and/or operating cash flows. We have currency exposures related to buying, selling and financing in currencies other than the local functional currencies in which we operate (“transactional exposure”). We also have currency exposures related to the translation of the financial statements of our foreign subsidiaries that use the local currency as their functional currency into U.S. dollars, the Company’s reporting currency (“translational exposure”). The impact of translational exposure is recorded within currency translation adjustment in the Consolidated Statements of Comprehensive Income. During the year ended December 31, 2018, the foreign currency translation adjustment loss of $194 million was primarily due to the impact of a strengthening U.S. dollar, which increased approximately 5% in relation to both the Euro and the Chinese Yuan Renminbi from December 31, 2017.
As described in Note. 17. Derivatives and Hedging Activities to the audited consolidated financial statements included herein, in order to manage certain translational exposure, we have designated the 2015 Euro-denominated Senior Notes and the 2016 Euro-denominated Senior Notes as net investment hedges of the foreign currency exposure of our investments in certain Euro-denominated subsidiaries. We have also entered into forward contracts designated as net investment hedges of the foreign currency exposure of our investments in certain Chinese Yuan Renminbi-denominated subsidiaries. The effective portion of the gains or losses on instruments designated as net investment hedges are recognized within the cumulative translation adjustment component in the Consolidated Statements of Comprehensive Income to offset changes in the value of the net investment in these foreign currency-denominated operations.
In some instances, we choose to reduce our transactional exposures through financial instruments (hedges) that provide offsets or limits to our exposures. Currently our most significant hedged currency exposures relate to the Mexican Peso, Chinese Yuan Renminbi, Polish Zloty, Euro and Turkish Lira. As of December 31, 2018 and December 31, 2017 the net fair value liability of all financial instruments, including hedges and underlying transactions, with exposure to currency risk was approximately $1,412 million and $1,397 million, respectively. The potential loss or gain in fair value for such financial instruments from a hypothetical 10% adverse or favorable change in quoted currency exchange rates would be approximately $131 million and $156 million at December 31, 2018 and 2017, respectively. The impact of a 10% change in rates on fair value differs from a 10% change in the net fair value asset due to the existence of hedges. The model assumes a parallel shift in currency exchange rates; however, currency exchange rates rarely move in the same direction. The assumption that currency exchange rates change in a parallel fashion may overstate the impact of changing currency exchange rates on assets and liabilities denominated in currencies other than the U.S. dollar.
Commodity Price Risk
Commodity swaps/average rate forward contracts are executed to offset a portion of our exposure to the potential change in prices mainly for various non-ferrous metals used in the manufacturing of automotive components, primarily copper. The net fair value of our contracts was a liability of approximately $22 million and an asset of approximately $35 million at December 31, 2018 and 2017, respectively. If the price of the commodities that are being hedged by our commodity swaps/average rate forward contracts changed adversely or favorably by 10%, the fair value of our commodity swaps/average rate forward contracts would decrease or increase by $25 million and $19 million at December 31, 2018 and 2017, respectively. A 10% change in the net fair value liability differs from a 10% change in rates on fair value due to the relative differences between the underlying commodity prices and the prices in place in our commodity swaps/average rate forward contracts. These amounts exclude the offsetting impact of the price risk inherent in the physical purchase of the underlying commodities.
Interest Rate Risk
Our exposure to market risk associated with changes in interest rates relates primarily to our debt obligations. We do not use interest rate swap or other derivative contracts to manage our exposure to fluctuations in interest rates. As of December 31, 2018, we had approximately $385 million of floating rate debt, related to the Credit Agreement. The Credit Agreement carries an interest rate, at our option, on Tranche A term loan borrowings of either (a) the ABR plus 0.25% per annum, or (b) LIBOR plus 1.25% per annum, and on Revolving Credit Facility borrowings of either (a) the ABR plus 0.10% per annum, or (b) LIBOR plus 1.10% per annum.
The interest rate period with respect to the LIBOR interest rate option can be set at one-, two-, three-, or six-months as selected by us in accordance with the terms of the Credit Agreement (or other period as may be agreed by the applicable lenders), but payable no less than quarterly. We may elect to change the selected interest rate over the term of the Credit
Facilities in accordance with the provisions of the Credit Agreement. The applicable interest rates listed above for the Revolving Credit Facility and the Tranche A Term Loan may increase or decrease from time to time in increments of 0.10% to 0.25%, up to a maximum of 0.50% based on changes to our corporate credit ratings. Accordingly, the interest rate will fluctuate during the term of the Credit Agreement based on changes in the Alternate Base Rate, LIBOR or future changes in our corporate credit ratings.
The table below indicates interest rate sensitivity on interest expense to floating rate debt based on amounts outstanding as of December 31, 2018.
| Tranche A Term Loan | ||
| Change in Rate | (impact to annual interest expense, in millions) | |
| 25 bps decrease | - $1 | |
| 25 bps increase | +$1 |
Item 8. FINANCIAL STATEMENTS AND SUPPLEMENTARY DATA
Report of Independent Registered Public Accounting Firm
To the Shareholders and the Board of Directors of Aptiv PLC
Opinion on the Financial Statements
We have audited the accompanying consolidated balance sheets of Aptiv PLC (the Company) as of December 31, 2018 and 2017, and the related consolidated statements of operations, comprehensive income, shareholders’ equity and cash flows for each of the three years in the period ended December 31, 2018, and the related notes and financial statement schedule listed in the Index at Item 15(a)(2) (collectively referred to as the “consolidated financial statements”). In our opinion, the consolidated financial statements referred to above present fairly, in all material respects, the financial position of the Company at December 31, 2018 and 2017, and the results of its operations and its cash flows for each of the three years in the period ended December 31, 2018, in conformity with U.S. generally accepted accounting principles.
We also have audited, in accordance with the standards of the Public Company Accounting Oversight Board (United States) (PCAOB), the Company’s internal control over financial reporting as of December 31, 2018, based on criteria established in Internal Control-Integrated Framework issued by the Committee of Sponsoring Organizations of the Treadway Commission (2013 framework), and our report dated February 4, 2019 expressed an unqualified opinion thereon.
Basis for Opinion
These financial statements are the responsibility of the Company’s management. Our responsibility is to express an opinion on the Company’s financial statements based on our audits. We are a public accounting firm registered with the PCAOB and are required to be independent with respect to the Company in accordance with the U.S. federal securities laws and the applicable rules and regulations of the Securities and Exchange Commission and the PCAOB.
We conducted our audits in accordance with the standards of the PCAOB. Those standards require that we plan and perform the audit to obtain reasonable assurance about whether the financial statements are free of material misstatement, whether due to error or fraud. Our audits included performing procedures to assess the risks of material misstatement of the financial statements, whether due to error or fraud, and performing procedures that respond to those risks. Such procedures included examining, on a test basis, evidence regarding the amounts and disclosures in the financial statements. Our audits also included evaluating the accounting principles used and significant estimates made by management, as well as evaluating the overall presentation of the financial statements. We believe that our audits provide a reasonable basis for our opinion.
/s/ Ernst & Young LLP
We have served as the Company’s auditor since 2006
Detroit, Michigan
February 4, 2019
Report of Independent Registered Public Accounting Firm
To the Shareholders and the Board of Directors of Aptiv PLC
Opinion on Internal Control over Financial Reporting
We have audited Aptiv PLC’s internal control over financial reporting as of December 31, 2018, based on criteria established in Internal Control-Integrated Framework issued by the Committee of Sponsoring Organizations of the Treadway Commission (2013 framework) (the COSO criteria). In our opinion, Aptiv PLC (the Company) maintained, in all material respects, effective internal control over financial reporting as of December 31, 2018, based on the COSO criteria.
We also have audited, in accordance with the standards of the Public Company Accounting Oversight Board (United States) (PCAOB), the consolidated balance sheets of the Company as of December 31, 2018 and 2017, and the related consolidated statements of operations, comprehensive income, shareholders’ equity and cash flows for each of the three years in the period ended December 31, 2018, and related footnotes and schedule and our report dated February 4, 2019 expressed an unqualified opinion thereon.
Basis for Opinion
The Company’s management is responsible for maintaining effective internal control over financial reporting and for its assessment of the effectiveness of internal control over financial reporting included in the accompanying Management’s Report on Internal Control over Financial Reporting. Our responsibility is to express an opinion on the Company’s internal control over financial reporting based on our audit. We are a public accounting firm registered with the PCAOB and are required to be independent with respect to the Company in accordance with the U.S. federal securities laws and the applicable rules and regulations of the Securities and Exchange Commission and the PCAOB.
We conducted our audit in accordance with the standards of the PCAOB. Those standards require that we plan and perform the audit to obtain reasonable assurance about whether effective internal control over financial reporting was maintained in all material respects.
Our audit included obtaining an understanding of internal control over financial reporting, assessing the risk that a material weakness exists, testing and evaluating the design and operating effectiveness of internal control based on the assessed risk, and performing such other procedures as we considered necessary in the circumstances. We believe that our audit provides a reasonable basis for our opinion.
Definition and Limitations of Internal Control Over Financial Reporting
A company’s internal control over financial reporting is a process designed to provide reasonable assurance regarding the reliability of financial reporting and the preparation of financial statements for external purposes in accordance with generally accepted accounting principles. A company’s internal control over financial reporting includes those policies and procedures that (1) pertain to the maintenance of records that, in reasonable detail, accurately and fairly reflect the transactions and dispositions of the assets of the company; (2) provide reasonable assurance that transactions are recorded as necessary to permit preparation of financial statements in accordance with generally accepted accounting principles, and that receipts and expenditures of the company are being made only in accordance with authorizations of management and directors of the company; and (3) provide reasonable assurance regarding prevention or timely detection of unauthorized acquisition, use, or disposition of the company’s assets that could have a material effect on the financial statements.
Because of its inherent limitations, internal control over financial reporting may not prevent or detect misstatements. Also, projections of any evaluation of effectiveness to future periods are subject to the risk that controls may become inadequate because of changes in conditions, or that the degree of compliance with the policies or procedures may deteriorate.
/s/ Ernst & Young LLP
Detroit, Michigan
February 4, 2019
APTIV PLC
CONSOLIDATED STATEMENTS OF OPERATIONS
| Year Ended December 31, | |||||||||||
| 2018 | 2017 | 2016 | |||||||||
| (in millions, except per share amounts) | |||||||||||
| Net sales | $ | 14,435 | $ | 12,884 | $ | 12,274 | |||||
| Operating expenses: | |||||||||||
| Cost of sales | 11,706 | 10,270 | 9,527 | ||||||||
| Selling, general and administrative | 993 | 952 | 924 | ||||||||
| Amortization | 154 | 117 | 117 | ||||||||
| Restructuring (Note 10) | 109 | 129 | 167 | ||||||||
| Total operating expenses | 12,962 | 11,468 | 10,735 | ||||||||
| Operating income | 1,473 | 1,416 | 1,539 | ||||||||
| Interest expense | (141 | ) | (140 |
Showing the first 8K of 325K characters. Open the full section
Item 9. CHANGES IN AND DISAGREEMENTS WITH ACCOUNTANTS ON ACCOUNTING AND FINANCIAL DISCLOSURE
None.
Item 9A. CONTROLS AND PROCEDURES
Evaluation of Disclosure Controls and Procedures
Management of the Company, under the supervision and with the participation of the Chief Executive Officer and the Chief Financial Officer, carried out an evaluation of the effectiveness of the design and operation of the Company’s disclosure controls and procedures as of December 31, 2018. As defined in Rule 13a-15(e) under the Securities Exchange Act of 1934 (the “Exchange Act”), disclosure controls and procedures are controls and procedures designed to provide reasonable assurance that information required to be disclosed in reports filed or submitted under the Exchange Act is recorded, processed, summarized and reported on a timely basis, and that such information is accumulated and communicated to management, including the Company’s Chief Executive Officer and Chief Financial Officer, as appropriate, to allow timely decisions regarding required disclosure. The Company’s disclosure controls and procedures include components of the Company’s internal control over financial reporting. Based upon this evaluation, the Chief Executive Officer and Chief Financial Officer have concluded that the Company’s disclosure controls and procedures were effective as of December 31, 2018.
Management’s Report on Internal Control over Financial Reporting
Management is responsible for establishing and maintaining adequate internal control over financial reporting, as such term is defined in Exchange Act Rules 13a-15(f) and 15d-15(f), for the Company. Under the supervision of the Chief Executive Officer and Chief Financial Officer, management conducted an evaluation of the effectiveness of the Company’s internal control over financial reporting as of December 31, 2018 based on the framework set forth by the Committee of Sponsoring Organizations of the Treadway Commission (COSO) in “Internal Control-Integrated Framework (2013).” Based on that evaluation, management has concluded that the Company’s internal control over financial reporting was effective as of December 31, 2018.
Ernst & Young LLP has issued an attestation report which is included herein as the Report of Independent Registered Public Accounting Firm under the section headed Financial Statements and Supplementary Data for the year ended December 31, 2018.
Changes in Internal Control over Financial Reporting
There were no material changes in the Company’s internal control over financial reporting, identified in connection with management’s evaluation of internal control over financial reporting, that occurred during the year ended December 31, 2018 that have materially affected, or are reasonably likely to materially affect, the Company’s internal control over financial reporting.
Item 9B. OTHER INFORMATION
None.
PART III
Item 10. DIRECTORS, EXECUTIVE OFFICERS, AND CORPORATE GOVERNANCE
The information called for by Item 10, as to compliance with Section 16(a) of the Exchange Act, is incorporated by reference to the Company’s Definitive Proxy Statement to be filed with the SEC pursuant to Regulation 14A in connection with the Company’s 2019 Annual Meeting of Shareholders (the “Proxy Statement”) under the heading “Other Information—Section 16(a) Beneficial Ownership Reporting Compliance.” The information called for by Item 10, as to the audit committee and the audit committee financial expert, is incorporated by reference to the Company’s Proxy Statement under the headings “Board Practices” and “Board Committees.” The information called for by Item 10, as to executive officers, is set forth under Executive Officers of the Registrant in the Supplementary Item in Part I of this Annual Report on Form 10-K. The information called for by Item 10, as to directors, is incorporated by reference to the Company’s Proxy Statement under the headings “Election of Directors” and “Board Practices.”
The Company has adopted a code of ethics, the Code of Ethical Business Conduct, which applies to its principal executive officer, principal financial officer, principal accounting officer or controller, or persons performing similar functions, and all other employees and non-employee directors of the Company. The Code of Ethical Business Conduct is posted on the Company’s website (aptiv.com). The Company intends to satisfy the disclosure requirement under Item 5.05 of Form 8-K regarding an amendment to, or waiver from, a provision of the code of ethics that applies to the Company’s principal executive officer, principal financial officer, principal accounting officer or controller, or persons performing similar functions, by posting such information on the Company’s website, at the address specified above.
The Company’s Corporate Governance Guidelines and charters for each Committee of its Board of Directors are also available on the Company’s website. The Code of Ethical Business Conduct, Corporate Governance Guidelines and charters are also available in print to any shareholder who submits a request to: Corporate Secretary, Aptiv PLC, 5725 Innovation Drive, Troy, Michigan, 48098.
Information on the Company’s website is not deemed to be incorporated by reference into this Annual Report on Form 10-K.
Item 11. EXECUTIVE COMPENSATION
The information called for by Item 11 is incorporated by reference to the Company’s Proxy Statement under the headings “Director Compensation,” “Compensation Discussion and Analysis” and “Compensation Committee Report.”
Item 12. SECURITY OWNERSHIP OF CERTAIN BENEFICIAL OWNERS AND MANAGEMENT AND RELATED STOCKHOLDER MATTERS
The information called for by Item 12, as to security ownership of certain beneficial owners, directors and management, is incorporated by reference to the Company’s Proxy Statement under the headings “Security Ownership of Certain Beneficial Owners” and “Security Ownership of Management.”
Information as of December 31, 2018 about the Company’s ordinary shares that may be issued under all of its equity compensation plans is set forth in Part II Item 5 of this Annual Report on Form 10-K.
Item 13. CERTAIN RELATIONSHIPS AND RELATED TRANSACTIONS, AND DIRECTOR INDEPENDENCE
The information called for by Item 13, as to director independence, is incorporated by reference to the Company’s Proxy Statement under the heading “Board Practices.” The information called for by Item 13, as to related person transactions, is incorporated by reference to the Company’s Proxy Statement under the heading “Relationships and Related Party Transactions.”
Item 14. PRINCIPAL ACCOUNTING FEES AND SERVICES
The information called for by Item 14 is incorporated by reference to the Company’s Proxy Statement under the heading “Independent Registered Public Accounting Firm’s Fees.”
PART IV
Item 15. EXHIBITS, FINANCIAL STATEMENT SCHEDULES
(a) The following documents are filed as part of this Form 10-K.
(1) Financial Statements:
| Page No. | |
| — Reports of Independent Registered Public Accounting Firm | 68 |
| — Consolidated Statements of Operations for the Years Ended December 31, 2018, 2017 and 2016 | 70 |
| — Consolidated Statements of Comprehensive Income for the Years Ended December 31, 2018, 2017 and 2016 | 71 |
| — Consolidated Balance Sheets as of December 31, 2018 and 2017 | 72 |
| — Consolidated Statements of Cash Flows for the Years Ended December 31, 2018, 2017 and 2016 | 73 |
| — Consolidated Statements of Shareholders’ Equity for the Years Ended December 31, 2018, 2017 and 2016 | 74 |
| — Notes to Consolidated Financial Statements | 75 |
(2) Financial Statement Schedule:
SCHEDULE II—VALUATION AND QUALIFYING ACCOUNTS AND RESERVES
| Additions | |||||||||||||||||||
| Balance at Beginning of Period | Charged to Costs and Expenses | Deductions | Other Activity | Balance at End of Period | |||||||||||||||
| (in millions) | |||||||||||||||||||
| December 31, 2018: | |||||||||||||||||||
| Allowance for doubtful accounts | $ | 34 | $ | 9 | $ | (7 | ) | $ | 2 | $ | 38 | ||||||||
| Tax valuation allowance (a) | $ | 1,008 | $ | 292 | $ | (120 | ) | $ | (2 | ) | $ | 1,178 | |||||||
| December 31, 2017: | |||||||||||||||||||
| Allowance for doubtful accounts | $ | 33 | $ | 23 | $ | (24 | ) | $ | 2 | $ | 34 | ||||||||
| Tax valuation allowance (a) | $ | 1,399 | $ | — | $ | (406 | ) | $ | 15 | $ | 1,008 | ||||||||
| December 31, 2016: | |||||||||||||||||||
| Allowance for doubtful accounts | $ | 18 | $ | 22 | $ | (6 | ) | $ | (1 | ) | $ | 33 | |||||||
| Tax valuation allowance (a) | $ | 706 | $ | 706 | $ | — | $ | (13 | ) | $ | 1,399 |
| (a) | Additions Charged to Costs and Expenses are primarily related to taxable losses for which the tax benefit has been reserved. |
The other schedules have been omitted because they are not applicable, not required or the information to be set forth therein is included in the Consolidated Financial Statements or notes thereto.
(3) Exhibits: (including those incorporated by reference)
- Filed herewith.
+ Management contract or compensatory plan or arrangement.
(1) Filed with the Registration Statement on Form S-1 (File No. 333-174493) on June 30, 2011 and incorporated herein by reference.
(2) Filed with Form 10-Q for the period ended June 30, 2012 on July 31, 2012 and incorporated herein by reference.
(3) Filed with Form 10-Q for the period ended September 30, 2012 on November 1, 2012 and incorporated herein by reference.
(4) Filed with Form 10-K for the year ended December 31, 2013 on February 10, 2014 and incorporated herein by reference.
(5) Filed with Form 10-Q for the period ended March 31, 2015 on April 30, 2015 and incorporated herein by reference.
(6) Filed with Form 10-Q for the period ended March 31, 2016 on May 4, 2016 and incorporated herein by reference.
(7) Filed with Form 10-Q for the period ended June 30, 2016 on August 3, 2016 and incorporated herein by reference.
(8) Filed with Form 10-K for the year ended December 31, 2016 on February 6, 2017 and incorporated herein by reference.
(9) Filed with Form 10-Q for the period ended March 31, 2018 on May 2, 2018 and incorporated herein by reference.
Filed electronically with the Report.
SIGNATURES
Pursuant to the requirements of Section 13 or 15(d) of the Securities Exchange Act of 1934, the registrant has duly caused this report to be signed on its behalf by the undersigned, thereunto duly authorized.
| APTIV PLC | ||
| /s/ Joseph R. Massaro | ||
| By: Joseph R. Massaro | ||
| Senior Vice President and | ||
| Chief Financial Officer |
Dated: February 4, 2019
Pursuant to the requirements of the Securities Exchange Act of 1934, this report has been signed below as of February 4, 2019, by the following persons on behalf of the registrant and in the capacities indicated:
| Signature | Title | |
| /s/ Kevin P. Clark | President, Chief Executive Officer and Director (Principal Executive Officer) | |
| Kevin P. Clark | ||
| /s/ Joseph R. Massaro | Senior Vice President and Chief Financial Officer (Principal Financial Officer) | |
| Joseph R. Massaro | ||
| /s/ Allan J. Brazier | Vice President and Chief Accounting Officer (Principal Accounting Officer) | |
| Allan J. Brazier | ||
| /s/ Rajiv L. Gupta | Chairman of the Board of Directors | |
| Rajiv L. Gupta | ||
| /s/ Nancy E. Cooper | Director | |
| Nancy E. Cooper | ||
| /s/ Frank J. Dellaquila | Director | |
| Frank J. Dellaquila | ||
| /s/ Nicholas M. Donofrio | Director | |
| Nicholas M. Donofrio | ||
| /s/ Mark P. Frissora | Director | |
| Mark P. Frissora | ||
| /s/ Sean O. Mahoney | Director | |
| Sean O. Mahoney |
| /s/ Robert K. Ortberg | Director | |
| Robert K. Ortberg | ||
| /s/ Colin J. Parris | Director | |
| Colin J. Parris | ||
| /s/ Ana G. Pinczuk | Director | |
| Ana G. Pinczuk | ||
| /s/ Thomas W. Sidlik | Director | |
| Thomas W. Sidlik | ||
| /s/ Lawrence A. Zimmerman | Director | |
| Lawrence A. Zimmerman | ||