 filings.tools
Item 2. MANAGEMENT’S DISCUSSION AND ANALYSIS OF FINANCIAL CONDITION AND RESULTS OF OPERATIONS
331K characters. Original on sec.gov · Markdown
Item 2. MANAGEMENT’S DISCUSSION AND ANALYSIS OF FINANCIAL CONDITION AND RESULTS OF OPERATIONS
Forward-looking statements
Certain information and statements included in this quarterly report on Form 10-Q, including, without limitation, statements containing the words “forecast,” “guidance,” “goals,” “projects,” “estimates,” “anticipates,” “believes,” “expects,” “intends,” “may,” “plans,” “seeks,” “should,” “targets,” or “will,” or the negative of those words or similar words, constitute “forward-looking statements” within the meaning of Section 27A of the Securities Act of 1933, as amended, and Section 21E of the Securities Exchange Act of 1934, as amended. Forward-looking statements involve inherent risks and uncertainties regarding events, conditions, and financial trends that may affect our future plans of operations, business strategy, results of operations, and financial position. A number of important factors could cause actual results to differ materially from those included within or contemplated by the forward-looking statements, including, but not limited to, the following:
-
Operating factors, such as a failure to operate our business successfully in comparison to market expectations or in comparison to our competitors, our inability to obtain capital when desired or refinance debt maturities when desired, and/or a failure to maintain our status as a REIT for federal tax purposes;
-
Market and industry factors, such as adverse developments concerning the life science industry and/or our tenants;
-
Government factors, such as any unfavorable effects resulting from federal, state, local, and/or foreign government policies, laws, and/or funding levels;
-
Global factors, such as negative economic, social, political, financial, credit market, banking conditions, and/or regional armed hostilities; and
-
Other factors, such as climate change, cyber intrusions, and/or changes in laws, regulations, and financial accounting standards.
This list of risks and uncertainties is not exhaustive. Additional information regarding risk factors that may affect us is included under Part I; “Item 1A. Risk factors”; and “Item 7. Management’s discussion and analysis of financial condition and results of operations” in our annual report on Form 10-K for the year ended December 31, 2023 and under respective sections in this quarterly report on Form 10-Q. Readers of this quarterly report on Form 10-Q should also read our other documents filed publicly with the SEC for further discussion regarding such factors.
Overview
We are a Maryland corporation formed in October 1994 that has elected to be taxed as a REIT for federal income tax purposes. Alexandria Real Estate Equities, Inc. (NYSE: ARE), an S&P 500® company, is a best-in-class, mission-driven life science REIT making a positive and lasting impact on the world. As the pioneer of the life science real estate niche since our founding in 1994, Alexandria is the preeminent and longest-tenured owner, operator, and developer of collaborative life science mega campuses in AAA innovation cluster locations, including Greater Boston, the San Francisco Bay Area, San Diego, Seattle, Maryland, Research Triangle, and New York City. Alexandria has a total market capitalization of $34.4 billion and an asset base in North America of 74.1 million SF as of March 31, 2024, which includes 42.2 million RSF of operating properties, 5.3 million RSF of Class A/A+ properties undergoing construction and one committed near-term project expected to commence construction in the next two years, 2.5 million RSF of priority anticipated development and redevelopment projects, and 24.1 million SF of future development projects. Alexandria has a longstanding and proven track record of developing Class A/A+ properties clustered in life science mega campuses that provide our innovative tenants with highly dynamic and collaborative environments that enhance their ability to successfully recruit and retain world-class talent and inspire productivity, efficiency, creativity, and success. Alexandria also provides strategic capital to transformative life science companies through our venture capital platform. We believe our unique business model and diligent underwriting ensure a high-quality and diverse tenant base that results in higher occupancy levels, longer lease terms, higher rental income, higher returns, and greater long-term asset value.
As of March 31, 2024:
-
Investment-grade or publicly traded large cap tenants represented 52% of our total annual rental revenue;
-
Approximately 96% of our leases (on an annual rental revenue basis) contained effective annual rent escalations approximating 3.0% that were either fixed or indexed based on a consumer price index or other index;
-
Approximately 94% of our leases (on an annual rental revenue basis) were triple net leases, which require tenants to pay substantially all real estate taxes, insurance, utilities, repairs and maintenance, common area expenses, and other operating expenses (including increases thereto) in addition to base rent; and
-
Approximately 93% of our leases (on an annual rental revenue basis) provided for the recapture of capital expenditures (such as HVAC maintenance and/or replacement, roof replacement, and parking lot resurfacing) that we believe would typically be borne by the landlord in traditional office leases.
Our primary business objective is to maximize long-term asset value and stockholder returns based on a multifaceted platform of internal and external growth. A key element of our strategy is our unique focus on Class A/A+ properties located in collaborative life science mega campuses in AAA innovation clusters. These key campus locations are generally characterized by high barriers to entry for new landlords, high barriers to exit for tenants, and a limited supply of available space. They generally represent highly desirable locations for tenancy by life science entities because of their close proximity to concentrations of specialized skills, knowledge, institutions, and related businesses. Our strategy also includes drawing upon our deep and broad real estate and life science relationships in order to identify and attract new and leading tenants and to source additional value-creation real estate.
Executive summary
Operating results
| Three Months Ended March 31, | |||||||||||||||||||||||
| 2024 | 2023 | ||||||||||||||||||||||
| Net income attributable to Alexandria’s common stockholders – diluted: | |||||||||||||||||||||||
| In millions | $ | 166.9 | $ | 75.3 | |||||||||||||||||||
| Per share | $ | 0.97 | $ | 0.44 | |||||||||||||||||||
| Funds from operations attributable to Alexandria’s common stockholders – diluted, as adjusted: | |||||||||||||||||||||||
| In millions | $ | 403.9 | $ | 373.7 | |||||||||||||||||||
| Per share | $ | 2.35 | $ | 2.19 |
For additional information, refer to “Funds from operations and funds from operations, as adjusted, attributable to Alexandria Real Estate Equities, Inc.’s common stockholders” under “Definitions and reconciliations” and to the tabular presentation of these items in “Results of operations” in Item 2.
An operationally excellent, industry-leading REIT with a high-quality, diverse client base to support growing revenues, stable cash flows, and strong margins
| Percentage of annual rental revenue in effect from mega campuses as of March 31, 2024 | 74 | % | ||||||||||||
| Percentage of annual rental revenue in effect from investment-grade or publicly traded large cap tenants as of March 31, 2024 | 52 | % | ||||||||||||
| Sustained strength in tenant collections: | ||||||||||||||
| Tenant receivables as of March 31, 2024 represent 1.0% of rental revenues | $ | 7.5 | million | |||||||||||
| April 2024 tenant rents and receivables collected as of the date of this report | 99.7 | % | ||||||||||||
| Tenant rents and receivables for the three months ended March 31, 2024 collected as of the date of this report | 99.9 | % | ||||||||||||
| Occupancy of operating properties in North America as of March 31, 2024 | 94.6 | % | ||||||||||||
| Adjusted EBITDA margin for the three months ended March 31, 2024 | 72 | % | ||||||||||||
| Weighted-average remaining lease term as of March 31, 2024: | ||||||||||||||
| Top 20 tenants | 9.7 | years | ||||||||||||
| All tenants | 7.5 | years |
Strong leasing volume and rental rate increases
-
Strong rental rate increases of 33.0% and 19.0% (cash basis).
-
Strong leasing volume aggregating 1.1 million RSF for the three months ended March 31, 2024.
-
77% of our leasing activity during the last twelve months was generated from our existing tenant base.
| Three Months Ended March 31, 2024 | ||||||||||||||
| Total leasing activity – RSF | 1,142,857 | |||||||||||||
| Leasing of development and redevelopment space – RSF | 100,232 | |||||||||||||
| Lease renewals and re-leasing of space: | ||||||||||||||
| RSF (included in total leasing activity above) | 994,770 | |||||||||||||
| Rental rate increase | 33.0% | |||||||||||||
| Rental rate increase (cash basis) | 19.0% | |||||||||||||
Continued solid net operating income and internal growth
-
Total revenues of $769.1 million, up 9.7%, for the three months ended March 31, 2024, compared to $700.8 million for the three months ended March 31, 2023.
-
Net operating income (cash basis) of $1.9 billion for the three months ended March 31, 2024 annualized, increased by $132.7 million, or 7.6%, compared to the three months ended March 31, 2023 annualized. Refer to “Net operating income, net operating income (cash basis), and operating margin” under “Definitions and reconciliations” in Item 2 for a reconciliation of our net income to net operating income (cash basis).
-
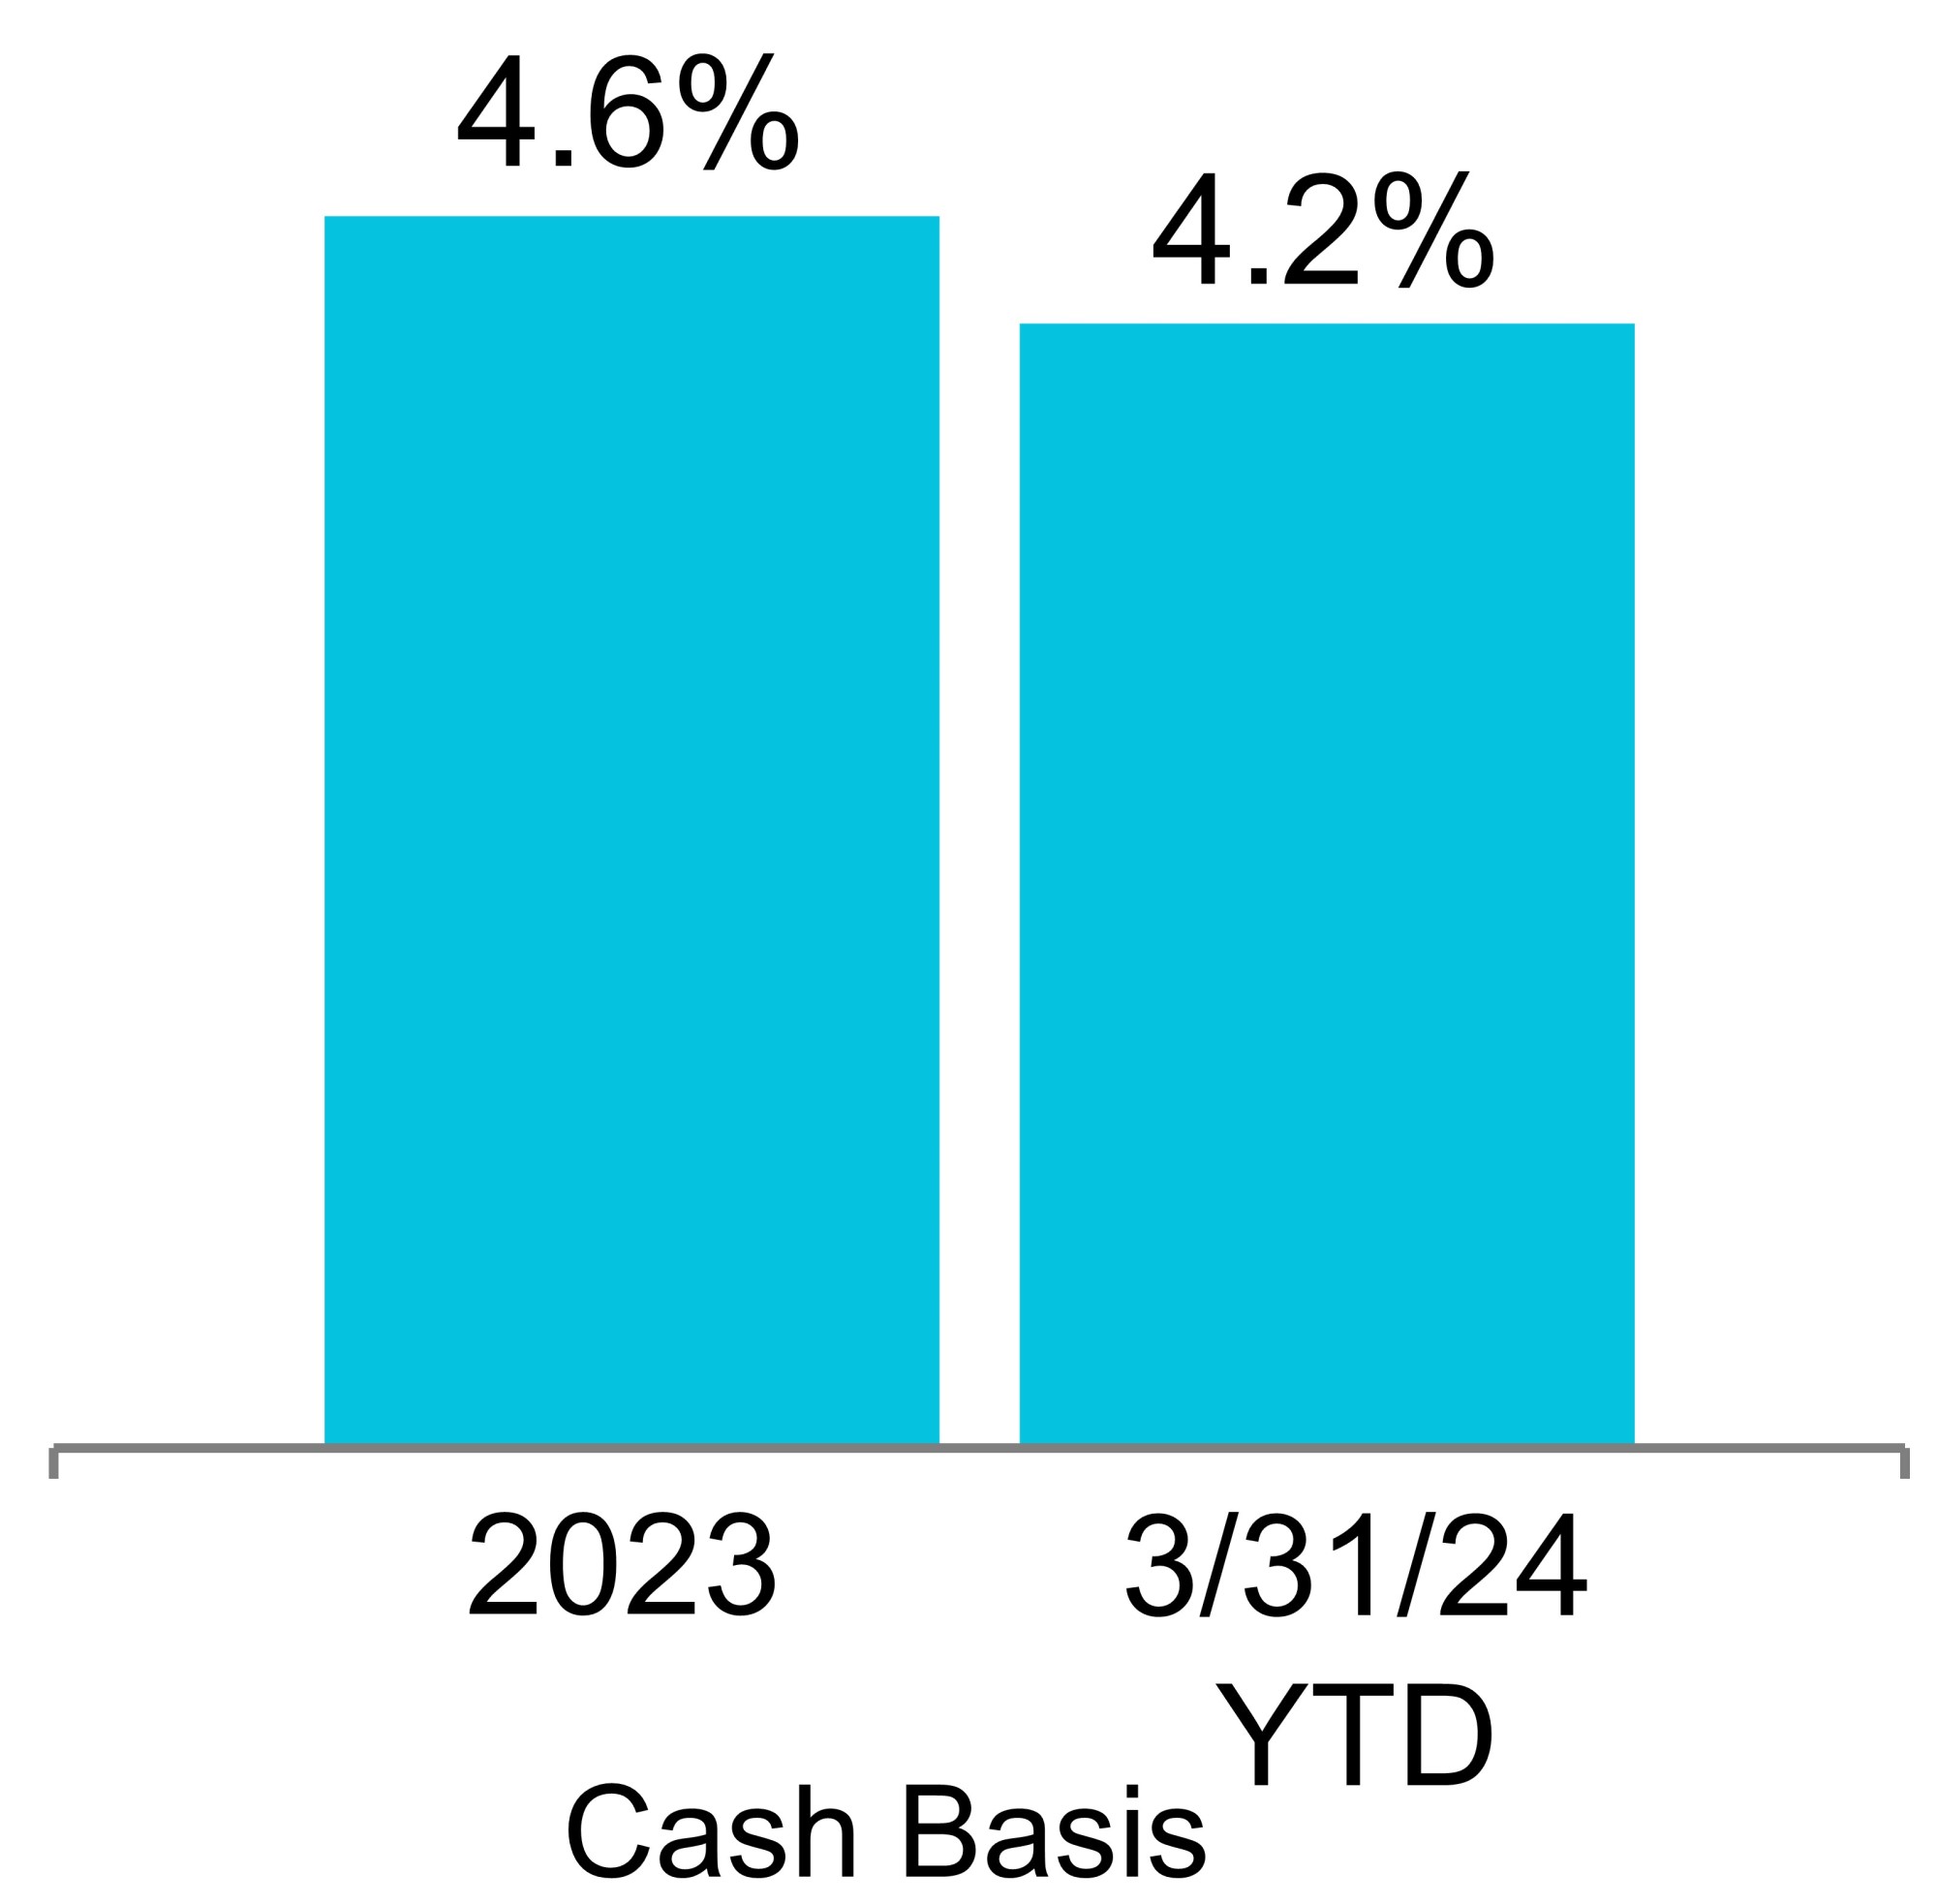
Same property net operating income growth 1.0% and 4.2% (cash basis) for the three months ended March 31, 2024, compared to the three months ended March 31, 2023.
-
96% of our leases contain contractual annual rent escalations approximating 3%.
Strong and flexible balance sheet with significant liquidity; top 10% credit rating ranking among all publicly traded U.S. REITs
-
As of March 31, 2024, our credit ratings from S&P Global Ratings and Moody’s Investors Service were BBB+ and Baa1, respectively, which rank in the top 10% among all publicly traded U.S. REITs.
-
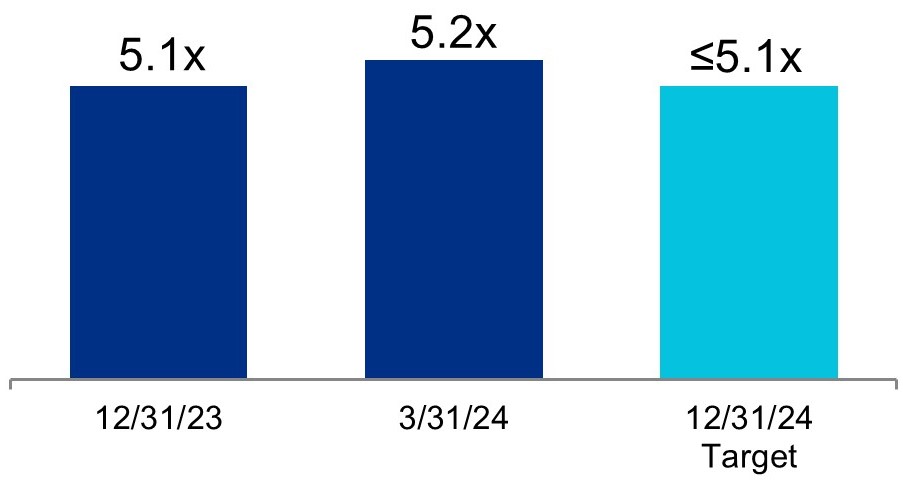
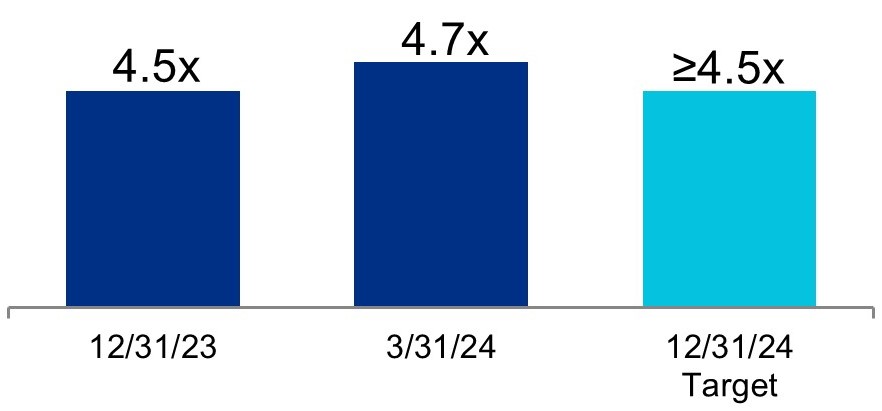
Net debt and preferred stock to Adjusted EBITDA of 5.2x and fixed-charge coverage ratio of 4.7x for the three months ended March 31, 2024 annualized.
-
Significant liquidity of $6.0 billion.
-
32% of our total debt matures in 2049 and beyond.
-
13.4 years weighted-average remaining term of debt.
-
98.9% of our debt has a fixed rate.
-
Total debt and preferred stock to gross assets of 28%.
-
$1.3 billion of expected capital contribution commitments from existing consolidated real estate joint venture partners to fund construction from April 1, 2024 through 2027.
Consistent dividend strategy with a focus on retaining significant net cash flows from operating activities after dividends for reinvestment
-
Common stock dividend declared for the three months ended March 31, 2024 of $1.27 per common share, aggregating $5.02 per common share for the twelve months ended March 31, 2024, up 24 cents, or 5%, over the twelve months ended March 31, 2023.
-
Dividend yield of 3.9% as of March 31, 2024.
-
Dividend payout ratio of 54% for the three months ended March 31, 2024.
-
Average annual dividend per-share growth of 5% from 2020 through the three months ended March 31, 2024 annualized.
-
Significant net cash flows from operating activities after dividends retained for reinvestment aggregating $2.1 billion for the years ended December 31, 2020 through 2023 and for the midpoint of our 2024 guidance range for net cash provided by operating activities after dividends.
Strong balance sheet management
Key capital metrics as of or for the three months ended March 31, 2024
| March 31, 2024 | Target for Fourth Quarter of 2024 Annualized | |||||||||||||||||||||||||
| Quarter Annualized | Trailing 12 Months | |||||||||||||||||||||||||
| Net debt and preferred stock to Adjusted EBITDA | 5.2x | 5.6x | Less than or equal to 5.1x | |||||||||||||||||||||||
| Fixed-charge coverage ratio | 4.7x | 4.7x | Greater than or equal to 4.5x |
-
$34.4 billion in total market capitalization.
-
$22.2 billion in total equity capitalization, which ranks in the top 10% among all publicly traded U.S. REITs.
-
As of March 31, 2024, our non-real estate investments aggregated $1.5 billion:
-
Unrealized gains presented in our consolidated balance sheet were $220.2 million, comprising gross unrealized gains and losses aggregating $320.4 million and $100.2 million, respectively.
-
Investment income of $43.3 million for the three months ended March 31, 2024 presented in our consolidated statement of operations consisted of $28.8 million of realized gains, partially offset by impairment charges of $14.7 million, and $29.2 million of unrealized gains.
Key capital events
-
In February 2024, we issued $1.0 billion of unsecured senior notes payable with a weighted-average interest rate of 5.48% and a weighted-average maturity of 23.1 years. The unsecured senior notes include:
-
$400.0 million of 5.25% unsecured senior notes due 2036; and
-
$600.0 million of 5.625% unsecured senior notes due 2054.
-
In January 2024, our ATM program became inactive upon expiration of the associated shelf registration. In February 2024, we entered into a new ATM common stock offering program, which allows us to sell up to an aggregate of $1.5 billion of our common stock. As of the date of this report, the full amount remained available for future sales of our common stock.
External growth and investments in real estate
Alexandria’s highly leased value-creation pipeline delivered incremental annual net operating income of $26 million, commencing during the three months ended March 31, 2024, and will drive future incremental annual net operating income aggregating $480 million
-
During the three months ended March 31, 2024, we placed into service development and redevelopment projects aggregating 343,445 RSF that are 100% leased across multiple submarkets and delivered incremental annual net operating income of $26 million. Deliveries during the three months ended March 31, 2024 include:
-
100,624 RSF at 500 North Beacon Street located on The Arsenal on the Charles mega campus in our Cambridge/Inner Suburbs submarket;
-
115,598 RSF at the Alexandria Center® for Advanced Technologies – Monte Villa Parkway in our Bothell submarket; and
-
72,846 RSF at 99 Coolidge Avenue in our Cambridge/Inner Suburbs submarket.
-
Annual net operating income (cash basis) is expected to increase by $101 million upon the burn-off of initial free rent from recently delivered projects. Initial free rent has a weighted-average burn-off period of approximately seven months.
-
69% of the RSF in our total value-creation pipeline is within our mega campuses.
| Development and Redevelopment Projects | Incremental Annual Net Operating Income | RSF | Leased/Negotiating Percentage | |||||||||||||||||||||||||||||
| (dollars in millions) | ||||||||||||||||||||||||||||||||
| Placed into service during three months ended March 31, 2024 | $ | 26 | 343,445 | 100 | % | |||||||||||||||||||||||||||
| Expected to be placed into service(1): | ||||||||||||||||||||||||||||||||
| Second quarter of 2024 through fourth quarter of 2024 | $ | 120 | (2) | 5,541,380 | 63 | % | ||||||||||||||||||||||||||
| Fiscal year 2025 | 109 | (3) | (4) | |||||||||||||||||||||||||||||
| First quarter of 2026 through fourth quarter of 2027 | 251 | |||||||||||||||||||||||||||||||
| $ | 480 | |||||||||||||||||||||||||||||||
(1)Represents expected incremental annual net operating income to be placed into service from deliveries of projects undergoing construction and one committed near-term project expected to commence construction in the next two years, including partial deliveries of projects that stabilize in future years.
(2)Includes 1.2 million RSF that is expected to stabilize in 2024 and is 98% leased/negotiating. Refer to the initial and stabilized occupancy years under “New Class A/A+ development and redevelopment properties: current projects” in Item 2 for additional details.
(3)In addition to the projects represented, we are evaluating one priority anticipated development project that could commence active construction in 2024 and may have initial delivery in 2025.
(4)72% of the leased RSF of our value-creation projects was generated from our existing tenant base.
Industry and corporate responsibility leadership: catalyzing and leading the way for positive change to benefit human health and society
-
In March 2024, Alexandria was named one of *Newsweek’*s Most Trustworthy Companies in America for the second consecutive year based on three touchpoints of trust: customer trust, investor trust, and employee trust. On the 2024 list, Alexandria holds the top rank among the three S&P 500 REITs recognized in the real estate and housing category.
-
In March 2024, Alexandria’s executive chairman and founder, Joel S. Marcus, was selected to receive the inaugural Bisnow Life Sciences Icon & Influencer Award. This prestigious award highlights Mr. Marcus and the company's significant contributions to and lasting impact on the life science real estate sector and broader life science industry. Mr. Marcus will accept the award on behalf of Alexandria at Bisnow's International Life Sciences & Biotech Conference in September 2024.
-
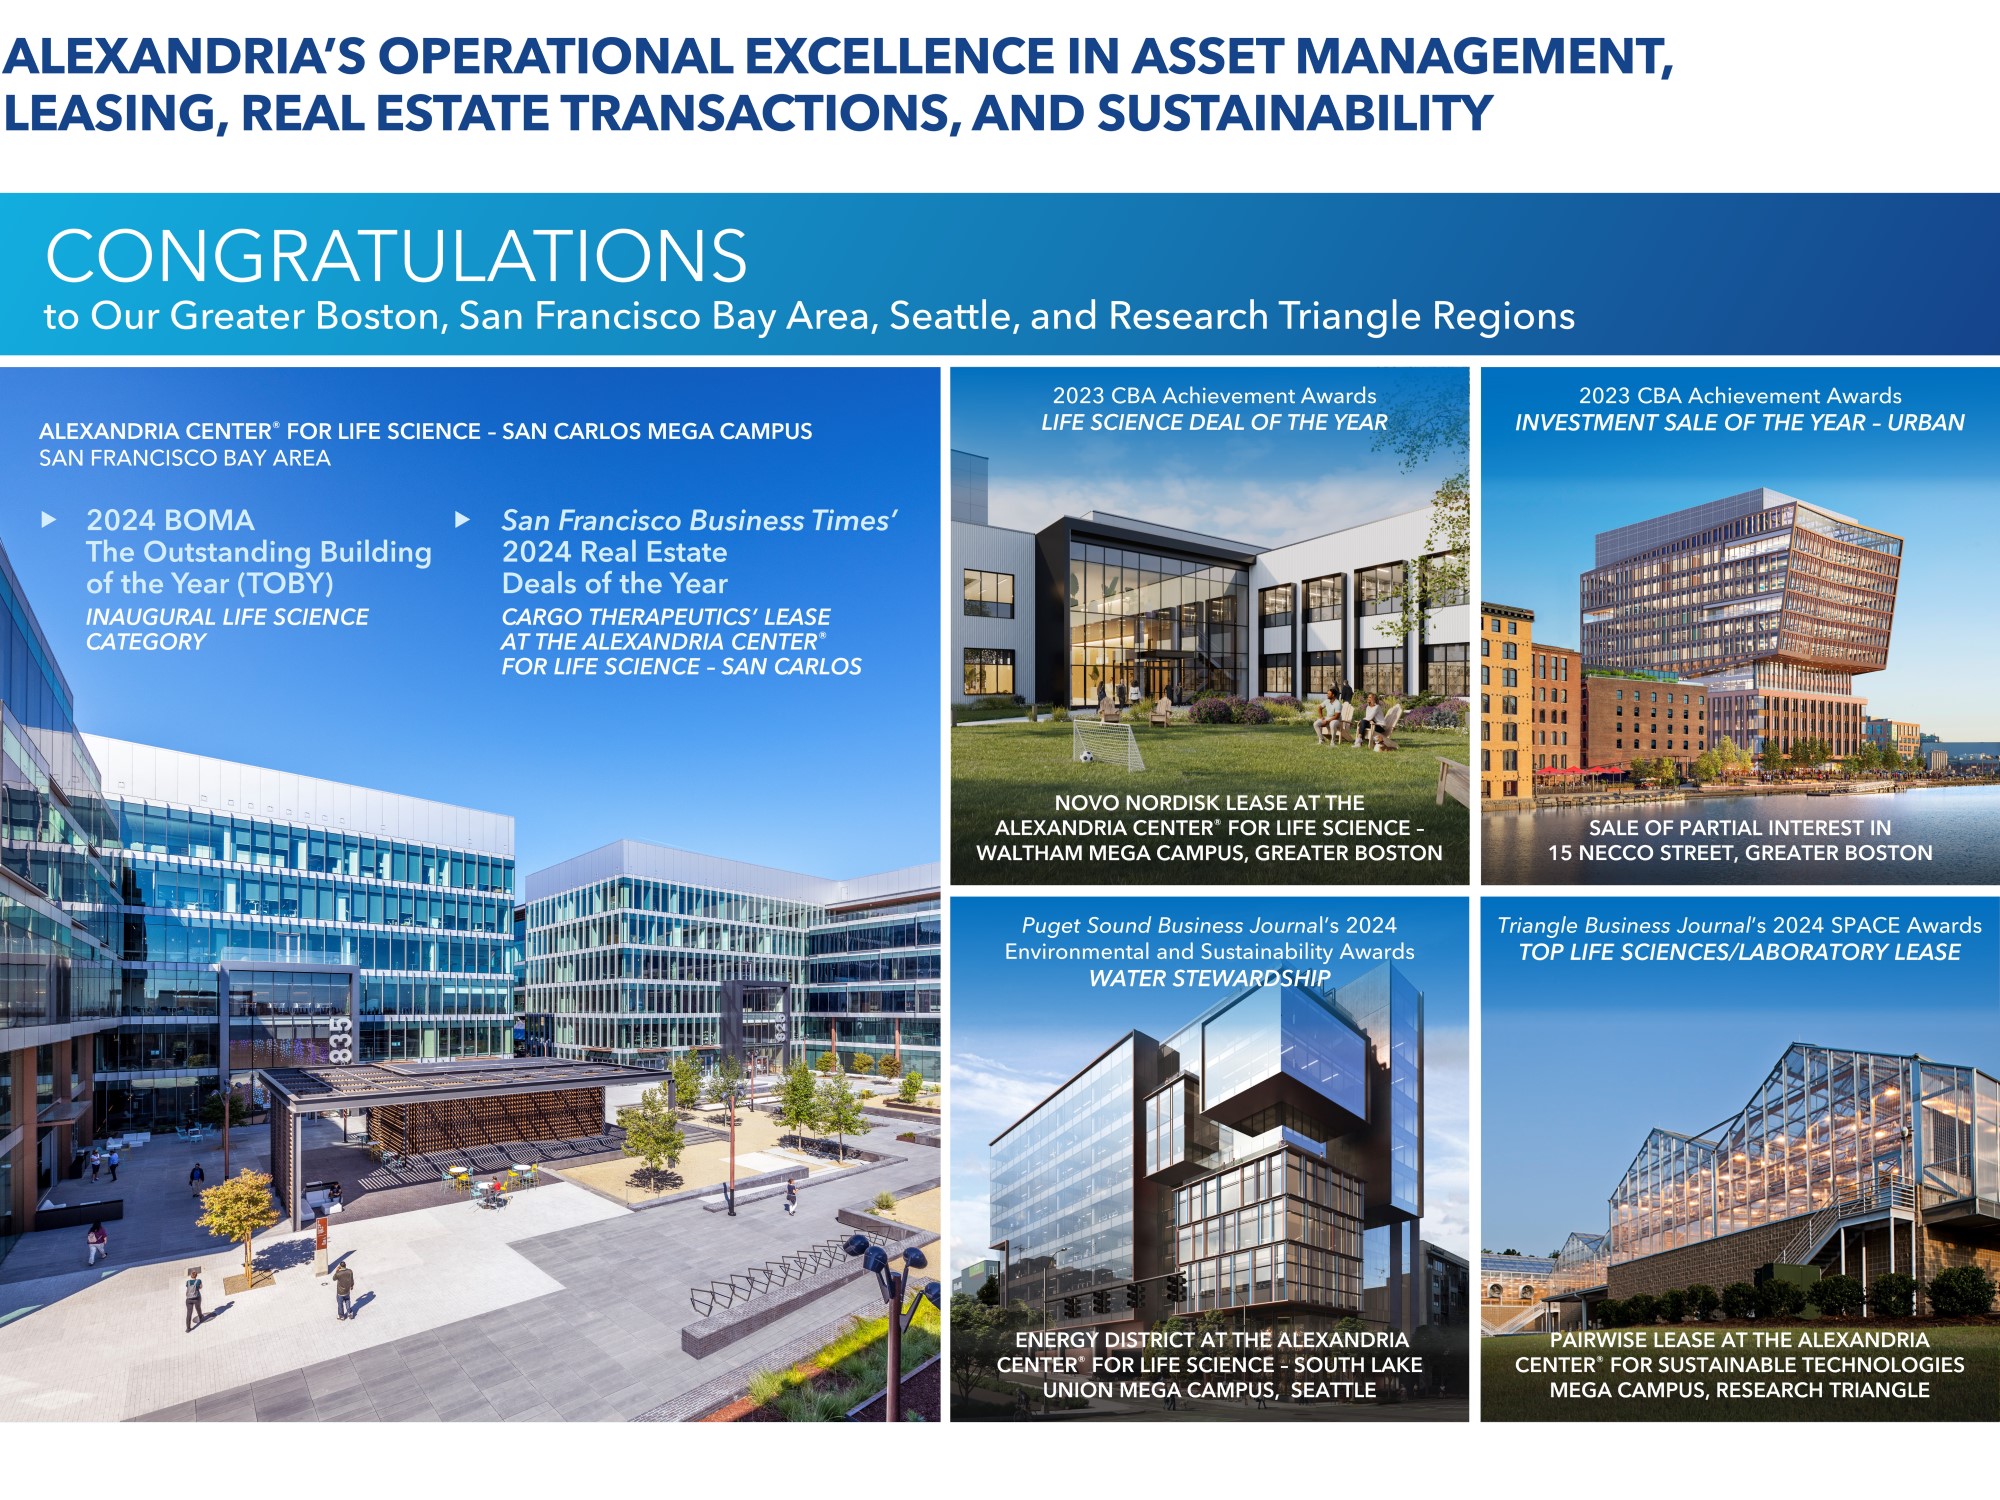
During three months ended March 31, 2024, Alexandria earned several awards in recognition of operational excellence in asset management, leasing, real estate transactions, and sustainability across our regions:
-
In our Greater Boston market, Alexandria won two 2023 Commercial Broker Association Achievement Awards: Life Science Deal of the Year for our lease with Novo Nordisk at 60 Sylvan Road on the Alexandria Center® for Life Science – Waltham mega campus and Investment Sale of the Year – Urban for our strategic sale of partial interest in 15 Necco Street.
-
In our San Francisco Bay Area market, the Alexandria Center® for Life Science – San Carlos mega campus won a TOBY (The Outstanding Building of the Year) Award from BOMA (Building Owners and Managers Association) in the region’s new Life Science category. Alexandria also received a San Francisco Business Times’ 2024 Real Estate Deal of the Year Award for our lease with CARGO Therapeutics, a clinical-stage biotechnology company, at 835 Industrial Road on this mega campus.
-
In our Seattle market, Alexandria was an honoree in the Water Stewardship category of the Puget Sound Business Journal’s 2024 Environmental and Sustainability Awards in recognition of our implementation of an innovative energy district at the Alexandria Center® for Life Science – South Lake Union mega campus featuring one of the largest wastewater heat recovery systems in North America. This wastewater heat recovery system, which will provide an alternative energy source to heat our buildings and enhance building resilience and operating performance, demonstrates our continued focus on reducing greenhouse gas emissions in our laboratory facilities.
-
In our Research Triangle market, we earned the Top Life Sciences/Laboratory Lease in the *Triangle Business Journal’*s 2024 SPACE Awards for our lease with Pairwise, a health-focused food and agriculture company, at 110 and 112 TW Alexander Drive on the Alexandria Center® for Sustainable Technologies mega campus. The annual SPACE Awards recognize the Research Triangle’s top commercial real estate developments and transactions.
-
In February 2024, Alexandria, in partnership with former congressman Patrick J. Kennedy and The Kennedy Forum, held its second Alexandria Summit® on Mental Health in Washington, DC. Alexandria convened a diverse set of key decision makers, influential life science industry thought leaders, members of Congress, regulatory agency executives, and other key policymakers to advance the development of novel, effective psychiatric therapies to address vast unmet need.
-
During the three months ended December 31, 2023, we retired our 2025 environmental goals, which had previously been set to decrease carbon emissions, energy use, and potable water consumption and to improve waste diversion by 2025 compared to 2015 baselines. We are currently considering establishing new targets for reducing greenhouse gas emissions.


Operating summary
| Historical Same Property Net Operating Income Growth | Historical Rental Rate Growth: Renewed/Re-Leased Space | |||||||||||||||||||||||||||||||
 |  |  |  | |||||||||||||||||||||||||||||
| Margins**(1)** | Favorable Lease Structure**(2)** | |||||||||||||||||||||||||||||||
| Operating | Adjusted EBITDA | Strategic Lease Structure by Owner and Operator of Collaborative Life Science Mega Campuses | ||||||||||||||||||||||||||||||
| 72% | 72% | Increasing cash flows | ||||||||||||||||||||||||||||||
| Percentage of leases containing annual rent escalations | 96% | |||||||||||||||||||||||||||||||
| Stable cash flows | ||||||||||||||||||||||||||||||||
| Weighted-Average Lease Term of Executed Leases**(3)** | Percentage of triple net leases | 94% | ||||||||||||||||||||||||||||||
| Lower capex burden | ||||||||||||||||||||||||||||||||
| 8.8 years | Percentage of leases providing for the recapture of capital expenditures | 93% | ||||||||||||||||||||||||||||||
| Net Debt and Preferred Stock to Adjusted EBITDA**(4)** | Fixed-Charge Coverage Ratio**(4)** | |||||||||||||||||||||||||||||||
 |  | |||||||||||||||||||||||||||||||
Refer to “Same properties” and “Definitions and reconciliations” in Item 2 for additional details. “Definitions and reconciliations” contains the definitions of “Fixed-charge coverage ratio,” “Net debt and preferred stock to Adjusted EBITBA,” and “Net operating income” and their respective reconciliations from the most directly comparable financial measures presented in accordance with GAAP.
(1)For the three months ended March 31, 2024.
(2)Percentages calculated based on our annual rental revenue in effect as of March 31, 2024.
(3)Represents the weighted-average lease term of executed leases for the 10-year period from December 31, 2015 through March 31, 2024.
(4)Quarter annualized.
| Stable Cash Flows From Our High-Quality and Diverse Mix of Approximately 800 Tenants | ||||||||||||||||||||
 | Investment-Grade or Publicly Traded Large Cap Tenants | |||||||||||||||||||
| 92% | ||||||||||||||||||||
| of ARE’s Top 20 Tenant Annual Rental Revenue | ||||||||||||||||||||
| 52% | ||||||||||||||||||||
| Percentage of ARE’s Annual Rental Revenue | of ARE’s Annual Rental Revenue | |||||||||||||||||||
| Solid Historical Occupancy of 96% Over Past 10 Years**(3)** From Historically Strong Demand for Our Class A/A+ Properties in AAA Locations | ||||||||||||||||||||
| Mega Campuses | Occupancy Across Key Locations | |||||||||||||||||||
 | 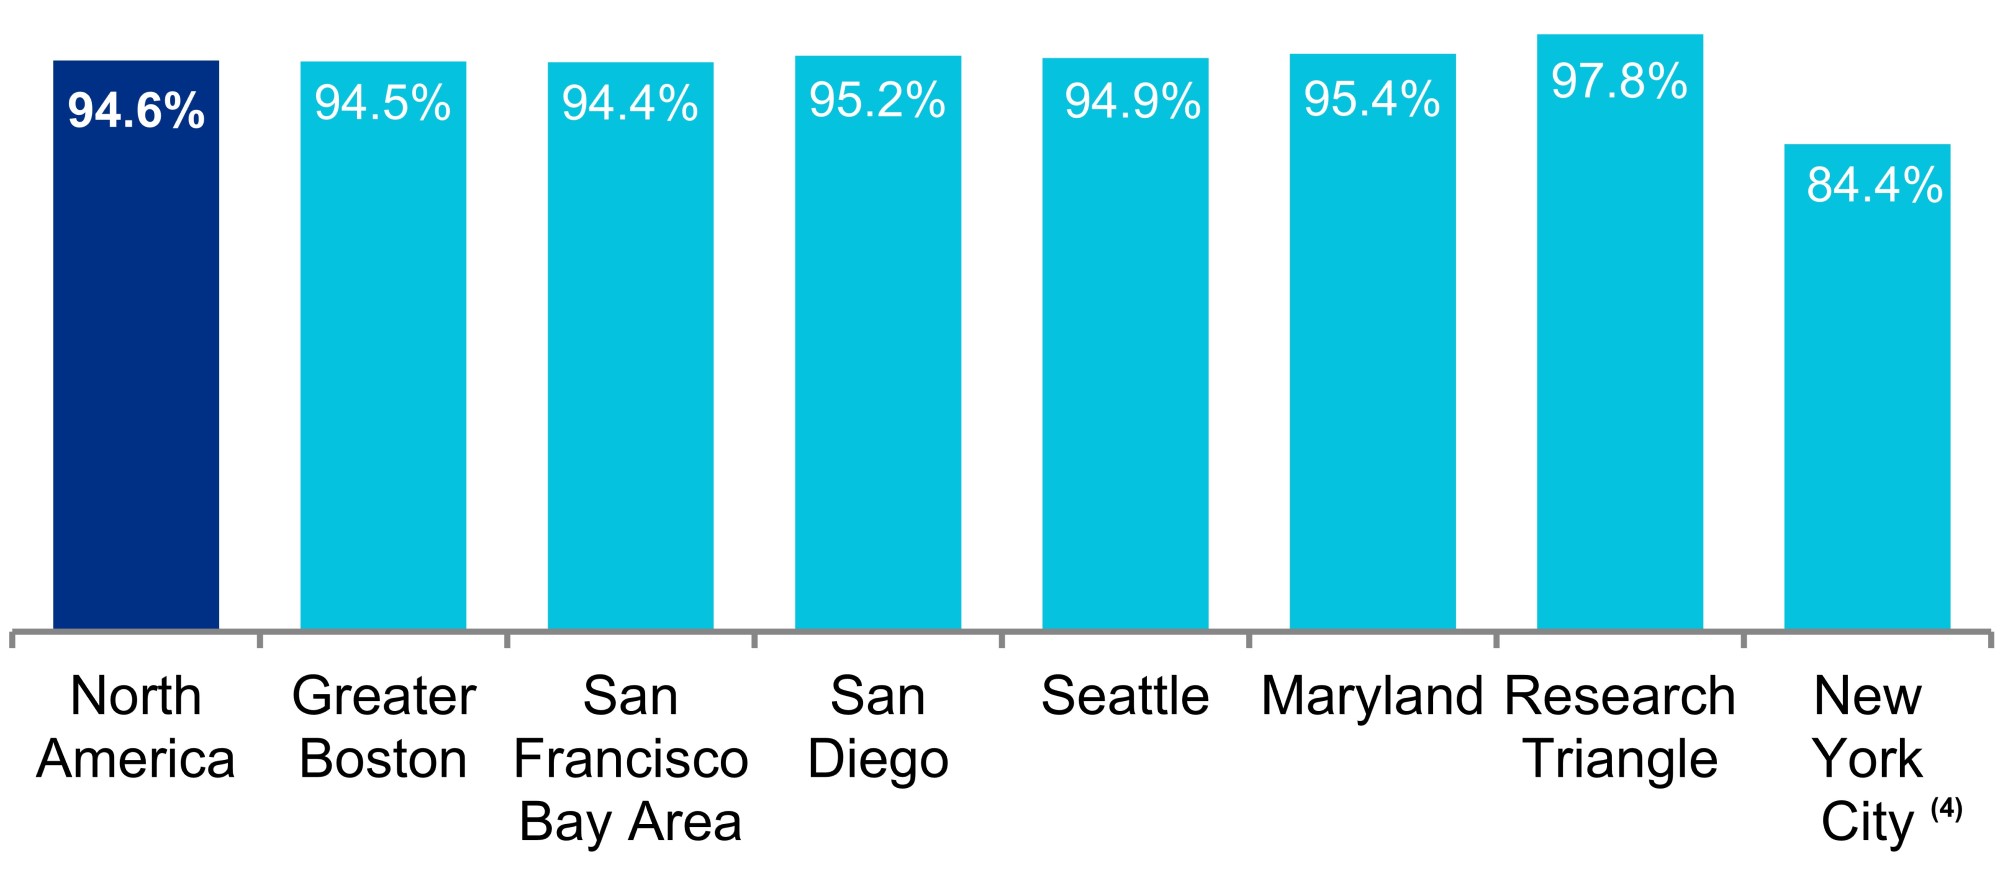 | |||||||||||||||||||
| Percentage of ARE’s Annual Rental Revenue |
As of March 31, 2024. Annual rental revenue represents amounts in effect as of March 31, 2024. Refer to “Definitions and reconciliations” in Item 2 for additional information.
(1)Represents annual rental revenue currently generated from space that is targeted for a future change in use to laboratory space, including 1.0% of annual rental revenue that is generated from covered land play projects for future development opportunities. The weighted-average remaining term of these leases is 3.6 years.
(2)Represents the percentage of our annual rental revenue generated by “Other” tenants, which comprise technology, professional services, finance, telecommunications, and construction/real estate companies, and (by less than 1.0% of our annual rental revenue) retail-related tenants.
(3)Represents average occupancy of operating properties as of each December 31 from 2015 through 2023 and as of March 31, 2024.
(4)Refer to footnote 1 under “Summary of occupancy percentages in North America” in Item 2 for additional details.
| Long-Duration and Stable Cash Flows From High-Quality and Diverse Tenants | ||||||||
| Long-Duration Lease Terms | ||||||||
| 9.7 Years | ||||||||
| Top 20 Tenants | ||||||||
| 7.5 Years | ||||||||
| All Tenants | ||||||||
| Weighted-Average Remaining Term(1) | ||||||||
| Sustained Strength in Tenant Collections(2) | ||||||||
| 99.9% | ||||||||
| For the Three Months Ended March 31, 2024 | ||||||||
| 99.7% | ||||||||
| April 2024 |
(1)Based on annual rental revenue in effect as of March 31, 2024.
(2)Represents the portion of total receivables billed for each period collected through the date of this report.
Leasing
The following table summarizes our leasing activity at our properties:
| Three Months Ended | Year Ended | ||||||||||||||||||||||||||||||||||||||||||||||
| March 31, 2024 | December 31, 2023 | ||||||||||||||||||||||||||||||||||||||||||||||
| Including Straight-Line Rent | Cash Basis | Including Straight-Line Rent | Cash Basis | ||||||||||||||||||||||||||||||||||||||||||||
| (Dollars per RSF) | |||||||||||||||||||||||||||||||||||||||||||||||
| Leasing activity: | |||||||||||||||||||||||||||||||||||||||||||||||
| Renewed/re-leased space(1) | |||||||||||||||||||||||||||||||||||||||||||||||
| Rental rate changes | 33.0% | (2) | 19.0% | (2) | 29.4% | 15.8% | |||||||||||||||||||||||||||||||||||||||||
| New rates | $81.17 | $78.61 | $52.35 | $50.82 | |||||||||||||||||||||||||||||||||||||||||||
| Expiring rates | $61.01 | $66.04 | $40.46 | $43.87 | |||||||||||||||||||||||||||||||||||||||||||
| RSF | 994,770 | 3,046,386 | |||||||||||||||||||||||||||||||||||||||||||||
| Tenant improvements/leasing commissions | $21.97 | $26.09 | |||||||||||||||||||||||||||||||||||||||||||||
| Weighted-average lease term | 8.5 years | 8.7 years | |||||||||||||||||||||||||||||||||||||||||||||
| Developed/redeveloped/ previously vacant space leased(3) | |||||||||||||||||||||||||||||||||||||||||||||||
| New rates | $76.63 | $76.79 | $65.66 | $59.74 | |||||||||||||||||||||||||||||||||||||||||||
| RSF | 148,087 | 1,259,686 | |||||||||||||||||||||||||||||||||||||||||||||
| Weighted-average lease term | 5.6 years | 13.8 years | |||||||||||||||||||||||||||||||||||||||||||||
| Leasing activity summary (totals): | |||||||||||||||||||||||||||||||||||||||||||||||
| New rates | $80.90 | $78.50 | $56.09 | $53.33 | |||||||||||||||||||||||||||||||||||||||||||
| RSF | 1,142,857 | 4,306,072 | |||||||||||||||||||||||||||||||||||||||||||||
| Weighted-average lease term | 8.4 years | 11.3 years | |||||||||||||||||||||||||||||||||||||||||||||
| Lease expirations*(1)* | |||||||||||||||||||||||||||||||||||||||||||||||
| Expiring rates | $55.76 | $59.39 | $43.84 | $45.20 | |||||||||||||||||||||||||||||||||||||||||||
| RSF | 1,412,931 | (4) | 5,027,773 |
Leasing activity includes 100% of results for properties in North America in which we have an investment.
(1)Excludes month-to-month leases aggregating 142,020 RSF and 86,092 RSF as of March 31, 2024 and December 31, 2023, respectively. During the trailing twelve months ended March 31, 2024, we granted free rent concessions averaging 0.8 months per annum.
(2)Rental rate changes can experience volatility from quarter to quarter based on the mix of leases executed. Refer to “Projected results” in Item 2 for rental rate changes expected from leases executed during the year ending December 31, 2024.
(3)Refer to “New Class A/A+ development and redevelopment properties: summary of pipeline” in Item 2 for additional information, including total project costs.
(4)Includes 160,053 RSF, which was an acquired in-place lease, at 311 Arsenal Street in our Cambridge/Inner Suburbs submarket that commenced redevelopment during the three months ended March 31, 2024 with initial occupancy expected in 2027.
Summary of contractual lease expirations
The following table summarizes information with respect to the contractual lease expirations at our properties as of March 31, 2024:
| Year | RSF | Percentage of Occupied RSF | Annual Rental Revenue (per RSF)(1) | Percentage of Annual Rental Revenue | ||||||||||||||||||||||||||||||||||||||||||||||||||||
| 2024 | (2) | 2,454,461 | 6.2 | % | $ | 48.04 | 5.4 | % | ||||||||||||||||||||||||||||||||||||||||||||||||
| 2025 | 4,204,286 | 10.6 | % | $ | 53.73 | 10.3 | % | |||||||||||||||||||||||||||||||||||||||||||||||||
| 2026 | 2,308,196 | 5.8 | % | $ | 52.11 | 5.5 | % | |||||||||||||||||||||||||||||||||||||||||||||||||
| 2027 | 3,106,423 | 7.8 | % | $ | 52.39 | 7.4 | % | |||||||||||||||||||||||||||||||||||||||||||||||||
| 2028 | 4,657,935 | 11.8 | % | $ | 51.60 | 10.9 | % | |||||||||||||||||||||||||||||||||||||||||||||||||
| 2029 | 2,649,318 | 6.7 | % | $ | 50.78 | 6.1 | % | |||||||||||||||||||||||||||||||||||||||||||||||||
| 2030 | 2,447,767 | 6.2 | % | $ | 48.68 | 5.4 | % | |||||||||||||||||||||||||||||||||||||||||||||||||
| 2031 | 3,670,568 | 9.3 | % | $ | 55.33 | 9.2 | % | |||||||||||||||||||||||||||||||||||||||||||||||||
| 2032 | 1,157,219 | 2.9 | % | $ | 59.50 | 3.1 | % | |||||||||||||||||||||||||||||||||||||||||||||||||
| 2033 | 2,803,731 | 7.1 | % | $ | 51.78 | 6.6 | % | |||||||||||||||||||||||||||||||||||||||||||||||||
| Thereafter | 10,114,906 | 25.6 | % | $ | 65.43 | 30.1 | % |
(1)Represents amounts in effect as of March 31, 2024.
(2)Excludes month-to-month leases aggregating 142,020 RSF as of March 31, 2024.
The following tables present information by market with respect to our lease expirations for the remainder of 2024 and for all of 2025 in North America as of March 31, 2024:
| 2024 Contractual Lease Expirations (in RSF) | |||||||||||||||||||||||||||||||||||||||||||||||
| Market | Leased | Negotiating/ Anticipating | Targeted for Future Development/Redevelopment(1) | Remaining Expiring Leases(2) | Total(3) | Annual Rental Revenue (per RSF)(4) | |||||||||||||||||||||||||||||||||||||||||
| Committed Near-Term/ Priority Anticipated | Future | ||||||||||||||||||||||||||||||||||||||||||||||
| Greater Boston | 14,075 | 32,574 | 148,393 | 104,500 | 308,244 | 607,786 | $ | 64.26 | |||||||||||||||||||||||||||||||||||||||
| San Francisco Bay Area | 5,998 | — | 107,250 | 84,083 | 367,499 | 564,830 | 61.43 | ||||||||||||||||||||||||||||||||||||||||
| San Diego | 20,626 | — | 159,884 | (5) | 420,137 | 60,977 | 661,624 | 24.17 | |||||||||||||||||||||||||||||||||||||||
| Seattle | — | 2,147 | — | — | 152,552 | 154,699 | 22.01 | ||||||||||||||||||||||||||||||||||||||||
| Maryland | — | — | — | — | 15,819 | 15,819 | 25.27 | ||||||||||||||||||||||||||||||||||||||||
| Research Triangle | — | — | — | — | 68,960 | 68,960 | 55.16 | ||||||||||||||||||||||||||||||||||||||||
| New York City | — | — | — | — | 360,636 | (6) | 360,636 | 55.50 | |||||||||||||||||||||||||||||||||||||||
| Texas | — | — | — | — | — | — | — | ||||||||||||||||||||||||||||||||||||||||
| Canada | 20,107 | — | — | — | — | 20,107 | 26.26 | ||||||||||||||||||||||||||||||||||||||||
| Non-cluster/other markets | — | — | — | — | — | — | — | ||||||||||||||||||||||||||||||||||||||||
| Total | 60,806 | 34,721 | 415,527 | 608,720 | 1,334,687 | 2,454,461 | $ | 48.04 | |||||||||||||||||||||||||||||||||||||||
| Percentage of expiring leases | 2% | 1% | 17% | 25% | 55% | 100% | |||||||||||||||||||||||||||||||||||||||||
| 2025 Contractual Lease Expirations (in RSF) | Annual Rental Revenue (per RSF)(4) | ||||||||||||||||||||||||||||||||||||||||||||||
| Market | Leased | Negotiating/ Anticipating | Targeted for Future Development/ Redevelopment(1) | Remaining Expiring Leases(2) | Total | ||||||||||||||||||||||||||||||||||||||||||
| Greater Boston | 44,332 | 140,684 | 25,312 | 1,076,112 | (7) | 1,286,440 | $ | 71.80 | |||||||||||||||||||||||||||||||||||||||
| San Francisco Bay Area | 35,797 | 118,591 | — | 488,205 | 642,593 | 72.20 | |||||||||||||||||||||||||||||||||||||||||
| San Diego | 16,891 | — | — | 329,258 | 346,149 | 42.89 | |||||||||||||||||||||||||||||||||||||||||
| Seattle | — | — | 50,552 | 350,071 | 400,623 | 28.00 | |||||||||||||||||||||||||||||||||||||||||
| Maryland | 35,055 | — | — | 200,156 | 235,211 | 28.09 | |||||||||||||||||||||||||||||||||||||||||
| Research Triangle | — | — | — | 327,850 | 327,850 | 48.77 | |||||||||||||||||||||||||||||||||||||||||
| New York City | — | — | — | 62,224 | 62,224 | 105.76 | |||||||||||||||||||||||||||||||||||||||||
| Texas | — | — | 198,972 | 604,382 | 803,354 | 36.27 | |||||||||||||||||||||||||||||||||||||||||
| Canada | — | — | — | 88,412 | 88,412 | 20.46 | |||||||||||||||||||||||||||||||||||||||||
| Non-cluster/other markets | — | — | — | 11,430 | 11,430 | 80.31 | |||||||||||||||||||||||||||||||||||||||||
| Total | 132,075 | 259,275 | 274,836 | 3,538,100 | 4,204,286 | $ | 53.73 | ||||||||||||||||||||||||||||||||||||||||
| Percentage of expiring leases | 3% | 6% | 7% | 84% | 100% | ||||||||||||||||||||||||||||||||||||||||||
(1)Primarily represents assets that were recently acquired for future value-creation opportunities, for which we expect, subject to market conditions and leasing, to commence first-time conversion from non-laboratory space to laboratory space, or to commence future ground-up development. As of March 31, 2024, annual rental revenue from these leases expiring in 2024 and 2025 is $39.13 per RSF and $49.71 per RSF, respectively. The weighted-average expiration date of these leases expiring in 2024 and 2025 is July 25, 2024 and January 14, 2025, respectively. Refer to “Investments in real estate” under “Definitions and reconciliations” in Item 2 for additional details, including value-creation square feet currently included in rental properties.
(2)Excluding the expiration described in footnote 6, the largest remaining contractual lease expiration in 2024 is 97,702 RSF in our Mission Bay submarket, where we are working to retain the current tenant, and in 2025 is 357,136 RSF in our Austin submarket, where we are in early negotiations to renew with the existing tenant.
(3)Excludes month-to-month leases aggregating 142,020 RSF as of March 31, 2024.
(4)Represents amounts in effect as of March 31, 2024.
(5)Represents 159,884 RSF at 4161 Campus Point Court in our University Town Center submarket that is targeted for future development into a 492,570 RSF building at 4165 Campus Point Court, which is 51% leased/negotiating and expected to commence construction in the next two years subject to leasing the project and overall market conditions.
(6)Includes 349,947 RSF at 219 East 42nd Street that is classified as held for sale as of March 31, 2024 and expected to be sold in 2024.
(7)Includes 966,964 RSF in our Cambridge/Inner Suburbs submarket, with the largest remaining contractual lease expiration aggregating 171,945 RSF at the Alexandria Technology Square® mega campus.
Top 20 tenants
92% of Top 20 Tenant Annual Rental Revenue Is From Investment-Grade
or Publicly Traded Large Cap Tenants**(1)**
Our properties are leased to a high-quality and diverse group of tenants, with no individual tenant accounting for more than 5.6% of our annual rental revenue in effect as of March 31, 2024. The following table sets forth information regarding leases with our 20 largest tenants in North America based upon annual rental revenue in effect as of March 31, 2024 (dollars in thousands, except average market cap amounts):
| Remaining Lease Term(1) (in Years) | Aggregate RSF | Annual Rental Revenue(1) | Percentage of Annual Rental Revenue (1) | Investment-Grade Credit Ratings | Average Market Cap(1) (in billions) | |||||||||||||||||||||||||||||||||||||||||||||||||||||||||||||||||||||
| Tenant | Moody’s | S&P | ||||||||||||||||||||||||||||||||||||||||||||||||||||||||||||||||||||||||
| 1 | Moderna, Inc. | 13.0 | 1,370,536 | $ | 124,504 | 5.6 | % | — | — | $ | 41.1 | |||||||||||||||||||||||||||||||||||||||||||||||||||||||||||||||
| 2 | Eli Lilly and Company | 8.9 | 1,134,349 | 92,595 | 4.2 | A2 | A+ | $ | 529.0 | |||||||||||||||||||||||||||||||||||||||||||||||||||||||||||||||||
| 3 | Bristol-Myers Squibb Company | 6.9 | 999,379 | 75,757 | 3.4 | A2 | A+ | $ | 120.0 | |||||||||||||||||||||||||||||||||||||||||||||||||||||||||||||||||
| 4 | Takeda Pharmaceutical Company Limited | 11.6 | 549,759 | 47,899 | 2.2 | Baa2 | BBB+ | $ | 47.9 | |||||||||||||||||||||||||||||||||||||||||||||||||||||||||||||||||
| 5 | Roche | 6.1 | 770,279 | 45,933 | 2.1 | Aa2 | AA | $ | 235.7 | |||||||||||||||||||||||||||||||||||||||||||||||||||||||||||||||||
| 6 | Illumina, Inc. | 6.8 | 955,669 | 41,588 | 1.9 | Baa3 | BBB | $ | 25.1 | |||||||||||||||||||||||||||||||||||||||||||||||||||||||||||||||||
| 7 | Alphabet Inc. | 3.2 | 724,223 | 39,155 | 1.8 | Aa2 | AA+ | $ | 1,648.5 | |||||||||||||||||||||||||||||||||||||||||||||||||||||||||||||||||
| 8 | 2seventy bio, Inc.(2) | 9.4 | 312,805 | 33,543 | 1.5 | — | — | $ | 0.3 | |||||||||||||||||||||||||||||||||||||||||||||||||||||||||||||||||
| 9 | Novartis AG | 4.3 | 450,563 | 31,196 | 1.4 | A1 | AA- | $ | 228.0 | |||||||||||||||||||||||||||||||||||||||||||||||||||||||||||||||||
| 10 | Harvard University | 6.4 | 343,858 | 29,280 | 1.3 | Aaa | AAA | $ | — | |||||||||||||||||||||||||||||||||||||||||||||||||||||||||||||||||
| 11 | Cloud Software Group, Inc. | 2.9 | (3) | 292,013 | 28,537 | 1.3 | — | — | $ | — | ||||||||||||||||||||||||||||||||||||||||||||||||||||||||||||||||
| 12 | United States Government | 6.3 | 425,166 | 27,965 | 1.3 | Aaa | AA+ | $ | — | |||||||||||||||||||||||||||||||||||||||||||||||||||||||||||||||||
| 13 | Uber Technologies, Inc. | 58.5 | (4) | 1,009,188 | 27,754 | 1.3 | — | — | $ | 106.1 | ||||||||||||||||||||||||||||||||||||||||||||||||||||||||||||||||
| 14 | AstraZeneca PLC | 5.6 | 450,848 | 27,156 | 1.2 | A3 | A | $ | 211.6 | |||||||||||||||||||||||||||||||||||||||||||||||||||||||||||||||||
| 15 | Pfizer Inc. | 0.9 | (5) | 524,159 | 25,249 | 1.1 | A1 | A+ | $ | 186.8 | ||||||||||||||||||||||||||||||||||||||||||||||||||||||||||||||||
| 16 | Sanofi | 6.8 | 267,278 | 21,444 | 1.0 | A1 | AA | $ | 129.4 | |||||||||||||||||||||||||||||||||||||||||||||||||||||||||||||||||
| 17 | Merck & Co., Inc. | 9.3 | 337,703 | 21,401 | 1.0 | A1 | A+ | $ | 284.2 | |||||||||||||||||||||||||||||||||||||||||||||||||||||||||||||||||
| 18 | New York University | 7.9 | 218,983 | 21,056 | 1.0 | Aa2 | AA- | $ | — | |||||||||||||||||||||||||||||||||||||||||||||||||||||||||||||||||
| 19 | Massachusetts Institute of Technology | 5.2 | 246,725 | 20,527 | 0.9 | Aaa | AAA | $ | — | |||||||||||||||||||||||||||||||||||||||||||||||||||||||||||||||||
| 20 | Boston Children’s Hospital | 12.6 | 266,857 | 20,066 | 0.9 | Aa2 | AA | $ | — | |||||||||||||||||||||||||||||||||||||||||||||||||||||||||||||||||
| Total/weighted-average | 9.7 | (4) | 11,650,340 | $ | 802,605 | 36.4 | % |
Annual rental revenue and RSF include 100% of each property managed by us in North America. Refer to “Annual rental revenue” and “Investment-grade or publicly traded large cap tenants” under “Definitions and reconciliations” in Item 2 for additional details, including our methodologies of calculating annual rental revenue from unconsolidated real estate joint ventures and average market capitalization, respectively.
(1)Based on annual rental revenue in effect as of March 31, 2024.
(2)As of December 31, 2023, 2seventy bio, Inc. (“2seventy bio”) held $217.0 million of cash, cash equivalents, and marketable securities. In March 2024, Regeneron Pharmaceuticals, Inc., a publicly traded biotechnology company with investment-grade credit ratings of Baa1 and BBB+ assigned by Moody’s and S&P, respectively, entered into a sublease for approximately 195,000 RSF, or 62.7% of our annual rental revenue generated from 2seventy bio as of March 31, 2024. Additionally, 90.0% of the annual rental revenue generated by 2seventy bio is guaranteed by another related public biotechnology company.
(3)Includes one lease at a recently acquired property with future development and redevelopment opportunities. This lease with Cloud Software Group, Inc. (formerly known as TIBCO Software, Inc.) was in place when we acquired the property.
(4)Includes (i) ground leases for land at 1455 and 1515 Third Street (two buildings aggregating 422,980 RSF) and (ii) leases at 1655 and 1725 Third Street (two buildings aggregating 586,208 RSF) in our Mission Bay submarket owned by our unconsolidated real estate joint venture in which we have an ownership interest of 10%. Annual rental revenue is presented using 100% of the annual rental revenue from our consolidated properties and our share of annual rental revenue from our unconsolidated real estate joint ventures. Refer to footnote 1 for additional details. Excluding these ground leases, the weighted-average remaining lease term for our top 20 tenants was 7.8 years as of March 31, 2024.
(5)Primarily relates to one office building in our New York City submarket aggregating 349,947 RSF with a contractual lease expiration in the third quarter of 2024, which was classified as held for sale as of March 31, 2024 and is expected to be sold in 2024.
Locations of properties
The locations of our properties are diversified among a number of Class A/A+ assets strategically clustered in life science mega campuses in AAA innovation cluster markets. The following table sets forth the total RSF, number of properties, and annual rental revenue in effect as of March 31, 2024 in each of our markets in North America (dollars in thousands, except per RSF amounts):
| RSF | Number of Properties | Annual Rental Revenue | |||||||||||||||||||||||||||||||||||||||||||||||||||||||||
| Market | Operating | Development | Redevelopment | Total | % of Total | Total | % of Total | Per RSF | |||||||||||||||||||||||||||||||||||||||||||||||||||
| Greater Boston | 10,849,509 | 801,949 | 1,464,104 | (1) | 13,115,562 | 28 | % | 72 | $ | 844,713 | 38 | % | $ | 82.40 | |||||||||||||||||||||||||||||||||||||||||||||
| San Francisco Bay Area | 7,947,899 | 498,142 | 282,054 | 8,728,095 | 18 | 67 | 460,530 | 21 | 65.99 | ||||||||||||||||||||||||||||||||||||||||||||||||||
| San Diego | 7,841,080 | 1,187,796 | — | 9,028,876 | 19 | 90 | 333,605 | 15 | 44.67 | ||||||||||||||||||||||||||||||||||||||||||||||||||
| Seattle | 3,032,918 | 33,349 | 34,306 | 3,100,573 | 7 | 43 | 130,945 | 6 | 45.48 | ||||||||||||||||||||||||||||||||||||||||||||||||||
| Maryland | 3,582,162 | 510,601 | — | 4,092,763 | 9 | 51 | 125,237 | 6 | 37.08 | ||||||||||||||||||||||||||||||||||||||||||||||||||
| Research Triangle | 3,843,673 | — | — | 3,843,673 | 8 | 39 | 120,692 | 5 | 32.10 | ||||||||||||||||||||||||||||||||||||||||||||||||||
| New York City | 922,477 | — | — | 922,477 | 2 | 4 | 72,325 | 3 | 92.89 | ||||||||||||||||||||||||||||||||||||||||||||||||||
| Texas | 1,845,159 | — | 73,298 | 1,918,457 | 4 | 15 | 57,831 | 3 | 32.94 | ||||||||||||||||||||||||||||||||||||||||||||||||||
| Canada | 909,760 | — | 163,211 | 1,072,971 | 2 | 12 | 18,895 | 1 | 22.63 | ||||||||||||||||||||||||||||||||||||||||||||||||||
| Non-cluster/other markets | 347,806 | — | — | 347,806 | 1 | 10 | 15,446 | 1 | 58.90 | ||||||||||||||||||||||||||||||||||||||||||||||||||
| Properties held for sale | 1,035,386 | — | — | 1,035,386 | 2 | 7 | 32,751 | 1 | N/A | ||||||||||||||||||||||||||||||||||||||||||||||||||
| North America | 42,157,829 | 3,031,837 | 2,016,973 | 47,206,639 | 100 | % | 410 | $ | 2,212,970 | 100 | % | $ | 56.86 | ||||||||||||||||||||||||||||||||||||||||||||||
| 5,048,810 |
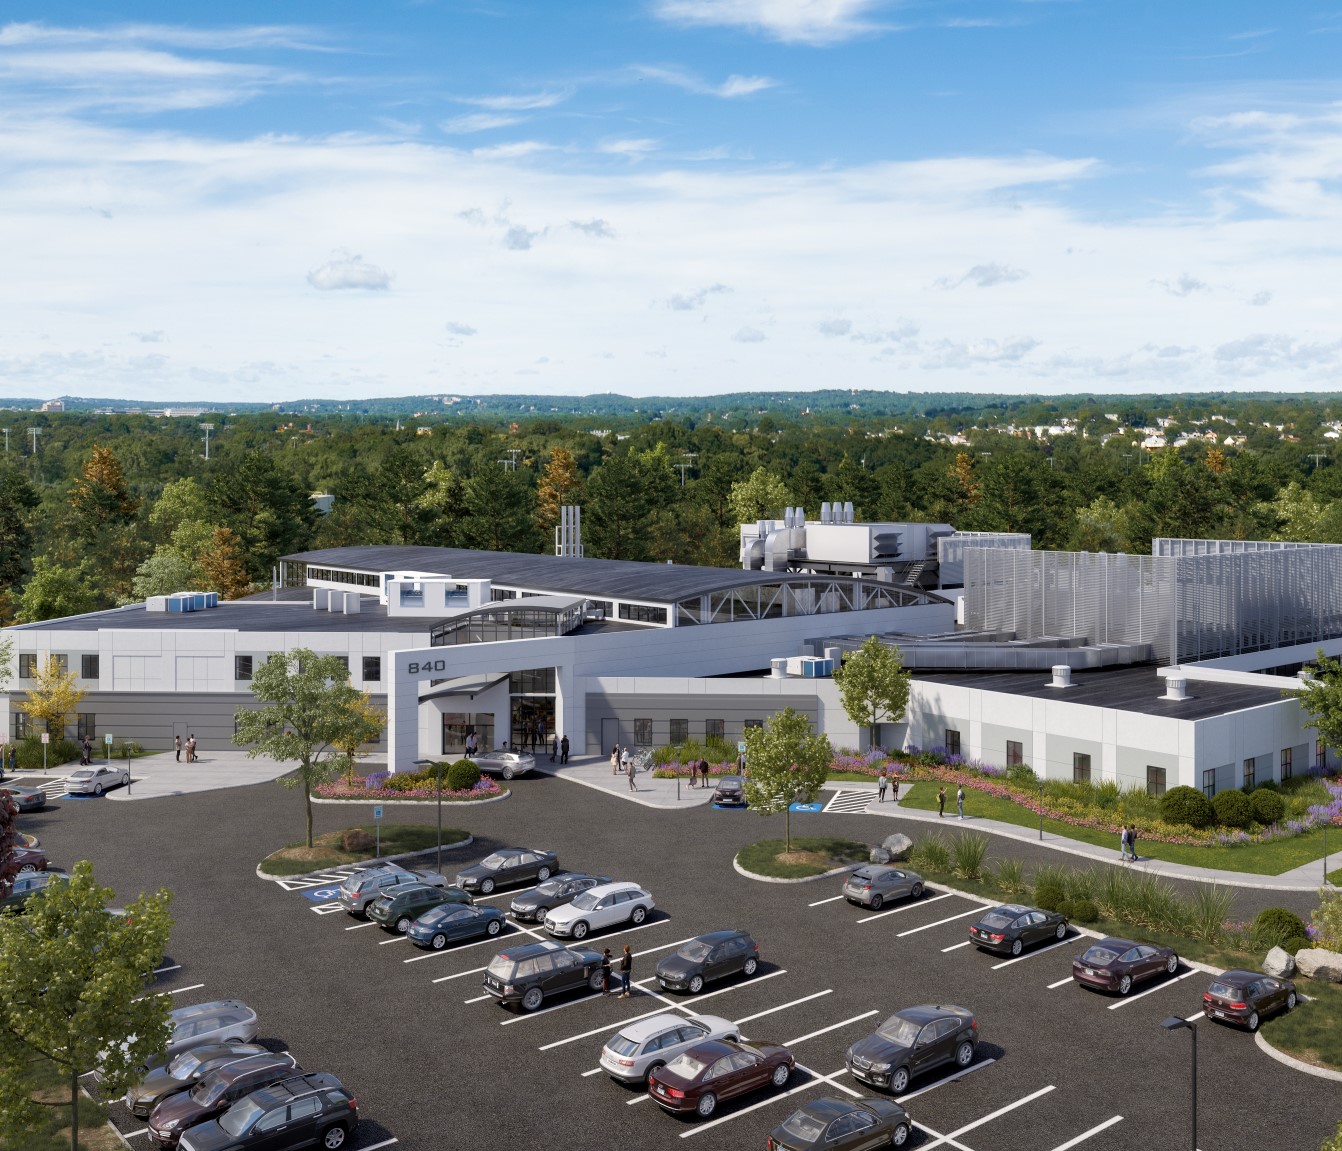
(1)Primarily includes our active redevelopment projects aggregating 716,604 RSF at 40, 50, and 60 Sylvan Road and 840 Winter Street located on the Alexandria Center® for Life Science – Waltham mega campus, which are 43% leased/negotiating on a combined basis. This mega campus project is expected to capture demand in our Route 128 submarket.
Summary of occupancy percentages in North America
The following table sets forth the occupancy percentages for our operating properties and our operating and redevelopment properties in each of our North America markets, excluding properties held for sale, as of the following dates:
| Operating Properties | Operating and Redevelopment Properties | |||||||||||||||||||||||||||||||||||||
| Market | 3/31/24 | 12/31/23 | 3/31/23 | 3/31/24 | 12/31/23 | 3/31/23 | ||||||||||||||||||||||||||||||||
| Greater Boston | 94.5 | % | 94.9 | % | 92.8 | % | 83.3 | % | 84.7 | % | 81.8 | % | ||||||||||||||||||||||||||
| San Francisco Bay Area | 94.4 | 94.8 | 95.9 | 91.2 | 91.4 | 92.3 | ||||||||||||||||||||||||||||||||
| San Diego | 95.2 | 94.1 | 94.2 | 95.2 | 94.1 | 94.2 | ||||||||||||||||||||||||||||||||
| Seattle | 94.9 | 95.2 | 96.0 | 93.9 | 90.7 | 90.4 | ||||||||||||||||||||||||||||||||
| Maryland | 95.4 | 95.6 | 95.7 | 95.4 | 95.6 | 94.2 | ||||||||||||||||||||||||||||||||
| Research Triangle | 97.8 | 97.8 | 92.7 | 97.8 | 97.8 | 92.7 | ||||||||||||||||||||||||||||||||
| New York City | 84.4 | (1) | 85.3 | 89.2 | 84.4 | 85.3 | 89.2 | |||||||||||||||||||||||||||||||
| Texas | 95.1 | 95.1 | 89.8 | 91.5 | 91.5 | 83.7 | ||||||||||||||||||||||||||||||||
| Subtotal | 94.9 | 94.9 | 93.9 | 90.6 | 90.7 | 89.1 | ||||||||||||||||||||||||||||||||
| Canada | 91.8 | 87.1 | 86.8 | 77.8 | 73.0 | 68.8 | ||||||||||||||||||||||||||||||||
| Non-cluster/other markets | 75.4 | 78.5 | 79.7 | 75.4 | 78.5 | 79.7 | ||||||||||||||||||||||||||||||||
| North America | 94.6 | % | 94.6 | % | 93.6 | % | 90.2 | % | 90.2 | % | 88.5 | % |
(1)Alexandria Center® for Life Science – New York City mega campus is 94.7% occupied as of March 31, 2024. Occupancy percentage in our New York City market reflects vacancy at the Alexandria Center® for Life Science – Long Island City property, which was 41.7% occupied as of March 31, 2024.
Investments in real estate
A key component of our business model is our disciplined allocation of capital to the development and redevelopment of new Class A/A+ properties, and property enhancements identified during the underwriting of certain acquired properties, located in collaborative life science mega campuses in AAA innovation clusters. These projects are focused on providing high-quality, generic, and reusable spaces that meet the real estate requirements of a wide range of tenants. Upon completion, each value-creation project is expected to generate increases in rental income, net operating income, and cash flows. Our development and redevelopment projects are generally in locations that are highly desirable to high-quality entities, which we believe results in higher occupancy levels, longer lease terms, higher rental income, higher returns, and greater long-term asset value. Our pre-construction activities are undertaken in order to prepare the property for its intended use and include entitlements, permitting, design, site work, and other activities preceding commencement of construction of aboveground building improvements.
Our investments in real estate consisted of the following as of March 31, 2024 (dollars in thousands):
| Development and Redevelopment | ||||||||||||||||||||||||||||||||||||||||||||
| Active and Near-Term Construction | Future Opportunities Subject to Market Conditions and Leasing | |||||||||||||||||||||||||||||||||||||||||||
| Operating | Under Construction 64% Leased/Negotiating | Committed Near Term 51% Leased/Negotiating(1) | Priority Anticipated | Future | Subtotal | Total | ||||||||||||||||||||||||||||||||||||||
| Square footage | ||||||||||||||||||||||||||||||||||||||||||||
| Operating | 41,122,443 | — | — | — | — | — | 41,122,443 | |||||||||||||||||||||||||||||||||||||
| New Class A/A+ development and redevelopment properties | — | 5,048,810 | 492,570 | 2,919,315 | 27,176,766 | 35,637,461 | 35,637,461 | |||||||||||||||||||||||||||||||||||||
| Value-creation square feet currently included in rental properties(2) | — | — | (159,884) | (457,541) | (3,108,544) | (3,725,969) | (3,725,969) | |||||||||||||||||||||||||||||||||||||
| Total square footage, excluding properties held for sale | 41,122,443 | 5,048,810 | 332,686 | 2,461,774 | 24,068,222 | 31,911,492 | 73,033,935 | |||||||||||||||||||||||||||||||||||||
| Properties held for sale | 1,035,386 | — | — | — | — | — | 1,035,386 | |||||||||||||||||||||||||||||||||||||
| Total square footage | 42,157,829 | 5,048,810 | 332,686 | 2,461,774 | 24,068,222 | 31,911,492 | 74,069,321 | |||||||||||||||||||||||||||||||||||||
| Investments in real estate | ||||||||||||||||||||||||||||||||||||||||||||
| Gross book value as of March 31, 2024(3) | $ | 28,871,315 | $ | 3,713,483 | $ | 50,734 | $ | 765,486 | $ | 4,138,977 | $ | 8,668,680 | $ | 37,539,995 | ||||||||||||||||||||||||||||||
(1)Represents one committed near-term project expected to commence construction during the next two years after March 31, 2024.
(2)Refer to “Investments in real estate” under “Definitions and reconciliations” in Item 2 for additional details, including value-creation square feet currently included in rental properties.
(3)Balances exclude accumulated depreciation and our share of the cost basis associated with our properties held by our unconsolidated real estate joint ventures, which is classified as investments in unconsolidated real estate joint ventures in our consolidated balance sheets.
Acquisitions
Our real estate asset acquisitions consisted of the following (dollars in thousands):
| Property | Submarket/Market | Date of Purchase | Operating Occupancy | Future Development RSF(1) | Purchase Price | ||||||||||||||||||||||||||||||||||||||||||||||||||||||||||||||||||||||||
| Completed during the three months ended March 31, 2024: | |||||||||||||||||||||||||||||||||||||||||||||||||||||||||||||||||||||||||||||
| 285, 299, 307, and 345 Dorchester Avenue (60% interest in consolidated JV)(2) | Seaport Innovation District/Greater Boston | 1/30/24 | N/A | 1,040,000 | $ | 155,321 | |||||||||||||||||||||||||||||||||||||||||||||||||||||||||||||||||||||||
| Other(3) | 39,490 | ||||||||||||||||||||||||||||||||||||||||||||||||||||||||||||||||||||||||||||
| 194,811 | |||||||||||||||||||||||||||||||||||||||||||||||||||||||||||||||||||||||||||||
| Completed in April 2024 | 7,000 | ||||||||||||||||||||||||||||||||||||||||||||||||||||||||||||||||||||||||||||
| Pending acquisitions subject to signed letters of intent or purchase and sale agreements | 75,350 | ||||||||||||||||||||||||||||||||||||||||||||||||||||||||||||||||||||||||||||
| $ | 277,161 | ||||||||||||||||||||||||||||||||||||||||||||||||||||||||||||||||||||||||||||
| 2024 guidance range | $250,000 – $750,000 |
(1)We expect to provide total estimated costs and related yields for development and redevelopment projects in the future, subsequent to the commencement of construction.
(2)Refer to Note 4 – “Consolidated and unconsolidated real estate joint ventures” to our unaudited consolidated financial statements in Item 1 for additional details.
(3)Includes a payment of $35.3 million to redeem our partner’s partial ownership interest in a consolidated real estate joint venture located in our Greater Boston market, pursuant to our partner’s notification of their intent to exercise the put option received in December 2023 and settled in January 2024.
Dispositions and sales of partial interests
Our completed dispositions of and sales of partial interests in real estate assets during the three months ended March 31, 2024 and pending as of the date of this report consisted of the following (dollars in thousands):
| Property | Submarket/Market | Date of Sale | Interest Sold | RSF | Sales Price | |||||||||||||||||||||||||||||||||||||||||||||||||||||||||||||||
| Three months ended March 31, 2024: | ||||||||||||||||||||||||||||||||||||||||||||||||||||||||||||||||||||
| Value harvesting dispositions of 100% interests in properties not integral to our mega campus | ||||||||||||||||||||||||||||||||||||||||||||||||||||||||||||||||||||
| 99 A Street(1) | Seaport Innovation District/Greater Boston | 3/8/24 | 100 | % | 235,000 | $ | 13,350 | |||||||||||||||||||||||||||||||||||||||||||||||||||||||||||||
| Other | 3,863 | |||||||||||||||||||||||||||||||||||||||||||||||||||||||||||||||||||
| 17,213 | ||||||||||||||||||||||||||||||||||||||||||||||||||||||||||||||||||||
| Pending transactions subject to letters of intent or purchase and sale agreement negotiations | 258,095 | |||||||||||||||||||||||||||||||||||||||||||||||||||||||||||||||||||
| $ | 275,308 | |||||||||||||||||||||||||||||||||||||||||||||||||||||||||||||||||||
(1)We completed the sale during the three months ended March 31, 2024 and recognized no gain or loss.
New Class A/A+ development and redevelopment properties
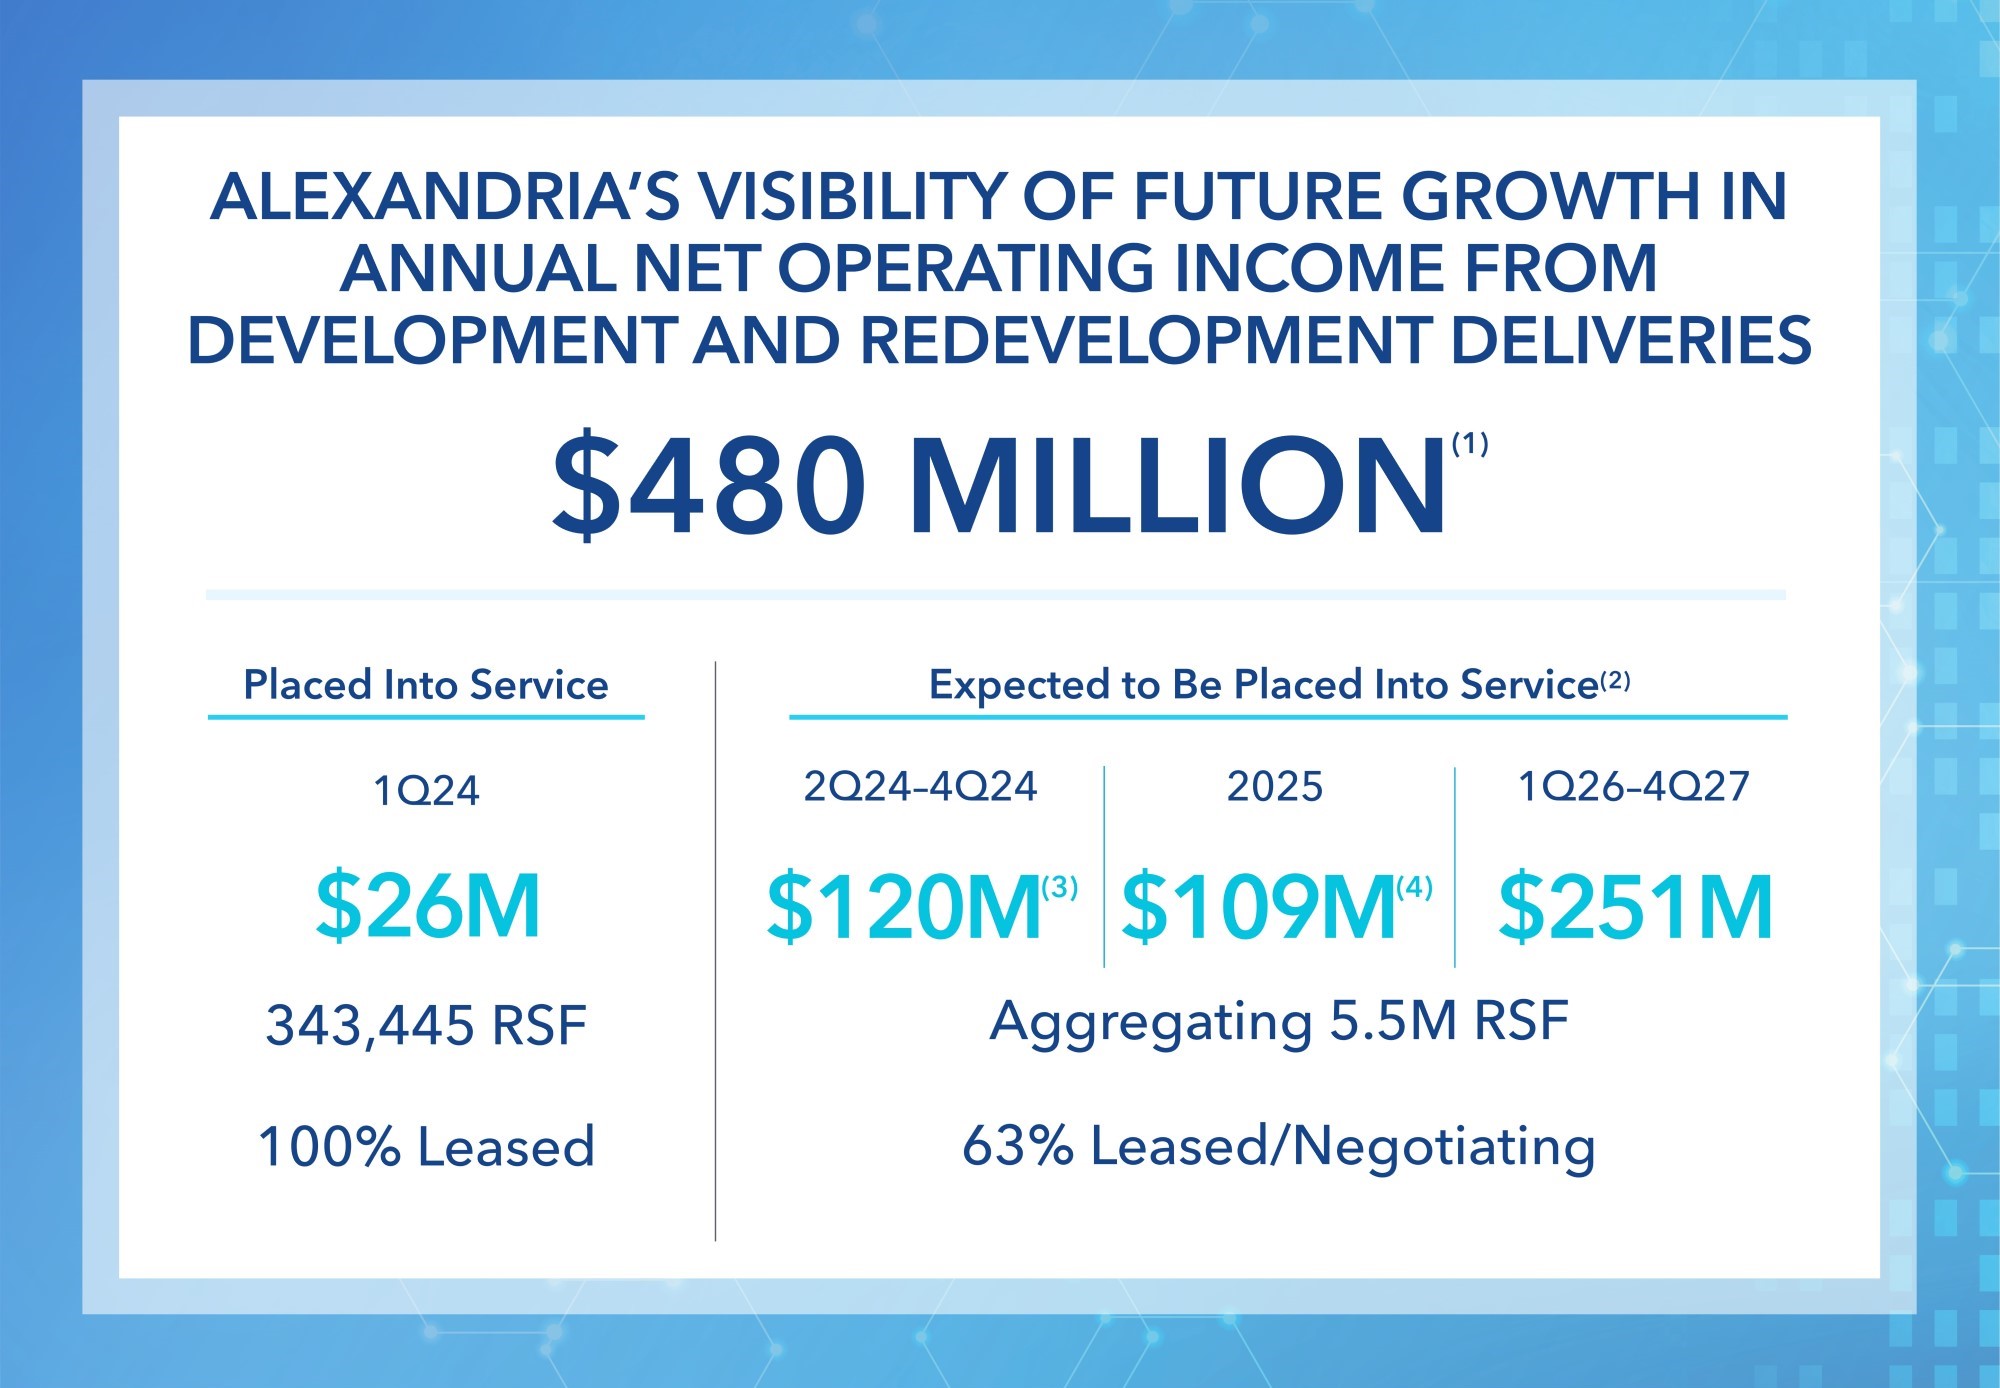
Refer to “Net operating income” under “Definitions and reconciliations” in Item 2 for additional details, including its reconciliation from the most directly comparable financial measures presented in accordance with GAAP.
(1)Our share of incremental annual net operating income from development and redevelopment projects expected to be placed into service primarily commencing from 2Q24 through 4Q27 is projected to be $380 million.
(2)Represents expected incremental annual net operating income to be placed into service from deliveries of projects undergoing construction and one committed near-term project expected to commence construction in the next two years, including partial deliveries of projects that stabilize in future years.
(3)Includes 1.2 million RSF that is expected to stabilize in 2024 and is 98% leased/negotiating. Refer to the initial and stabilized occupancy years under “New Class A/A+ development and redevelopment properties: current projects” in Item 2 for additional details.
(4)In addition to the projects represented, we are evaluating one priority anticipated development project that could commence active construction in 2024 and may have initial delivery in 2025.
New Class A/A+ development and redevelopment properties: recent deliveries
The following table presents value-creation development and redevelopment of new Class A/A+ properties placed into service during the three months ended March 31, 2024 (dollars in thousands):
Incremental Annual Net Operating Income Generated
From 1Q24 Deliveries Aggregated $26 Million
| 99 Coolidge Avenue | 500 North Beacon Street and 4 Kingsbury Avenue**(1)** | 651 Gateway Boulevard | Alexandria Center**®** for Advanced Technologies – Monte Villa Parkway**(2)** | |||||||||||||||||
| Greater Boston/ Cambridge/Inner Suburbs | Greater Boston/ Cambridge/Inner Suburbs | San Francisco Bay Area/ South San Francisco | Seattle/Bothell | |||||||||||||||||
| 116,414 RSF | 100,624 RSF | 44,652 RSF | 180,684 RSF | |||||||||||||||||
| 100% Occupancy | 100% Occupancy | 100% Occupancy | 100% Occupancy | |||||||||||||||||
 |  | 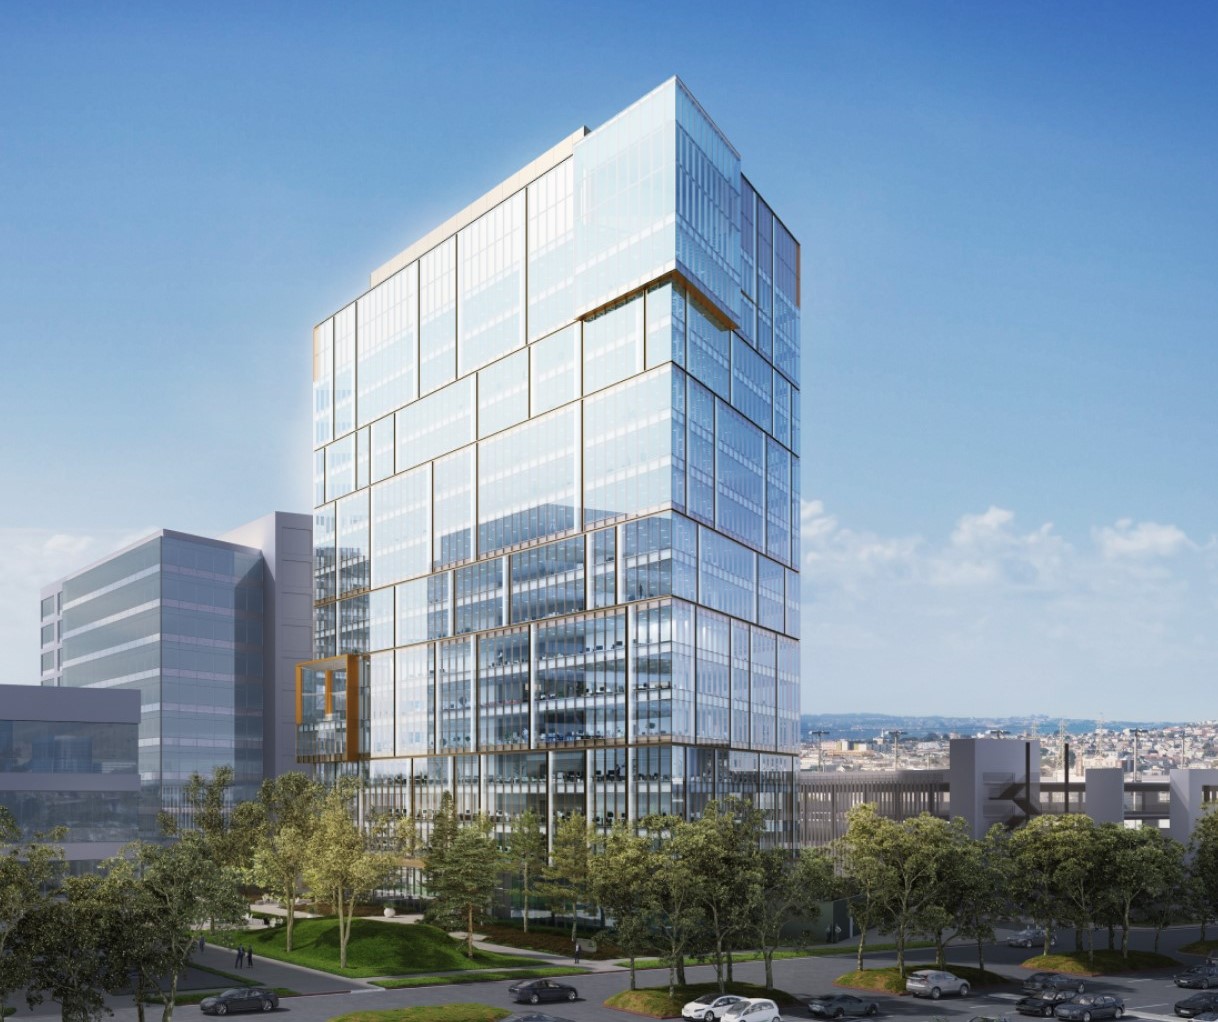 | 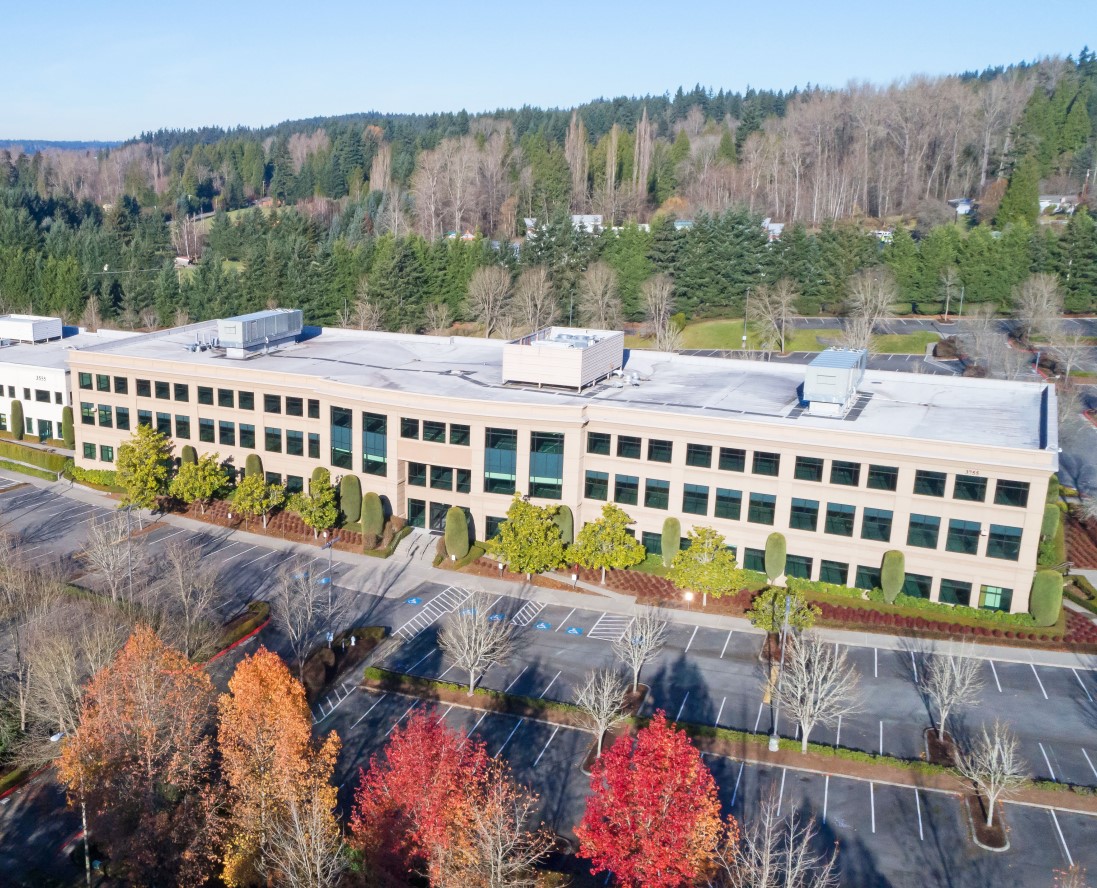 |
| Property/Market/Submarket | 1Q24 Delivery Date**(3)** | Our Ownership Interest | RSF Placed in Service | Occupancy Percentage**(4)** | Total Project | Unlevered Yields | ||||||||||||||||||||||||||||||||||||||||||||||||||||||||||||||||||||||||||||||||||||||||||||
| Prior to 1/1/24 | 1Q24 | Total | Initial Stabilized | Initial Stabilized (Cash Basis) | ||||||||||||||||||||||||||||||||||||||||||||||||||||||||||||||||||||||||||||||||||||||||||||||
| RSF | Investment | |||||||||||||||||||||||||||||||||||||||||||||||||||||||||||||||||||||||||||||||||||||||||||||||||
| Development projects | ||||||||||||||||||||||||||||||||||||||||||||||||||||||||||||||||||||||||||||||||||||||||||||||||||
| 99 Coolidge Avenue/Greater Boston/Cambridge/Inner Suburbs | 1/29/24 | 75.0% | 43,568 | 72,846 | 116,414 | 100% | 320,809 | $ | 468,000 | 7.1 | % | 7.0 | % | |||||||||||||||||||||||||||||||||||||||||||||||||||||||||||||||||||||||||||||||||||||
| 500 North Beacon Street and 4 Kingsbury Avenue/Greater Boston/Cambridge/Inner Suburbs | 1/23/24 | 100% | — | 100,624 | 100,624 | 100% | 248,018 | 427,000 | 6.2 | 5.5 | ||||||||||||||||||||||||||||||||||||||||||||||||||||||||||||||||||||||||||||||||||||||||
| Redevelopment projects | ||||||||||||||||||||||||||||||||||||||||||||||||||||||||||||||||||||||||||||||||||||||||||||||||||
| 651 Gateway Boulevard/San Francisco Bay Area/South San Francisco | 1/16/24 | 50.0% | — | 44,652 | 44,652 | 100% | 326,706 | 487,000 | 5.0 | 5.1 | ||||||||||||||||||||||||||||||||||||||||||||||||||||||||||||||||||||||||||||||||||||||||
| Alexandria Center® for Advanced Technologies – Monte Villa Parkway/Seattle/Bothell | 1/27/24 | 100% | 65,086 | 115,598 | 180,684 | 100% | 460,934 | 229,000 | 6.3 | 6.2 | ||||||||||||||||||||||||||||||||||||||||||||||||||||||||||||||||||||||||||||||||||||||||
| Canada | 2/28/24 | 100% | 44,862 | 9,725 | 54,587 | 100% | 250,790 | 113,000 | 6.4 | 6.3 | ||||||||||||||||||||||||||||||||||||||||||||||||||||||||||||||||||||||||||||||||||||||||
| Weighted average/total | 1/26/24 | 153,516 | 343,445 | 496,961 | 1,607,257 | $ | 1,724,000 | 6.1 | % | 5.9 | % | |||||||||||||||||||||||||||||||||||||||||||||||||||||||||||||||||||||||||||||||||||||||
(1)Image represents 500 North Beacon Street on the Arsenal on the Charles mega campus.
(2)Image represents 3755 Monte Villa Parkway.
(3)Represents the average delivery date for deliveries that occurred during the three months ended March 31, 2024, weighted by annual rental revenue.
(4)Occupancy relates to total operating RSF placed in service as of the most recent delivery.
New Class A/A+ development and redevelopment properties: current projects
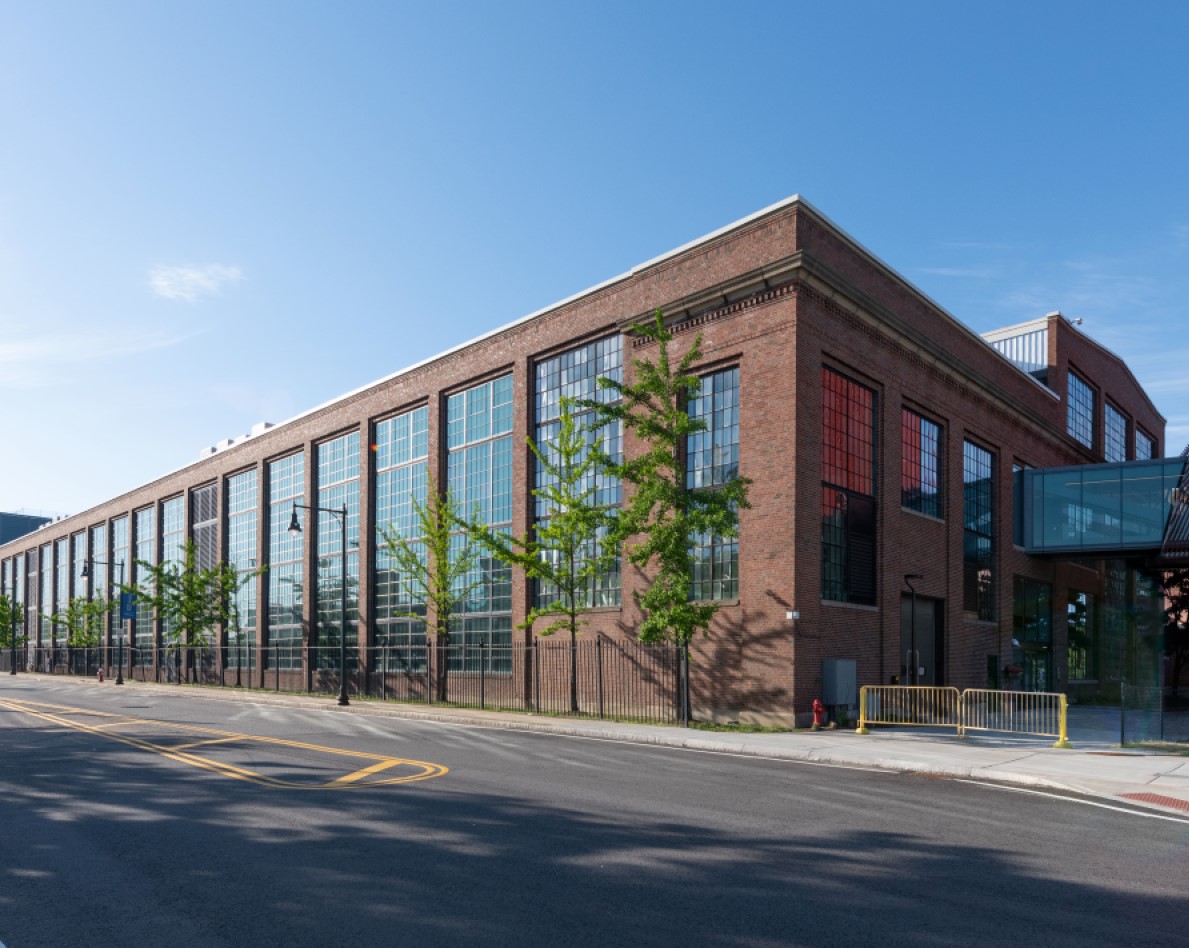
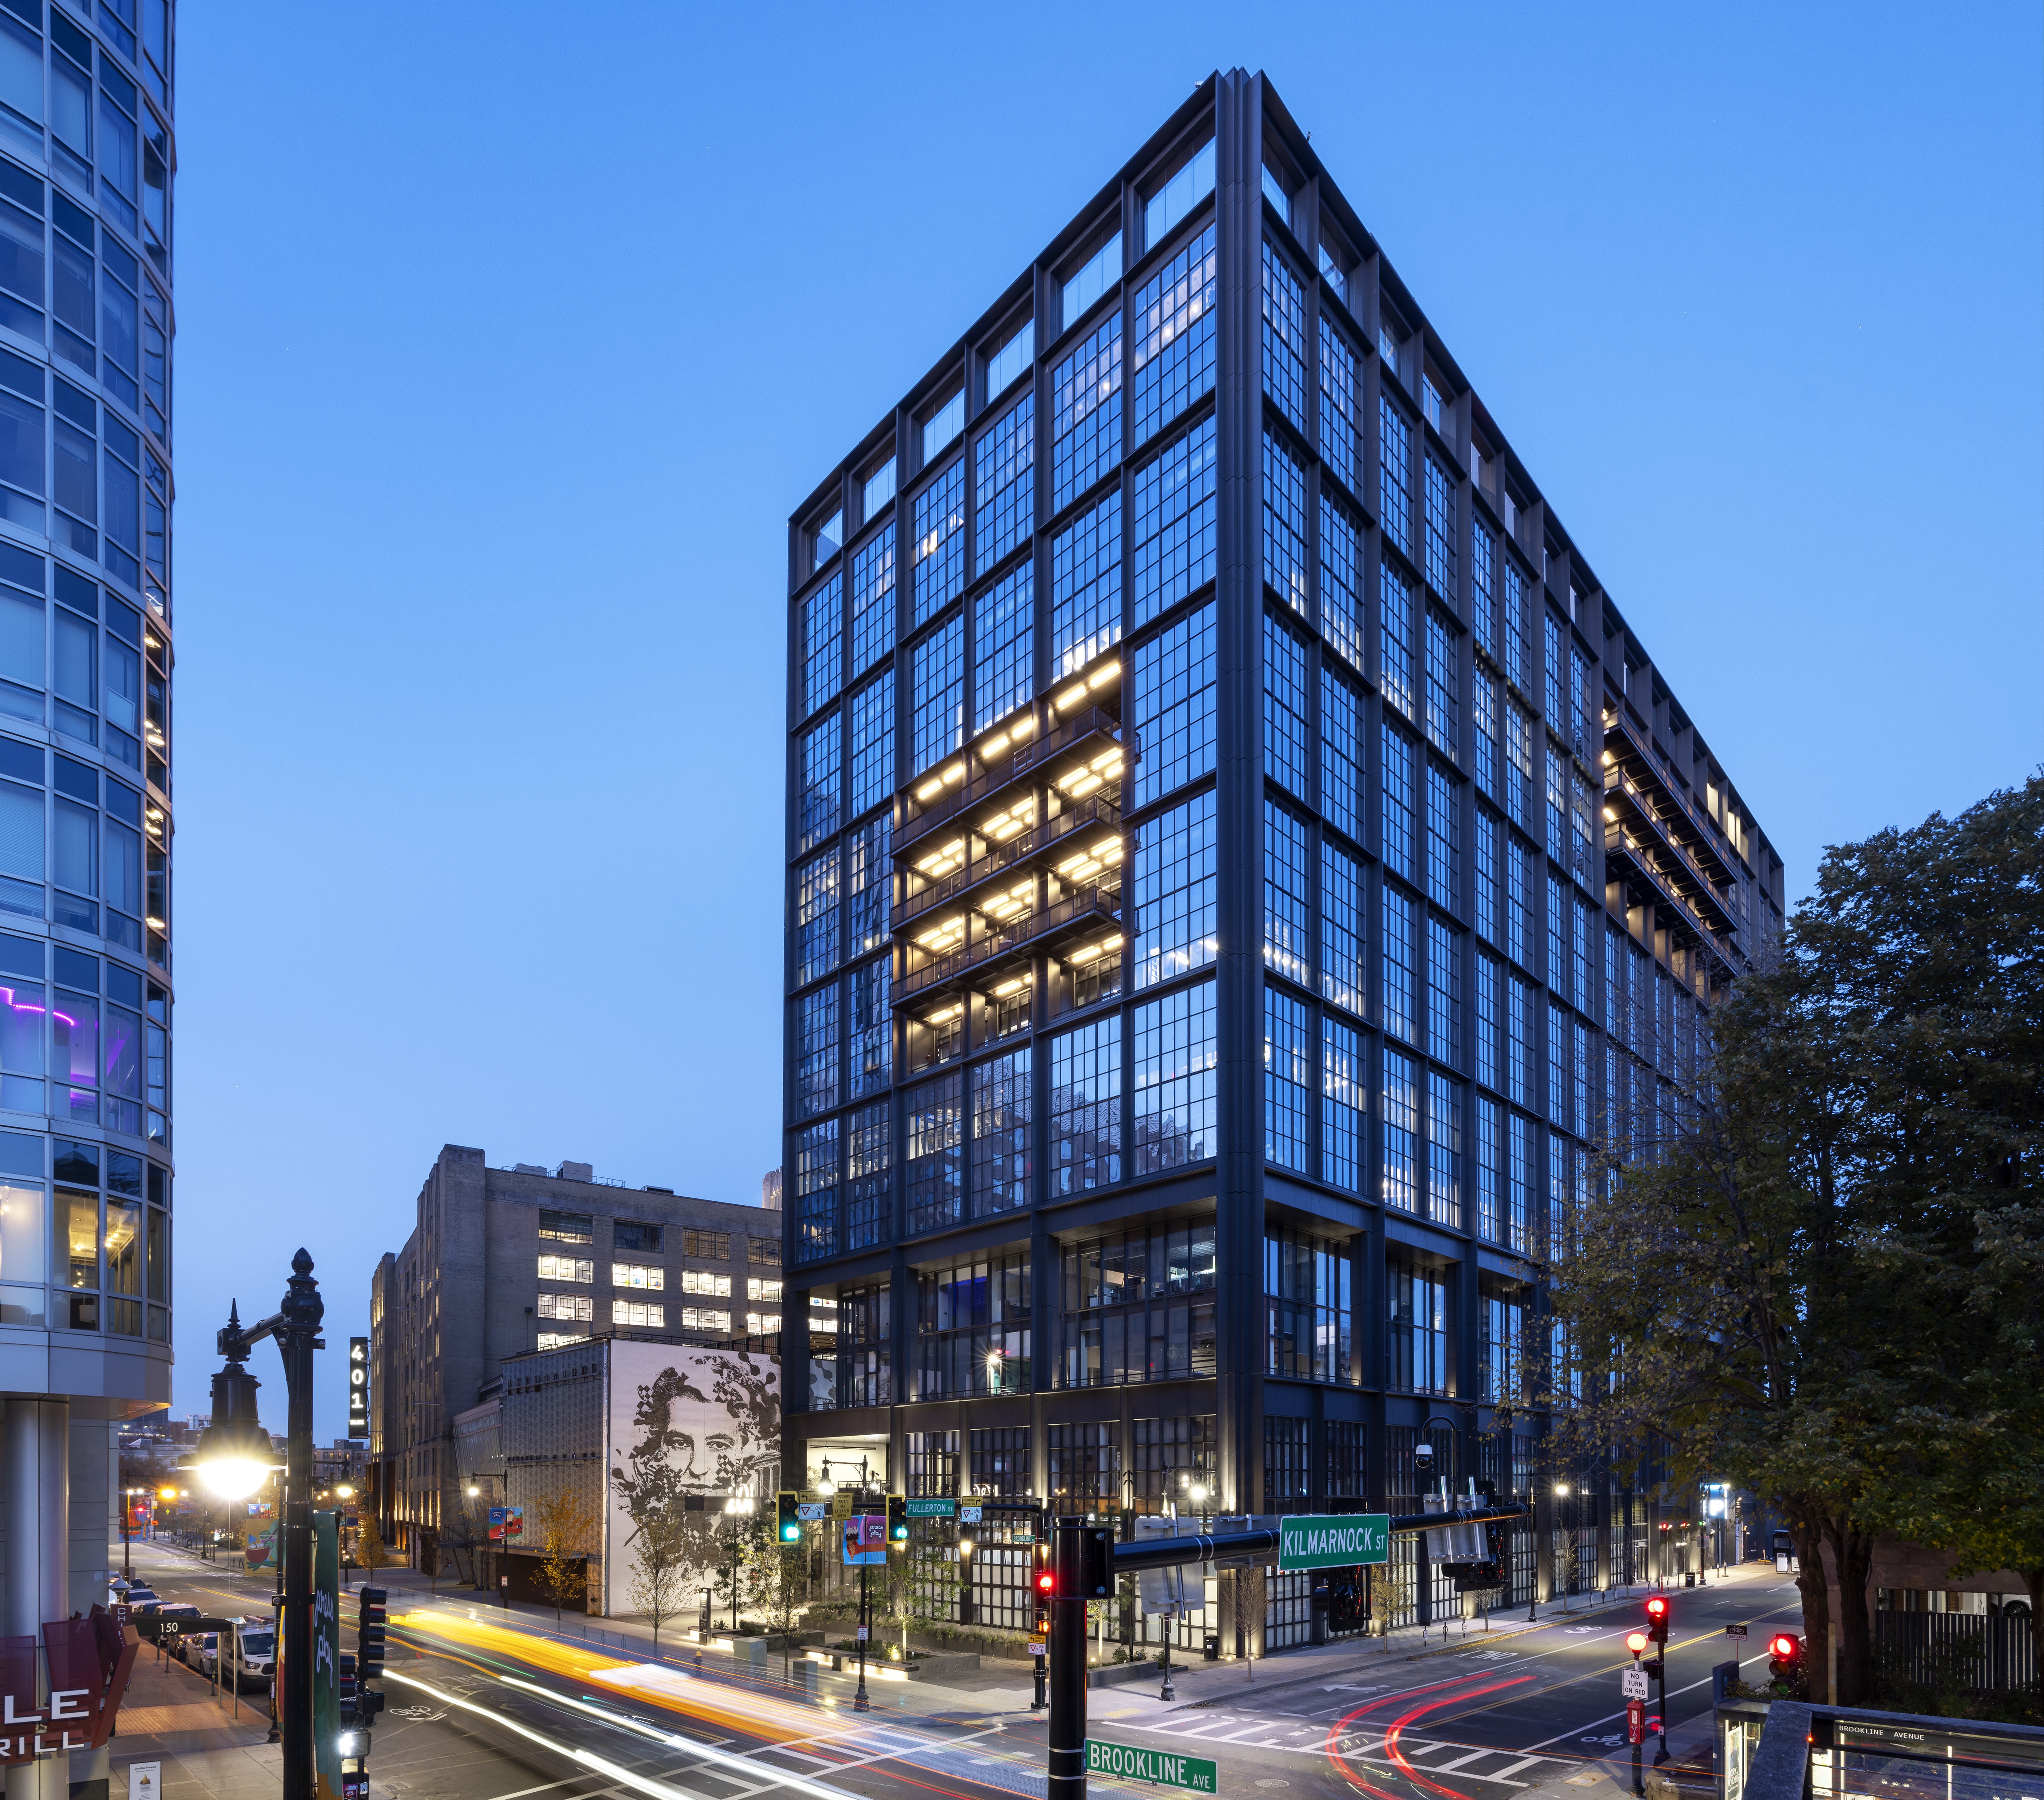
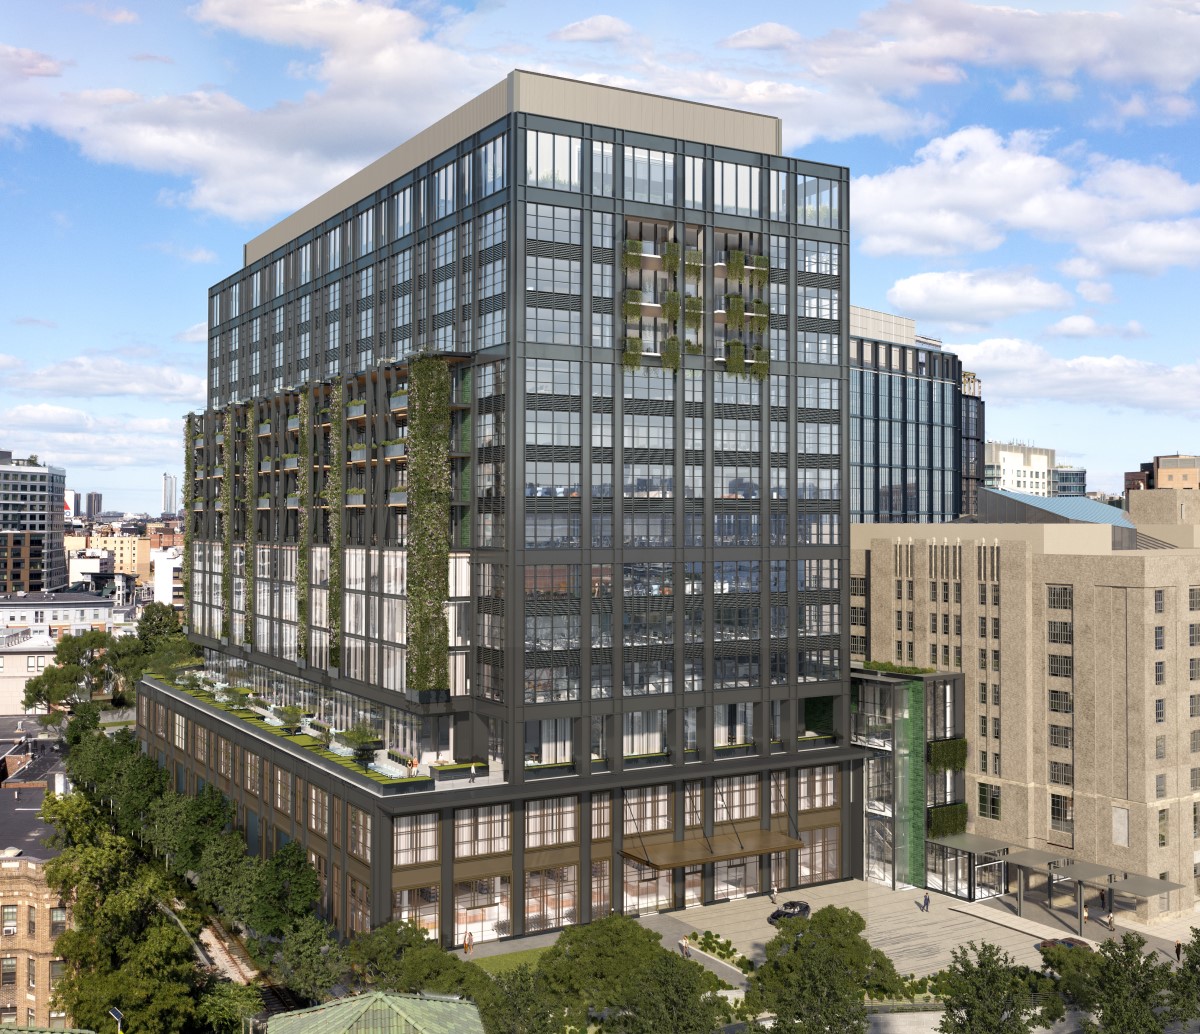
| 99 Coolidge Avenue | 500 North Beacon Street and 4 Kingsbury Avenue**(1)** | 311 Arsenal Street | 201 Brookline Avenue | 401 Park Drive | ||||||||||||||||||||||
| Greater Boston/ Cambridge/Inner Suburbs | Greater Boston/ Cambridge/Inner Suburbs | Greater Boston/ Cambridge/Inner Suburbs | Greater Boston/Fenway | Greater Boston/Fenway | ||||||||||||||||||||||
| 204,395 RSF | 147,394 RSF | 160,053 RSF | 58,149 RSF | 133,578 RSF | ||||||||||||||||||||||
| 36% Leased | 85% Leased | 59% Leased | 98% Leased | 17% Leased | ||||||||||||||||||||||
| |  |  |  |
| 421 Park Drive | 40, 50, and 60 Sylvan Road**(2)** | 840 Winter Street | 1450 Owens Street**(3)** | 651 Gateway Boulevard | ||||||||||||||||||||||||||||||||||
| Greater Boston/Fenway | Greater Boston/Route 128 | Greater Boston/Route 128 | San Francisco Bay Area/ Mission Bay | San Francisco Bay Area/ South San Francisco | ||||||||||||||||||||||||||||||||||
| 392,011 RSF | 576,924 RSF | 139,680 RSF | 212,796 RSF | 282,054 RSF | ||||||||||||||||||||||||||||||||||
| 13% Leased | 29% Leased | 100% Leased | —% Leased/Negotiating | 21% Leased | ||||||||||||||||||||||||||||||||||
 |  |  | 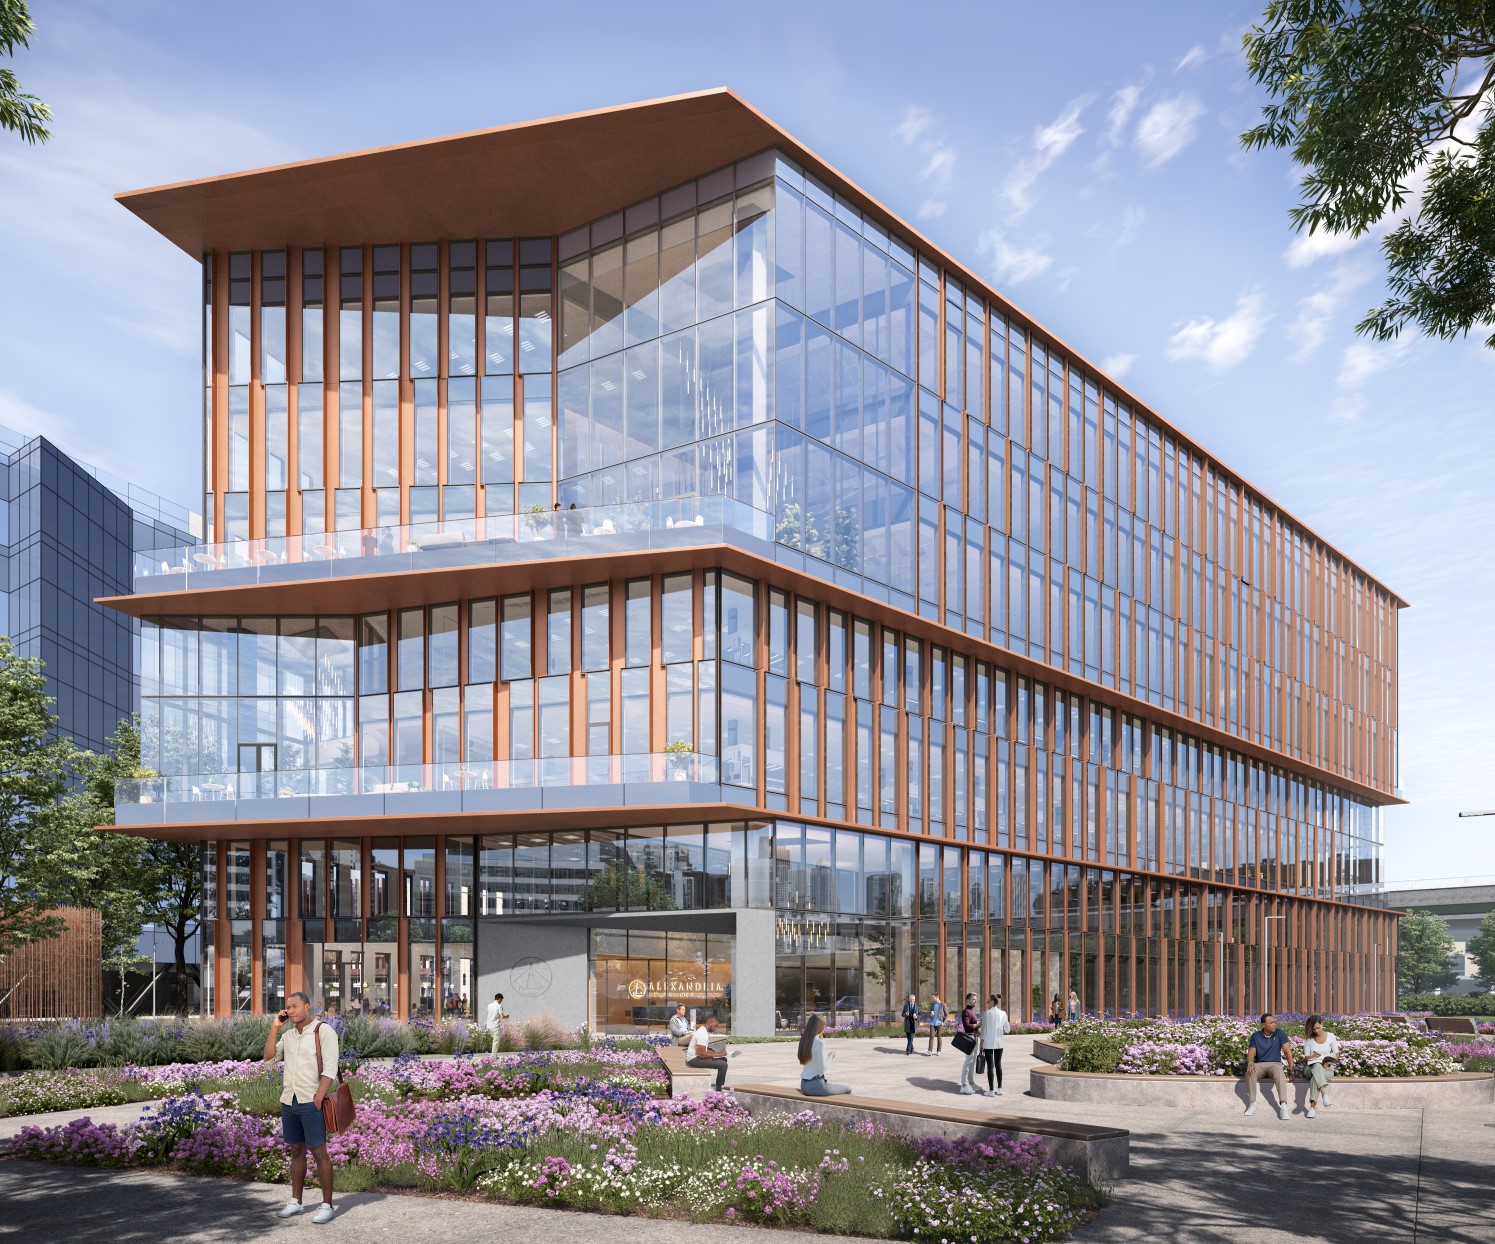 | |
(1)Image represents 500 North Beacon Street on the Arsenal on the Charles mega campus.
(2)Image represents 60 Sylvan Road. The Alexandria Center® for Life Science – Waltham mega campus project is expected to capture demand in our Route 128 submarket.
(3)Image represents a single- or multi-tenant project expanding our existing Alexandria Center® for Science and Technology – Mission Bay mega campus, where our joint venture partner will fund 100% of the construction cost until they attain an ownership interest of 75%, after which they will contribute their respective share of additional capital. We are currently marketing the space for lease and have initial interest from publicly traded biotechnology and institutional tenants.
New Class A/A+ development and redevelopment properties: current projects (continued)
| 230 Harriet Tubman Way | 10935, 10945, and 10955 Alexandria Way**(1)** | 4135 Campus Point Court | 4155 Campus Point Court | 10075 Barnes Canyon Road | |||||||||||||||||||||||||||||||||||||
| San Francisco Bay Area/ South San Francisco | San Diego/Torrey Pines | San Diego/ University Town Center | San Diego/ University Town Center | San Diego/Sorrento Mesa | |||||||||||||||||||||||||||||||||||||
| 285,346 RSF | 334,996 RSF | 426,927 RSF | 171,102 RSF | 254,771 RSF | |||||||||||||||||||||||||||||||||||||
| 100% Leased | 100% Leased | 100% Leased | 100% Leased | 69% Leased/Negotiating | |||||||||||||||||||||||||||||||||||||
 |  | 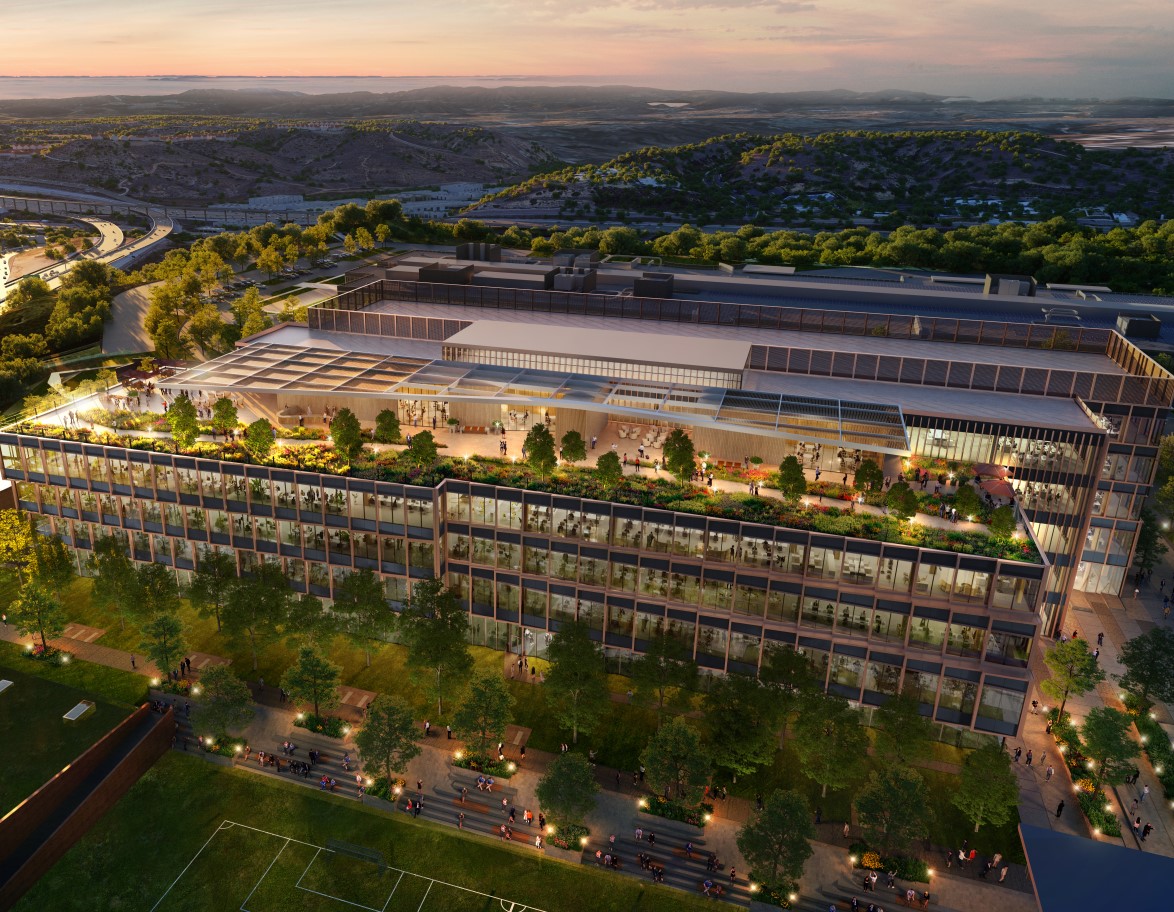 | 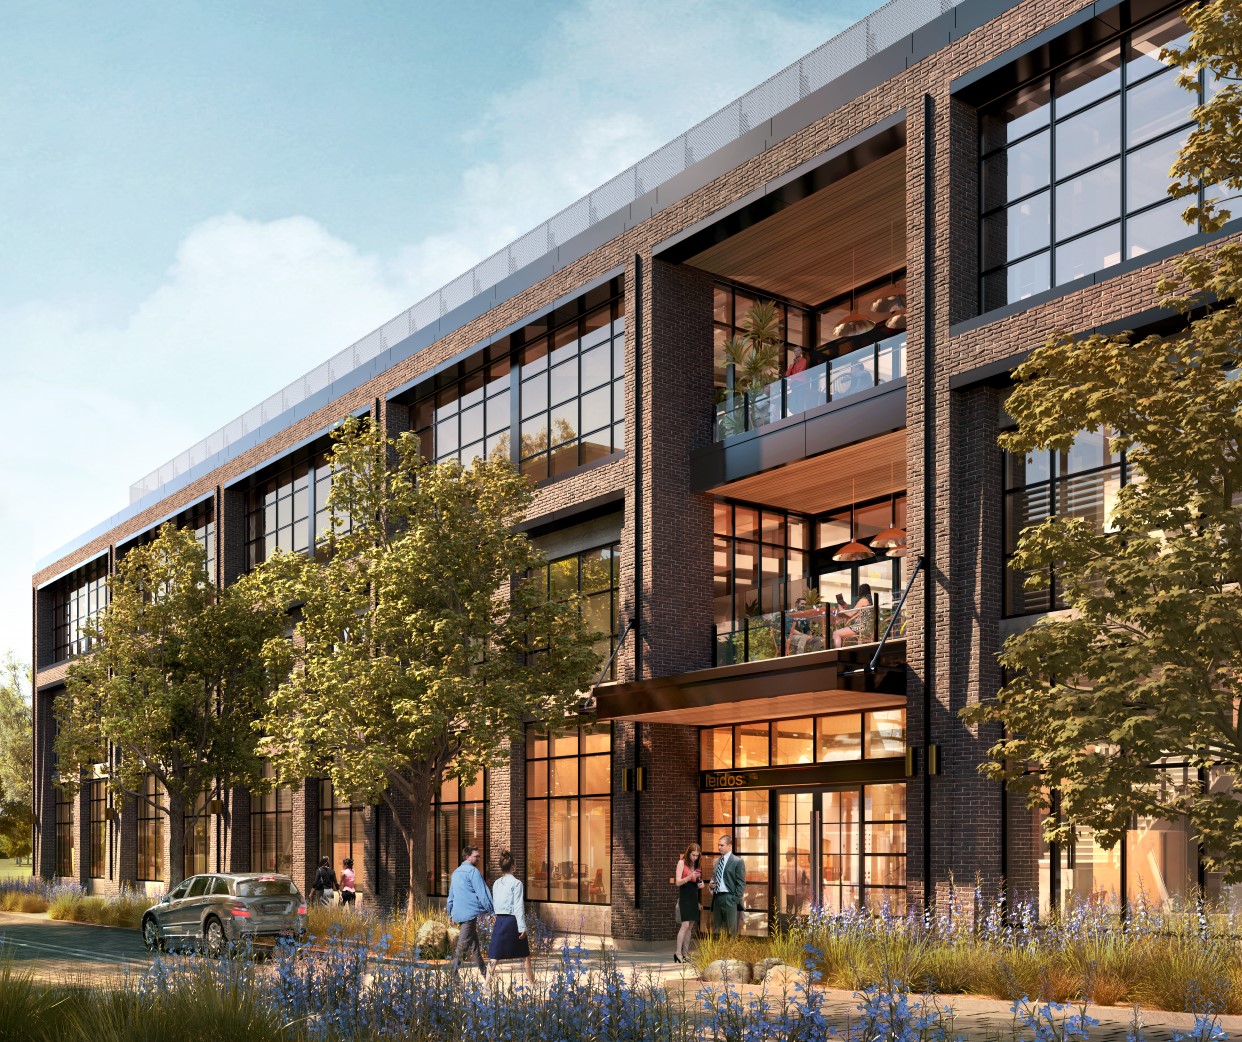 | 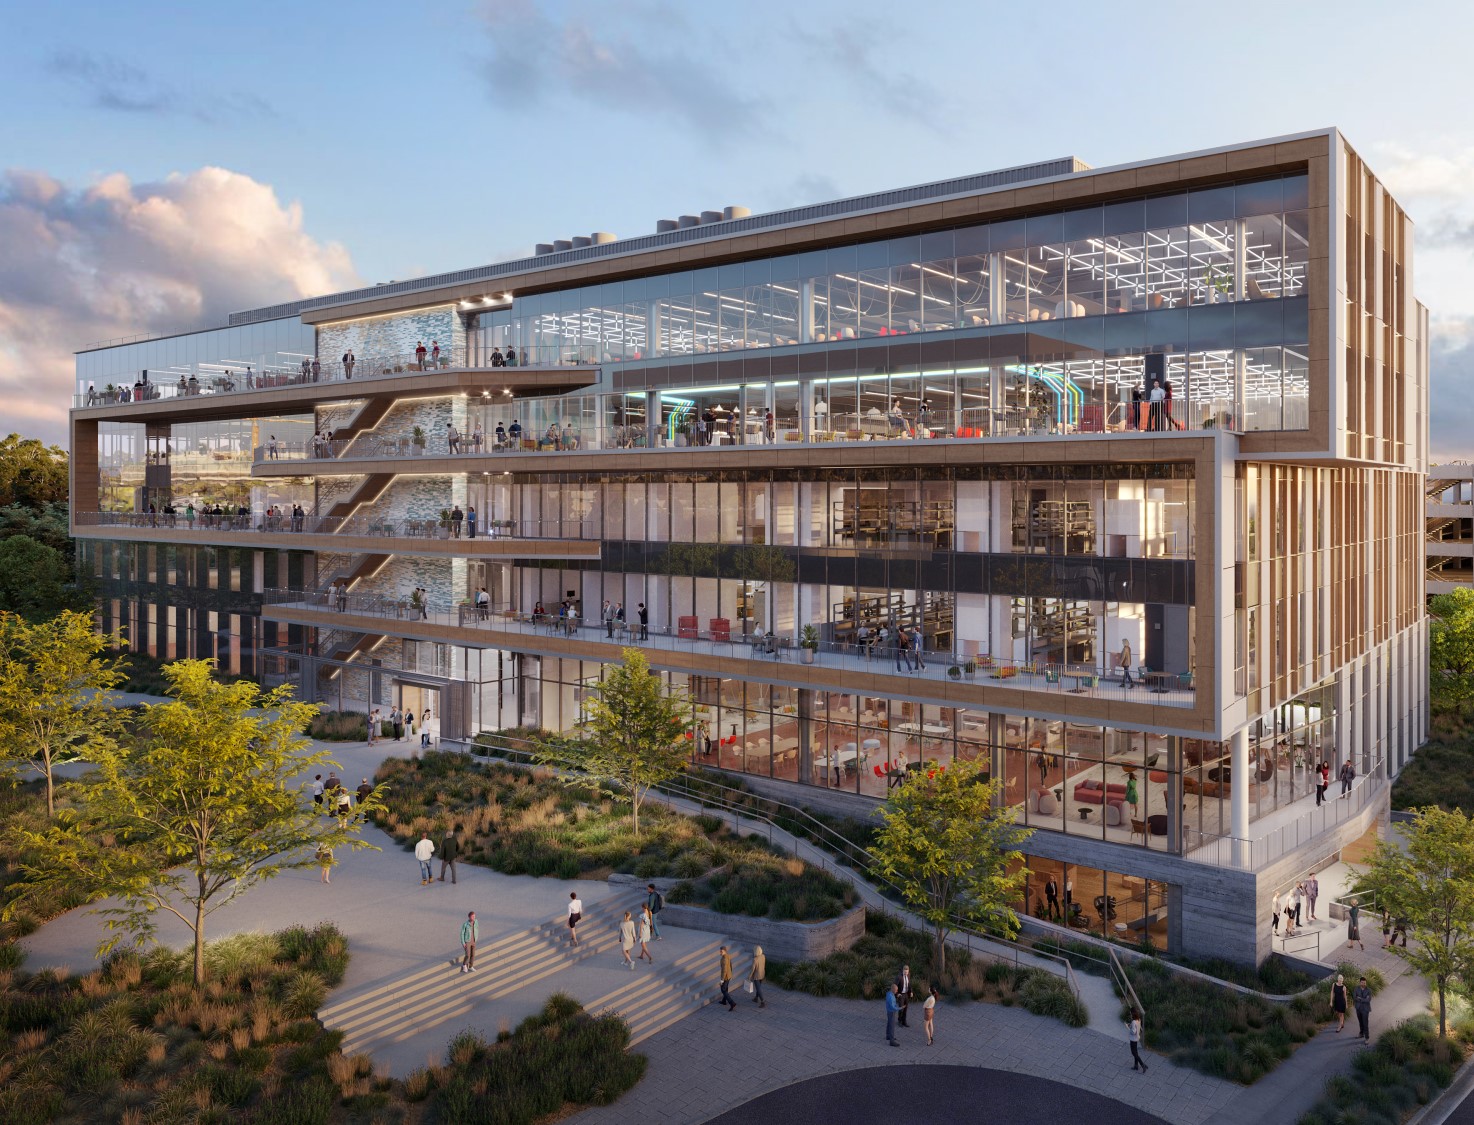 |
| 1150 Eastlake Avenue East | Alexandria Center**®** for Advanced Technologies – Monte Villa Parkway**(2)** | 9810 and 9820 Darnestown Road**(3)** | 9808 Medical Center Drive | 8800 Technology Forest Place | ||||||||||||||||||||||||||||||||||||||||
| Seattle/Lake Union | Seattle/Bothell | Maryland/Rockville | Maryland/Rockville | Texas/Greater Houston | ||||||||||||||||||||||||||||||||||||||||
| 33,349 RSF | 34,306 RSF | 442,000 RSF | 68,601 RSF | 73,298 RSF | ||||||||||||||||||||||||||||||||||||||||
| 100% Leased | 98% Leased/Negotiating | 100% Leased | 60% Leased | 41% Leased | ||||||||||||||||||||||||||||||||||||||||
 | | 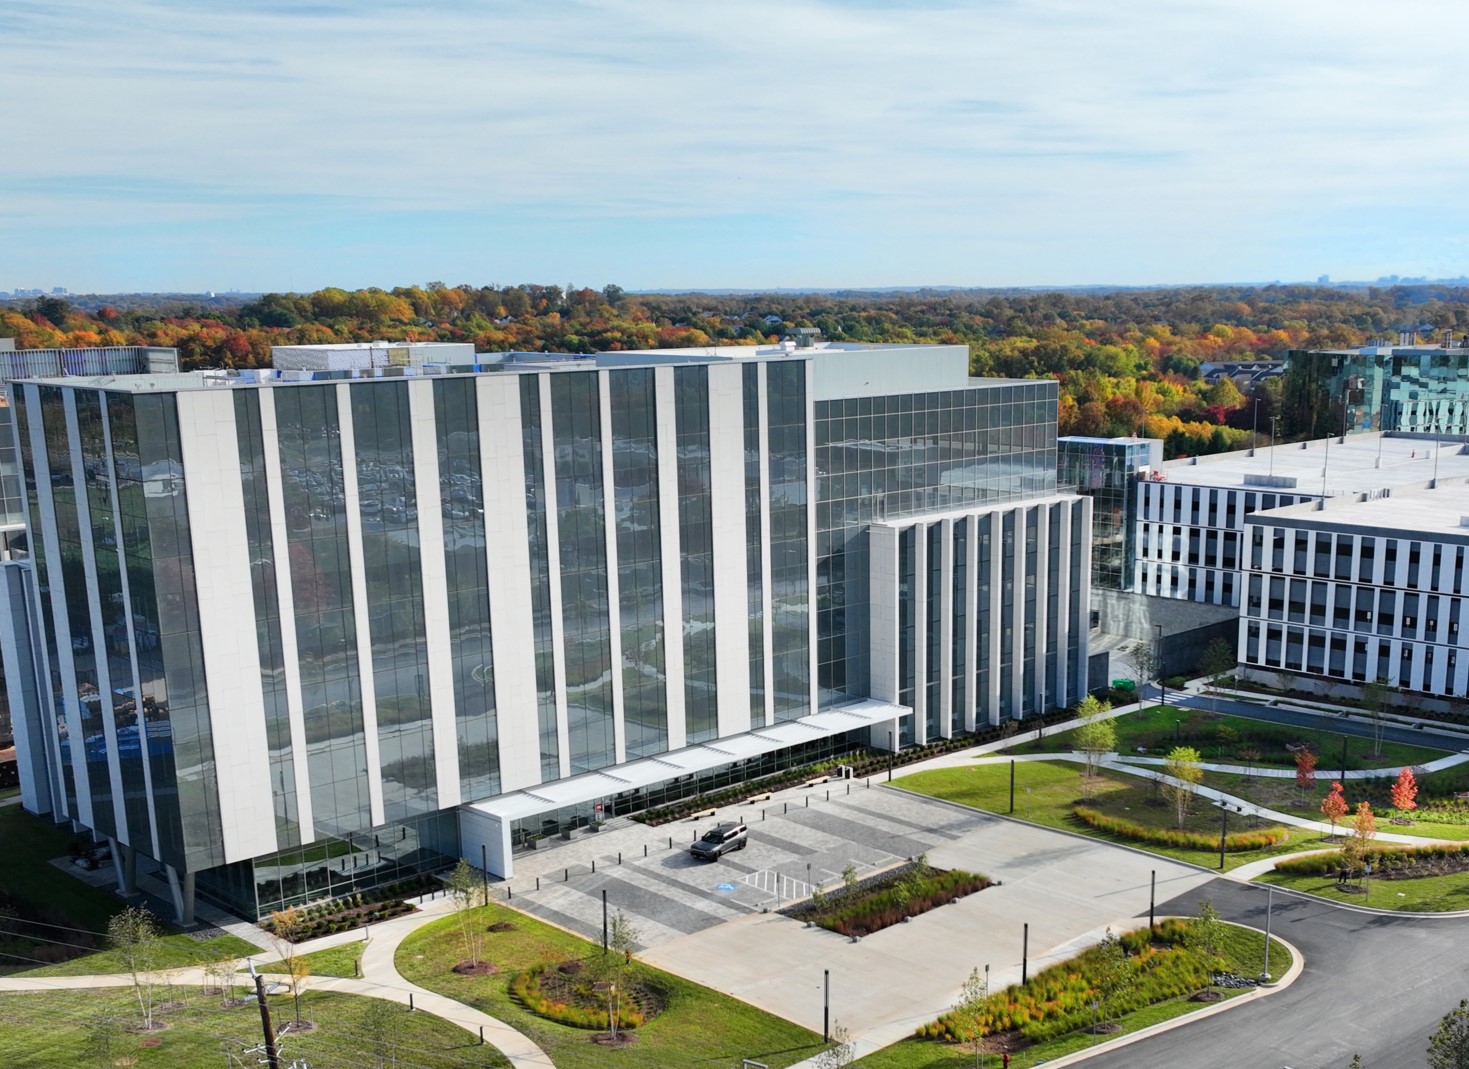 | 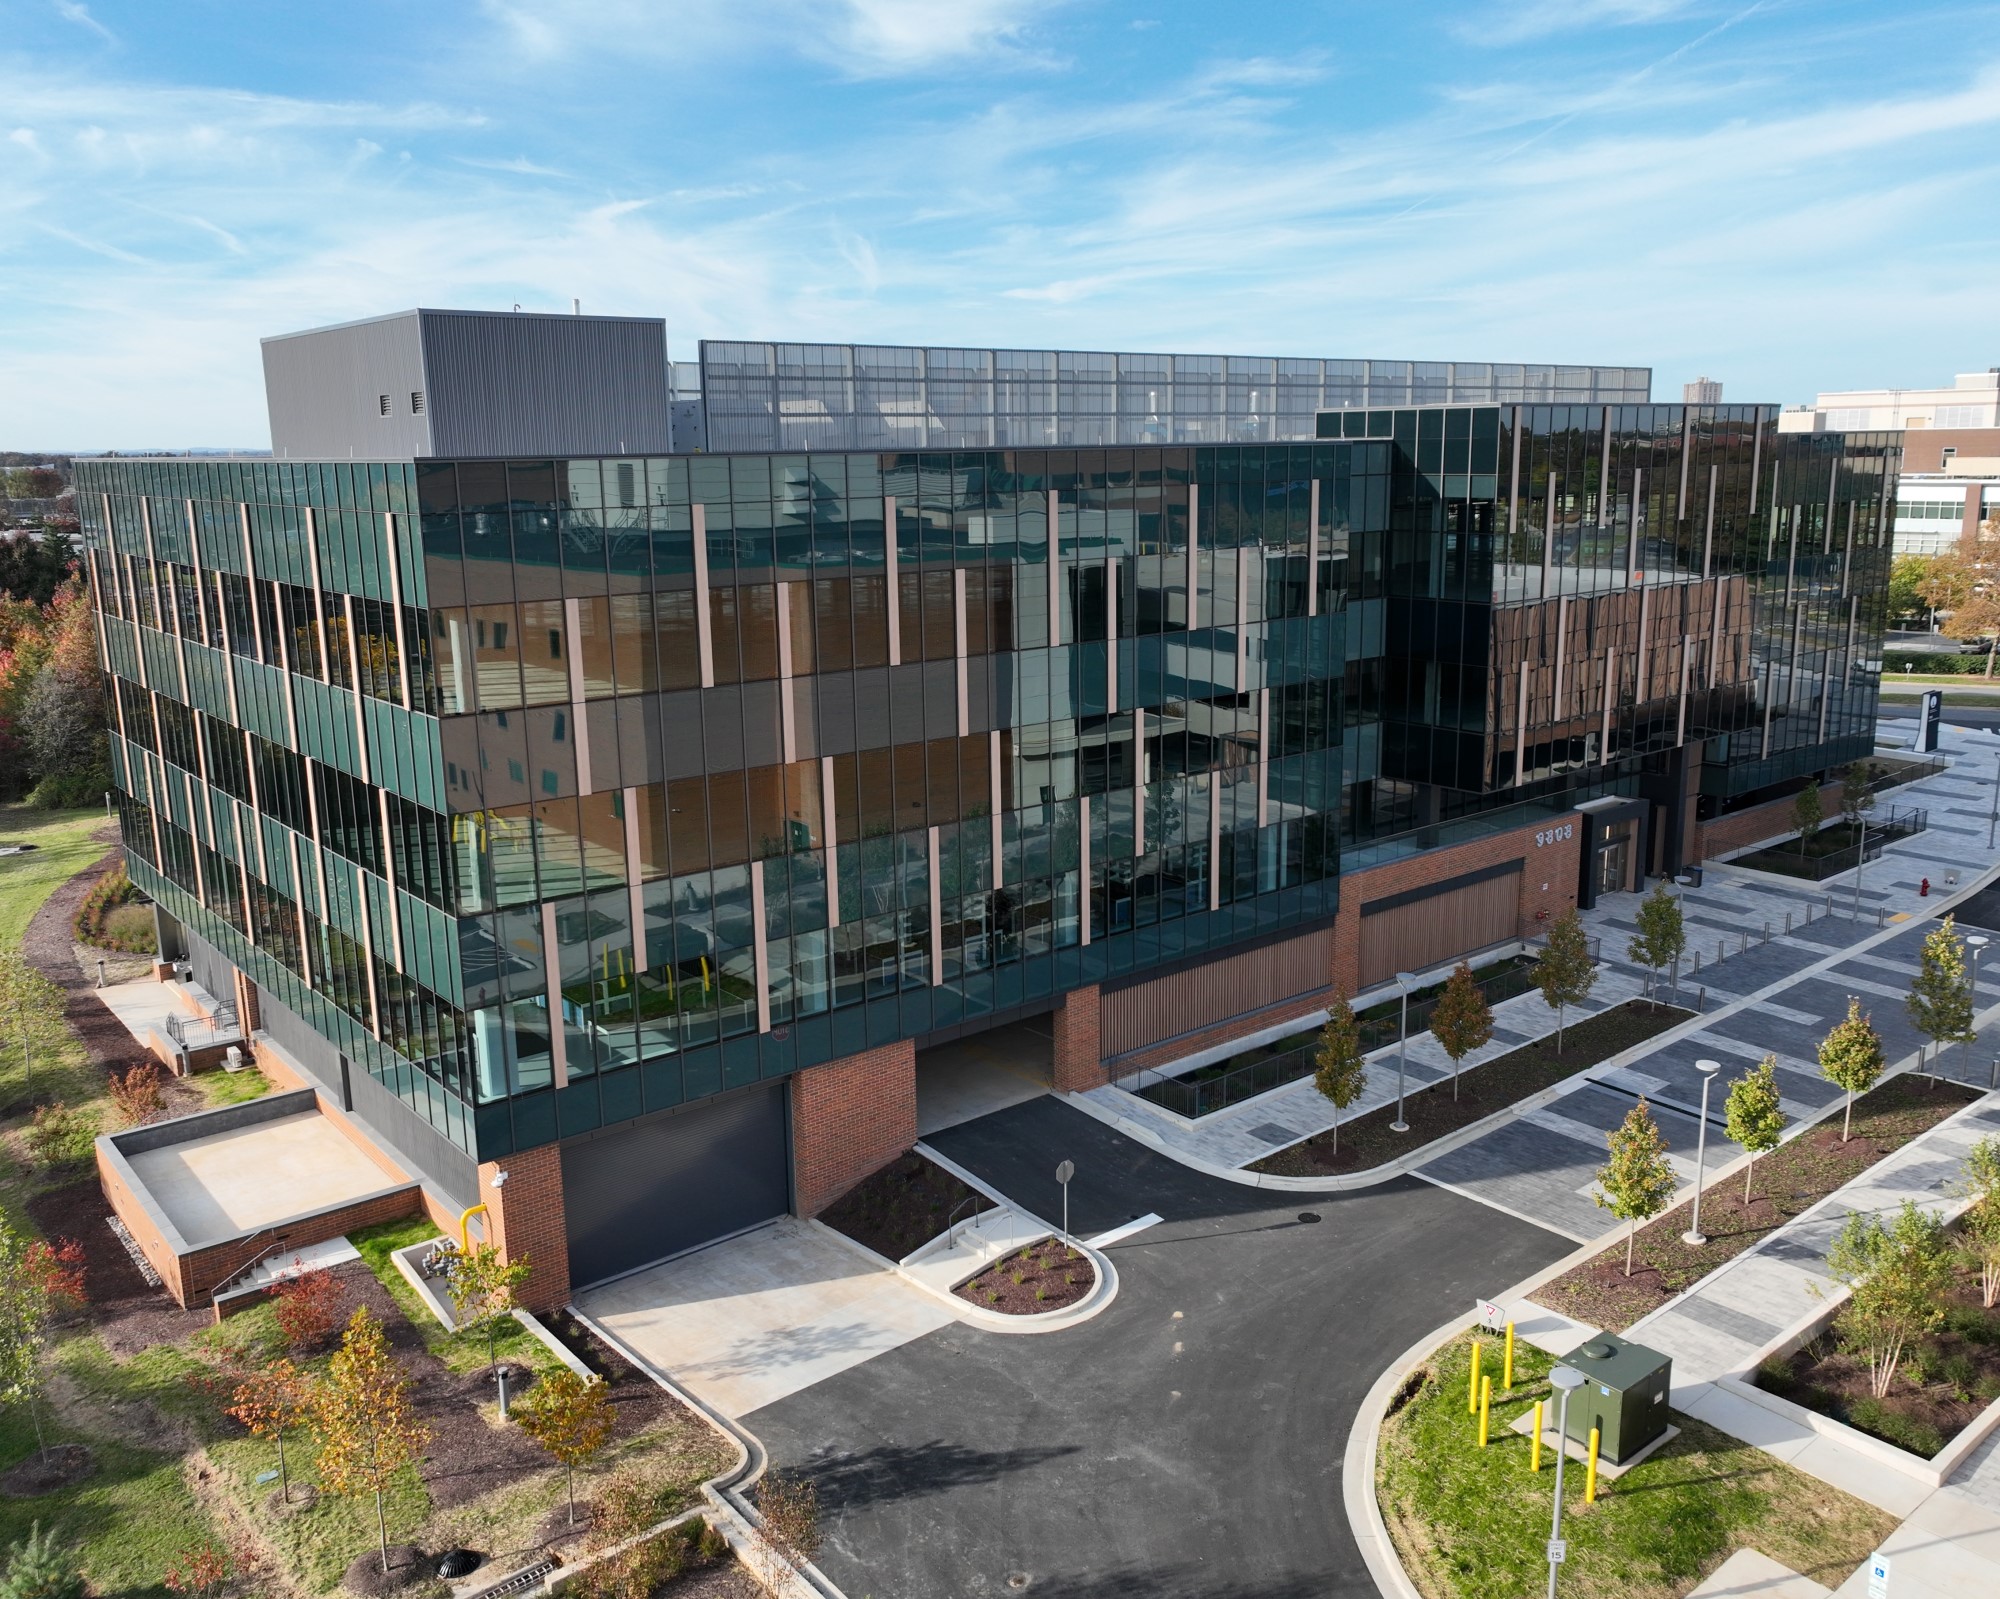 | 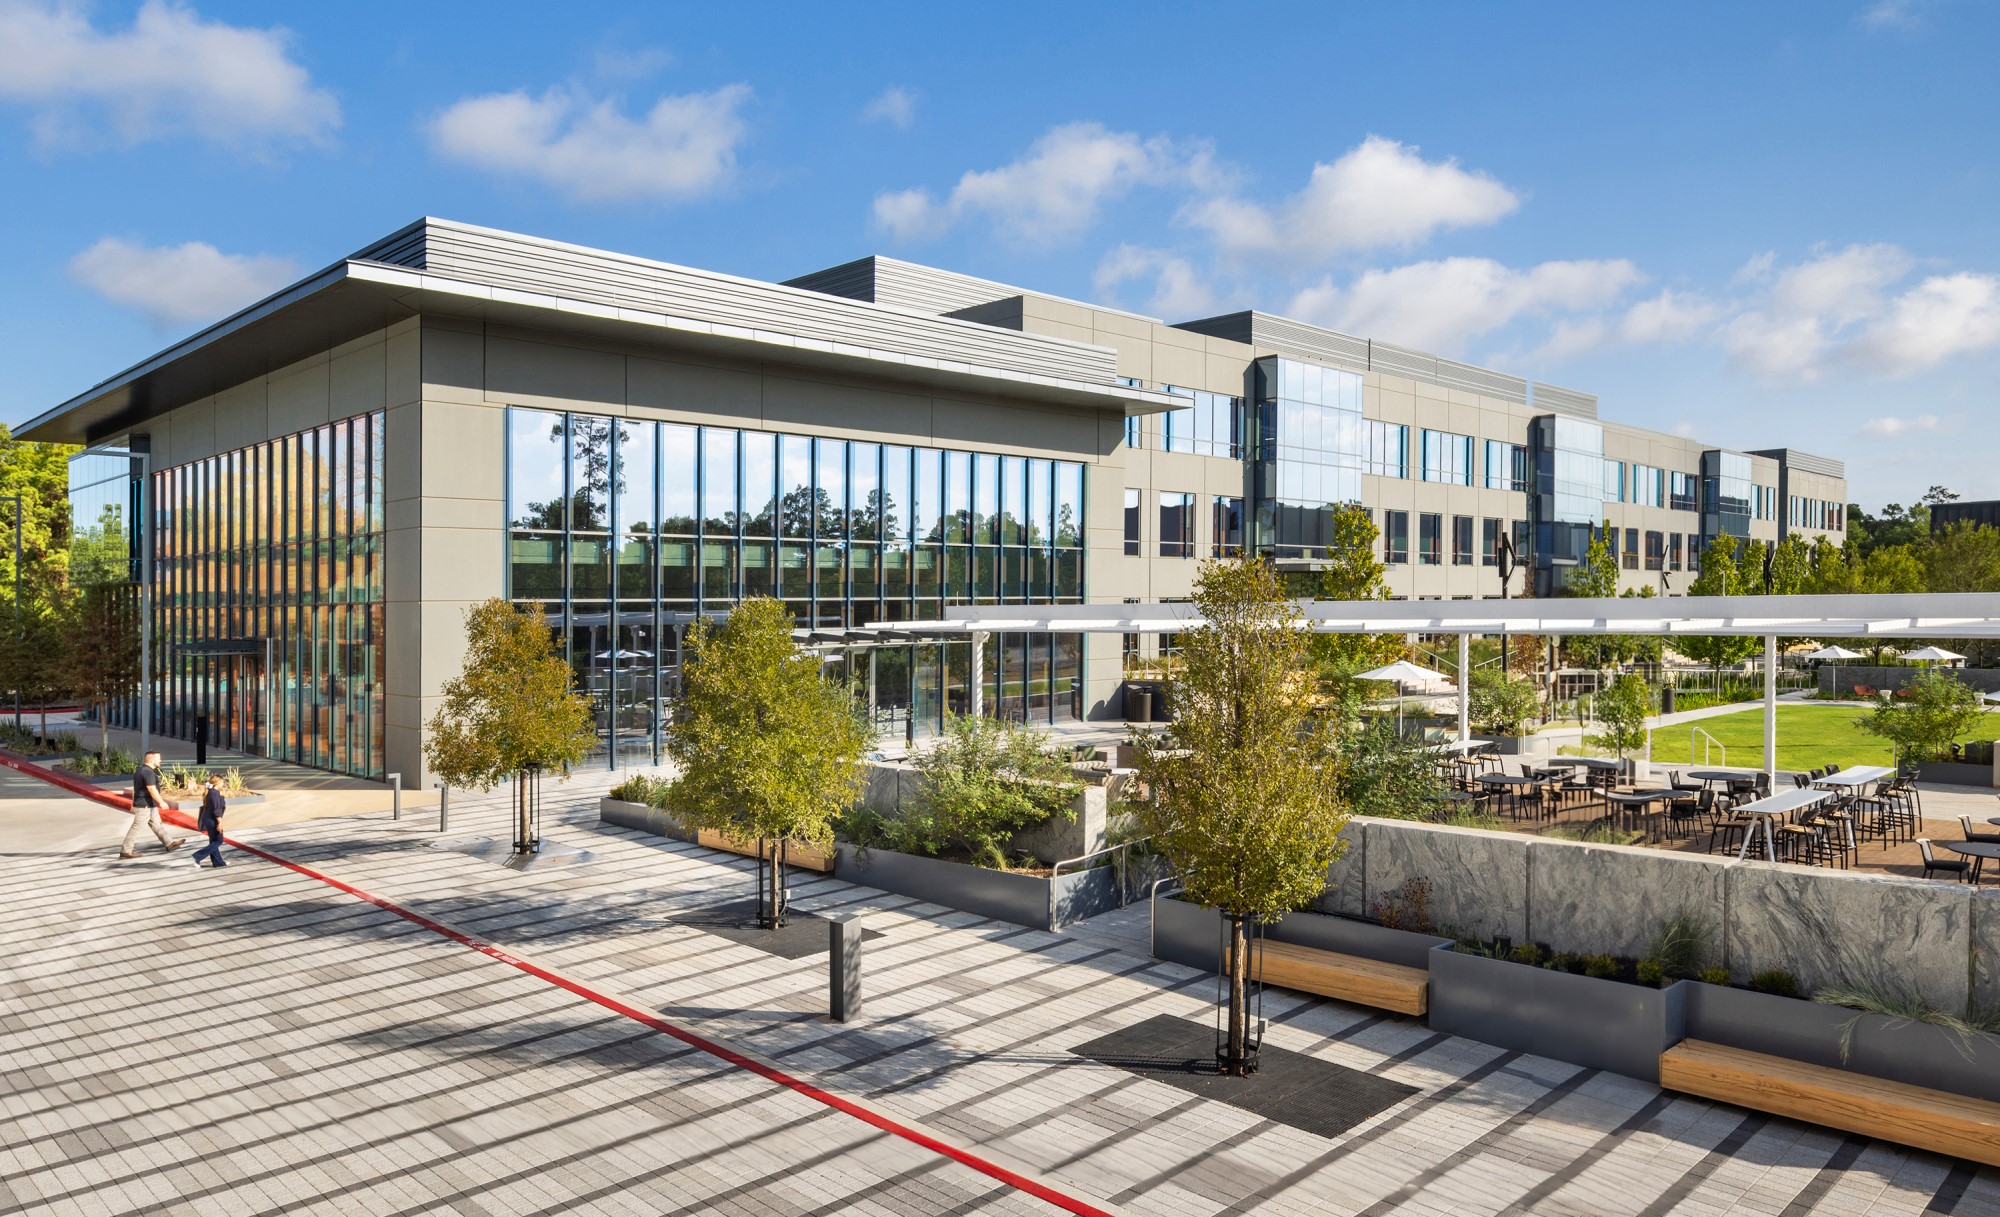 |
(1)Image represents 10955 Alexandria Way.
(2)Image represents 3755 Monte Villa Parkway.
(3)Image represents 9810 Darnestown Road.
New Class A/A+ development and redevelopment properties: current projects (continued)
The following tables set forth a summary of our new Class A/A+ development and redevelopment properties under construction and pre-leased/negotiating near-term projects as of March 31, 2024 (dollars in thousands):
| Property/Market/Submarket | Square Footage | Percentage | Occupancy**(1)** | |||||||||||||||||||||||||||||||||||||||||||||||||||||||||||
| Dev/Redev | In Service | CIP | Total | Leased | Leased/Negotiating | Initial | Stabilized | |||||||||||||||||||||||||||||||||||||||||||||||||||||||
| Under construction | ||||||||||||||||||||||||||||||||||||||||||||||||||||||||||||||
| 2024 stabilization | ||||||||||||||||||||||||||||||||||||||||||||||||||||||||||||||
| 201 Brookline Avenue/Greater Boston/Fenway | Dev | 451,967 | 58,149 | 510,116 | 98 | % | 98 | % | 3Q22 | 4Q24 | ||||||||||||||||||||||||||||||||||||||||||||||||||||
| 840 Winter Street/Greater Boston/Route 128 | Redev | 28,534 | 139,680 | 168,214 | 100 | 100 | 4Q24 | 4Q24 | ||||||||||||||||||||||||||||||||||||||||||||||||||||||
| 230 Harriet Tubman Way/San Francisco Bay Area/South San Francisco | Dev | — | 285,346 | 285,346 | 100 | 100 | 4Q24 | 4Q24 | ||||||||||||||||||||||||||||||||||||||||||||||||||||||
| 4155 Campus Point Court/San Diego/University Town Center | Dev | — | 171,102 | 171,102 | 100 | 100 | 4Q24 | 4Q24 | ||||||||||||||||||||||||||||||||||||||||||||||||||||||
| 1150 Eastlake Avenue East/Seattle/Lake Union | Dev | 278,282 | 33,349 | 311,631 | 100 | 100 | 4Q23 | 3Q24 | ||||||||||||||||||||||||||||||||||||||||||||||||||||||
| Alexandria Center® for Advanced Technologies – Monte Villa Parkway/Seattle/Bothell | Redev | 426,628 | 34,306 | 460,934 | 90 | 98 | 1Q23 | 4Q24 | ||||||||||||||||||||||||||||||||||||||||||||||||||||||
| 9820 Darnestown Road/Maryland/Rockville | Dev | — | 250,000 | 250,000 | 100 | 100 | 4Q24 | 4Q24 | ||||||||||||||||||||||||||||||||||||||||||||||||||||||
| 9810 Darnestown Road/Maryland/Rockville | Dev | — | 192,000 | 192,000 | 100 | 100 | 2Q24 | 2Q24 | ||||||||||||||||||||||||||||||||||||||||||||||||||||||
| 9808 Medical Center Drive/Maryland/Rockville | Dev | 26,460 | 68,601 | 95,061 | 60 | 60 | 3Q23 | 4Q24 | ||||||||||||||||||||||||||||||||||||||||||||||||||||||
| 1,211,871 | 1,232,533 | 2,444,404 | 96 | 98 | ||||||||||||||||||||||||||||||||||||||||||||||||||||||||||
| 2025 stabilization | ||||||||||||||||||||||||||||||||||||||||||||||||||||||||||||||
| 99 Coolidge Avenue/Greater Boston/Cambridge/Inner Suburbs | Dev | 116,414 | 204,395 | 320,809 | 36 | 36 | 4Q23 | 2025 | ||||||||||||||||||||||||||||||||||||||||||||||||||||||
| 500 North Beacon Street and 4 Kingsbury Avenue/Greater Boston/ Cambridge/Inner Suburbs | Dev | 100,624 | 147,394 | 248,018 | 85 | 85 | 1Q24 | 2025 | ||||||||||||||||||||||||||||||||||||||||||||||||||||||
| 651 Gateway Boulevard/San Francisco Bay Area/South San Francisco | Redev | 44,652 | 282,054 | 326,706 | 21 | 21 | 1Q24 | 2025 | ||||||||||||||||||||||||||||||||||||||||||||||||||||||
| 8800 Technology Forest Place/Texas/Greater Houston | Redev | 50,094 | 73,298 | 123,392 | 41 | 41 | 2Q23 | 2025 | ||||||||||||||||||||||||||||||||||||||||||||||||||||||
| Canada | Redev | 87,579 | 163,211 | 250,790 | 73 | 73 | 3Q23 | 2025 | ||||||||||||||||||||||||||||||||||||||||||||||||||||||
| 399,363 | 870,352 | 1,269,715 | 49 | 49 | (2) | |||||||||||||||||||||||||||||||||||||||||||||||||||||||||
| 1,611,234 | 2,102,885 | 3,714,119 | 80 | 81 | ||||||||||||||||||||||||||||||||||||||||||||||||||||||||||
| 2026 and beyond stabilization | ||||||||||||||||||||||||||||||||||||||||||||||||||||||||||||||
| 311 Arsenal Street/Greater Boston/Cambridge/Inner Suburbs | Redev | 230,609 | (3) | 160,053 | 390,662 | 59 | 59 | 2027 | 2027 | |||||||||||||||||||||||||||||||||||||||||||||||||||||
| 401 Park Drive/Greater Boston/Fenway | Redev | — | 133,578 | 133,578 | 17 | 17 | 2024 | 2026 | ||||||||||||||||||||||||||||||||||||||||||||||||||||||
| 421 Park Drive/Greater Boston/Fenway | Dev | — | 392,011 | 392,011 | 13 | 13 | 2026 | 2027 | ||||||||||||||||||||||||||||||||||||||||||||||||||||||
| 40, 50, and 60 Sylvan Road/Greater Boston/Route 128 | Redev | — | 576,924 | 576,924 | 29 | 29 | 2025 | 2027 | ||||||||||||||||||||||||||||||||||||||||||||||||||||||
| Other/Greater Boston | Redev | — | 453,869 | 453,869 | — | — | 2026 | 2027 | ||||||||||||||||||||||||||||||||||||||||||||||||||||||
| 1450 Owens Street/San Francisco Bay Area/Mission Bay | Dev | — | 212,796 | 212,796 | — | — | (4) | 2025 | 2026 | |||||||||||||||||||||||||||||||||||||||||||||||||||||
| 10935, 10945, and 10955 Alexandria Way/San Diego/Torrey Pines | Dev | — | 334,996 | 334,996 | 100 | 100 | 2025 | 2026 | ||||||||||||||||||||||||||||||||||||||||||||||||||||||
| 4135 Campus Point Court/San Diego/University Town Center | Dev | — | 426,927 | 426,927 | 100 | 100 | 2026 | 2026 | ||||||||||||||||||||||||||||||||||||||||||||||||||||||
| 10075 Barnes Canyon Road/San Diego/Sorrento Mesa | Dev | — | 254,771 | 254,771 | 19 | 69 | 2025 | 2026 | ||||||||||||||||||||||||||||||||||||||||||||||||||||||
| 230,609 | 2,945,925 | 3,176,534 | 40 | 44 | (2) | |||||||||||||||||||||||||||||||||||||||||||||||||||||||||
| 1,841,843 | 5,048,810 | 6,890,653 | 62 | 64 | ||||||||||||||||||||||||||||||||||||||||||||||||||||||||||
| Committed near-term project expected to commence construction in the next two years | ||||||||||||||||||||||||||||||||||||||||||||||||||||||||||||||
| 4165 Campus Point Court/San Diego/University Town Center | Dev | — | 492,570 | 492,570 | — | 51 | ||||||||||||||||||||||||||||||||||||||||||||||||||||||||
| Total | 1,841,843 | 5,541,380 | 7,383,223 | 58 | % | 63 | % | |||||||||||||||||||||||||||||||||||||||||||||||||||||||
| (1)Initial occupancy dates are subject to leasing and/or market conditions. Stabilized occupancy may vary depending on single tenancy versus multi-tenancy. Multi-tenant projects may increase in occupancy over a period of time. (2)Represents projects focused on demand from our existing tenants in our adjacent properties/campuses and that will also address demand from other non-Alexandria properties/campuses. (3)We expect to redevelop an additional 173,705 RSF of occupied space into laboratory space upon expiration of the existing leases through the second half of 2025. Refer to “Investments in real estate” under “Definitions and reconciliations” in Item 2 for additional information. (4)Represents a single- or multi-tenant project expanding our existing mega campus, where our joint venture partner will fund 100% of the construction cost until they attains an ownership interest of 75%, after which they will contribute their respective share of additional capital. We are currently marketing the space for lease and have initial interest from publicly traded biotechnology and institutional tenants. |
New Class A/A+ development and redevelopment properties: current projects (continued)
| Our Ownership Interest | At 100% | Unlevered Yields | |||||||||||||||||||||||||||||||||||||||||||||||||||||||||
| Property/Market/Submarket | In Service | CIP | Cost to Complete | Total at Completion | Initial Stabilized | Initial Stabilized (Cash Basis) | |||||||||||||||||||||||||||||||||||||||||||||||||||||
| Under construction | |||||||||||||||||||||||||||||||||||||||||||||||||||||||||||
| 2024 stabilization | |||||||||||||||||||||||||||||||||||||||||||||||||||||||||||
| 201 Brookline Avenue/Greater Boston/Fenway | 99.0 | % | $ | 662,979 | $ | 86,657 | $ | 25,364 | $ | 775,000 | 7.2 | % | 6.5 | % | |||||||||||||||||||||||||||||||||||||||||||||
| 840 Winter Street/Greater Boston/Route 128 | 100 | % | 13,649 | 170,501 | 23,850 | 208,000 | 7.5 | % | 6.5 | % | |||||||||||||||||||||||||||||||||||||||||||||||||
| 230 Harriet Tubman Way/San Francisco Bay Area/South San Francisco | 47.4 | % | — | 273,434 | 236,566 | 510,000 | 7.4 | % | 6.4 | % | |||||||||||||||||||||||||||||||||||||||||||||||||
| 4155 Campus Point Court/San Diego/University Town Center | 55.0 | % | — | 109,061 | 63,939 | 173,000 | 7.4 | % | 6.5 | % | |||||||||||||||||||||||||||||||||||||||||||||||||
| 1150 Eastlake Avenue East/Seattle/Lake Union | 100 | % | 371,166 | 40,332 | 31,502 | 443,000 | 6.6 | % | 6.7 | % | |||||||||||||||||||||||||||||||||||||||||||||||||
| Alexandria Center® for Advanced Technologies – Monte Villa Parkway/Seattle/Bothell | 100 | % | 192,995 | 10,956 | 25,049 | 229,000 | 6.3 | % | 6.2 | % | |||||||||||||||||||||||||||||||||||||||||||||||||
| 9820 Darnestown Road/Maryland/Rockville | 100 | % | — | 156,118 | 20,882 | 177,000 | 6.3 | % | 5.6 | % | |||||||||||||||||||||||||||||||||||||||||||||||||
| 9810 Darnestown Road/Maryland/Rockville | 100 | % | — | 112,603 | 20,397 | 133,000 | 6.9 | % | 6.2 | % | |||||||||||||||||||||||||||||||||||||||||||||||||
| 9808 Medical Center Drive/Maryland/Rockville | 100 | % | 35,208 | 68,984 | 8,808 | 113,000 | 5.5 | % | 5.5 | % | |||||||||||||||||||||||||||||||||||||||||||||||||
| 1,275,997 | 1,028,646 | ||||||||||||||||||||||||||||||||||||||||||||||||||||||||||
| 2025 stabilization | |||||||||||||||||||||||||||||||||||||||||||||||||||||||||||
| 99 Coolidge Avenue/Greater Boston/Cambridge/Inner Suburbs | 75.0 | % | 135,536 | 173,314 | 159,150 | 468,000 | 7.1 | % | 7.0 | % | |||||||||||||||||||||||||||||||||||||||||||||||||
| 500 North Beacon Street and 4 Kingsbury Avenue/Greater Boston/ Cambridge/Inner Suburbs | 100 | % | 159,702 | 201,424 | 65,874 | 427,000 | 6.2 | % | 5.5 | % | |||||||||||||||||||||||||||||||||||||||||||||||||
| 651 Gateway Boulevard/San Francisco Bay Area/South San Francisco | 50.0 | % | 58,391 | 265,563 | 163,046 | 487,000 | 5.0 | % | 5.1 | % | |||||||||||||||||||||||||||||||||||||||||||||||||
| 8800 Technology Forest Place/Texas/Greater Houston | 100 | % | 44,797 | 58,761 | 8,442 | 112,000 | 6.3 | % | 6.0 | % | |||||||||||||||||||||||||||||||||||||||||||||||||
| Canada | 100 | % | 34,952 | 52,446 | 25,602 | 113,000 | 6.4 | % | 6.3 | % | |||||||||||||||||||||||||||||||||||||||||||||||||
| 433,378 | 751,508 | ||||||||||||||||||||||||||||||||||||||||||||||||||||||||||
| 2026 and beyond stabilization(1) | |||||||||||||||||||||||||||||||||||||||||||||||||||||||||||
| 311 Arsenal Street/Greater Boston/Cambridge/Inner Suburbs | 100 | % | 163,136 | 121,406 | TBD | ||||||||||||||||||||||||||||||||||||||||||||||||||||||
| 401 Park Drive/Greater Boston/Fenway | 100 | % | — | 148,439 | |||||||||||||||||||||||||||||||||||||||||||||||||||||||
| 421 Park Drive/Greater Boston/Fenway | 99.7 | % | — | 327,424 | |||||||||||||||||||||||||||||||||||||||||||||||||||||||
| 40, 50, and 60 Sylvan Road/Greater Boston/Route 128 | 100 | % | — | 411,537 | |||||||||||||||||||||||||||||||||||||||||||||||||||||||
| Other/Greater Boston | 100 | % | — | 139,663 | |||||||||||||||||||||||||||||||||||||||||||||||||||||||
| 1450 Owens Street/San Francisco Bay Area/Mission Bay | 27.2 | % | — | 220,899 | |||||||||||||||||||||||||||||||||||||||||||||||||||||||
| 10935, 10945, and 10955 Alexandria Way/San Diego/Torrey Pines | 100 | % | — | 230,484 | 272,516 | 503,000 | 6.2 | % | 5.8 | % | |||||||||||||||||||||||||||||||||||||||||||||||||
| 4135 Campus Point Court/San Diego/University Town Center | 55.0 | % | — | 184,659 | TBD | ||||||||||||||||||||||||||||||||||||||||||||||||||||||
| 10075 Barnes Canyon Road/San Diego/Sorrento Mesa | 50.0 | % | — | 148,818 | |||||||||||||||||||||||||||||||||||||||||||||||||||||||
| 163,136 | 1,933,329 | ||||||||||||||||||||||||||||||||||||||||||||||||||||||||||
| 1,872,511 | 3,713,483 | ||||||||||||||||||||||||||||||||||||||||||||||||||||||||||
| Committed near-term project expected to commence construction in the next two years | |||||||||||||||||||||||||||||||||||||||||||||||||||||||||||
| 4165 Campus Point Court/San Diego/University Town Center | 55.0 | % | — | 50,734 | TBD | ||||||||||||||||||||||||||||||||||||||||||||||||||||||
| Total | $ | 1,872,511 | $ | 3,764,217 | $ | 4,090,000 | (2) | $ | 9,730,000 | (2) | |||||||||||||||||||||||||||||||||||||||||||||||||
| Our share of investment(2)(3) | $ | 1,800,000 | $ | 3,060,000 | $ | 3,230,000 | $ | 8,090,000 | |||||||||||||||||||||||||||||||||||||||||||||||||||
| Refer to “Initial stabilized yield (unlevered)” under “Definitions and reconciliations” in Item 2 for additional information. (1)We expect to provide total estimated costs and related yields for each project with estimated stabilization in 2026 and beyond over the next several quarters. (2)Represents dollar amount rounded to the nearest $10 million and includes preliminary estimated amounts for projects listed as TBD. (3)Represents our share of investment based on our ownership percentage upon completion of development or redevelopment projects. |
New Class A/A+ development and redevelopment properties: summary of pipeline
69% of Our Total Value-Creation Pipeline RSF Is Within Our Mega Campuses
The following table summarizes the key information for all our development and redevelopment projects in North America as of March 31, 2024 (dollars in thousands):
| Market Property/Submarket | Our Ownership Interest | Book Value | Square Footage | |||||||||||||||||||||||||||||||||||||||||||||||
| Development and Redevelopment | Total**(1)** | |||||||||||||||||||||||||||||||||||||||||||||||||
| Active and Near-Term Construction | Future Opportunities Subject to Market Conditions and Leasing | |||||||||||||||||||||||||||||||||||||||||||||||||
| Under Construction | Committed Near Term | Priority Anticipated | Future | |||||||||||||||||||||||||||||||||||||||||||||||
| Greater Boston | ||||||||||||||||||||||||||||||||||||||||||||||||||
| Mega Campus: The Arsenal on the Charles/Cambridge/Inner Suburbs | 100 | % | $ | 334,152 | 307,447 | — | 173,705 | 34,157 | 515,309 | |||||||||||||||||||||||||||||||||||||||||
| 311 Arsenal Street, 500 North Beacon Street, and 4 Kingsbury Avenue | ||||||||||||||||||||||||||||||||||||||||||||||||||
| 99 Coolidge Avenue/Cambridge/Inner Suburbs | 75.0 | % | 173,314 | 204,395 | — | — | — | 204,395 | ||||||||||||||||||||||||||||||||||||||||||
| Mega Campus: Alexandria Center**®** for Life Science – Fenway/Fenway | (2) | 562,520 | 583,738 | — | — | — | 583,738 | |||||||||||||||||||||||||||||||||||||||||||
| 201 Brookline Avenue and 401 and 421 Park Drive | ||||||||||||||||||||||||||||||||||||||||||||||||||
| Mega Campus: Alexandria Center**®** for Life Science – Waltham/Route 128 | 100 | % | 643,372 | 716,604 | — | — | 515,000 | 1,231,604 | ||||||||||||||||||||||||||||||||||||||||||
| 40, 50, and 60 Sylvan Road, 35 Gatehouse Drive, and 840 Winter Street | ||||||||||||||||||||||||||||||||||||||||||||||||||
| Mega Campus: Alexandria Center**®** at Kendall Square/Cambridge | 100 | % | 119,609 | — | — | — | 216,455 | 216,455 | ||||||||||||||||||||||||||||||||||||||||||
| 100 Edwin H. Land Boulevard | ||||||||||||||||||||||||||||||||||||||||||||||||||
| Mega Campus: Alexandria Technology Square**®****/Cambridge** | 100 | % | 7,881 | — | — | — | 100,000 | 100,000 | ||||||||||||||||||||||||||||||||||||||||||
| Mega Campus: 480 Arsenal Way and 446, 458, 500, and 550 Arsenal Street/Cambridge/Inner Suburbs | 100 | % | 84,444 | — | — | — | 902,000 | 902,000 | ||||||||||||||||||||||||||||||||||||||||||
| 446, 458, 500, and 550 Arsenal Street | ||||||||||||||||||||||||||||||||||||||||||||||||||
| Mega Campus: 285, 299, 307, and 345 Dorchester Avenue/Seaport Innovation District | 60.0 | % | 280,390 | — | — | — | 1,040,000 | 1,040,000 | ||||||||||||||||||||||||||||||||||||||||||
| 10 Necco Street/Seaport Innovation District | 100 | % | 104,649 | — | — | — | 175,000 | 175,000 | ||||||||||||||||||||||||||||||||||||||||||
| Mega Campus: One Moderna Way/Route 128 | 100 | % | 26,469 | — | — | — | 1,100,000 | 1,100,000 | ||||||||||||||||||||||||||||||||||||||||||
| 215 Presidential Way/Route 128 | 100 | % | 6,816 | — | — | — | 112,000 | 112,000 | ||||||||||||||||||||||||||||||||||||||||||
| Other value-creation projects | (3) | 290,775 | 453,869 | — | — | 1,323,541 | 1,777,410 | |||||||||||||||||||||||||||||||||||||||||||
| $ | 2,634,391 | 2,266,053 | — | 173,705 | 5,518,153 | 7,957,911 | ||||||||||||||||||||||||||||||||||||||||||||
| Refer to “Mega campus” under “Definitions and reconciliations” in Item 2 for additional information. (1)Represents total square footage upon completion of development or redevelopment of one or more new Class A/A+ properties. Square footage presented includes the RSF of buildings currently in operation at properties that also have future development or redevelopment opportunities. Upon expiration of existing in-place leases, we have the intent to demolish or redevelop the existing property. Refer to “Investments in real estate” under “Definitions and reconciliations” in Item 2 for additional information, including value-creation square feet currently included in rental properties. (2)We have a 99.0% interest in 201 Brookline Avenue aggregating 58,149 RSF, a 100% interest in 401 Park Drive aggregating 133,578 RSF, and a 99.7% interest in 421 Park Drive aggregating 392,011 RSF. (3)Includes a property in which we own a partial interest through a real estate joint venture. Refer to Note 4 – “Consolidated and unconsolidated real estate joint ventures” to our unaudited consolidated financial statements in Item 1 for additional details. | ||||||||||||||||||||||||||||||||||||||||||||||||||
New Class A/A+ development and redevelopment properties: summary of pipeline (continued)
| Market Property/Submarket | Our Ownership Interest | Book Value | Square Footage | |||||||||||||||||||||||||||||||||||||||||||||||
| Development and Redevelopment | Total**(1)** | |||||||||||||||||||||||||||||||||||||||||||||||||
| Active and Near-Term Construction | Future Opportunities Subject to Market Conditions and Leasing | |||||||||||||||||||||||||||||||||||||||||||||||||
| Under Construction | Committed Near Term | Priority Anticipated | Future | |||||||||||||||||||||||||||||||||||||||||||||||
| San Francisco Bay Area | ||||||||||||||||||||||||||||||||||||||||||||||||||
| Mega Campus: Alexandria Center**®** for Science and Technology – Mission Bay/Mission Bay | 27.2 | % | $ | 220,899 | 212,796 | — | — | — | 212,796 | |||||||||||||||||||||||||||||||||||||||||
| 1450 Owens Street | ||||||||||||||||||||||||||||||||||||||||||||||||||
| Alexandria Center® for Life Science – Millbrae/South San Francisco | 47.4 | % | 427,652 | 285,346 | — | 198,188 | 150,213 | 633,747 | ||||||||||||||||||||||||||||||||||||||||||
| 230 Harriet Tubman Way, 201 and 231 Adrian Road, and 6 and 30 Rollins Road | ||||||||||||||||||||||||||||||||||||||||||||||||||
| Mega Campus: Alexandria Technology Center**®** – Gateway/South San Francisco | 50.0 | % | 292,111 | 282,054 | — | — | 291,000 | 573,054 | ||||||||||||||||||||||||||||||||||||||||||
| 651 Gateway Boulevard | ||||||||||||||||||||||||||||||||||||||||||||||||||
| Mega Campus: Alexandria Center**®** for Advanced Technologies – Tanforan/South San Francisco | 100 | % | 383,068 | — | — | 150,000 | 1,780,000 | 1,930,000 | ||||||||||||||||||||||||||||||||||||||||||
| 1122, 1150, and 1178 El Camino Real | ||||||||||||||||||||||||||||||||||||||||||||||||||
| Mega Campus: Alexandria Center**®** for Advanced Technologies – South San Francisco/South San Francisco | 100 | % | 6,655 | — | — | 107,250 | 90,000 | 197,250 | ||||||||||||||||||||||||||||||||||||||||||
| 211*(2)* and 269 East Grand Avenue | ||||||||||||||||||||||||||||||||||||||||||||||||||
| Mega Campus: Alexandria Center**®** for Life Science – San Carlos/Greater Stanford | 100 | % | 429,330 | — | — | 105,000 | 1,392,830 | 1,497,830 | ||||||||||||||||||||||||||||||||||||||||||
| 960 Industrial Road, 987 and 1075 Commercial Street, and 888 Bransten Road | ||||||||||||||||||||||||||||||||||||||||||||||||||
| 3825 and 3875 Fabian Way/Greater Stanford | 100 | % | 149,526 | — | — | — | 478,000 | 478,000 | ||||||||||||||||||||||||||||||||||||||||||
| 2100, 2200, 2300, and 2400 Geng Road/Greater Stanford | 100 | % | — | — | — | — | 240,000 | 240,000 | ||||||||||||||||||||||||||||||||||||||||||
| 901 California Avenue/Greater Stanford | 100 | % | 17,563 | — | — | — | 56,924 | 56,924 | ||||||||||||||||||||||||||||||||||||||||||
| Mega Campus: 88 Bluxome Street/SoMa | 100 | % | 383,393 | — | — | — | 1,070,925 | 1,070,925 | ||||||||||||||||||||||||||||||||||||||||||
| Other value-creation projects | 100 | % | — | — | — | — | 25,000 | 25,000 | ||||||||||||||||||||||||||||||||||||||||||
| $ | 2,310,197 | 780,196 | — | 560,438 | 5,574,892 | 6,915,526 | ||||||||||||||||||||||||||||||||||||||||||||
| Refer to “Mega campus” under “Definitions and reconciliations” in Item 2 for additional information. (1)Represents total square footage upon completion of development or redevelopment of one or more new Class A/A+ properties. Square footage presented includes the RSF of buildings currently in operation at properties that also have future development or redevelopment opportunities. Upon expiration of existing in-place leases, we have the intent to demolish or redevelop the existing property. Refer to “Investments in real estate” under “Definitions and reconciliations” in Item 2 for additional information, including value-creation square feet currently included in rental properties. (2)We own a partial interest in this property through a real estate joint venture. Refer to Note 4 – “Consolidated and unconsolidated real estate joint ventures” to our unaudited consolidated financial statements in Item 1 for additional details. | ||||||||||||||||||||||||||||||||||||||||||||||||||
New Class A/A+ development and redevelopment properties: summary of pipeline (continued)
| Market Property/Submarket | Our Ownership Interest | Book Value | Square Footage | |||||||||||||||||||||||||||||||||||||||||||||||
| Development and Redevelopment | Total**(1)** | |||||||||||||||||||||||||||||||||||||||||||||||||
| Active and Near-Term Construction | Future Opportunities Subject to Market Conditions and Leasing | |||||||||||||||||||||||||||||||||||||||||||||||||
| Under Construction | Committed Near Term | Priority Anticipated | Future | |||||||||||||||||||||||||||||||||||||||||||||||
| San Diego | ||||||||||||||||||||||||||||||||||||||||||||||||||
| Mega Campus: One Alexandria Square/Torrey Pines | 100 | % | $ | 286,291 | 334,996 | — | — | 125,280 | 460,276 | |||||||||||||||||||||||||||||||||||||||||
| 10935, 10945, and 10955 Alexandria Way and 10975 and 10995 Torreyana Road | ||||||||||||||||||||||||||||||||||||||||||||||||||
| Mega Campus: Campus Point by Alexandria/University Town Center | 55.0 | % | 495,923 | 598,029 | 492,570 | — | 650,000 | 1,740,599 | ||||||||||||||||||||||||||||||||||||||||||
| 10010*(2), 10140(2), and 10260 Campus Point Drive and 4135, 4155, 4161, 4165, and 4275(2)* Campus Point Court | ||||||||||||||||||||||||||||||||||||||||||||||||||
| Mega Campus: SD Tech by Alexandria/Sorrento Mesa | 50.0 | % | 264,936 | 254,771 | — | 250,000 | 243,845 | 748,616 | ||||||||||||||||||||||||||||||||||||||||||
| 9805 Scranton Road and 10065 and 10075 Barnes Canyon Road | ||||||||||||||||||||||||||||||||||||||||||||||||||
| 11255 and 11355 North Torrey Pines Road/Torrey Pines | 100 | % | 145,328 | — | — | 153,000 | 62,000 | 215,000 | ||||||||||||||||||||||||||||||||||||||||||
| ARE Towne Centre/University Town Center | 100 | % | 27,153 | — | — | 230,000 | — | 230,000 | ||||||||||||||||||||||||||||||||||||||||||
| 9363, 9373, and 9393 Towne Centre Drive | ||||||||||||||||||||||||||||||||||||||||||||||||||
| Costa Verde by Alexandria/University Town Center | 100 | % | 133,383 | — | — | — | 537,000 | 537,000 | ||||||||||||||||||||||||||||||||||||||||||
| 8410-8750 Genesee Avenue and 4282 Esplanade Court | ||||||||||||||||||||||||||||||||||||||||||||||||||
| Mega Campus: 5200 Illumina Way/University Town Center | 51.0 | % | 17,456 | — | — | — | 451,832 | 451,832 | ||||||||||||||||||||||||||||||||||||||||||
| 9625 Towne Centre Drive/University Town Center | 30.0 | % | 837 | — | — | — | 100,000 | 100,000 | ||||||||||||||||||||||||||||||||||||||||||
| Mega Campus: Sequence District by Alexandria/Sorrento Mesa | 100 | % | 46,300 | — | — | — | 1,798,915 | 1,798,915 | ||||||||||||||||||||||||||||||||||||||||||
| 6260, 6290, 6310, 6340, 6350, and 6450 Sequence Drive | ||||||||||||||||||||||||||||||||||||||||||||||||||
| Scripps Science Park by Alexandria/Sorrento Mesa | 100 | % | 116,869 | — | — | — | 598,349 | 598,349 | ||||||||||||||||||||||||||||||||||||||||||
| 10048, 10219, 10256, and 10260 Meanley Drive and 10277 Scripps Ranch Boulevard | ||||||||||||||||||||||||||||||||||||||||||||||||||
| Pacific Technology Park/Sorrento Mesa | 50.0 | % | 23,807 | — | — | — | 149,000 | 149,000 | ||||||||||||||||||||||||||||||||||||||||||
| 9444 Waples Street | ||||||||||||||||||||||||||||||||||||||||||||||||||
| 4025, 4031, 4045, and 4075 Sorrento Valley Boulevard/Sorrento Valley | 100 | % | 41,194 | — | — | — | 247,000 | 247,000 | ||||||||||||||||||||||||||||||||||||||||||
| Other value-creation projects | 100 | % | 73,515 | — | — | — | 475,000 | 475,000 | ||||||||||||||||||||||||||||||||||||||||||
| $ | 1,672,992 | 1,187,796 | 492,570 | 633,000 | 5,438,221 | 7,751,587 | ||||||||||||||||||||||||||||||||||||||||||||
| Refer to “Mega campus” under “Definitions and reconciliations” in Item 2 for additional information. (1)Represents total square footage upon completion of development or redevelopment of one or more new Class A/A+ properties. Square footage presented includes the RSF of buildings currently in operation at properties that also have future development or redevelopment opportunities. Upon expiration of existing in-place leases, we have the intent to demolish or redevelop the existing property. Refer to “Investments in real estate” under “Definitions and reconciliations” in Item 2 for additional information, including value-creation square feet currently included in rental properties. (2)We have a 100% interest in this property. |
New Class A/A+ development and redevelopment properties: summary of pipeline (continued)
| Market Property/Submarket | Our Ownership Interest | Book Value | Square Footage | |||||||||||||||||||||||||||||||||||||||||||||||
| Development and Redevelopment | Total**(1)** | |||||||||||||||||||||||||||||||||||||||||||||||||
| Active and Near-Term Construction | Future Opportunities Subject to Market Conditions and Leasing | |||||||||||||||||||||||||||||||||||||||||||||||||
| Under Construction | Committed Near Term | Priority Anticipated | Future | |||||||||||||||||||||||||||||||||||||||||||||||
| Seattle | ||||||||||||||||||||||||||||||||||||||||||||||||||
| Mega Campus: Alexandria Center**®** for Life Science – Eastlake/Lake Union | 100 | % | $ | 40,332 | 33,349 | — | — | — | 33,349 | |||||||||||||||||||||||||||||||||||||||||
| 1150 Eastlake Avenue East | ||||||||||||||||||||||||||||||||||||||||||||||||||
| Alexandria Center® for Advanced Technologies – Monte Villa Parkway/Bothell | 100 | % | 10,956 | 34,306 | — | 50,552 | — | 84,858 | ||||||||||||||||||||||||||||||||||||||||||
| 3301 Monte Villa Parkway | ||||||||||||||||||||||||||||||||||||||||||||||||||
| Mega Campus: Alexandria Center**®** for Life Science – South Lake Union/Lake Union | (2) | 443,273 | — | — | 1,095,586 | 188,400 | 1,283,986 | |||||||||||||||||||||||||||||||||||||||||||
| 601 and 701 Dexter Avenue North and 800 Mercer Street | ||||||||||||||||||||||||||||||||||||||||||||||||||
| 830 and 1010 4th Avenue South/SoDo | 100 | % | 57,849 | — | — | — | 597,313 | 597,313 | ||||||||||||||||||||||||||||||||||||||||||
| Mega Campus: Alexandria Center**®** for Advanced Technologies – Canyon Park/Bothell | 100 | % | 16,270 | — | — | — | 230,000 | 230,000 | ||||||||||||||||||||||||||||||||||||||||||
| 21660 20th Avenue Southeast | ||||||||||||||||||||||||||||||||||||||||||||||||||
| Other value-creation projects | 100 | % | 138,062 | — | — | — | 706,087 | 706,087 | ||||||||||||||||||||||||||||||||||||||||||
| 706,742 | 67,655 | — | 1,146,138 | 1,721,800 | 2,935,593 | |||||||||||||||||||||||||||||||||||||||||||||
| Maryland | ||||||||||||||||||||||||||||||||||||||||||||||||||
| Mega Campus: Alexandria Center**®** for Life Science – Shady Grove/Rockville | 100 | % | 358,634 | 510,601 | — | — | 296,000 | 806,601 | ||||||||||||||||||||||||||||||||||||||||||
| 9808 Medical Center Drive and 9810, 9820, and 9830 Darnestown Road | ||||||||||||||||||||||||||||||||||||||||||||||||||
| 358,634 | 510,601 | — | — | 296,000 | 806,601 | |||||||||||||||||||||||||||||||||||||||||||||
| Research Triangle | ||||||||||||||||||||||||||||||||||||||||||||||||||
| Mega Campus: Alexandria Center**®** for Advanced Technologies – Research Triangle/Research Triangle | 100 | % | 98,895 | — | — | 180,000 | 990,000 | 1,170,000 | ||||||||||||||||||||||||||||||||||||||||||
| 4 and 12 Davis Drive | ||||||||||||||||||||||||||||||||||||||||||||||||||
| Mega Campus: Alexandria Center**®** for NextGen Medicines/Research Triangle | 100 | % | 105,675 | — | — | 100,000 | 955,000 | 1,055,000 | ||||||||||||||||||||||||||||||||||||||||||
| 3029 East Cornwallis Road | ||||||||||||||||||||||||||||||||||||||||||||||||||
| Mega Campus: Alexandria Center**®** for Life Science – Durham/Research Triangle | 100 | % | $ | 173,877 | — | — | — | 2,210,000 | 2,210,000 | |||||||||||||||||||||||||||||||||||||||||
| 41 Moore Drive | ||||||||||||||||||||||||||||||||||||||||||||||||||
| Refer to “Mega campus” under “Definitions and reconciliations” in Item 2 for additional information. (1)Represents total square footage upon completion of development or redevelopment of one or more new Class A/A+ properties. Square footage presented includes the RSF of buildings currently in operation at properties that also have future development or redevelopment opportunities. Upon expiration of existing in-place leases, we have the intent to demolish or redevelop the existing property. Refer to “Investments in real estate” under “Definitions and reconciliations” in Item 2 for additional information, including value-creation square feet currently included in rental properties. (2)We have a 100% interest in 601 and 701 Dexter Avenue North aggregating 414,986 RSF and a 60% interest in the priority anticipated development project at 800 Mercer Street aggregating 869,000 RSF. |
New Class A/A+ development and redevelopment properties: summary of pipeline (continued)
| Market Property/Submarket | Our Ownership Interest | Book Value | Square Footage | |||||||||||||||||||||||||||||||||||||||||||||||
| Development and Redevelopment | Total**(1)** | |||||||||||||||||||||||||||||||||||||||||||||||||
| Active and Near-Term Construction | Future Opportunities Subject to Market Conditions and Leasing | |||||||||||||||||||||||||||||||||||||||||||||||||
| Under Construction | Committed Near Term | Priority Anticipated | Future | |||||||||||||||||||||||||||||||||||||||||||||||
| Research Triangle (continued) | ||||||||||||||||||||||||||||||||||||||||||||||||||
| Mega Campus: Alexandria Center**®** for Sustainable Technologies/Research Triangle | 100 | % | $ | 52,601 | — | — | — | 750,000 | 750,000 | |||||||||||||||||||||||||||||||||||||||||
| 120 TW Alexander Drive, 2752 East NC Highway 54, and 10 South Triangle Drive/Research Triangle | ||||||||||||||||||||||||||||||||||||||||||||||||||
| 100 Capitola Drive/Research Triangle | 100 | % | — | — | — | — | 65,965 | 65,965 | ||||||||||||||||||||||||||||||||||||||||||
| Other value-creation projects | 100 | % | 4,185 | — | — | — | 76,262 | 76,262 | ||||||||||||||||||||||||||||||||||||||||||
| 435,233 | — | — | 280,000 | 5,047,227 | 5,327,227 | |||||||||||||||||||||||||||||||||||||||||||||
| New York City | ||||||||||||||||||||||||||||||||||||||||||||||||||
| Mega Campus: Alexandria Center**®** for Life Science – New York City/New York City | 100 | % | 158,579 | — | — | — | 550,000 | (2) | 550,000 | |||||||||||||||||||||||||||||||||||||||||
| 158,579 | — | — | — | 550,000 | 550,000 | |||||||||||||||||||||||||||||||||||||||||||||
| Texas | ||||||||||||||||||||||||||||||||||||||||||||||||||
| Alexandria Center® for Advanced Technologies at The Woodlands/Greater Houston | 100 | % | 78,484 | 73,298 | — | — | 116,405 | 189,703 | ||||||||||||||||||||||||||||||||||||||||||
| 8800 Technology Forest Place | ||||||||||||||||||||||||||||||||||||||||||||||||||
| 1001 Trinity Street and 1020 Red River Street/Austin | 100 | % | 9,569 | — | — | 126,034 | 123,976 | 250,010 | ||||||||||||||||||||||||||||||||||||||||||
| Other value-creation projects | 100 | % | 134,557 | — | — | — | 1,694,000 | 1,694,000 | ||||||||||||||||||||||||||||||||||||||||||
| 222,610 | 73,298 | — | 126,034 | 1,934,381 | 2,133,713 | |||||||||||||||||||||||||||||||||||||||||||||
| Canada | 100 | % | 52,446 | 163,211 | — | — | 371,743 | 534,954 | ||||||||||||||||||||||||||||||||||||||||||
| Other value-creation projects | 100 | % | 116,856 | — | — | — | 724,349 | 724,349 | ||||||||||||||||||||||||||||||||||||||||||
| Total pipeline as of March 31, 2024 | $ | 8,668,680 | (3) | 5,048,810 | 492,570 | 2,919,315 | 27,176,766 | 35,637,461 |
Refer to “Mega campus” under “Definitions and reconciliations” in Item 2 for additional information.
(1)Total square footage includes 3,725,969 RSF of buildings currently in operation where we expect to demolish or redevelop and commence future construction. Refer to “Investments in real estate” under “Definitions and reconciliations” in Item 2 for additional information, including value-creation square feet currently included in rental properties.
(2)Pursuant to an option agreement, we are currently negotiating a long-term ground lease with the City of New York for the future site of a new building aggregating approximately 550,000 SF.
(3)Includes $3.7 billion of projects that are currently under construction and are 64% leased/negotiating. We also expect to commence construction of one committed near-term project aggregating $50.7 million, which is 51% leased/negotiating, in the next two years after March 31, 2024.
Results of operations
We present a tabular comparison of items, whether gain or loss, that may facilitate a high-level understanding of our results and provide context for the disclosures included in our annual report on Form 10-K for the year ended December 31, 2023 and our subsequent quarterly reports on Form 10-Q. We believe that such tabular presentation promotes a better understanding for investors of the corporate-level decisions made and activities performed that significantly affect comparison of our operating results from period to period. We also believe that this tabular presentation will supplement for investors an understanding of our disclosures and real estate operating results. Gains or losses on sales of real estate and impairments of assets classified as held for sale are related to corporate-level decisions to dispose of real estate. Gains or losses on early extinguishment of debt are related to corporate-level financing decisions focused on our capital structure strategy. Significant realized and unrealized gains or losses on non-real estate investments, impairments of real estate and non-real estate investments, and acceleration of stock compensation expense due to the resignations of executive officers are not related to the operating performance of our real estate assets as they result from strategic, corporate-level non-real estate investment decisions and external market conditions. Impairments of non-real estate investments are not related to the operating performance of our real estate as they represent the write-down of non-real estate investments when their fair values decrease below their respective carrying values due to changes in general market or other conditions outside of our control. Significant items, whether a gain or loss, included in the tabular disclosure for current periods are described in further detail within this Item 2. Key items included in net income attributable to Alexandria’s common stockholders for the three months ended March 31, 2024 and 2023 and the related per share amounts were as follows (in millions, except per share amounts):
| Three Months Ended March 31, | |||||||||||||||||||||||||||||||||||||||||||||||
| 2024 | 2023 | 2024 | 2023 | ||||||||||||||||||||||||||||||||||||||||||||
| Amount | Per Share – Diluted | ||||||||||||||||||||||||||||||||||||||||||||||
| Unrealized gains (losses) on non-real estate investments | $ | 29.2 | $ | (65.9) | $ | 0.17 | $ | (0.39) | |||||||||||||||||||||||||||||||||||||||
| Gain on sales of real estate | 0.4 | — | — | — | |||||||||||||||||||||||||||||||||||||||||||
| Impairment of non-real estate investments | (14.7) | — | (0.09) | — | |||||||||||||||||||||||||||||||||||||||||||
| Total | $ | 14.9 | $ | (65.9) | $ | 0.08 | $ | (0.39) | |||||||||||||||||||||||||||||||||||||||
Refer to Note 3 – “Investments in real estate” and Note 7 – “Investments” to our unaudited consolidated financial statements in Item 1 for additional information.
Same properties
We supplement an evaluation of our results of operations with an evaluation of operating performance of certain of our properties, referred to as “Same Properties.” For additional information on the determination of our Same Properties portfolio, refer to “Same property comparisons” under “Definitions and reconciliations” in Item 2. The following table presents information regarding our Same Properties for the three months ended March 31, 2024:
| Three Months Ended March 31, 2024 | ||||||||||||||
| Percentage change in net operating income over comparable period from prior year | 1.0% | |||||||||||||
| Percentage change in net operating income (cash basis) over comparable period from prior year | 4.2% | |||||||||||||
| Operating margin | 70% | |||||||||||||
| Number of Same Properties | 347 | |||||||||||||
| RSF | 34,698,081 | |||||||||||||
| Occupancy – current-period average | 94.5% | |||||||||||||
| Occupancy – same-period prior-year average | 94.9% |
The following table reconciles the number of Same Properties to total properties for the three months ended March 31, 2024:
| Development – under construction | Properties | |||||||
| 201 Brookline Avenue | 1 | |||||||
| 1150 Eastlake Avenue East | 1 | |||||||
| 9810 and 9820 Darnestown Road | 2 | |||||||
| 99 Coolidge Avenue | 1 | |||||||
| 500 North Beacon Street and 4 Kingsbury Avenue | 2 | |||||||
| 9808 Medical Center Drive | 1 | |||||||
| 1450 Owens Street | 1 | |||||||
| 230 Harriet Tubman Way | 1 | |||||||
| 4155 Campus Point Court | 1 | |||||||
| 10935, 10945, and 10955 Alexandria Way | 3 | |||||||
| 10075 Barnes Canyon Road | 1 | |||||||
| 421 Park Drive | 1 | |||||||
| 4135 Campus Point Court | 1 | |||||||
| 17 | ||||||||
| Development – placed into service after January 1, 2023 | Properties | |||||||
| 751 Gateway Boulevard | 1 | |||||||
| 15 Necco Street | 1 | |||||||
| 325 Binney Street | 1 | |||||||
| 6040 George Watts Hill Drive | 1 | |||||||
| 4 | ||||||||
| Redevelopment – under construction | Properties | |||||||
| 840 Winter Street | 1 | |||||||
| 40, 50, and 60 Sylvan Road | 3 | |||||||
| Alexandria Center® for Advanced Technologies – Monte Villa Parkway | 6 | |||||||
| 651 Gateway Boulevard | 1 | |||||||
| 401 Park Drive | 1 | |||||||
| 8800 Technology Forest Place | 1 | |||||||
| 311 Arsenal Street | 1 | |||||||
| Canada | 4 | |||||||
| Other | 2 | |||||||
| 20 |
| Redevelopment – placed into service after January 1, 2023 | Properties | |||||||
| 20400 Century Boulevard | 1 | |||||||
| 140 First Street | 1 | |||||||
| 2400 Ellis Road, 40 Moore Drive, and 14 TW Alexander Drive | 3 | |||||||
| 9601 and 9603 Medical Center Drive | 2 | |||||||
| 7 | ||||||||
| Acquisitions after January 1, 2023 | Properties | |||||||
| Other | 4 | |||||||
| 4 | ||||||||
| Unconsolidated real estate JVs | 4 | |||||||
| Properties held for sale | 7 | |||||||
| Total properties excluded from Same Properties | 63 | |||||||
| Same Properties | 347 | |||||||
| Total properties in North America as of March 31, 2024 | 410 | |||||||
Comparison of results for the three months ended March 31, 2024 to the three months ended March 31, 2023
The following table presents a comparison of the components of net operating income for our Same Properties and Non-Same Properties for the three months ended March 31, 2024, compared to the three months ended March 31, 2023 (dollars in thousands). Refer to “Definitions and reconciliations” in Item 2 for definitions of “Tenant recoveries” and “Net operating income” and their reconciliations from the most directly comparable financial measures presented in accordance with GAAP, income from rentals and net income, respectively.
| Three Months Ended March 31, | |||||||||||||||||||||||||||||
| 2024 | 2023 | $ Change | % Change | ||||||||||||||||||||||||||
| Income from rentals: | |||||||||||||||||||||||||||||
| Same Properties | $ | 452,992 | $ | 445,043 | $ | 7,949 | 1.8 | % | |||||||||||||||||||||
| Non-Same Properties | 128,408 | 73,259 | 55,149 | 75.3 | |||||||||||||||||||||||||
| Rental revenues | 581,400 | 518,302 | 63,098 | 12.2 | |||||||||||||||||||||||||
| Same Properties | 157,402 | 152,073 | 5,329 | 3.5 | |||||||||||||||||||||||||
| Non-Same Properties | 16,749 | 17,574 | (825) | (4.7) | |||||||||||||||||||||||||
| Tenant recoveries | 174,151 | 169,647 | 4,504 | 2.7 | |||||||||||||||||||||||||
| Income from rentals | 755,551 | 687,949 | 67,602 | 9.8 | |||||||||||||||||||||||||
| Same Properties | 338 | 437 | (99) | (22.7) | |||||||||||||||||||||||||
| Non-Same Properties | 13,219 | 12,409 | 810 | 6.5 | |||||||||||||||||||||||||
| Other income | 13,557 | 12,846 | 711 | 5.5 | |||||||||||||||||||||||||
| Same Properties | 610,732 | 597,553 | 13,179 | 2.2 | |||||||||||||||||||||||||
| Non-Same Properties | 158,376 | 103,242 | 55,134 | 53.4 | |||||||||||||||||||||||||
| Total revenues | 769,108 | 700,795 | 68,313 | 9.7 | |||||||||||||||||||||||||
| Same Properties | 183,466 | 174,580 | 8,886 | 5.1 | |||||||||||||||||||||||||
| Non-Same Properties | 34,848 | 32,353 | 2,495 | 7.7 | |||||||||||||||||||||||||
| Rental operations | 218,314 | 206,933 | 11,381 | 5.5 | |||||||||||||||||||||||||
| Same Properties | 427,266 | 422,973 | 4,293 | 1.0 | |||||||||||||||||||||||||
| Non-Same Properties | 123,528 | 70,889 | 52,639 | 74.3 | |||||||||||||||||||||||||
| Net operating income | $ | 550,794 | $ | 493,862 | $ | 56,932 | 11.5 | % | |||||||||||||||||||||
| Net operating income – Same Properties | $ | 427,266 | $ | 422,973 | $ | 4,293 | 1.0 | % | |||||||||||||||||||||
| Straight-line rent revenue | (14,954) | (26,489) | 11,535 | (43.5) | |||||||||||||||||||||||||
| Amortization of acquired below-market leases | (15,497) | (15,647) | 150 | (1.0) | |||||||||||||||||||||||||
| Net operating income – Same Properties (cash basis) | $ | 396,815 | $ | 380,837 | $ | 15,978 | 4.2 | % |
Income from rentals
Total income from rentals for the three months ended March 31, 2024 increased by $67.6 million, or 9.8%, to $755.6 million, compared to $687.9 million for the three months ended March 31, 2023, as a result of an increase in rental revenues and tenant recoveries, as discussed below.
Rental revenues
Total rental revenues for the three months ended March 31, 2024 increased by $63.1 million, or 12.2%, to $581.4 million, compared to $518.3 million for the three months ended March 31, 2023. The increase was primarily due to an increase in rental revenues from our Non-Same Properties related to 2.9 million RSF of development and redevelopment projects placed into service subsequent to April 1, 2023 and four operating properties aggregating 716,153 RSF acquired subsequent to April 1, 2023.
Rental revenues from our Same Properties for the three months ended March 31, 2024 increased by $7.9 million, or 1.8%, to $453.0 million, compared to $445.0 million for the three months ended March 31, 2023. The increase was primarily due to rental rate increases on lease renewals and re-leasing of space since April 1, 2023.
Tenant recoveries
Tenant recoveries for the three months ended March 31, 2024 increased by $4.5 million, or 2.7%, to $174.2 million, compared to $169.6 million for the three months ended March 31, 2023. The increase was primarily due to our Same Properties related to tenant recoveries from higher operating expenses, as described below.
Same Properties’ tenant recoveries for the three months ended March 31, 2024 increased by $5.3 million, or 3.5%, to $157.4 million, compared to $152.1 million for the three months ended March 31, 2023, primarily due to higher operating expenses during the three months ended March 31, 2024, as discussed under “Rental operations” below. As of March 31, 2024, 94% of our leases (on an annual rental revenue basis) were triple net leases, which require tenants to pay substantially all real estate taxes, insurance, utilities, repairs and maintenance, common area expenses, and other operating expenses (including increases thereto) in addition to base rent.
Other income
Other income for the three months ended March 31, 2024 increased by $711 thousand, or 5.5%, to $13.6 million, compared to $12.8 million for the three months ended March 31, 2023. The increase in other income was primarily due to an increase in interest income resulting from an increase in average interest rates earned from our money market accounts to over 5.0% during the three months ended March 31, 2024, compared to less than 4.1% during the three months ended March 31, 2023.
Rental operations
Total rental operating expenses for the three months ended March 31, 2024 increased by $11.4 million, or 5.5%, to $218.3 million, compared to $206.9 million for the three months ended March 31, 2023. The increase was primarily due to incremental expenses related to our Same Properties, as discussed below.
Same Properties’ rental operating expenses increased by $8.9 million, or 5.1%, to $183.5 million during the three months ended March 31, 2024, compared to $174.6 million for the three months ended March 31, 2023. The increase was primarily the result of increases in (i) property taxes aggregating $3.4 million, primarily due to increased assessed values of some of our properties as a result of the construction and property improvements, (ii) contractual costs aggregating $1.9 million, primarily due to increases in rates, and (iii) property insurance expenses aggregating $1.5 million primarily due to increases in insurance premiums in California.
Depreciation and amortization
Depreciation and amortization expense for the three months ended March 31, 2024 increased by $22.3 million, or 8.4%, to $287.6 million, compared to $265.3 million for the three months ended March 31, 2023. The increase was primarily due to additional depreciation from development and redevelopment projects placed into service and properties acquired, as discussed above under “Rental revenues.”
Interest expense
Interest expense for the three months ended March 31, 2024 and 2023 consisted of the following (dollars in thousands):
| Three Months Ended March 31, | ||||||||||||||||||||
| Component | 2024 | 2023 | Change | |||||||||||||||||
| Gross interest | $ | 122,680 | $ | 100,824 | $ | 21,856 | ||||||||||||||
| Capitalized interest | (81,840) | (87,070) | 5,230 | |||||||||||||||||
| Interest expense | $ | 40,840 | $ | 13,754 | $ | 27,086 | ||||||||||||||
| Average debt balance outstanding(1) | $ | 12,056,184 | $ | 10,791,039 | $ | 1,265,145 | ||||||||||||||
| Weighted-average annual interest rate(2) | 4.1 | % | 3.7 | % | 0.4 | % |
(1)Represents the average debt balance outstanding during the respective periods.
(2)Represents annualized total interest incurred divided by the average debt balance outstanding during the respective periods.
The net change in interest expense during the three months ended March 31, 2024, compared to the three months ended March 31, 2023, resulted from the following (dollars in thousands):
| Component | Interest Rate(1) | Effective Date | Change | ||||||||||||||||||||||||||
| Increases in interest incurred due to: | |||||||||||||||||||||||||||||
| Issuances of debt: | |||||||||||||||||||||||||||||
| $500 million of unsecured senior notes payable due 2053 | 5.26 | % | February 2023 | $ | 3,225 | ||||||||||||||||||||||||
| $500 million of unsecured senior notes payable due 2035 | 4.88 | % | February 2023 | 2,981 | |||||||||||||||||||||||||
| $600 million of unsecured senior notes payable due 2054 | 5.71 | % | February 2024 | 4,314 | |||||||||||||||||||||||||
| $400 million of unsecured senior notes payable due 2036 | 5.38 | % | February 2024 | 2,690 | |||||||||||||||||||||||||
| Increases in construction borrowing and interest rates under secured notes payable | 8.37 | % | 1,386 | ||||||||||||||||||||||||||
| Rate increases on borrowings under commercial paper program and from unsecured senior line of credit | 1,000 | ||||||||||||||||||||||||||||
| Higher average outstanding balances under commercial paper program and unsecured senior line of credit | 5,420 | ||||||||||||||||||||||||||||
| Other increase in interest | 840 | ||||||||||||||||||||||||||||
| Total increases | 21,856 | ||||||||||||||||||||||||||||
| Decrease in capitalized interest | 5,230 | ||||||||||||||||||||||||||||
| Total change in interest expense | $ | 27,086 | |||||||||||||||||||||||||||
(1)Represents the weighted-average interest rate as of the end of the applicable period, including amortization of loan fees, amortization of debt premiums (discounts), and other bank fees.
Investment income
During the three months ended March 31, 2024, we recognized investment income aggregating $43.3 million. This income comprised unrealized gains and reclassifications of $29.2 million resulting from a $57.1 million increase primarily in the increase in valuation in publicly traded entities and a $27.9 million reclassification of unrealized gains recognized in prior periods into realized gains upon the sales of investments during the three months ended March 31, 2024. The investment income also included realized gains of $28.8 million, partially offset by impairment charges of $14.7 million primarily related to one non-real estate investment in a privately held entity that does not report NAV.
During the three months ended March 31, 2023, we recognized an investment loss aggregating $45.1 million, which consisted of $65.9 million of unrealized losses and $20.7 million of realized gains.
For more information about our investments, refer to Note 7 – “Investments” to our unaudited consolidated financial statements in Item 1. For our impairments accounting policy, refer to “Investments” in Note 2 – “Summary of significant accounting policies” to our consolidated financial statements in Item 1.
Other comprehensive loss
Total other comprehensive loss for the three months ended March 31, 2024 decreased by $8.2 million to aggregate net unrealized losses of $7.9 million, compared to net unrealized gains of $276 thousand for the three months ended March 31, 2023, primarily in connection with the foreign currency translation related to our operations in Canada.
Summary of capital expenditures
Our construction spending for the three months ended March 31, 2024 and projected spending for the year ending December 31, 2024 consisted of the following (in thousands):
| Three Months Ended March 31, 2024 | Projected Midpoint for the Year Ending December 31, 2024 | ||||||||||||||||||||||||||||
| Construction of Class A/A+ properties: | |||||||||||||||||||||||||||||
| Active construction projects | |||||||||||||||||||||||||||||
| Under construction and committed near-term projects(1) and projects expected to commence active construction in 2024(2) | $ | 487,891 | $ | 1,778,000 | |||||||||||||||||||||||||
| Future pipeline pre-construction | |||||||||||||||||||||||||||||
| Primarily mega campus expansion pre-construction work (entitlement, design, and site work) | 131,456 | 652,000 | |||||||||||||||||||||||||||
| Revenue- and non-revenue-enhancing capital expenditures | 37,068 | 250,000 | |||||||||||||||||||||||||||
| Construction spend (before contributions from noncontrolling interests) | 656,415 | 2,680,000 | |||||||||||||||||||||||||||
| Contributions from noncontrolling interests (consolidated real estate joint ventures) | (92,863) | (430,000) | (3) | ||||||||||||||||||||||||||
| Total construction spending | $ | 563,552 | $ | 2,250,000 | |||||||||||||||||||||||||
| 2024 guidance range | $1,950,000 – $2,550,000 |
(1)Includes projects under construction aggregating 5.0 million RSF and one committed near-term project aggregating 492,570 RSF expected to commence construction during the next two years after March 31, 2024, which are 63% leased/negotiating and expected to generate $480 million in incremental annual net operating income primarily commencing from the second quarter of 2024 through the fourth quarter of 2027.
(2)Includes three priority anticipated development and redevelopment projects expected to commence active construction in 2024, subject to market conditions and leasing. Refer to “Investments in real estate” under “Definitions and reconciliations” in Item 2 for additional details, including value-creation square feet currently included in rental properties.
(3)Represents contractual capital commitments expected from existing consolidated real estate joint ventures to fund construction.
Projected capital contributions from partners in consolidated real estate joint ventures to fund construction
The following table summarizes projected capital contributions from partners in our existing consolidated joint ventures to fund construction through 2027 (in thousands):
| Projected timing | Amount(1) | |||||||
| April 1, 2024 through December 31, 2024 | $ | 337,137 | ||||||
| 2025 through 2027 | 913,146 | |||||||
| Total | $ | 1,250,283 | ||||||
(1)Represents reduction to our consolidated construction spending.
Capitalization of interest
Our construction spending includes capitalized interest. The table below provides key categories of interest capitalized during the three months ended March 31, 2024:
| Three Months Ended March 31, 2024 | Upon Completion of Construction | |||||||||||||||||||||||||||||||
| Average Real Estate Basis Capitalized | Percentage of Total Capitalized Interest | RSF | Potential Growth in Operating RSF | |||||||||||||||||||||||||||||
| Construction of Class A/A+ properties: | ||||||||||||||||||||||||||||||||
| Active construction projects | ||||||||||||||||||||||||||||||||
| Under construction and committed near-term projects | $ | 2,779,559 | 34 | % | 5,541,380 | 78% | ||||||||||||||||||||||||||
| Future pipeline pre-construction | ||||||||||||||||||||||||||||||||
| Priority anticipated projects | 623,098 | (1) | 8 | 2,919,315 | ||||||||||||||||||||||||||||
| Primarily mega campus expansion pre-construction work (entitlement, design, and site work) | 3,578,177 | (1) | 44 | 27,176,766 | ||||||||||||||||||||||||||||
| Smaller redevelopments and repositioning capital projects | 1,182,455 | 14 | N/A | |||||||||||||||||||||||||||||
| $ | 8,163,289 | 100 | % | 35,637,461 |
(1)Average real estate basis capitalized related to our future pipeline pre-construction includes 32% from four key active and future value-creation projects on mega campuses.
Projected results
We present updated guidance for EPS attributable to Alexandria’s common stockholders – diluted, funds from operations per share attributable to Alexandria’s common stockholders – diluted, and funds from operations per share attributable to Alexandria’s common stockholders – diluted, as adjusted, based on our current view of existing market conditions and other assumptions for the year ending December 31, 2024 as set forth in the tables below. The tables below also provide a reconciliation of EPS attributable to Alexandria’s common stockholders – diluted, the most directly comparable financial measure presented in accordance with GAAP, to funds from operations per share and funds from operations per share, as adjusted, non-GAAP measures, and other key assumptions included in our updated guidance for the year ending December 31, 2024. There can be no assurance that actual amounts will not be materially higher or lower than these expectations. Refer to our discussion of “Forward-looking statements” at the beginning of this Item 2.
| Projected 2024 Earnings per Share and Funds From Operations per Share Attributable to Alexandria’s Common Stockholders – Diluted | ||||||||||||||
| Earnings per share(1) | $3.60 to $3.72 | |||||||||||||
| Depreciation and amortization of real estate assets | 5.95 | |||||||||||||
| Allocation of unvested restricted stock awards | (0.06) | |||||||||||||
| Funds from operations per share(2) | $9.49 to $9.61 | |||||||||||||
| Unrealized gains on non-real estate investments | (0.17) | |||||||||||||
| Impairment of non-real estate investments | 0.09 | |||||||||||||
| Funds from operations per share, as adjusted(2) | $9.41 to $9.53 | |||||||||||||
| Midpoint | $9.47 | |||||||||||||
(1)Excludes unrealized gains or losses on non-real estate investments after March 31, 2024 that are required to be recognized in earnings and are excluded from funds from operations per share, as adjusted.
(2)Refer to “Definitions and reconciliations” in Item 2 for additional information.
| Key Assumptions**(1)** (Dollars in millions) | 2024 Guidance | ||||||||||||||||
| Low | High | ||||||||||||||||
| Occupancy percentage for operating properties in North America as of December 31, 2024 | 94.6% | 95.6% | |||||||||||||||
| Lease renewals and re-leasing of space: | |||||||||||||||||
| Rental rate increases | 11.0% | 19.0% | |||||||||||||||
| Rental rate increases (cash basis) | 5.0% | 13.0% | |||||||||||||||
| Same property performance: | |||||||||||||||||
| Net operating income increases | 0.5% | 2.5% | |||||||||||||||
| Net operating income increases (cash basis) | 3.0% | 5.0% | |||||||||||||||
| Straight-line rent revenue | $ | 169 | $ | 184 | |||||||||||||
| General and administrative expenses | $ | 181 | $ | 191 | |||||||||||||
| Capitalization of interest | $ | 325 | $ | 355 | |||||||||||||
| Interest expense | $ | 154 | $ | 184 | |||||||||||||
| Realized gains on non-real estate investments(2) | $ | 95 | $ | 125 | |||||||||||||
(1)Our assumptions presented in the table above are subject to a number of variables and uncertainties, including those discussed as “Forward-looking statements” under Part I; “Item 1A. Risk factors”; and “Item 7. Management’s discussion and analysis of financial condition and results of operations” of our annual report on Form 10-K for the year ended December 31, 2023, as well as in “Item 1A. Risk factors” within “Part II – Other information” of this quarterly report on Form 10-Q. To the extent our full-year earnings guidance is updated during the year, we will provide additional disclosure supporting reasons for any significant changes to such guidance.
(2)Represents realized gains and losses included in funds from operations per share – diluted, as adjusted, and excludes significant impairments realized on non-real estate investments, if any. Refer to Note 7 – “Investments” to our consolidated financial statements in Item 1 for additional details.
| Key Credit Metric Targets**(1)** | ||||||||||||||||||||
| Net debt and preferred stock to Adjusted EBITDA – fourth quarter of 2024 annualized | Less than or equal to 5.1x | |||||||||||||||||||
| Fixed-charge coverage ratio – fourth quarter of 2024 annualized | Greater than or equal to 4.5x | |||||||||||||||||||
(1)Refer to “Definitions and reconciliations” in Item 2 for additional information.
Consolidated and unconsolidated real estate joint ventures
We present components of balance sheet and operating results information for the noncontrolling interest share of our consolidated real estate joint ventures and for our share of investments in unconsolidated real estate joint ventures to help investors estimate balance sheet and operating results information related to our partially owned entities. These amounts are estimated by computing, for each joint venture that we consolidate in our financial statements, the noncontrolling interest percentage of each financial item to arrive at the cumulative noncontrolling interest share of each component presented. In addition, for our real estate joint ventures that we do not control and do not consolidate, we apply our economic ownership percentage to the unconsolidated real estate joint ventures to arrive at our proportionate share of each component presented. Refer to Note 4 – “Consolidated and unconsolidated real estate joint ventures” to our unaudited consolidated financial statement in Item 1 for further discussion.
| Consolidated Real Estate Joint Ventures | ||||||||||||||||||||||||||
| Property/Market/Submarket | Noncontrolling(1) Interest Share | Operating RSF at 100% | ||||||||||||||||||||||||
| 50 and 60 Binney Street/Greater Boston/Cambridge/Inner Suburbs | 66.0 | % | 532,395 | |||||||||||||||||||||||
| 75/125 Binney Street/Greater Boston/Cambridge/Inner Suburbs | 60.0 | % | 388,269 | |||||||||||||||||||||||
| 100 and 225 Binney Street and 300 Third Street/Greater Boston/Cambridge/Inner Suburbs | 70.0 | % | 870,106 | |||||||||||||||||||||||
| 99 Coolidge Avenue/Greater Boston/Cambridge/Inner Suburbs | 25.0 | % | 116,414 | (2) | ||||||||||||||||||||||
| 15 Necco Street/Greater Boston/Seaport Innovation District | 43.3 | % | 345,996 | |||||||||||||||||||||||
| 285, 299, 307, and 345 Dorchester Avenue/Greater Boston/Seaport Innovation District | 40.0 | % | — | (2) | ||||||||||||||||||||||
| Alexandria Center® for Science and Technology – Mission Bay/San Francisco Bay Area/Mission Bay(3) | 75.0 | % | 999,979 | |||||||||||||||||||||||
| 1450 Owens Street/San Francisco Bay Area/Mission Bay | 72.8 | % | (4) | — | (2) | |||||||||||||||||||||
| 601, 611, 651(2), 681, 685, and 701 Gateway Boulevard/San Francisco Bay Area/ South San Francisco | 50.0 | % | 831,318 | |||||||||||||||||||||||
| 751 Gateway Boulevard/San Francisco Bay Area/South San Francisco | 49.0 | % | 230,592 | |||||||||||||||||||||||
| 211(2) and 213 East Grand Avenue/San Francisco Bay Area/South San Francisco | 70.0 | % | 300,930 | |||||||||||||||||||||||
| 500 Forbes Boulevard/San Francisco Bay Area/South San Francisco | 90.0 | % | 155,685 | |||||||||||||||||||||||
| Alexandria Center® for Life Science – Millbrae/San Francisco Bay Area/South San Francisco | 52.6 | % | — | (2) | ||||||||||||||||||||||
| 3215 Merryfield Row/San Diego/Torrey Pines | 70.0 | % | 170,523 | |||||||||||||||||||||||
| Campus Point by Alexandria/San Diego/University Town Center(5) | 45.0 | % | 1,342,164 | |||||||||||||||||||||||
| 5200 Illumina Way/San Diego/University Town Center | 49.0 | % | 792,687 | |||||||||||||||||||||||
| 9625 Towne Centre Drive/San Diego/University Town Center | 70.0 | % | 163,648 | |||||||||||||||||||||||
| SD Tech by Alexandria/San Diego/Sorrento Mesa(6) | 50.0 | % | 884,266 | |||||||||||||||||||||||
| Pacific Technology Park/San Diego/Sorrento Mesa | 50.0 | % | 544,352 | |||||||||||||||||||||||
| Summers Ridge Science Park/San Diego/Sorrento Mesa(7) | 70.0 | % | 316,531 | |||||||||||||||||||||||
| 1201 and 1208 Eastlake Avenue East and 199 East Blaine Street /Seattle/Lake Union | 70.0 | % | 321,115 | |||||||||||||||||||||||
| 400 Dexter Avenue North/Seattle/Lake Union | 70.0 | % | 290,754 | |||||||||||||||||||||||
| 800 Mercer Street/Seattle/Lake Union | 40.0 | % | — | (2) | ||||||||||||||||||||||
| Unconsolidated Real Estate Joint Ventures | ||||||||||||||||||||||||||
| Property/Market/Submarket | Our Ownership Share(8) | Operating RSF at 100% | ||||||||||||||||||||||||
| 1655 and 1725 Third Street/San Francisco Bay Area/Mission Bay | 10.0 | % | 586,208 | |||||||||||||||||||||||
| 1401/1413 Research Boulevard/Maryland/Rockville | 65.0 | % | (9) | (10) | ||||||||||||||||||||||
| 1450 Research Boulevard/Maryland/Rockville | 73.2 | % | (9) | 42,679 | ||||||||||||||||||||||
| 101 West Dickman Street/Maryland/Beltsville | 57.9 | % | (9) | 135,423 | ||||||||||||||||||||||
Refer to “Joint venture financial information” under “Definitions and reconciliations” in Item 2 for additional details.
(1)In addition to the consolidated real estate joint ventures listed, various joint venture partners hold insignificant noncontrolling interests in four other real estate joint ventures in North America.
(2)Represents a property currently under construction or in our value-creation pipeline. Refer to “New Class A/A+ development and redevelopment properties” in Item 2 for additional details.
(3)Includes 409 and 499 Illinois Street, 1500 and 1700 Owens Street, and 455 Mission Bay Boulevard South.
(4)During the three months ended March 31, 2024, our equity ownership decreased from 40.6% to 27.2% based on continued funding of construction costs by our joint venture partner and a reallocation of equity to our joint venture partner of $30.2 million from us. The noncontrolling interest share of our joint venture partner is anticipated to increase to 75% and ours to decrease to 25% as our partner contributes additional equity to fund the construction of the project.
(5)Includes 10210, 10260, 10290, and 10300 Campus Point Drive and 4110, 4135, 4155, 4161, 4165, 4224, and 4242 Campus Point Court.
(6)Includes 9605, 9645, 9675, 9685, 9725, 9735, 9805, 9808, 9855, and 9868 Scranton Road and 10055, 10065, and 10075 Barnes Canyon Road.
(7)Includes 9965, 9975, 9985, and 9995 Summers Ridge Road.
(8)In addition to the unconsolidated real estate joint ventures listed, we hold an interest in one other insignificant unconsolidated real estate joint venture in North America.
(9)Represents a joint venture with a local real estate operator in which our joint venture partner manages the day-to-day activities that significantly affect the economic performance of the joint venture.
(10)Represents a joint venture with a distinguished retail real estate developer for a retail shopping center aggregating 84,837 RSF.
The following table presents key terms related to our unconsolidated real estate joint ventures’ secured loans as of March 31, 2024 (dollars in thousands):
| Maturity Date | Stated Rate | Interest Rate(1) | At 100% | Our Share | ||||||||||||||||||||||||||||||||||||||||
| Unconsolidated Joint Venture | Aggregate Commitment | Debt Balance(2) | ||||||||||||||||||||||||||||||||||||||||||
| 1401/1413 Research Boulevard | 12/23/24 | 2.70% | 3.31 | % | $ | 28,500 | $ | 28,374 | 65.0% | |||||||||||||||||||||||||||||||||||
| 1655 and 1725 Third Street | 3/10/25 | 4.50% | 4.57 | % | 600,000 | 599,612 | 10.0% | |||||||||||||||||||||||||||||||||||||
| 101 West Dickman Street | 11/10/26 | SOFR+1.95% | (3) | 7.37 | % | 26,750 | 17,749 | 57.9% | ||||||||||||||||||||||||||||||||||||
| 1450 Research Boulevard | 12/10/26 | SOFR+1.95% | (3) | 7.43 | % | 13,000 | 8,509 | 73.2% | ||||||||||||||||||||||||||||||||||||
| $ | 668,250 | $ | 654,244 |
(1)Includes interest expense and amortization of loan fees.
(2)Represents outstanding principal, net of unamortized deferred financing costs, as of March 31, 2024.
(3)This loan is subject to a fixed SOFR floor of 0.75%.
The following tables present information related to the operating results and financial positions of our consolidated and unconsolidated real estate joint ventures as of and for the three months ended March 31, 2024 (in thousands):
| Three Months Ended March 31, 2024 | |||||||||||||||||||||||
| Noncontrolling Interest Share of Consolidated Real Estate Joint Ventures | Our Share of Unconsolidated Real Estate Joint Ventures | ||||||||||||||||||||||
| Total revenues | $ | 111,097 | $ | 3,175 | |||||||||||||||||||
| Rental operations | (30,869) | (1,024) | |||||||||||||||||||||
| 80,228 | 2,151 | ||||||||||||||||||||||
| General and administrative | (678) | (40) | |||||||||||||||||||||
| Interest | (216) | (922) | |||||||||||||||||||||
| Depreciation and amortization of real estate assets | (30,904) | (1,034) | |||||||||||||||||||||
| Fixed returns allocated to redeemable noncontrolling interests(1) | 201 | — | |||||||||||||||||||||
| $ | 48,631 | $ | 155 | ||||||||||||||||||||
| Straight-line rent and below-market lease revenue | $ | 9,309 | $ | 282 | |||||||||||||||||||
| Funds from operations(2) | $ | 79,535 | $ | 1,189 |
Refer to “Joint venture financial information” under “Definitions and reconciliations” in Item 2 for additional details.
(1)Represents an allocation of joint venture earnings to redeemable noncontrolling interests primarily in one property in our South San Francisco submarket. These redeemable noncontrolling interests earn a fixed return on their investment rather than participate in the operating results of the property.
(2)Refer to “Funds from operations and funds from operations, as adjusted, attributable to Alexandria Real Estate Equities, Inc.’s common stockholders” under “Definitions and reconciliations” in Item 2 for the definition and its reconciliation from the most directly comparable financial measure presented in accordance with GAAP.
| As of March 31, 2024 | |||||||||||
| Noncontrolling Interest Share of Consolidated Real Estate Joint Ventures | Our Share of Unconsolidated Real Estate Joint Ventures | ||||||||||
| Investments in real estate | $ | 4,098,889 | $ | 124,102 | |||||||
| Cash, cash equivalents, and restricted cash | 117,844 | 6,397 | |||||||||
| Other assets | 427,374 | 12,491 | |||||||||
| Secured notes payable | (32,358) | (94,920) | |||||||||
| Other liabilities | (268,426) | (7,434) | |||||||||
| Redeemable noncontrolling interests | (16,620) | — | |||||||||
| $ | 4,326,703 | $ | 40,636 |
During the three months ended March 31, 2024 and 2023, our consolidated real estate joint ventures distributed an aggregate of $59.8 million and $63.2 million, respectively, to our joint venture partners. Refer to our consolidated statements of cash flows and Note 4 – “Consolidated and unconsolidated real estate joint ventures” to our unaudited consolidated financial statements in Item 1 for additional information.
Investments
We hold investments in publicly traded companies and privately held entities primarily involved in the life science industry. The tables below summarize components of our investment income (loss) and non-real estate investments (in thousands). For additional information, refer to Note 7 – “Investments” to our unaudited consolidated financial statements in Item 1.
| Three Months Ended March 31, 2024 | Year Ended December 31, 2023 | ||||||||||||||||||||||||||||
| Realized gains | $ | 14,126 | (1) | $ | 6,078 | (2) | |||||||||||||||||||||||
| Unrealized gains (losses) | 29,158 | (3) | (201,475) | (4) | |||||||||||||||||||||||||
| Investment income (loss) | $ | 43,284 | $ | (195,397) | |||||||||||||||||||||||||
| March 31, 2024 | December 31, 2023 | |||||||||||||||||||||||||||||||
| Investments | Cost | Unrealized Gains | Unrealized Losses | Carrying Amount | Carrying Amount | |||||||||||||||||||||||||||
| Publicly traded companies | $ | 187,775 | $ | 57,761 | $ | (71,015) | $ | 174,521 | $ | 159,566 | ||||||||||||||||||||||
| Entities that report NAV | 511,039 | 189,044 | (27,954) | 672,129 | 671,532 | |||||||||||||||||||||||||||
| Entities that do not report NAV: | ||||||||||||||||||||||||||||||||
| Entities with observable price changes | 94,283 | 73,629 | (1,224) | 166,688 | 174,268 | |||||||||||||||||||||||||||
| Entities without observable price changes | 382,408 | — | — | 382,408 | 368,654 | |||||||||||||||||||||||||||
| Investments accounted for under the equity method | N/A | N/A | N/A | 115,842 | 75,498 | |||||||||||||||||||||||||||
| March 31, 2024 | $ | 1,175,505 | (5) | $ | 320,434 | $ | (100,193) | $ | 1,511,588 | $ | 1,449,518 | |||||||||||||||||||||
| December 31, 2023 | $ | 1,177,072 | $ | 320,445 | $ | (123,497) | $ | 1,449,518 |
| Public/Private Mix (Cost) | Tenant/Non-Tenant Mix (Cost) | |||||||
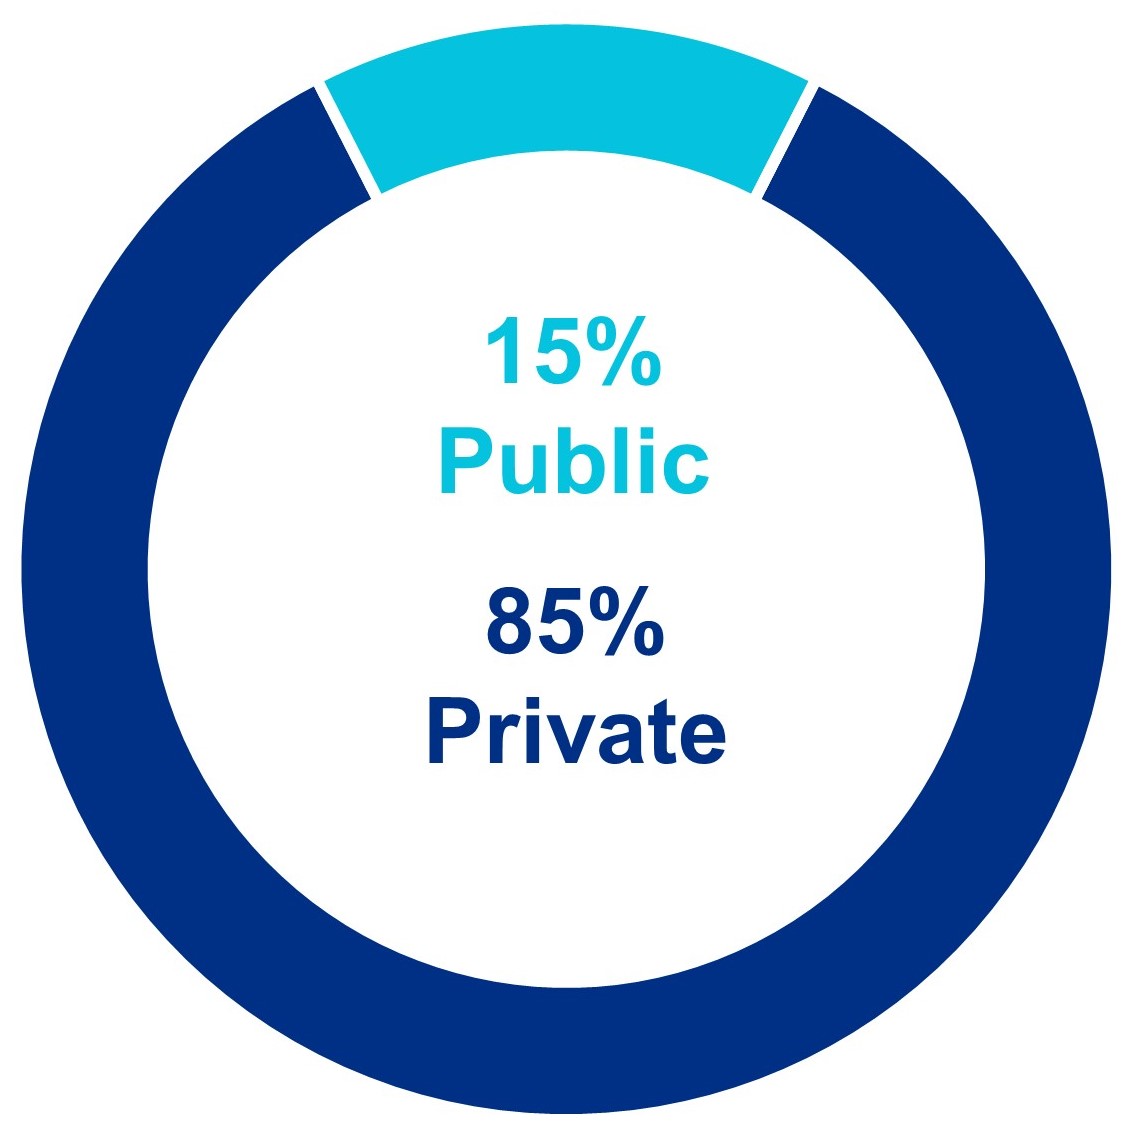 |  |
(1)Consists of realized gains of $28.8 million, partially offset by impairment charges of $14.7 million during the three months ended March 31, 2024.
(2)Consists of realized gains of $80.6 million, offset by impairment charges of $74.6 million during the year ended December 31, 2023.
(3)Consists of unrealized gains of $57.1 million primarily resulting from the increase in valuation in publicly traded entities and $27.9 million resulting from accounting reclassifications of unrealized gains recognized in prior periods into realized gains upon our realization of investments during the three months ended March 31, 2024.
(4)Consists of unrealized losses of $111.6 million primarily resulting from the decrease in the fair value of our investments in privately held entities that report NAV and $89.9 million resulting from accounting reclassifications of unrealized gains recognized in prior periods into realized gains upon our sales of investments, during the year ended December 31, 2023.
(5)Represents 2.7% of gross assets as of March 31, 2024. Refer to the definition of “Gross assets” under “Definitions and reconciliations” in Item 2 for additional details.
Liquidity
| Liquidity | Minimal Outstanding Borrowings and Significant Availability on Unsecured Senior Line of Credit | ||||||||||||||||
| $6.0B | (in millions) | ||||||||||||||||
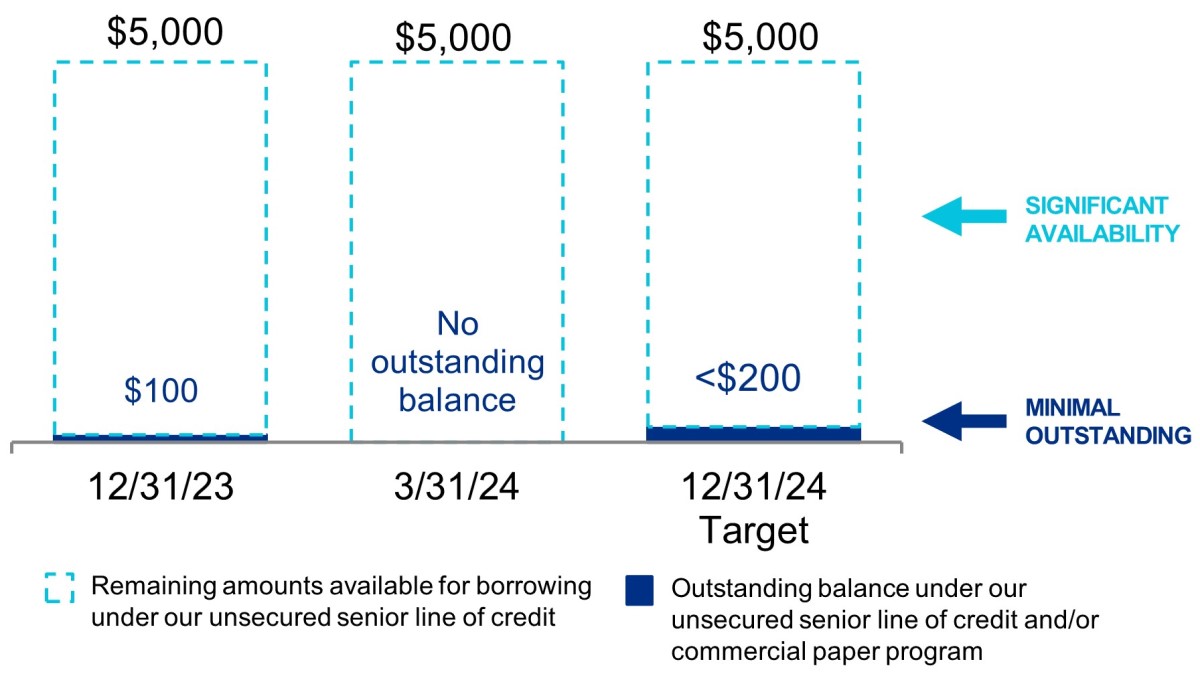 | |||||||||||||||||
| (In millions) | |||||||||||||||||
| Availability under our unsecured senior line of credit, net of amounts outstanding under our commercial paper program | $ | 5,000 | |||||||||||||||
| Cash, cash equivalents, and restricted cash | 732 | ||||||||||||||||
| Availability under our secured construction loan | 65 | ||||||||||||||||
| Investments in publicly traded companies | 175 | ||||||||||||||||
| Liquidity as of March 31, 2024 | $ | 5,972 | |||||||||||||||
We expect to meet certain long-term liquidity requirements, such as requirements for development, redevelopment, other construction projects, capital improvements, tenant improvements, property acquisitions, leasing costs, non-revenue-enhancing capital expenditures, scheduled debt maturities, distributions to noncontrolling interests, and payment of dividends through net cash provided by operating activities, periodic asset sales, strategic real estate joint ventures, long-term secured and unsecured indebtedness, borrowings under our unsecured senior line of credit, issuances under our commercial paper program, and issuances of additional debt and/or equity securities.
We also expect to continue meeting our short-term liquidity and capital requirements, as further detailed in this section, generally through our working capital and net cash provided by operating activities. We believe that the net cash provided by operating activities will continue to be sufficient to enable us to make the distributions necessary to continue qualifying as a REIT.
For additional information on our liquidity requirements related to our contractual obligations and commitments, refer to Note 5 – “Leases” and Note 10 – “Secured and unsecured senior debt” to our unaudited consolidated financial statements in Item 1.
Over the next several years, our balance sheet, capital structure, and liquidity objectives are as follows:
-
Retain cash flows from operating activities after payment of dividends and distributions to noncontrolling interests for investment in development and redevelopment projects and/or acquisitions;
-
Maintain significant balance sheet liquidity;
-
Improve credit profile and relative long-term cost of capital;
-
Maintain diverse sources of capital, including sources from net cash provided by operating activities, unsecured debt, secured debt, selective real estate asset sales, strategic real estate joint ventures, non-real estate investment sales, and common stock;
-
Maintain commitment to long-term capital to fund growth;
-
Maintain prudent laddering of debt maturities;
-
Maintain solid credit metrics;
-
Prudently manage variable-rate debt exposure;
-
Maintain a large, unencumbered asset pool to provide financial flexibility;
-
Fund common stock dividends and distributions to noncontrolling interests from net cash provided by operating activities;
-
Manage a disciplined level of value-creation projects as a percentage of our gross real estate assets; and
-
Maintain high levels of pre-leasing and percentage leased in value-creation projects.
The following table presents the availability under our unsecured senior line of credit, net of amounts outstanding under our commercial paper program; cash, cash equivalents, and restricted cash; availability under our secured construction loan; and investments in publicly traded companies as of March 31, 2024 (in thousands):
| Description | Stated Rate | Aggregate Commitments | Outstanding Balance(1) | Remaining Commitments/Liquidity | ||||||||||||||||||||||
| Availability under our unsecured senior line of credit, net of amounts outstanding under our commercial paper program | SOFR+0.855% | $ | 5,000,000 | $ | — | $ | 5,000,000 | |||||||||||||||||||
| Cash, cash equivalents, and restricted cash | 731,695 | |||||||||||||||||||||||||
| Construction loan | SOFR+2.70% | $ | 195,300 | $ | 129,431 | 65,410 | ||||||||||||||||||||
| Investments in publicly traded companies | 174,521 | |||||||||||||||||||||||||
| Liquidity as of March 31, 2024 | $ | 5,971,626 |
(1)Represents outstanding principal, net of unamortized deferred financing costs, as of March 31, 2024.
Cash, cash equivalents, and restricted cash
As of March 31, 2024 and December 31, 2023, we had $731.7 million and $660.8 million, respectively, of cash, cash equivalents, and restricted cash. We expect existing cash, cash equivalents, and restricted cash, net cash provided by operating activities, proceeds from real estate asset sales, sales of partial interests, strategic real estate joint ventures, non-real estate investment sales, borrowings under our unsecured senior line of credit, issuances under our commercial paper program, issuances of unsecured senior notes payable, borrowings under our secured construction loans, and issuances of common stock to continue to be sufficient to fund our operating activities and cash commitments for investing and financing activities, such as regular quarterly dividends, distributions to noncontrolling interests, scheduled debt repayments, acquisitions, and certain capital expenditures, including expenditures related to construction activities.
Cash flows
We report and analyze our cash flows based on operating activities, investing activities, and financing activities. The following table summarizes changes in our cash flows for the three months ended March 31, 2024 and 2023 (in thousands):
| Three Months Ended March 31, | |||||||||||||||||
| 2024 | 2023 | Change | |||||||||||||||
| Net cash provided by operating activities | $ | 341,157 | $ | 305,570 | $ | 35,587 | |||||||||||
| Net cash used in investing activities | $ | (894,854) | $ | (1,039,665) | $ | 144,811 | |||||||||||
| Net cash provided by financing activities | $ | 624,429 | $ | 1,174,810 | $ | (550,381) |
Operating activities
Cash flows provided by operating activities are primarily dependent upon the occupancy level of our asset base, the rental rates of our leases, the collectibility of rent and recovery of operating expenses from our tenants, the timing of completion of development and redevelopment projects, and the timing of acquisitions and dispositions of operating properties. Net cash provided by operating activities for the three months ended March 31, 2024 increased by $35.6 million to $341.2 million, compared to $305.6 million for the three months ended March 31, 2023. The increase was primarily attributable to the following since January 1, 2023: (i) cash flows generated from our highly leased development and redevelopment projects recently placed into service, (ii) income-producing acquisitions, and (iii) increases in rental rates on lease renewals and re-leasing of space.
Investing activities
Cash used in investing activities for the three months ended March 31, 2024 and 2023 consisted of the following (in thousands):
| Three Months Ended March 31, | Increase (Decrease) | ||||||||||||||||
| 2024 | 2023 | ||||||||||||||||
| Sources of cash from investing activities: | |||||||||||||||||
| Proceeds from sales of real estate | $ | 16,670 | $ | — | $ | 16,670 | |||||||||||
| Sales of and distributions from non-real estate investments | 40,550 | 49,385 | (8,835) | ||||||||||||||
| Change in escrow deposits | — | 9,366 | (9,366) | ||||||||||||||
| 57,220 | 58,751 | (1,531) | |||||||||||||||
| Uses of cash for investing activities: | |||||||||||||||||
| Purchases of real estate | 194,002 | 177,543 | 16,459 | ||||||||||||||
| Additions to real estate | 693,268 | 873,366 | (180,098) | ||||||||||||||
| Change in escrow deposits | 1,008 | — | 1,008 | ||||||||||||||
| Investments in unconsolidated real estate joint ventures | 3,224 | 106 | 3,118 | ||||||||||||||
| Additions to non-real estate investments | 60,572 | 47,401 | 13,171 | ||||||||||||||
| 952,074 | 1,098,416 | (146,342) | |||||||||||||||
| Net cash used in investing activities | $ | 894,854 | $ | 1,039,665 | $ | (144,811) |
The decrease in net cash used in investing activities for the three months ended March 31, 2024, compared to the three months ended March 31, 2023, was primarily due to a decreased use of cash for additions to real estate. Refer to Note 3 – “Investments in real estate” to our unaudited consolidated financial statements in Item 1 for additional information.
Financing activities
Cash flows provided by financing activities for the three months ended March 31, 2024 and 2023 consisted of the following (in thousands):
| Three Months Ended March 31, | |||||||||||||||||
| 2024 | 2023 | Change | |||||||||||||||
| Borrowings under secured notes payable | $ | 10,216 | $ | 14,428 | $ | (4,212) | |||||||||||
| Proceeds from issuance of unsecured senior notes payable | 998,806 | 996,205 | 2,601 | ||||||||||||||
| Borrowings under unsecured senior line of credit | — | 375,000 | (375,000) | ||||||||||||||
| Repayments of borrowings under unsecured senior line of credit | — | (375,000) | 375,000 | ||||||||||||||
| Proceeds from issuances under commercial paper program | 3,170,000 | 775,000 | 2,395,000 | ||||||||||||||
| Repayments of borrowings under commercial paper program | (3,270,000) | (400,000) | (2,870,000) | ||||||||||||||
| Payments of loan fees | (10,118) | (9,989) | (129) | ||||||||||||||
| Changes related to debt | 898,904 | 1,375,644 | (476,740) | ||||||||||||||
| Contributions from and sales of noncontrolling interests | 82,853 | 79,337 | 3,516 | ||||||||||||||
| Distributions to and purchases of noncontrolling interests | (111,540) | (63,186) | (48,354) | ||||||||||||||
| Dividends on common stock | (221,824) | (209,131) | (12,693) | ||||||||||||||
| Taxes paid related to net settlement of equity awards | (23,964) | (7,854) | (16,110) | ||||||||||||||
| Net cash provided by financing activities | $ | 624,429 | $ | 1,174,810 | $ | (550,381) |
Capital resources
We expect that our principal liquidity needs for the year ending December 31, 2024 will be satisfied by the following multiple sources of capital, as shown in the table below. There can be no assurance that our sources and uses of capital will not be materially higher or lower than these expectations.
| Key Sources and Uses of Capital (In millions) | 2024 Guidance | |||||||||||||||||||
| Range | Midpoint | |||||||||||||||||||
| Sources of capital: | ||||||||||||||||||||
| Incremental debt | $ | 900 | $ | 900 | $ | 900 | ||||||||||||||
| Net cash provided by operating activities after dividends | 400 | 500 | 450 | |||||||||||||||||
| Dispositions, sales of partial interests, and common equity(1) | 900 | 1,900 | 1,400 | |||||||||||||||||
| Total sources of capital | $ | 2,200 | $ | 3,300 | $ | 2,750 | ||||||||||||||
| Uses of capital: | ||||||||||||||||||||
| Construction | $ | 1,950 | $ | 2,550 | $ | 2,250 | ||||||||||||||
| Acquisitions | 250 | 750 | 500 | |||||||||||||||||
| Total uses of capital | $ | 2,200 | $ | 3,300 | $ | 2,750 | ||||||||||||||
| Incremental debt (included above): | ||||||||||||||||||||
| Issuance of unsecured senior notes payable(2) | $ | 1,000 | $ | 1,000 | $ | 1,000 | ||||||||||||||
| Unsecured senior line of credit, commercial paper program, and other | (100) | (100) | (100) | |||||||||||||||||
| Incremental debt | $ | 900 | $ | 900 | $ | 900 |
(1)Refer to “Dispositions and sales of partial interests” in Item 2 for additional detail. We expect to continue pursuing our strategy to fund a significant portion of our capital requirements for the year ending December 31, 2024 with dispositions and sales of partial interests and are actively pursuing several dispositions and partial interest sale opportunities. In February 2024, we entered into a new ATM common stock offering program, which allows us to sell up to an aggregate of $1.5 billion of our common stock. As of the date of this report, the full amount remained available for future sales of our common stock.
(2)In February 2024, we issued $1.0 billion of unsecured senior notes payable with a weighted-average interest rate of 5.48% and a weighted-average maturity of 23.1 years. The unsecured senior notes consisted of $400.0 million of 5.25% unsecured senior notes due 2036 and $600.0 million of 5.625% unsecured senior notes due 2054. Our 2024 guidance for issuance of unsecured senior notes payable assumes we issue new unsecured senior notes payable in 2025 to fund the repayment of our $600.0 million unsecured senior notes payable due on April 30, 2025. Subject to market conditions, we may seek opportunities in 2024 to fund the repayment of our 2025 debt maturity through issuance of additional unsecured senior notes payable.
The key assumptions behind the sources and uses of capital in the table above include a favorable real estate transaction and capital market environments, performance of our core operating properties, lease-up and delivery of current and future development and redevelopment projects, and leasing activity. Our expected sources and uses of capital are subject to a number of variables and uncertainties, including those discussed as “Forward-looking statements” under Part I; “Item 1A. Risk factors”; and “Item 7. Management’s discussion and analysis of financial condition and results of operations” of our annual report on Form 10-K for the year ended December 31, 2023; as well as in “Item 1A. Risk factors” within “Part II – Other information” of this quarterly report on Form 10-Q. We expect to update our forecast for key sources and uses of capital on a quarterly basis.
Sources of capital
Net cash provided by operating activities after dividends
We expect to retain $400 million to $500 million of net cash flows from operating activities after payment of common stock dividends, and distributions to noncontrolling interests for the year ending December 31, 2024. For purposes of this calculation, changes in operating assets and liabilities are excluded as they represent timing differences. For the year ending December 31, 2024, we expect our recently delivered projects, our highly pre-leased value-creation projects expected to be delivered, contributions from Same Properties, and recently acquired income-producing properties to contribute increases in income from rentals, net operating income, and cash flows. We anticipate contractual near-term growth in annual net operating income (cash basis) of $101 million related to the commencement of contractual rents on the projects recently placed into service that are near the end of their initial free rent period. Refer to “Cash flows” in Item 2 for a discussion of cash flows provided by operating activities for the three months ended March 31, 2024.
Debt
We expect to fund a portion of our capital needs for 2024 from issuances under our commercial paper program, issuances of unsecured senior notes payable, borrowings under our unsecured senior line of credit, and borrowings under our secured construction loan.
As of March 31, 2024, our unsecured senior line of credit had aggregate commitments of $5.0 billion and bore an interest rate of SOFR plus 0.855%. In addition to the cost of borrowing, the unsecured senior line of credit is subject to an annual facility fee of 0.145% based on the aggregate commitments outstanding. Based upon our ability to achieve certain annual sustainability targets, the interest rate and facility fee rate are also subject to upward or downward adjustments of up to four basis points with respect to the interest rate and up to one basis point with respect to the facility fee rate.
Based on certain sustainability metrics achieved in accordance with the terms of our unsecured senior line of credit agreement, the borrowing rate was reduced for a one-year period by two basis points to SOFR plus 0.855%, from SOFR plus 0.875%, and the facility fee was reduced by 0.5 basis point to 0.145% from 0.15%. As of March 31, 2024, we had no outstanding balance on our unsecured line of credit.
Our commercial paper program provides us with the ability to issue up to $2.5 billion of commercial paper notes with a maturity of generally 30 days or less and with a maximum maturity of 397 days from the date of issuance. Our commercial paper program is backed by our unsecured senior line of credit, and at all times we expect to retain a minimum undrawn amount of borrowing capacity under our unsecured senior line of credit equal to any outstanding balance under our commercial paper program. We use borrowings under the program to fund short-term capital needs. The notes issued under our commercial paper program are sold under customary terms in the commercial paper market. They are typically issued at a discount to par, representing a yield to maturity dictated by market conditions at the time of issuance. In the event we are unable to issue commercial paper notes or refinance outstanding commercial paper notes under terms equal to or more favorable than those under the unsecured senior line of credit, we expect to borrow under the unsecured senior line of credit. The commercial paper notes sold during the three months ended March 31, 2024 were issued at a weighted-average yield to maturity of 5.60%. As of March 31, 2024, we had no commercial paper notes outstanding.
In February 2024, we issued $1.0 billion of unsecured senior notes payable with a weighted-average interest rate of 5.48% and a weighted-average maturity of 23.1 years. The unsecured senior notes consisted of $400.0 million of 5.25% unsecured senior notes due 2036 and $600.0 million of 5.625% unsecured senior notes due 2054.
The following table presents our average debt outstanding and weighted-average interest rates during the three months ended March 31, 2024 (dollars in thousands):
| Three Months Ended March 31, 2024 | |||||||||||||||||||||||||||||
| Average Debt Outstanding | Weighted-Average Interest Rate | ||||||||||||||||||||||||||||
| Long-term fixed-rate debt | $ | 11,683,004 | 3.71 | % | |||||||||||||||||||||||||
| Short-term variable-rate unsecured senior line of credit and commercial paper program debt | 531,445 | 5.76 | |||||||||||||||||||||||||||
| Blended average interest rate | 12,214,449 | 3.80 | |||||||||||||||||||||||||||
| Loan fee amortization and annual facility fee related to unsecured senior line of credit | N/A | 0.12 | |||||||||||||||||||||||||||
| Total/weighted average | $ | 12,214,449 | 3.92 | % |
Real estate dispositions, sales of partial interests, and issuances of common equity
We expect to continue to focus on the disciplined execution of select sales of real estate. Future sales will provide an important source of capital to fund a portion of pending and recently completed acquisitions and our highly leased value-creation development and redevelopment projects, and also provide significant capital for growth. In addition, we may also consider additional sales of partial interests in core Class A/A+ properties and/or development projects. For the year ending December 31, 2024, we expect real estate dispositions, sales of partial interests, and issuances of common equity to range from $900 million to $1.9 billion. The amount of asset sales necessary to meet our forecasted sources of capital will vary depending upon the amount of EBITDA associated with the assets sold.
Refer to Note 3 – “Investments in real estate,” Note 4 – “Consolidated and unconsolidated real estate joint ventures,” and Note 13 – “Stockholders’ equity” to our unaudited consolidated financial statements in Item 1 and to “Dispositions and sales of partial interests” in Item 2 for additional information on our real estate dispositions and sales of partial interests.
As a REIT, we are generally subject to a 100% tax on the net income from real estate asset sales that the IRS characterizes as “prohibited transactions.” We do not expect our sales will be categorized as prohibited transactions. However, unless we meet certain “safe harbor” requirements, whether a real estate asset sale is a “prohibited transaction” will be based on the facts and circumstances of the sale. Our real estate asset sales may not always meet such “safe harbor” requirements. Refer to “Item 1A. Risk factors” of our annual report on Form 10-K for the year ended December 31, 2023 for additional information about the “prohibited transaction” tax.
Common equity transactions
In February 2024, we entered into a new ATM common stock offering program, which allows us to sell up to an aggregate of $1.5 billion of our common stock. As of March 31, 2024, the full amount remained available for future sales of our common stock.
Other sources
As a well-known seasoned issuer, we may, from time to time, issue securities at our discretion based on our needs and market conditions, including, as necessary, to balance our use of incremental debt capital.
Additionally, we, together with joint venture partners, hold interests in real estate joint ventures that we consolidate in our financial statements. These existing joint ventures provide significant equity capital to fund a portion of our future construction spend, and our joint venture partners may also contribute equity into these entities for financing-related activities. From April 1, 2024 through December 31, 2027, we expect to receive capital contributions aggregating $1.3 billion from existing consolidated real estate joint venture partners to fund construction. During the year ending December 31, 2024, contributions from noncontrolling interests from existing joint venture partners are expected to aggregate $430.0 million.
Uses of capital
Summary of capital expenditures
One of our primary uses of capital relates to the development, redevelopment, pre-construction, and construction of properties. We currently have projects in our value-creation pipeline aggregating 5.3 million RSF of Class A/A+ properties undergoing construction and one committed near-term project expected to commence construction in the next two years, 2.5 million RSF of priority anticipated development and redevelopment projects, and 24.1 million SF of future development projects in North America. We incur capitalized construction costs related to development, redevelopment, pre-construction, and other construction activities. We also incur additional capitalized project costs, including interest, property taxes, insurance, and other costs directly related and essential to the development, redevelopment, pre-construction, or construction of a project, during periods when activities necessary to prepare an asset for its intended use are in progress. Refer to “New Class A/A+ development and redevelopment properties: current projects” and “Summary of capital expenditures” in Item 2 for more information on our capital expenditures.
We capitalize interest cost as a cost of the project only during the period in which activities necessary to prepare an asset for its intended use are ongoing, provided that expenditures for the asset have been made and interest cost has been incurred. Capitalized interest for the three months ended March 31, 2024 and 2023 of $81.8 million and $87.1 million, respectively, was classified in investments in real estate in our consolidated balance sheets. The decrease in capitalized interest was related to a lower weighted-average capitalized cost basis of $8.2 billion for the three months ended March 31, 2024, as compared to $9.3 billion for the three months ended March 31, 2023, partially offset by an increase in weighted-average interest rate used to capitalize interest to 3.92% for the three months ended March 31, 2024 from 3.69% for the three months ended March 31, 2023.
Property taxes, insurance on real estate, and indirect project costs, such as construction, administration, legal fees, and office costs that clearly relate to projects under development or construction, are capitalized as incurred during the period an asset is undergoing activities to prepare it for its intended use. We capitalized payroll and other indirect costs related to development, redevelopment, pre-construction, and construction projects, aggregating $26.3 million and $23.6 million, and property taxes, insurance on real estate and indirect project costs aggregating $32.7 million and $29.8 million during the three months ended March 31, 2024 and 2023, respectively.
Our capitalized costs for the three months ended March 31, 2024, compared to the same period in 2023, were consistent primarily due to relative consistency in the size of our value-creation pipeline during these periods. Pre-construction activities include entitlements, permitting, design, site work, and other activities preceding commencement of construction of aboveground building improvements. The advancement of pre-construction efforts is focused on reducing the time required to deliver projects to prospective tenants. These critical activities add significant value for future ground-up development and are required for the vertical construction of buildings. Should we cease activities necessary to prepare an asset for its intended use, the interest, taxes, insurance, and certain other direct and indirect project costs related to the asset would be expensed as incurred. Expenditures for repairs and maintenance are expensed as incurred.
Fluctuations in our development, redevelopment, and construction activities could result in significant changes to total expenses and net income. For example, had we experienced a 10% reduction in development, redevelopment, and construction activities without a corresponding decrease in indirect project costs, including interest and payroll, total expenses would have increased by approximately $14.1 million for the three months ended March 31, 2024.
We use third-party brokers to assist in our leasing activity, who are paid on a contingent basis upon successful leasing. We are required to capitalize initial direct costs related to successful leasing transactions that result directly from and are essential to the lease transaction and would not have been incurred had that lease transaction not been successfully executed. During the three months ended March 31, 2024, we capitalized total initial direct leasing costs of $29.4 million. Costs that we incur to negotiate or arrange a lease regardless of its outcome, such as fixed employee compensation, tax, or legal advice to negotiate lease terms, and other costs, are expensed as incurred.
Acquisitions
During the three months ended March 31, 2024, the purchase price of our completed acquisitions aggregated $194.8 million. As of March 31, 2024, the total purchase price of our pending acquisitions under executed letters of intent or purchase and sale agreements that are expected to be completed in 2024 aggregated $82.4 million. For the year ending December 31, 2024, we expect real estate acquisitions to range from $250 million to $750 million.
Refer to “Acquisitions” in Note 3 – “Investments in real estate” and to Note 4 – “Consolidated and unconsolidated real estate joint ventures” to our unaudited consolidated financial statements in Item 1, and “Acquisitions” in Item 2 for information on our acquisitions.
Dividends
During the three months ended March 31, 2024 and 2023, we paid common stock dividends of $221.8 million and $209.1 million, respectively. The increase of $12.7 million in dividends paid on our common stock during the three months ended March 31, 2024, compared to the three months ended March 31, 2023, was primarily due to an increase in the number of common shares outstanding subsequent to January 1, 2023 as a result of settled forward equity sales agreements, and an increase in the related dividends to $1.27 per common share paid during the three months ended March 31, 2024 from $1.21 per common share paid during the three months ended March 31, 2023.
Secured notes payable
Secured notes payable as of March 31, 2024 consisted of three notes secured by two properties. Our secured notes payable typically require monthly payments of principal and interest and had a weighted-average interest rate of approximately 8.36%. As of March 31, 2024, the total book value of our investments in real estate securing debt was approximately $345.4 million. As of March 31, 2024, our secured notes payable, including unamortized discounts and deferred financing costs, comprised approximately $619 thousand and $129.4 million of fixed-rate debt and unhedged variable-rate debt, respectively.
Unsecured senior notes payable and unsecured senior line of credit
The requirements of, and our actual performance with respect to, the key financial covenants under our unsecured senior notes payable as of March 31, 2024 were as follows:
| Covenant Ratios(1) | Requirement | March 31, 2024 | ||||||||||||
| Total Debt to Total Assets | Less than or equal to 60% | 29% | ||||||||||||
| Secured Debt to Total Assets | Less than or equal to 40% | 0.3% | ||||||||||||
| Consolidated EBITDA(2) to Interest Expense | Greater than or equal to 1.5x | 14.1x | ||||||||||||
| Unencumbered Total Asset Value to Unsecured Debt | Greater than or equal to 150% | 330% |
(1)All covenant ratio titles utilize terms as defined in the respective debt agreements.
(2)The calculation of consolidated EBITDA is based on the definitions contained in our loan agreements and is not directly comparable to the computation of EBITDA as described in Exchange Act Release No. 47226.
In addition, the terms of the indentures, among other things, limit the ability of the Company, Alexandria Real Estate Equities, L.P., and the Company’s subsidiaries to (i) consummate a merger, or consolidate or sell all or substantially all of the Company’s assets, and (ii) incur certain secured or unsecured indebtedness.
The requirements of, and our actual performance with respect to, the key financial covenants under our unsecured senior line of credit as of March 31, 2024 were as follows:
| Covenant Ratios(1) | Requirement | March 31, 2024 | ||||||||||||
| Leverage Ratio | Less than or equal to 60.0% | 28.5% | ||||||||||||
| Secured Debt Ratio | Less than or equal to 45.0% | 0.2% | ||||||||||||
| Fixed-Charge Coverage Ratio | Greater than or equal to 1.50x | 4.06x | ||||||||||||
| Unsecured Interest Coverage Ratio | Greater than or equal to 1.75x | 20.57x |
(1)All covenant ratio titles utilize terms as defined in the credit agreement.
Estimated interest payments
Estimated interest payments on our fixed-rate debt are calculated based upon contractual interest rates, including interest payment dates and scheduled maturity dates. As of March 31, 2024, 98.9% of our debt was fixed-rate debt. For additional information regarding our debt, refer to Note 10 – “Secured and unsecured senior debt” to our unaudited consolidated financial statements in Item 1.
Ground lease obligations
Ground lease obligations as of March 31, 2024 included leases for 36 of our properties, which accounted for approximately 9% of our total number of properties. Excluding one ground lease that expires in 2036 related to one operating property with a net book value of $5.8 million as of March 31, 2024, our ground lease obligations have remaining lease terms ranging from approximately 30 to 98 years, including available extension options that we are reasonably certain to exercise.
In many cases, we seek to extend our ground leases well ahead of their scheduled contractual expirations. If we are successful in extending ground leases, we could see significant up-front or increased recurring future payments to the ground lessor and/or increased ground lease expense, which may require us to increase our capital funding needs.
Operating lease agreements
As of March 31, 2024, the remaining contractual payments under ground and office lease agreements in which we are the lessee aggregated $815.6 million and $27.9 million, respectively. We are required to recognize a right-of-use asset and a related liability to account for our future obligations under operating lease arrangements in which we are the lessee. The operating lease liability is measured based on the present value of the remaining lease payments, including payments during the term under our extension options that we are reasonably certain to exercise. The right-of-use asset is equal to the corresponding operating lease liability, adjusted for the initial direct leasing cost and any other consideration exchanged with the landlord prior to the commencement of the lease, as well as adjustments to reflect favorable or unfavorable terms of an acquired lease when compared with market terms at the time of acquisition. As of March 31, 2024, the present value of the remaining contractual payments aggregating $843.5 million under our operating lease agreements, including our extension options that we are reasonably certain to exercise, was $381.6 million, which was classified in accounts payable, accrued expenses, and other liabilities in our consolidated balance sheets. As of March 31, 2024, the weighted-average remaining lease term of operating leases in which we are the lessee was approximately 41 years, and the weighted-average discount rate was 4.6%. Our corresponding operating lease right-of-use assets, adjusted for initial direct leasing costs and other consideration exchanged with the landlord prior to the commencement of the lease, aggregated $513.3 million. We classify the right-of-use asset in other assets in our consolidated balance sheets. Refer to “Lease accounting” in Note 2 – “Summary of significant accounting policies” to our unaudited consolidated financial statements in Item 1 for additional information.
Commitments
As of March 31, 2024, remaining aggregate costs under contract for the construction of properties undergoing development, redevelopment, and improvements under the terms of leases approximated $1.7 billion. In addition, we may be required to incur construction costs associated with future development projects aggregating 643,331 RSF pursuant to an agreement whereby our counterparty may elect to execute future lease agreements on mutually agreeable terms. We expect payments for these obligations to occur over one to three years, subject to capital planning adjustments from time to time. We may have the ability to cease the construction of certain projects, which would result in the reduction of our commitments.
As of March 31, 2024, the total purchase price of our pending acquisitions under executed letters of intent or purchase and sale agreements aggregated $82.4 million related to the acquisitions expected to be completed in 2024. In addition, we have letters of credit and performance obligations aggregating $29.5 million primarily related to acquisitions expected to be completed after 2024.
We are committed to funding approximately $409.1 million related to our non-real estate investments. These funding commitments are primarily associated with our investments in privately held entities that report NAV and expire at various dates over the next 12 years, with a weighted-average expiration of 8.3 years as of March 31, 2024.
Exposure to environmental liabilities
In connection with the acquisition of all of our properties, we have obtained Phase I environmental assessments to ascertain the existence of any environmental liabilities or other issues. The Phase I environmental assessments of our properties have not revealed any environmental liabilities that we believe would have a material adverse effect on our financial condition or results of operations taken as a whole, nor are we aware of any material environmental liabilities that have occurred since the Phase I environmental assessments were completed. In addition, we carry a policy of pollution legal liability insurance covering exposure to certain environmental losses at substantially all of our properties.
Foreign currency translation gains and losses
The following table presents the change in accumulated other comprehensive loss attributable to Alexandria Real Estate Equities, Inc.’s stockholders during the three months ended March 31, 2024 primarily due to the changes in the foreign exchange rates for our real estate investments in Canada (in thousands). We reclassify unrealized foreign currency translation gains and losses into net income as we dispose of these holdings.
| Total | ||||||||
| Balance as of December 31, 2023 | $ | (15,896) | ||||||
| Other comprehensive loss before reclassifications | (7,919) | |||||||
| Net other comprehensive loss | (7,919) | |||||||
| Balance as of March 31, 2024 | $ | (23,815) |
Inflation
As of March 31, 2024, approximately 94% of our leases (on an annual rental revenue basis) were triple net leases, which require tenants to pay substantially all real estate taxes, insurance, utilities, repairs and maintenance, common area expenses, and other operating expenses (including increases thereto) in addition to base rent. Approximately 96% of our leases (on an annual rental revenue basis) contained effective annual rent escalations that were either fixed (generally ranging from 3.0% to 3.5%) or indexed based on a consumer price index or other indices. Accordingly, we do not believe that our cash flows or earnings from real estate operations are subject to significant risks from inflation. A period of inflation, however, could cause an increase in the cost of our variable-rate borrowings, including borrowings under our unsecured senior line of credit and commercial paper program, issuances of unsecured senior notes payable, and borrowings under our secured construction loans, and secured loans held by our unconsolidated real estate joint ventures.
In addition, refer to “Item 1A. Risk factors” within “Part II – Other information” in this quarterly report on Form 10-Q for a discussion about risks that inflation directly or indirectly may pose to our business.
Issuer and guarantor subsidiary summarized financial information
Alexandria Real Estate Equities, Inc. (the “Issuer”) has sold certain debt securities registered under the Securities Act of 1933, as amended, that are fully and unconditionally guaranteed by Alexandria Real Estate Equities, L.P. (the “LP” or the “Guarantor Subsidiary”), an indirectly 100% owned subsidiary of the Issuer. The Issuer’s other subsidiaries, including, but not limited to, the subsidiaries that own substantially all of its real estate (collectively, the “Combined Non-Guarantor Subsidiaries”), will not provide a guarantee of such securities, including the subsidiaries that are partially or 100% owned by the LP. The following summarized financial information presents, on a combined basis, balance sheet information as of March 31, 2024 and December 31, 2023, and results of operations and comprehensive income for the three months ended March 31, 2024 and year ended December 31, 2023 for the Issuer and the Guarantor Subsidiary. The information presented below excludes eliminations necessary to arrive at the information on a consolidated basis. In presenting the summarized financial statements, the equity method of accounting has been applied to (i) the Issuer’s interests in the Guarantor Subsidiary, (ii) the Guarantor Subsidiary’s interests in the Combined Non-Guarantor Subsidiaries, and (iii) the Combined Non-Guarantor Subsidiaries’ interests in the Guarantor Subsidiary, where applicable, even though all such subsidiaries meet the requirements to be consolidated under GAAP. All assets and liabilities have been allocated to the Issuer and the Guarantor Subsidiary generally based on legal entity ownership.
The following tables present combined summarized financial information as of March 31, 2024 and December 31, 2023, for the three months ended March 31, 2024, and for the year ended December 31, 2023 for the Issuer and Guarantor Subsidiary. Amounts provided do not represent our total consolidated amounts (in thousands):
| March 31, 2024 | December 31, 2023 | |||||||||||||
| Assets: | ||||||||||||||
| Cash, cash equivalents, and restricted cash | $ | 380,040 | $ | 210,755 | ||||||||||
| Other assets | 118,464 | 115,373 | ||||||||||||
| Total assets | $ | 498,504 | $ | 326,128 | ||||||||||
| Liabilities: | ||||||||||||||
| Unsecured senior notes payable | $ | 12,087,113 | $ | 11,096,028 | ||||||||||
| Unsecured senior line of credit and commercial paper | — | 99,952 | ||||||||||||
| Other liabilities | 493,253 | 504,659 | ||||||||||||
| Total liabilities | $ | 12,580,366 | $ | 11,700,639 | ||||||||||
| Three Months Ended March 31, 2024 | Year Ended December 31, 2023 | |||||||||||||
| Total revenues | $ | 16,359 | $ | 54,230 | ||||||||||
| Total expenses | (87,121) | (273,990) | ||||||||||||
| Net loss | (70,762) | (219,760) | ||||||||||||
| Net income attributable to unvested restricted stock awards | (3,659) | (11,195) | ||||||||||||
| Net loss attributable to Alexandria Real Estate Equities, Inc.’s common stockholders | $ | (74,421) | $ | (230,955) | ||||||||||
As of March 31, 2024, 395 of our 410 properties were held indirectly by the REIT’s wholly owned consolidated subsidiary, Alexandria Real Estate Equities, L.P.
Critical accounting estimates
Refer to our annual report on Form 10-K for the year ended December 31, 2023 for a discussion of our critical accounting estimates related to recognition of real estate acquired, impairment of long-lived assets, impairment of non-real estate investments, and monitoring of tenant credit quality.
Definitions and reconciliations
This section contains additional information on certain non-GAAP financial measures, including reconciliations to the most directly comparable financial measure calculated and presented in accordance with GAAP and the reasons why we use these supplemental measures of performance and believe they provide useful information to investors, as well as the definitions of other terms used in this report.
Funds from operations and funds from operations, as adjusted, attributable to Alexandria Real Estate Equities, Inc.’s common stockholders
GAAP-basis accounting for real estate assets utilizes historical cost accounting and assumes that real estate values diminish over time. In an effort to overcome the difference between real estate values and historical cost accounting for real estate assets, the Nareit Board of Governors established funds from operations as an improved measurement tool. Since its introduction, funds from operations has become a widely used non-GAAP financial measure among equity REITs. We believe that funds from operations is helpful to investors as an additional measure of the performance of an equity REIT. Moreover, we believe that funds from operations, as adjusted, allows investors to compare our performance to the performance of other real estate companies on a consistent basis, without having to account for differences recognized because of real estate acquisition and disposition decisions, financing decisions, capital structure, capital market transactions, variances resulting from the volatility of market conditions outside of our control, or other corporate activities that may not be representative of the operating performance of our properties.
The 2018 White Paper published by the Nareit Board of Governors (the “Nareit White Paper”) defines funds from operations as net income (computed in accordance with GAAP), excluding gains or losses on sales of real estate, and impairments of real estate, plus depreciation and amortization of operating real estate assets, and after adjustments for our share of consolidated and unconsolidated partnerships and real estate joint ventures. Impairments represent the write-down of assets when fair value over the recoverability period is less than the carrying value due to changes in general market conditions and do not necessarily reflect the operating performance of the properties during the corresponding period.
We compute funds from operations, as adjusted, as funds from operations calculated in accordance with the Nareit White Paper, excluding significant gains, losses, and impairments realized on non-real estate investments, unrealized gains or losses on non-real estate investments, gains or losses on early extinguishment of debt, significant termination fees, acceleration of stock compensation expense due to the resignations of executive officers, deal costs, the income tax effect related to such items, and the amount of such items that is allocable to our unvested restricted stock awards. We compute the amount that is allocable to our unvested restricted stock awards using the two-class method. Under the two-class method, we allocate net income (after amounts attributable to noncontrolling interests) to common stockholders and to unvested restricted stock awards by applying the respective weighted-average shares outstanding during each quarter-to-date and year-to-date period. This may result in a difference of the summation of the quarter-to-date and year-to-date amounts. Neither funds from operations nor funds from operations, as adjusted, should be considered as alternatives to net income (determined in accordance with GAAP) as indications of financial performance, or to cash flows from operating activities (determined in accordance with GAAP) as measures of liquidity, nor are they indicative of the availability of funds for our cash needs, including our ability to make distributions.
The following table reconciles net income to funds from operations for the share of consolidated real estate joint ventures attributable to noncontrolling interests and our share of unconsolidated real estate joint ventures for the three months ended March 31, 2024 (in thousands):
| Three Months Ended March 31, 2024 | |||||||||||||||||||||||
| Noncontrolling Interest Share of Consolidated Real Estate Joint Ventures | Our Share of Unconsolidated Real Estate Joint Ventures | ||||||||||||||||||||||
| Net income | $ | 48,631 | $ | 155 | |||||||||||||||||||
| Depreciation and amortization of real estate assets | 30,904 | 1,034 | |||||||||||||||||||||
| Funds from operations | $ | 79,535 | $ | 1,189 | |||||||||||||||||||
The following tables present a reconciliation of net income attributable to Alexandria Real Estate Equities, Inc.’s common stockholders, the most directly comparable financial measure presented in accordance with GAAP, including our share of amounts from consolidated and unconsolidated real estate joint ventures, to funds from operations attributable to Alexandria Real Estate Equities, Inc.’s common stockholders – diluted, and funds from operations attributable to Alexandria Real Estate Equities, Inc.’s common stockholders – diluted, as adjusted, and the related per share amounts for the three months ended March 31, 2024 and 2023 (in thousands, except per share amounts). Per share amounts may not add due to rounding.
| Three Months Ended March 31, | ||||||||||||||||||||||||||
| 2024 | 2023 | |||||||||||||||||||||||||
| Net income attributable to Alexandria Real Estate Equities, Inc.’s common stockholders – basic and diluted | $ | 166,886 | $ | 75,256 | ||||||||||||||||||||||
| Depreciation and amortization of real estate assets | 284,950 | 262,124 | ||||||||||||||||||||||||
| Noncontrolling share of depreciation and amortization from consolidated real estate JVs | (30,904) | (28,178) | ||||||||||||||||||||||||
| Our share of depreciation and amortization from unconsolidated real estate JVs | 1,034 | 859 | ||||||||||||||||||||||||
| Gain on sales of real estate | (392) | — | ||||||||||||||||||||||||
| Allocation to unvested restricted stock awards | (3,469) | (1,359) | ||||||||||||||||||||||||
| Funds from operations attributable to Alexandria Real Estate Equities, Inc.’s common stockholders – diluted(1) | 418,105 | 308,702 | ||||||||||||||||||||||||
| Unrealized (gains) losses on non-real estate investments | (29,158) | 65,855 | ||||||||||||||||||||||||
| Impairment of non-real estate investments | 14,698 | (2) | — | |||||||||||||||||||||||
| Allocation to unvested restricted stock awards | 247 | (867) | ||||||||||||||||||||||||
| Funds from operations attributable to Alexandria Real Estate Equities, Inc.’s common stockholders – diluted, as adjusted | $ | 403,892 | $ | 373,690 |
(1)Calculated in accordance with standards established by the Nareit Board of Governors.
(2)Related to non-real estate investments in privately held entities that do not report NAV. Refer to Note 7 – “Investments” to our unaudited consolidated financial statements in Item 1 for additional information.
| Three Months Ended March 31, | ||||||||||||||||||||||||||
| (Per share) | 2024 | 2023 | ||||||||||||||||||||||||
| Net income per share attributable to Alexandria Real Estate Equities, Inc.’s common stockholders – diluted | $ | 0.97 | $ | 0.44 | ||||||||||||||||||||||
| Depreciation and amortization of real estate assets | 1.48 | 1.38 | ||||||||||||||||||||||||
| Allocation to unvested restricted stock awards | (0.02) | (0.01) | ||||||||||||||||||||||||
| Funds from operations per share attributable to Alexandria Real Estate Equities, Inc.’s common stockholders – diluted | 2.43 | 1.81 | ||||||||||||||||||||||||
| Unrealized (gains) losses on non-real estate investments | (0.17) | 0.39 | ||||||||||||||||||||||||
| Impairment of non-real estate investments | 0.09 | — | ||||||||||||||||||||||||
| Allocation to unvested restricted stock awards | — | (0.01) | ||||||||||||||||||||||||
| Funds from operations per share attributable to Alexandria Real Estate Equities, Inc.’s common stockholders – diluted, as adjusted | $ | 2.35 | $ | 2.19 | ||||||||||||||||||||||
| Weighted-average shares of common stock outstanding – diluted(1) | 171,949 | 170,784 | ||||||||||||||||||||||||
(1)Refer to “Weighted-average shares of common stock outstanding – diluted” in this section for additional information.
Adjusted EBITDA and Adjusted EBITDA margin
We use Adjusted EBITDA as a supplemental performance measure of our operations, for financial and operational decision-making, and as a supplemental means of evaluating period-to-period comparisons on a consistent basis. Adjusted EBITDA is calculated as earnings before interest, taxes, depreciation, and amortization (“EBITDA”), excluding stock compensation expense, gains or losses on early extinguishment of debt, gains or losses on sales of real estate, impairments of real estate, and significant termination fees. Adjusted EBITDA also excludes unrealized gains or losses and significant realized gains or losses and impairments that result from our non-real estate investments. These non-real estate investment amounts are classified in our consolidated statements of operations outside of total revenues.
We believe Adjusted EBITDA provides investors with relevant and useful information as it allows investors to evaluate the operating performance of our business activities without having to account for differences recognized because of investing and financing decisions related to our real estate and non-real estate investments, our capital structure, capital market transactions, and variances resulting from the volatility of market conditions outside of our control. For example, we exclude gains or losses on the early extinguishment of debt to allow investors to measure our performance independent of our indebtedness and capital structure. We believe that adjusting for the effects of impairments and gains or losses on sales of real estate, significant impairments and realized gains or losses on non-real estate investments, and significant termination fees allows investors to evaluate performance from period to period on a consistent basis without having to account for differences recognized because of investing and financing decisions related to our real estate and non-real estate investments or other corporate activities that may not be representative of the operating performance of our properties.
In addition, we believe that excluding charges related to stock compensation and unrealized gains or losses facilitates for investors a comparison of our business activities across periods without the volatility resulting from market forces outside of our control. Adjusted EBITDA has limitations as a measure of our performance. Adjusted EBITDA does not reflect our historical expenditures or future requirements for capital expenditures or contractual commitments. While Adjusted EBITDA is a relevant measure of performance, it does not represent net income (loss) or cash flows from operations calculated and presented in accordance with GAAP, and it should not be considered as an alternative to those indicators in evaluating performance or liquidity.
In order to calculate the Adjusted EBITDA margin, we divide Adjusted EBITDA by total revenues as presented in our consolidated statements of operations. We believe that this supplemental performance measure provides investors with additional useful information regarding the profitability of our operating activities.
We are not able to forecast fourth quarter net income without unreasonable effort and therefore do not provide a reconciliation for Adjusted EBITDA on a forward-looking basis. This is due to the inherent difficulty of forecasting the timing and/or amount of items that depend on market conditions outside of our control, including the timing of dispositions, capital events, and financing decisions, as well as quarterly components such as gain on sales of real estate, unrealized gains or losses on non-real estate investments, impairment of real estate, and impairment of non-real estate investments. Our attempt to predict these amounts may produce significant but inaccurate estimates, which would be potentially misleading for our investors.
The following table reconciles net income (loss), the most directly comparable financial measure calculated and presented in accordance with GAAP, to Adjusted EBITDA and calculates the Adjusted EBITDA margin for the three months ended March 31, 2024 and 2023 (dollars in thousands):
| Three Months Ended March 31, | |||||||||||||||||||||||
| 2024 | 2023 | ||||||||||||||||||||||
| Net income | $ | 219,176 | $ | 121,693 | |||||||||||||||||||
| Interest expense | 40,840 | 13,754 | |||||||||||||||||||||
| Income taxes | 1,764 | 1,131 | |||||||||||||||||||||
| Depreciation and amortization | 287,554 | 265,302 | |||||||||||||||||||||
| Stock compensation expense | 17,125 | 16,486 | |||||||||||||||||||||
| Gain on sales of real estate | (392) | — | |||||||||||||||||||||
| Unrealized (gains) losses on non-real estate investments | (29,158) | 65,855 | |||||||||||||||||||||
| Impairment of non-real estate investments | 14,698 | — | |||||||||||||||||||||
| Adjusted EBITDA | $ | 551,607 | $ | 484,221 | |||||||||||||||||||
| Total revenues | $ | 769,108 | $ | 700,795 | |||||||||||||||||||
| Adjusted EBITDA margin | 72% | 69% |
Annual rental revenue
Annual rental revenue represents the annualized fixed base rental obligations, calculated in accordance with GAAP, for leases in effect as of the end of the period, related to our operating RSF. Annual rental revenue is presented using 100% of the annual rental revenue from our consolidated properties and our share of annual rental revenue for our unconsolidated real estate joint ventures. Annual rental revenue per RSF is computed by dividing annual rental revenue by the sum of 100% of the RSF of our consolidated properties and our share of the RSF of properties held in unconsolidated real estate joint ventures. As of March 31, 2024, approximately 94% of our leases (on an annual rental revenue basis) were triple net leases, which require tenants to pay substantially all real estate taxes, insurance, utilities, repairs and maintenance, common area expenses, and other operating expenses (including increases thereto) in addition to base rent. Annual rental revenue excludes these operating expenses recovered from our tenants. Amounts recovered from our tenants related to these operating expenses, along with base rent, are classified in income from rentals in our consolidated statements of operations.
Capitalization rates
Capitalization rates are calculated based on net operating income and net operating income (cash basis) annualized, excluding lease termination fees, on stabilized operating assets for the quarter preceding the date on which the property is sold, or near-term prospective net operating income.
Capitalized interest
We capitalize interest cost as a cost of a project during periods for which activities necessary to develop, redevelop, or reposition a project for its intended use are ongoing, provided that expenditures for the asset have been made and interest cost has been incurred. Activities necessary to develop, redevelop, or reposition a project include pre-construction activities such as entitlements, permitting, design, site work, and other activities preceding commencement of construction of aboveground building improvements. The advancement of pre-construction efforts is focused on reducing the time required to deliver projects to prospective tenants. These critical activities add significant value for future ground-up development and are required for the vertical construction of buildings. If we cease activities necessary to prepare a project for its intended use, interest costs related to such project are expensed as incurred.
Cash interest
Cash interest is equal to interest expense calculated in accordance with GAAP plus capitalized interest, less amortization of loan fees and debt premiums (discounts). Refer to “Fixed-charge coverage ratio” in this section for a reconciliation of interest expense, the most directly comparable financial measure calculated and presented in accordance with GAAP, to cash interest.
Class A/A+ properties and AAA locations
Class A/A+ properties are properties clustered in AAA locations that provide innovative tenants with highly dynamic and collaborative environments that enhance their ability to successfully recruit and retain world-class talent and inspire productivity, efficiency, creativity, and success. Class A/A+ properties generally command higher annual rental rates than other classes of similar properties.
AAA locations are in close proximity to concentrations of specialized skills, knowledge, institutions, and related businesses. Such locations are generally characterized by high barriers to entry for new landlords, high barriers to exit for tenants, and a limited supply of available space.
Development, redevelopment, and pre-construction
A key component of our business model is our disciplined allocation of capital to the development and redevelopment of new Class A/A+ properties, and property enhancements identified during the underwriting of certain acquired properties, located in collaborative life science mega campuses in AAA innovation clusters. These projects are generally focused on providing high-quality, generic, and reusable spaces that meet the real estate requirements of a wide range of tenants. Upon completion, each value-creation project is expected to generate increases in rental income, net operating income, and cash flows. Our development and redevelopment projects are generally in locations that are highly desirable to high-quality entities, which we believe results in higher occupancy levels, longer lease terms, higher rental income, higher returns, and greater long-term asset value.
Development projects generally consist of the ground-up development of generic and reusable laboratory facilities. Redevelopment projects consist of the permanent change in use of acquired office, warehouse, or shell space into laboratory space. We generally will not commence new development projects for aboveground construction of new Class A/A+ laboratory space without first securing significant pre-leasing for such space, except when there is solid market demand for high-quality Class A/A+ properties.
Priority anticipated projects are those most likely to commence future ground-up development or first-time conversion from non-laboratory space to laboratory space prior to our other future projects, pending market conditions and leasing negotiations.
Pre-construction activities include entitlements, permitting, design, site work, and other activities preceding commencement of construction of aboveground building improvements. The advancement of pre-construction efforts is focused on reducing the time required to deliver projects to prospective tenants. These critical activities add significant value for future ground-up development and are required for the vertical construction of buildings. Ultimately, these projects will provide high-quality facilities and are expected to generate significant revenue and cash flows.
Development, redevelopment, and pre-construction spending also includes the following costs: (i) amounts to bring certain acquired properties up to market standard and/or other costs identified during the acquisition process (generally within two years of acquisition) and (ii) permanent conversion of space for highly flexible, move-in-ready laboratory space to foster the growth of promising early- and growth-stage life science companies.
Revenue-enhancing and repositioning capital expenditures represent spending to reposition or significantly change the use of a property, including through improvement in the asset quality from Class B to Class A/A+.
Non-revenue-enhancing capital expenditures represent costs required to maintain the current revenues of a stabilized property, including the associated costs for renewed and re-leased space.
Dividend payout ratio (common stock)
Dividend payout ratio (common stock) is the ratio of the absolute dollar amount of dividends on our common stock (shares of common stock outstanding on the respective record dates multiplied by the related dividend per share) to funds from operations attributable to Alexandria’s common stockholders – diluted, as adjusted.
Dividend yield
Dividend yield for the quarter represents the annualized quarter dividend divided by the closing common stock price at the end of the quarter.
Fixed-charge coverage ratio
Fixed-charge coverage ratio is a non-GAAP financial measure representing the ratio of Adjusted EBITDA to cash interest and fixed charges. We believe that this ratio is useful to investors as a supplemental measure of our ability to satisfy fixed financing obligations and preferred stock dividends. Cash interest is equal to interest expense calculated in accordance with GAAP plus capitalized interest, less amortization of loan fees and debt premiums (discounts).
The following table reconciles interest expense, the most directly comparable financial measure calculated and presented in accordance with GAAP, to cash interest and computes fixed-charge coverage ratio for the three months ended March 31, 2024 and 2023 (dollars in thousands):
| Three Months Ended March 31, | ||||||||||||||||||||||||||
| 2024 | 2023 | |||||||||||||||||||||||||
| Adjusted EBITDA | $ | 551,607 | $ | 484,221 | ||||||||||||||||||||||
| Interest expense | $ | 40,840 | $ | 13,754 | ||||||||||||||||||||||
| Capitalized interest | 81,840 | 87,070 | ||||||||||||||||||||||||
| Amortization of loan fees | (4,142) | (3,639) | ||||||||||||||||||||||||
| Amortization of debt discounts | (318) | (288) | ||||||||||||||||||||||||
| Cash interest and fixed charges | $ | 118,220 | $ | 96,897 | ||||||||||||||||||||||
| Fixed-charge coverage ratio: | ||||||||||||||||||||||||||
| – quarter annualized | 4.7x | 5.0x | ||||||||||||||||||||||||
| – trailing 12 months | 4.7x | 5.0x |
We are not able to forecast fourth quarter net income without unreasonable effort and therefore do not provide a reconciliation for fixed-charge coverage ratio on a forward-looking basis. This is due to the inherent difficulty of forecasting the timing and/or amount of items that depend on market conditions outside of our control, including the timing of dispositions, capital events, and financing decisions, as well as quarterly components such as gain on sales of real estate, unrealized gains or losses on non-real estate investments, impairment of real estate, and impairment of non-real estate investments. Our attempt to predict these amounts may produce significant but inaccurate estimates, which would be potentially misleading for our investors.
Gross assets
Gross assets are calculated as total assets plus accumulated depreciation as of March 31, 2024 and December 31, 2023 (in thousands):
| March 31, 2024 | December 31, 2023 | ||||||||||
| Total assets | $ | 37,699,046 | $ | 36,771,402 | |||||||
| Accumulated depreciation | 5,216,857 | 4,985,019 | |||||||||
| Gross assets | $ | 42,915,903 | $ | 41,756,421 | |||||||
Initial stabilized yield (unlevered)
Initial stabilized yield is calculated as the estimated amounts of net operating income at stabilization divided by our investment in the property. Our initial stabilized yield excludes the benefit of leverage. Our cash rents related to our value-creation projects are generally expected to increase over time due to contractual annual rent escalations. Our estimates for initial stabilized yields, initial stabilized yields (cash basis), and total costs at completion represent our initial estimates at the commencement of the project. We expect to update this information upon completion of the project, or sooner if there are significant changes to the expected project yields or costs.
-
Initial stabilized yield reflects rental income, including contractual rent escalations and any rent concessions over the term(s) of the lease(s), calculated on a straight-line basis.
-
Initial stabilized yield (cash basis) reflects cash rents at the stabilization date after initial rental concessions, if any, have elapsed and our total cash investment in the property.
Investment-grade or publicly traded large cap tenants
Investment-grade or publicly traded large cap tenants represent tenants that are investment-grade rated or publicly traded companies with an average daily market capitalization greater than $10 billion for the twelve months ended March 31, 2024, as reported by Bloomberg Professional Services. Credit ratings from Moody’s Investors Service and S&P Global Ratings reflect credit ratings of the tenant’s parent entity, and there can be no assurance that a tenant’s parent entity will satisfy the tenant’s lease obligation upon such tenant’s default. We monitor the credit quality and related material changes of our tenants. Material changes that cause a tenant’s market capitalization to decrease below $10 billion, which are not immediately reflected in the twelve-month average, may result in their exclusion from this measure.
Investments in real estate
The following table presents our value-creation pipeline of new Class A/A+ development and redevelopment projects, excluding properties held for sale, as a percentage of gross assets as of March 31, 2024:
| Percentage of Gross Assets | |||||||||||||||||||||||
| Under construction projects and one committed near-term project expected to commence construction in the next two years (63% leased/negotiating) | 9% | ||||||||||||||||||||||
| Income-producing/potential cash flows/covered land play(1) | 7% | ||||||||||||||||||||||
| Land | 4% | ||||||||||||||||||||||
(1)Includes projects with existing buildings that are generating or can generate operating cash flows. Also includes development rights associated with existing operating campuses. These projects aggregated 1.0% of annual rental revenue as of March 31, 2024 and are included in our industry mix chart as targeted for a future change in use. Refer to “High-quality and diverse client base” in Item 2 for additional information.
The square footage presented in the table below is classified as operating as of March 31, 2024. These lease expirations or vacant space at recently acquired properties represent future opportunities for which we have the intent, subject to market conditions and leasing, to commence first-time conversion from non-laboratory space to laboratory space, or to commence future ground-up development:
| Dev/Redev | RSF of Lease Expirations Targeted for Development and Redevelopment | |||||||||||||||||||||||||||||||
| Property/Submarket | 2024 | 2025 | Thereafter(1) | Total | ||||||||||||||||||||||||||||
| Committed near-term project: | ||||||||||||||||||||||||||||||||
| 4161 Campus Point Court/University Town Center | Dev | 159,884 | — | — | 159,884 | |||||||||||||||||||||||||||
| Priority anticipated projects: | ||||||||||||||||||||||||||||||||
| 311 Arsenal Street/Cambridge/Inner Suburbs | Redev | 148,393 | 25,312 | — | 173,705 | |||||||||||||||||||||||||||
| 269 East Grand Avenue/South San Francisco | Redev | 107,250 | — | — | 107,250 | |||||||||||||||||||||||||||
| 3301 Monte Villa Parkway/Bothell | Redev | — | 50,552 | — | 50,552 | |||||||||||||||||||||||||||
| 1020 Red River Street/Austin | Redev | — | 126,034 | — | 126,034 | |||||||||||||||||||||||||||
| 255,643 | 201,898 | — | 457,541 | |||||||||||||||||||||||||||||
| Future projects: | ||||||||||||||||||||||||||||||||
| 100 Edwin H. Land Boulevard/Cambridge | Dev | 104,500 | — | — | 104,500 | |||||||||||||||||||||||||||
| 446, 458, 500, and 550 Arsenal Street/Cambridge/Inner Suburbs | Dev | — | — | 376,698 | 376,698 | |||||||||||||||||||||||||||
| Other/Greater Boston | Redev | — | — | 167,549 | 167,549 | |||||||||||||||||||||||||||
| 1122 and 1150 El Camino Real/South San Francisco | Dev | — | — | 375,232 | 375,232 | |||||||||||||||||||||||||||
| 3875 Fabian Way/Greater Stanford | Dev | — | — | 228,000 | 228,000 | |||||||||||||||||||||||||||
| 2100, 2200, 2300, and 2400 Geng Road/Greater Stanford | Dev | 84,083 | — | 78,501 | 162,584 | |||||||||||||||||||||||||||
| 960 Industrial Road/Greater Stanford | Dev | — | — | 112,590 | 112,590 | |||||||||||||||||||||||||||
| 10975 and 10995 Torreyana Road/Torrey Pines | Dev | 84,829 | — | — | 84,829 | |||||||||||||||||||||||||||
| Campus Point by Alexandria/University Town Center | Dev | 335,308 | — | — | 335,308 | |||||||||||||||||||||||||||
| Sequence District by Alexandria/Sorrento Mesa | Dev/Redev | — | — | 686,290 | 686,290 | |||||||||||||||||||||||||||
| 830 4th Avenue South/SoDo | Dev | — | — | 42,380 | 42,380 | |||||||||||||||||||||||||||
| Other/Seattle | Dev | — | — | 77,376 | 77,376 | |||||||||||||||||||||||||||
| 100 Capitola Drive/Research Triangle | Dev | — | — | 34,527 | 34,527 | |||||||||||||||||||||||||||
| 1001 Trinity Street/Austin | Dev | — | 72,938 | — | 72,938 | |||||||||||||||||||||||||||
| Canada | Redev | — | — | 247,743 | 247,743 | |||||||||||||||||||||||||||
| 608,720 | 72,938 | 2,426,886 | 3,108,544 | |||||||||||||||||||||||||||||
| 1,024,247 | 274,836 | 2,426,886 | 3,725,969 |
(1)Includes vacant square footage as of March 31, 2024.
Joint venture financial information
We present components of balance sheet and operating results information related to our real estate joint ventures, which are not presented, or intended to be presented, in accordance with GAAP. We present the proportionate share of certain financial line items as follows: (i) for each real estate joint venture that we consolidate in our financial statements, which are controlled by us through contractual rights or majority voting rights, but of which we own less than 100%, we apply the noncontrolling interest economic ownership percentage to each financial item to arrive at the amount of such cumulative noncontrolling interest share of each component presented; and (ii) for each real estate joint venture that we do not control and do not consolidate, and are instead controlled jointly or by our joint venture partners through contractual rights or majority voting rights, we apply our economic ownership percentage to each financial item to arrive at our proportionate share of each component presented.
The components of balance sheet and operating results information related to our real estate joint ventures do not represent our legal claim to those items. For each entity that we do not wholly own, the joint venture agreement generally determines what equity holders can receive upon capital events, such as sales or refinancing, or in the event of a liquidation. Equity holders are normally entitled to their respective legal ownership of any residual cash from a joint venture only after all liabilities, priority distributions, and claims have been repaid or satisfied.
We believe that this information can help investors estimate the balance sheet and operating results information related to our partially owned entities. Presenting this information provides a perspective not immediately available from consolidated financial statements and one that can supplement an understanding of the joint venture assets, liabilities, revenues, and expenses included in our consolidated results.
The components of balance sheet and operating results information related to our real estate joint ventures are limited as an analytical tool as the overall economic ownership interest does not represent our legal claim to each of our joint ventures’ assets, liabilities, or results of operations. In addition, joint venture financial information may include financial information related to the unconsolidated real estate joint ventures that we do not control. We believe that in order to facilitate for investors a clear understanding of our operating results and our total assets and liabilities, joint venture financial information should be examined in conjunction with our consolidated statements of operations and balance sheets. Joint venture financial information should not be considered an alternative to our consolidated financial statements, which are presented and prepared in accordance with GAAP.
Mega campus
Mega campuses are cluster campuses that consist of approximately 1 million RSF or more, including operating, active development/redevelopment, and land RSF less operating RSF expected to be demolished. The following table reconciles our annual rental revenue and value-creation pipeline RSF as of March 31, 2024 (dollars in thousands):
| Annual Rental Revenue | Value-Creation Pipeline RSF | |||||||||||||
| Mega campus | $ | 1,637,733 | 21,958,936 | |||||||||||
| Non-mega campus | 575,237 | 9,952,556 | ||||||||||||
| Total | $ | 2,212,970 | 31,911,492 | |||||||||||
| Mega campus as a percentage of annual rental revenue and of total value-creation pipeline RSF | 74 | % | 69 | % |
Net cash provided by operating activities after dividends
Net cash provided by operating activities after dividends includes the deduction for distributions to noncontrolling interests. For purposes of this calculation, changes in operating assets and liabilities are excluded as they represent timing differences.
Net debt and preferred stock to Adjusted EBITDA
Net debt and preferred stock to Adjusted EBITDA is a non-GAAP financial measure that we believe is useful to investors as a supplemental measure of evaluating our balance sheet leverage. Net debt and preferred stock is equal to the sum of total consolidated debt less cash, cash equivalents, and restricted cash, plus preferred stock outstanding as of the end of the period. Refer to “Adjusted EBITDA and Adjusted EBITDA margin” within this section for further information on the calculation of Adjusted EBITDA.
We are not able to forecast fourth quarter net income without unreasonable effort and therefore do not provide a reconciliation for net debt and preferred stock to Adjusted EBITDA on a forward-looking basis. This is due to the inherent difficulty of forecasting the timing and/or amount of items that depend on market conditions outside of our control, including the timing of dispositions, capital events, and financing decisions, as well as quarterly components such as gain on sales of real estate, unrealized gains or losses on non-real estate investments, impairment of real estate, and impairment of non-real estate investments. Our attempt to predict these amounts may produce significant but inaccurate estimates, which would be potentially misleading for our investors.
The following table reconciles debt to net debt and preferred stock and computes the ratio to Adjusted EBITDA as of March 31, 2024 and December 31, 2023 (dollars in thousands):
| March 31, 2024 | December 31, 2023 | ||||||||||
| Secured notes payable | $ | 130,050 | $ | 119,662 | |||||||
| Unsecured senior notes payable | 12,087,113 | 11,096,028 | |||||||||
| Unsecured senior line of credit and commercial paper | — | 99,952 | |||||||||
| Unamortized deferred financing costs | 84,198 | 76,329 | |||||||||
| Cash and cash equivalents | (722,176) | (618,190) | |||||||||
| Restricted cash | (9,519) | (42,581) | |||||||||
| Preferred stock | — | — | |||||||||
| Net debt and preferred stock | $ | 11,569,666 | $ | 10,731,200 | |||||||
| Adjusted EBITDA: | |||||||||||
| – quarter annualized | $ | 2,206,428 | $ | 2,094,988 | |||||||
| – trailing 12 months | $ | 2,064,904 | $ | 1,997,518 | |||||||
| Net debt and preferred stock to Adjusted EBITDA: | |||||||||||
| – quarter annualized | 5.2 | x | 5.1 | x | |||||||
| – trailing 12 months | 5.6 | x | 5.4 | x |
Net operating income, net operating income (cash basis), and operating margin
The following table reconciles net income to net operating income and net operating income (cash basis) and computes operating margin for the three months ended March 31, 2024 and 2023 (dollars in thousands):
| Three Months Ended March 31, | ||||||||||||||||||||||||||
| 2024 | 2023 | |||||||||||||||||||||||||
| Net income | $ | 219,176 | $ | 121,693 | ||||||||||||||||||||||
| Equity in earnings of unconsolidated real estate joint ventures | (155) | (194) | ||||||||||||||||||||||||
| General and administrative expenses | 47,055 | 48,196 | ||||||||||||||||||||||||
| Interest expense | 40,840 | 13,754 | ||||||||||||||||||||||||
| Depreciation and amortization | 287,554 | 265,302 | ||||||||||||||||||||||||
| Gain on sales of real estate | (392) | — | ||||||||||||||||||||||||
| Investment (income) loss | (43,284) | 45,111 | ||||||||||||||||||||||||
| Net operating income | 550,794 | 493,862 | ||||||||||||||||||||||||
| Straight-line rent revenue | (48,251) | (33,191) | ||||||||||||||||||||||||
| Amortization of acquired below-market leases | (30,340) | (21,636) | ||||||||||||||||||||||||
| Net operating income (cash basis) | $ | 472,203 | $ | 439,035 | ||||||||||||||||||||||
| Net operating income (cash basis) – annualized | $ | 1,888,812 | $ | 1,756,140 | ||||||||||||||||||||||
| Net operating income (from above) | $ | 550,794 | $ | 493,862 | ||||||||||||||||||||||
| Total revenues | $ | 769,108 | $ | 700,795 | ||||||||||||||||||||||
| Operating margin | 72% | 70% |
Net operating income is a non-GAAP financial measure calculated as net income (loss), the most directly comparable financial measure calculated and presented in accordance with GAAP, excluding equity in the earnings of our unconsolidated real estate joint ventures, general and administrative expenses, interest expense, depreciation and amortization, impairments of real estate, gains or losses on early extinguishment of debt, gains or losses on sales of real estate, and investment income or loss. We believe net operating income provides useful information to investors regarding our financial condition and results of operations because it primarily reflects those income and expense items that are incurred at the property level. Therefore, we believe net operating income is a useful measure for investors to evaluate the operating performance of our consolidated real estate assets. Net operating income on a cash basis is net operating income adjusted to exclude the effect of straight-line rent and amortization of acquired above- and below-market lease revenue adjustments required by GAAP. We believe that net operating income on a cash basis is helpful to investors as an additional measure of operating performance because it eliminates straight-line rent revenue and the amortization of acquired above- and below-market leases.
Furthermore, we believe net operating income is useful to investors as a performance measure of our consolidated properties because, when compared across periods, net operating income reflects trends in occupancy rates, rental rates, and operating costs, which provide a perspective not immediately apparent from net income or loss. Net operating income can be used to measure the initial stabilized yields of our properties by calculating net operating income generated by a property divided by our investment in the property. Net operating income excludes certain components from net income in order to provide results that are more closely related to the results of operations of our properties. For example, interest expense is not necessarily linked to the operating performance of a real estate asset and is often incurred at the corporate level rather than at the property level. In addition, depreciation and amortization, because of historical cost accounting and useful life estimates, may distort comparability of operating performance at the property level. Impairments of real estate have been excluded in deriving net operating income because we do not consider impairments of real estate to be property-level operating expenses. Impairments of real estate relate to changes in the values of our assets and do not reflect the current operating performance with respect to related revenues or expenses. Our impairments of real estate represent the write-down in the value of the assets to the estimated fair value less cost to sell. These impairments result from investing decisions or a deterioration in market conditions. We also exclude realized and unrealized investment gain or loss, which results from investment decisions that occur at the corporate level related to non-real estate investments in publicly traded companies and certain privately held entities. Therefore, we do not consider these activities to be an indication of operating performance of our real estate assets at the property level. Our calculation of net operating income also excludes charges incurred from changes in certain financing decisions, such as losses on early extinguishment of debt, as these charges often relate to corporate strategy. Property operating expenses included in determining net operating income primarily consist of costs that are related to our operating properties, such as utilities, repairs, and maintenance; rental expense related to ground leases; contracted services, such as janitorial, engineering, and landscaping; property taxes and insurance; and property-level salaries. General and administrative expenses consist primarily of accounting and corporate compensation, corporate insurance, professional fees, rent, and supplies that are incurred as part of corporate office management. We calculate operating margin as net operating income divided by total revenues.
We believe that in order to facilitate for investors a clear understanding of our operating results, net operating income should be examined in conjunction with net income or loss as presented in our consolidated statements of operations. Net operating income should not be considered as an alternative to net income or loss as an indication of our performance, nor as an alternative to cash flows as a measure of our liquidity or our ability to make distributions.
Operating statistics
We present certain operating statistics related to our properties, including number of properties, RSF, occupancy percentage, leasing activity, and contractual lease expirations as of the end of the period. We believe these measures are useful to investors because they facilitate an understanding of certain trends for our properties. We compute the number of properties, RSF, occupancy percentage, leasing activity, and contractual lease expirations at 100% for all properties in which we have an investment, including properties owned by our consolidated and unconsolidated real estate joint ventures. For operating metrics based on annual rental revenue, refer to “Annual rental revenue” within this section.
Same property comparisons
As a result of changes within our total property portfolio during the comparative periods presented, including changes from assets acquired or sold, properties placed into development or redevelopment, and development or redevelopment properties recently placed into service, the consolidated total income from rentals, as well as rental operating expenses in our operating results, can show significant changes from period to period. In order to supplement an evaluation of our results of operations over a given quarterly or annual period, we analyze the operating performance for all consolidated properties that were fully operating for the entirety of the comparative periods presented, referred to as same properties. We separately present quarterly and year-to-date same property results to align with the interim financial information required by the SEC in our management’s discussion and analysis of our financial condition and results of operations. These same properties are analyzed separately from properties acquired subsequent to the first day in the earliest comparable quarterly or year-to-date period presented, properties that underwent development or redevelopment at any time during the comparative periods, unconsolidated real estate joint ventures, properties classified as held for sale, and corporate entities (legal entities performing general and administrative functions), which are excluded from same property results. Additionally, termination fees, if any, are excluded from the results of same properties. Refer to “Same properties” in Item 2 for additional information.
Stabilized occupancy date
The stabilized occupancy date represents the estimated date on which the project is expected to reach occupancy of 95% or greater.
Tenant recoveries
Tenant recoveries represent revenues comprising reimbursement of real estate taxes, insurance, utilities, repairs and maintenance, common area expenses, and other operating expenses and earned in the period during which the applicable expenses are incurred and the tenant’s obligation to reimburse us arises.
We classify rental revenues and tenant recoveries generated through the leasing of real estate assets within revenues in income from rentals in our consolidated statements of operations. We provide investors with a separate presentation of rental revenues and tenant recoveries in “Comparison of results for the three months ended March 31, 2024 to the three months ended March 31, 2023” in Item 2 because we believe it promotes investors’ understanding of our operating results. We believe that the presentation of tenant recoveries is useful to investors as a supplemental measure of our ability to recover operating expenses under our triple net leases, including recoveries of utilities, repairs and maintenance, insurance, property taxes, common area expenses, and other operating expenses, and of our ability to mitigate the effect to net income for any significant variability to components of our operating expenses.
The following table reconciles income from rentals to tenant recoveries for the three months ended March 31, 2024 and 2023 (in thousands):
| Three Months Ended March 31, | ||||||||||||||||||||||||||
| 2024 | 2023 | |||||||||||||||||||||||||
| Income from rentals | $ | 755,551 | $ | 687,949 | ||||||||||||||||||||||
| Rental revenues | (581,400) | (518,302) | ||||||||||||||||||||||||
| Tenant recoveries | $ | 174,151 | $ | 169,647 |
Total equity capitalization
Total equity capitalization is equal to the outstanding shares of common stock multiplied by the closing price on the last trading day at the end of each period presented.
Total market capitalization
Total market capitalization is equal to the sum of total equity capitalization and total debt.
Unencumbered net operating income as a percentage of total net operating income
Unencumbered net operating income as a percentage of total net operating income is a non-GAAP financial measure that we believe is useful to investors as a performance measure of the results of operations of our unencumbered real estate assets as it reflects those income and expense items that are incurred at the unencumbered property level. Unencumbered net operating income is derived from assets classified in continuing operations, which are not subject to any mortgage, deed of trust, lien, or other security interest, as of the period for which income is presented.
The following table summarizes unencumbered net operating income as a percentage of total net operating income for the three months ended March 31, 2024 and 2023 (dollars in thousands):
| Three Months Ended March 31, | |||||||||||||||||||||||
| 2024 | 2023 | ||||||||||||||||||||||
| Unencumbered net operating income | $ | 546,830 | $ | 492,860 | |||||||||||||||||||
| Encumbered net operating income | 3,964 | 1,002 | |||||||||||||||||||||
| Total net operating income | $ | 550,794 | $ | 493,862 | |||||||||||||||||||
| Unencumbered net operating income as a percentage of total net operating income | 99.3% | 99.8% |
Weighted-average shares of common stock outstanding – diluted
From time to time, we enter into capital market transactions, including forward equity sales agreements (“Forward Agreements”), to fund acquisitions, to fund construction of our highly leased development and redevelopment projects, and for general working capital purposes. We are required to consider the potential dilutive effect of our Forward Agreements under the treasury stock method while the Forward Agreements are outstanding. As of March 31, 2024, we had no Forward Agreements outstanding. Refer to Note 13 – “Stockholders’ equity” to our unaudited consolidated financial statements in Item 1 for additional information.
The weighted-average shares of common stock outstanding used in calculating EPS – diluted, funds from operations per share – diluted, and funds from operations per share – diluted, as adjusted, for the three months ended March 31, 2024 and 2023 are calculated as follows. Also shown are the weighted-average unvested shares associated with restricted stock awards used in calculating the amounts allocable to unvested stock award holders for each of the respective periods presented below (in thousands):
| Three Months Ended March 31, | |||||||||||||||||||||||
| 2024 | 2023 | ||||||||||||||||||||||
| Basic shares for earnings per share | 171,949 | 170,784 | |||||||||||||||||||||
| Forward Agreements | — | — | |||||||||||||||||||||
| Diluted shares for earnings per share | 171,949 | 170,784 | |||||||||||||||||||||
| Basic shares for funds from operations per share and funds from operations per share, as adjusted | 171,949 | 170,784 | |||||||||||||||||||||
| Forward Agreements | — | — | |||||||||||||||||||||
| Diluted shares for funds from operations per share and funds from operations per share, as adjusted | 171,949 | 170,784 | |||||||||||||||||||||
| Weighted-average unvested restricted shares used in calculating the allocations of net income, funds from operations, and funds from operations, as adjusted | 2,987 | 2,277 |
Previous: Item 1. FINANCIAL STATEMENTS (UNAUDITED) · Next: Item 3. QUANTITATIVE AND QUALITATIVE DISCLOSURES ABOUT MARKET RISK