 filings.tools
Item 2. Management’s Discussion and Analysis of Financial Condition and Results of Operations
343K characters. Original on sec.gov · Markdown
Item 2. Management’s Discussion and Analysis of Financial Condition and Results of Operations
Ares Management Corporation is a Delaware corporation. Unless the context otherwise requires, references to “Ares,” “we,” “us,” “our,” and the “Company” are intended to mean the business and operations of Ares Management Corporation and its consolidated subsidiaries. The following discussion analyzes the financial condition and results of operations of the Company. “Consolidated Funds” refers collectively to certain Ares funds, co-investment entities, CLOs and special purpose acquisition companies that are required under generally accepted accounting principles in the United States (“GAAP”) to be consolidated in our unaudited condensed consolidated financial statements included in this Quarterly Report on Form 10-Q. Additional terms used by the Company are defined in the Glossary and throughout the Management's Discussion and Analysis in this Quarterly Report on Form 10-Q.
The following discussion and analysis should be read in conjunction with the unaudited condensed consolidated financial statements of Ares Management Corporation and the related notes included in this Quarterly Report on Form 10-Q and the audited financial statements and the related notes included in the 2021 Annual Report on Form 10-K of Ares Management Corporation.
Amounts and percentages presented throughout our discussion and analysis of financial condition and results of operations may reflect rounded results in thousands (unless otherwise indicated) and consequently, totals may not appear to sum. In addition, illustrative charts may not be presented at scale.
Trends Affecting Our Business
We believe that our disciplined investment philosophy across our distinct but complementary investment groups contributes to the stability of our performance throughout market cycles. For the three months ended June 30, 2022, approximately 95% of our management fees were derived from perpetual capital vehicles and other long-dated funds. Our funds have a stable base of committed capital enabling us to invest in assets with a long-term focus over different points in a market cycle and to take advantage of market volatility. However, our results of operations, including the fair value of our AUM, are affected by a variety of factors, particularly in the United States and Western Europe, including conditions in the global financial markets and the economic and political environments.
Credit markets continued to be under pressure during the first half of 2022 amid a risk-off environment and sustained macro uncertainty due to record-high inflation, tighter financial conditions and growing recession risk. Central banks have remained focused on restoring price stability by raising interest rates and have signaled that growth may be hindered until inflation comes under control. Specifically, the ICE BAML High Yield Master II Index, a high yield bond index, returned a negative 10.0% in the second quarter of 2022 and a negative 14.0% in the year-to-date period, as persistent inflation and shifts in monetary policy led investors to position for a more meaningful impact on growth. Meanwhile, the Credit Suisse Leveraged Loan Index (“CSLLI”), a leveraged loan index, returned a negative 4.4% both in the quarter and the year-to-date period, as mounting concerns regarding economic growth and large retail outflows weighed on asset class performance.
In Europe, high yield bond and leveraged loan spreads widened alongside their U.S. counterparts amid concerns regarding deteriorating fundamentals and slowing growth. Further, the Russia-Ukraine crisis, rising energy costs and the threat of a gas embargo weighed on investor sentiment. As a result, the ICE BAML European Currency High Yield Index returned a negative 10.7%, in the quarter and a negative 14.9% in the year-to-date period, while the Credit Suisse Western European Leveraged Loan Index returned a negative 6.3% in quarter and a negative 6.8% in the year-to-date period.
The global equity markets continue to experience heightened volatility amid tightening monetary policies, geopolitical tension, global inflation concerns and prolonged supply chain issues. The S&P 500 Index returned a negative of 16.1% in the quarter and a negative 20.0% in the year-to-date period, while the MSCI All Country World Index ex USA returned a negative 13.7% in the quarter and a negative 18.4% in the year-to-date period.
Many of the factors that characterized the private equity market in the first quarter of 2022, including economic and geopolitical stance, continued into the second quarter with equal or greater momentum. Looking ahead, we expect the heightened market volatility to persist, at least in the near-term. Continued asset selectivity, portfolio construction, portfolio diversification and a differentiated view to drive value creation are instrumental in delivering attractive returns to investors. Recent trends have had a more pronounced impact on certain industries, including by causing downturns in the energy, hospitality, travel, retail, and restaurant industries, which are industries in which some of our funds have made investments. As of June 30, 2022, approximately 2% of our total AUM was invested in the energy sector (including oil and gas exploration and midstream investments) and approximately 2% in the retail sector.
Following robust pricing and transaction volume throughout 2021, the first and second quarters of 2022 saw heightened volatility in the commercial real estate markets. Given the rise in interest rates, property valuations are also starting to show early signs of the cycle turning, with cap rate compressions waning and in some cases yields widening. However, we believe some of these market trends will be offset by the continued strong fundamentals in certain sectors. The FTSE EPRA/NAREIT Developed Europe and the FTSE NAREIT All Equity REITs indices returned a negative 23.7% and a negative 14.7%, respectively, for the quarter and returned a negative 27.5% and a negative 18.0%, respectively, for the year-to-date period.
We believe our portfolios across all strategies are well positioned for a rising interest rate environment. On a market value basis, approximately 91% of our debt assets and 58% of our total assets were floating rate instruments as of June 30, 2022.
Managing Business Performance
Operating Metrics
We measure our business performance using certain operating metrics that are common to the alternative asset management industry, which are discussed below.
Assets Under Management
AUM refers to the assets we manage and is viewed as a metric to measure our investment and fundraising performance as it reflects assets generally at fair value plus available uncalled capital.
The tables below present rollforwards of our total AUM by segment ($ in millions):
| Credit Group | Private Equity Group | Real Assets Group | Secondary Solutions Group | Strategic Initiatives | Total AUM | |||||||||||||||||||||||||||||||||
| Balance at 3/31/2022 | $ | 196,923 | $ | 33,565 | $ | 58,527 | $ | 23,468 | $ | 12,536 | $ | 325,019 | ||||||||||||||||||||||||||
| Net new par/equity commitments | 5,374 | 230 | 3,365 | 865 | 432 | 10,266 | ||||||||||||||||||||||||||||||||
| Net new debt commitments | 4,183 | — | 1,444 | — | — | 5,627 | ||||||||||||||||||||||||||||||||
| Capital reductions | (58) | (202) | (34) | — | — | (294) | ||||||||||||||||||||||||||||||||
| Distributions | (833) | (138) | (887) | (551) | (172) | (2,581) | ||||||||||||||||||||||||||||||||
| Redemptions | (394) | — | (83) | — | — | (477) | ||||||||||||||||||||||||||||||||
| Change in fund value | (3,284) | (43) | 245 | 110 | (275) | (3,247) | ||||||||||||||||||||||||||||||||
| Balance at 6/30/2022 | $ | 201,911 | $ | 33,412 | $ | 62,577 | $ | 23,892 | $ | 12,521 | $ | 334,313 | ||||||||||||||||||||||||||
| Credit Group | Private Equity Group | Real Assets Group | Secondary Solutions Group | Strategic Initiatives | Total AUM | |||||||||||||||||||||||||||||||||
| Balance at 3/31/2021 | $ | 151,116 | $ | 25,373 | $ | 20,775 | $ | — | $ | 9,894 | $ | 207,158 | ||||||||||||||||||||||||||
| Acquisitions | — | — | — | 19,513 | — | 19,513 | ||||||||||||||||||||||||||||||||
| Net new par/equity commitments | 11,430 | 72 | 2,206 | 100 | 480 | 14,288 | ||||||||||||||||||||||||||||||||
| Net new debt commitments | 5,420 | — | 525 | — | 29 | 5,974 | ||||||||||||||||||||||||||||||||
| Capital reductions | (1,565) | (2) | — | — | — | (1,567) | ||||||||||||||||||||||||||||||||
| Distributions | (820) | (1,113) | (774) | (125) | (250) | (3,082) | ||||||||||||||||||||||||||||||||
| Redemptions | (438) | — | (7) | — | — | (445) | ||||||||||||||||||||||||||||||||
| Change in fund value | 2,444 | 2,580 | 822 | (12) | 213 | 6,047 | ||||||||||||||||||||||||||||||||
| Balance at 6/30/2021 | $ | 167,587 | $ | 26,910 | $ | 23,547 | $ | 19,476 | $ | 10,366 | $ | 247,886 | ||||||||||||||||||||||||||
| Credit Group | Private Equity Group | Real Assets Group | Secondary Solutions Group | Strategic Initiatives | Total AUM | |||||||||||||||||||||||||||||||||
| Balance at 12/31/2021 | $ | 192,710 | $ | 33,404 | $ | 45,919 | $ | 22,119 | $ | 11,623 | $ | 305,775 | ||||||||||||||||||||||||||
| Acquisitions | — | — | 8,184 | 199 | — | 8,383 | ||||||||||||||||||||||||||||||||
| Net new par/equity commitments | 9,532 | 800 | 6,423 | 1,945 | 1,617 | 20,317 | ||||||||||||||||||||||||||||||||
| Net new debt commitments | 6,523 | — | 2,549 | — | — | 9,072 | ||||||||||||||||||||||||||||||||
| Capital reductions | (455) | (204) | (297) | — | (5) | (961) | ||||||||||||||||||||||||||||||||
| Distributions | (1,835) | (521) | (2,015) | (1,126) | (326) | (5,823) | ||||||||||||||||||||||||||||||||
| Redemptions | (804) | — | (219) | — | — | (1,023) | ||||||||||||||||||||||||||||||||
| Change in fund value | (3,760) | (67) | 2,033 | 755 | (388) | (1,427) | ||||||||||||||||||||||||||||||||
| Balance at 6/30/2022 | $ | 201,911 | $ | 33,412 | $ | 62,577 | $ | 23,892 | $ | 12,521 | $ | 334,313 | ||||||||||||||||||||||||||
| Credit Group | Private Equity Group | Real Assets Group | Secondary Solutions Group | Strategic Initiatives | Total AUM | |||||||||||||||||||||||||||||||||
| Balance at 12/31/2020 | $ | 145,472 | $ | 23,954 | $ | 18,293 | $ | — | $ | 9,261 | $ | 196,980 | ||||||||||||||||||||||||||
| Acquisitions | — | — | — | 19,513 | — | 19,513 | ||||||||||||||||||||||||||||||||
| Net new par/equity commitments | 15,948 | 51 | 2,937 | 100 | 1,180 | 20,216 | ||||||||||||||||||||||||||||||||
| Net new debt commitments | 7,963 | — | 2,405 | — | 29 | 10,397 | ||||||||||||||||||||||||||||||||
| Capital reductions | (2,110) | (5) | (232) | — | — | (2,347) | ||||||||||||||||||||||||||||||||
| Distributions | (1,560) | (1,695) | (999) | (125) | (380) | (4,759) | ||||||||||||||||||||||||||||||||
| Redemptions | (975) | — | (7) | — | — | (982) | ||||||||||||||||||||||||||||||||
| Change in fund value | 2,849 | 4,605 | 1,150 | (12) | 276 | 8,868 | ||||||||||||||||||||||||||||||||
| Balance at 6/30/2021 | $ | 167,587 | $ | 26,910 | $ | 23,547 | $ | 19,476 | $ | 10,366 | $ | 247,886 | ||||||||||||||||||||||||||
The components of our AUM are presented below as of ($ in billions):
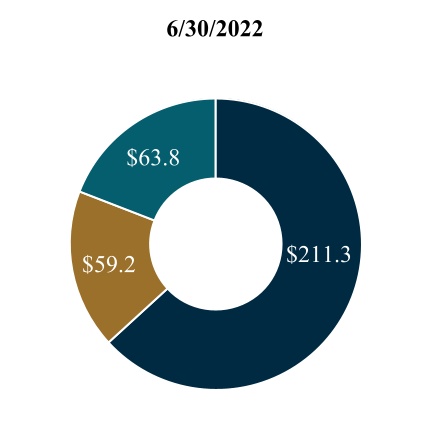
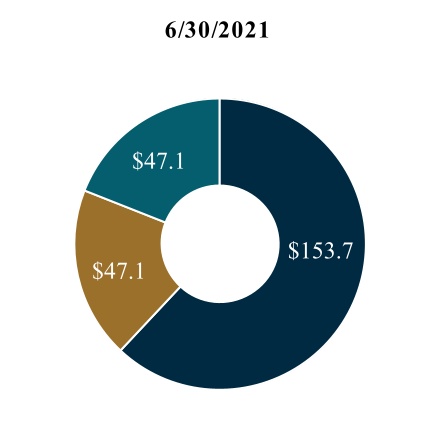
| AUM: $334.3 | AUM: $247.9 |
| FPAUM | AUM not yet paying fees | Non-fee paying(1) |
(1) Includes $12.4 billion and $8.5 billion of AUM of funds from which we indirectly earn management fees as of June 30, 2022 and 2021, respectively and includes $3.4 billion and $2.8 billion of non-fee paying AUM based on our general partner commitment as of June 30, 2022 and 2021, respectively.
Please refer to “— Results of Operations by Segment” for a more detailed presentation of AUM by segment for each of the periods presented.
Fee Paying Assets Under Management
FPAUM refers to AUM from which we directly earn management fees and is equal to the sum of all the individual fee bases of our funds that directly contribute to our management fees.
The tables below present rollforwards of our total FPAUM by segment ($ in millions):
| Credit Group | Private Equity Group | Real Assets Group | Secondary Solutions Group | Strategic Initiatives | Total | |||||||||||||||||||||||||||||||||
| Balance at 3/31/2022 | $ | 121,436 | $ | 16,141 | $ | 36,127 | $ | 18,070 | $ | 7,272 | $ | 199,046 | ||||||||||||||||||||||||||
| Commitments | 3,967 | — | 2,077 | 811 | 416 | 7,271 | ||||||||||||||||||||||||||||||||
| Subscriptions/deployment/increase in leverage | 8,413 | 2,099 | 1,522 | 251 | 535 | 12,820 | ||||||||||||||||||||||||||||||||
| Capital reductions | (192) | — | (90) | — | (223) | (505) | ||||||||||||||||||||||||||||||||
| Distributions | (853) | (530) | (370) | (388) | (326) | (2,467) | ||||||||||||||||||||||||||||||||
| Redemptions | (476) | — | (91) | — | — | (567) | ||||||||||||||||||||||||||||||||
| Change in fund value | (2,572) | (3) | 56 | 179 | (336) | (2,676) | ||||||||||||||||||||||||||||||||
| Change in fee basis | — | (16) | — | (1,369) | (246) | (1,631) | ||||||||||||||||||||||||||||||||
| Balance at 6/30/2022 | $ | 129,723 | $ | 17,691 | $ | 39,231 | $ | 17,554 | $ | 7,092 | $ | 211,291 | ||||||||||||||||||||||||||
| Credit Group | Private Equity Group | Real Assets Group | Secondary Solutions Group | Strategic Initiatives | Total | |||||||||||||||||||||||||||||||||
| Balance at 3/31/2021 | $ | 91,615 | $ | 14,848 | $ | 14,499 | $ | — | $ | 6,626 | $ | 127,588 | ||||||||||||||||||||||||||
| Acquisitions | — | — | — | 16,839 | — | 16,839 | ||||||||||||||||||||||||||||||||
| Commitments(1) | 2,255 | 72 | 1,335 | 100 | (68) | 3,694 | ||||||||||||||||||||||||||||||||
| Subscriptions/deployment/increase in leverage | 6,542 | 674 | 387 | 2 | 585 | 8,190 | ||||||||||||||||||||||||||||||||
| Capital reductions | (448) | — | — | — | (179) | (627) | ||||||||||||||||||||||||||||||||
| Distributions | (990) | (568) | (435) | — | (421) | (2,414) | ||||||||||||||||||||||||||||||||
| Redemptions | (353) | — | (7) | — | — | (360) | ||||||||||||||||||||||||||||||||
| Change in fund value | 967 | 1 | 70 | (2) | 78 | 1,114 | ||||||||||||||||||||||||||||||||
| Change in fee basis | — | (20) | (307) | (12) | — | (339) | ||||||||||||||||||||||||||||||||
| Balance at 6/30/2021 | $ | 99,588 | $ | 15,007 | $ | 15,542 | $ | 16,927 | $ | 6,621 | $ | 153,685 | ||||||||||||||||||||||||||
| Credit Group | Private Equity Group | Real Assets Group | Secondary Solutions Group | Strategic Initiatives | Total | |||||||||||||||||||||||||||||||||
| Balance at 12/31/2021 | $ | 117,390 | $ | 16,689 | $ | 28,615 | $ | 18,364 | $ | 6,787 | $ | 187,845 | ||||||||||||||||||||||||||
| Acquisitions | — | — | 4,855 | 131 | — | 4,986 | ||||||||||||||||||||||||||||||||
| Commitments | 6,217 | — | 4,261 | 1,508 | 1,880 | 13,866 | ||||||||||||||||||||||||||||||||
| Subscriptions/deployment/increase in leverage | 15,332 | 2,213 | 2,432 | 320 | 990 | 21,287 | ||||||||||||||||||||||||||||||||
| Capital reductions | (2,778) | — | (91) | — | (233) | (3,102) | ||||||||||||||||||||||||||||||||
| Distributions | (2,553) | (975) | (1,261) | (861) | (583) | (6,233) | ||||||||||||||||||||||||||||||||
| Redemptions | (872) | — | (229) | — | — | (1,101) | ||||||||||||||||||||||||||||||||
| Change in fund value | (3,013) | (2) | 1,476 | 918 | (668) | (1,289) | ||||||||||||||||||||||||||||||||
| Change in fee basis | — | (234) | (827) | (2,826) | (1,081) | (4,968) | ||||||||||||||||||||||||||||||||
| Balance at 6/30/2022 | $ | 129,723 | $ | 17,691 | $ | 39,231 | $ | 17,554 | $ | 7,092 | $ | 211,291 | ||||||||||||||||||||||||||
| Credit Group | Private Equity Group | Real Assets Group | Secondary Solutions Group | Strategic Initiatives | Total | |||||||||||||||||||||||||||||||||
| Balance at 12/31/2020 | $ | 88,017 | $ | 17,493 | $ | 13,931 | $ | — | $ | 6,596 | $ | 126,037 | ||||||||||||||||||||||||||
| Acquisitions | — | — | — | 16,839 | — | 16,839 | ||||||||||||||||||||||||||||||||
| Commitments(1) | 3,842 | 151 | 1,830 | 100 | (298) | 5,625 | ||||||||||||||||||||||||||||||||
| Subscriptions/deployment/increase in leverage | 11,082 | 1,266 | 724 | 2 | 1,123 | 14,197 | ||||||||||||||||||||||||||||||||
| Capital reductions | (1,284) | — | (32) | — | (180) | (1,496) | ||||||||||||||||||||||||||||||||
| Distributions | (2,314) | (1,145) | (575) | — | (677) | (4,711) | ||||||||||||||||||||||||||||||||
| Redemptions | (1,002) | — | (7) | — | — | (1,009) | ||||||||||||||||||||||||||||||||
| Change in fund value | 1,247 | — | (22) | (2) | 57 | 1,280 | ||||||||||||||||||||||||||||||||
| Change in fee basis | — | (2,758) | (307) | (12) | — | (3,077) | ||||||||||||||||||||||||||||||||
| Balance at 6/30/2021 | $ | 99,588 | $ | 15,007 | $ | 15,542 | $ | 16,927 | $ | 6,621 | $ | 153,685 | ||||||||||||||||||||||||||
| (1) Reallocation of capital among the segments may occur for pools of capital with investment mandates in more than one investment strategy. This reallocation activity is presented within net new par/equity commitments and may result in balances presented to be negative. | ||||||||||||||||||||||||||||||||||||||
The charts below present FPAUM by its fee basis ($ in billions):
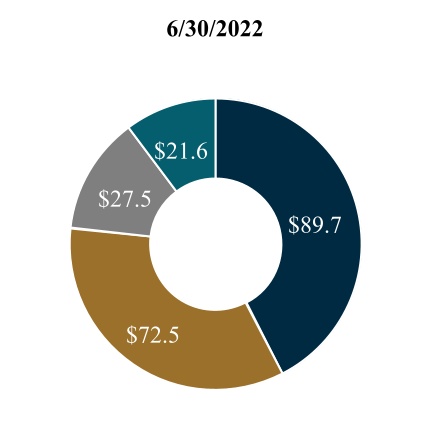
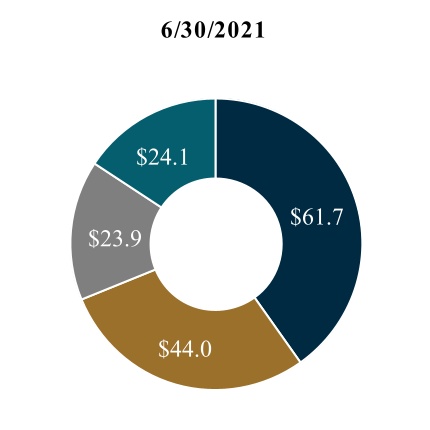
| FPAUM: $211.3 | FPAUM: $153.7 |
| Invested capital/other(1) | Market value(2) | Collateral balances (at par) | Capital commitments |
(1)Other consists of ACRE's FPAUM, which is based on ACRE’s stockholders’ equity.
(2)Includes $54.0 billion and $27.9 billion from funds that primarily invest in illiquid strategies as of June 30, 2022 and 2021, respectively. The underlying investments held in these funds are generally subject to less market volatility than investments held in liquid strategies.
Please refer to “— Results of Operations by Segment” for detailed information by segment of the activity affecting total FPAUM for each of the periods presented.
Incentive Eligible Assets Under Management, Incentive Generating Assets Under Management and Available Capital
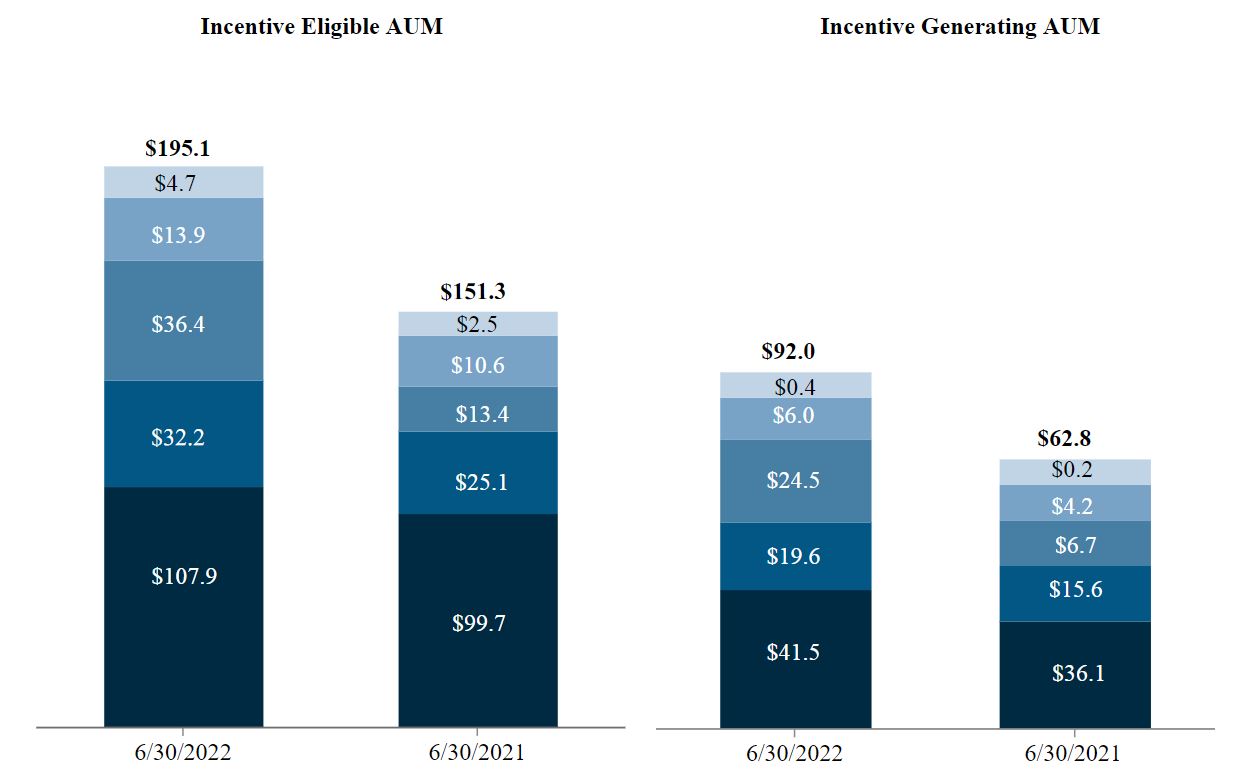
IEAUM generally represents the NAV plus uncalled equity or total assets plus uncalled debt, as applicable, of our funds from which we are entitled to receive carried interest and incentive fees, excluding capital committed by us and our professionals (from which we do not earn carried interest and incentive fees). With respect to ARCC's AUM, only ARCC Part II Fees may be generated from IEAUM.
IGAUM generally represents the AUM of our funds that are currently generating carried interest and incentive fees on a realized or unrealized basis. It represents the basis on which we are entitled to receive carried interest and incentive fees. The basis is typically the NAV or total assets of the fund, excluding amounts on which we do not earn carried interest and incentive fees, such as capital committed by us and our professionals. ARCC is only included in IGAUM when ARCC Part II Fees are being generated.
The charts below present our IEAUM and IGAUM by segment ($ in billions):
| Credit | Private Equity | Real Assets | Secondary Solutions | Strategic Initiatives |
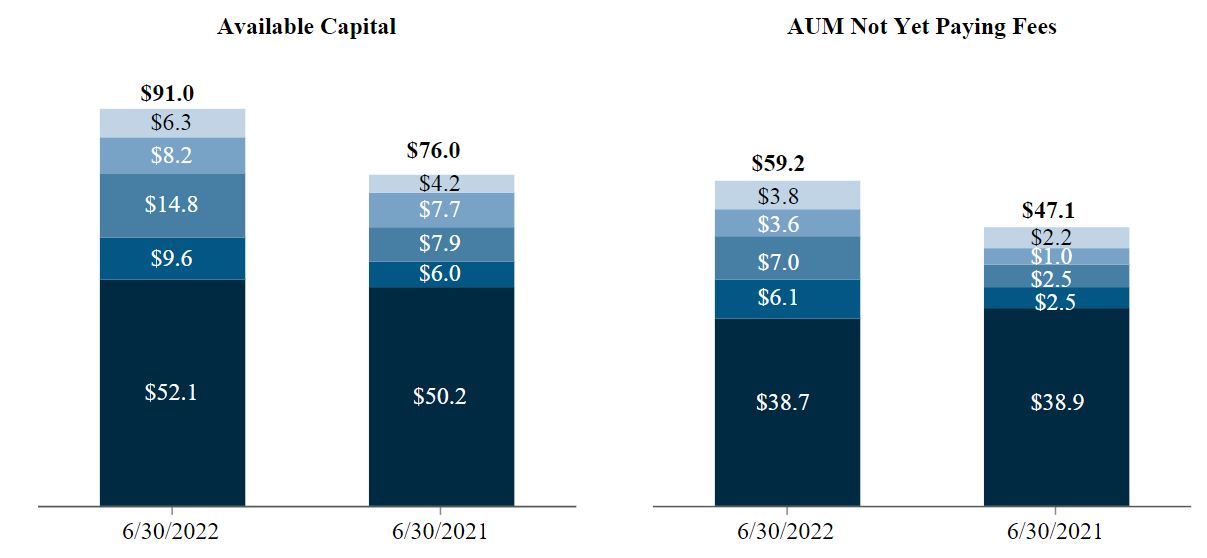
The charts below present our available capital and AUM not yet paying fees by segment ($ in billions):
| Credit | Private Equity | Real Assets | Secondary Solutions | Strategic Initiatives |
As of June 30, 2022, AUM Not Yet Paying Fees includes $52.7 billion of AUM available for future deployment which could generate approximately $505.2 million in potential incremental annual management fees. As of June 30, 2021, AUM Not Yet Paying Fees includes $42.6 billion of AUM available for future deployment which could generate approximately $400.9 million in potential incremental annual management fees.
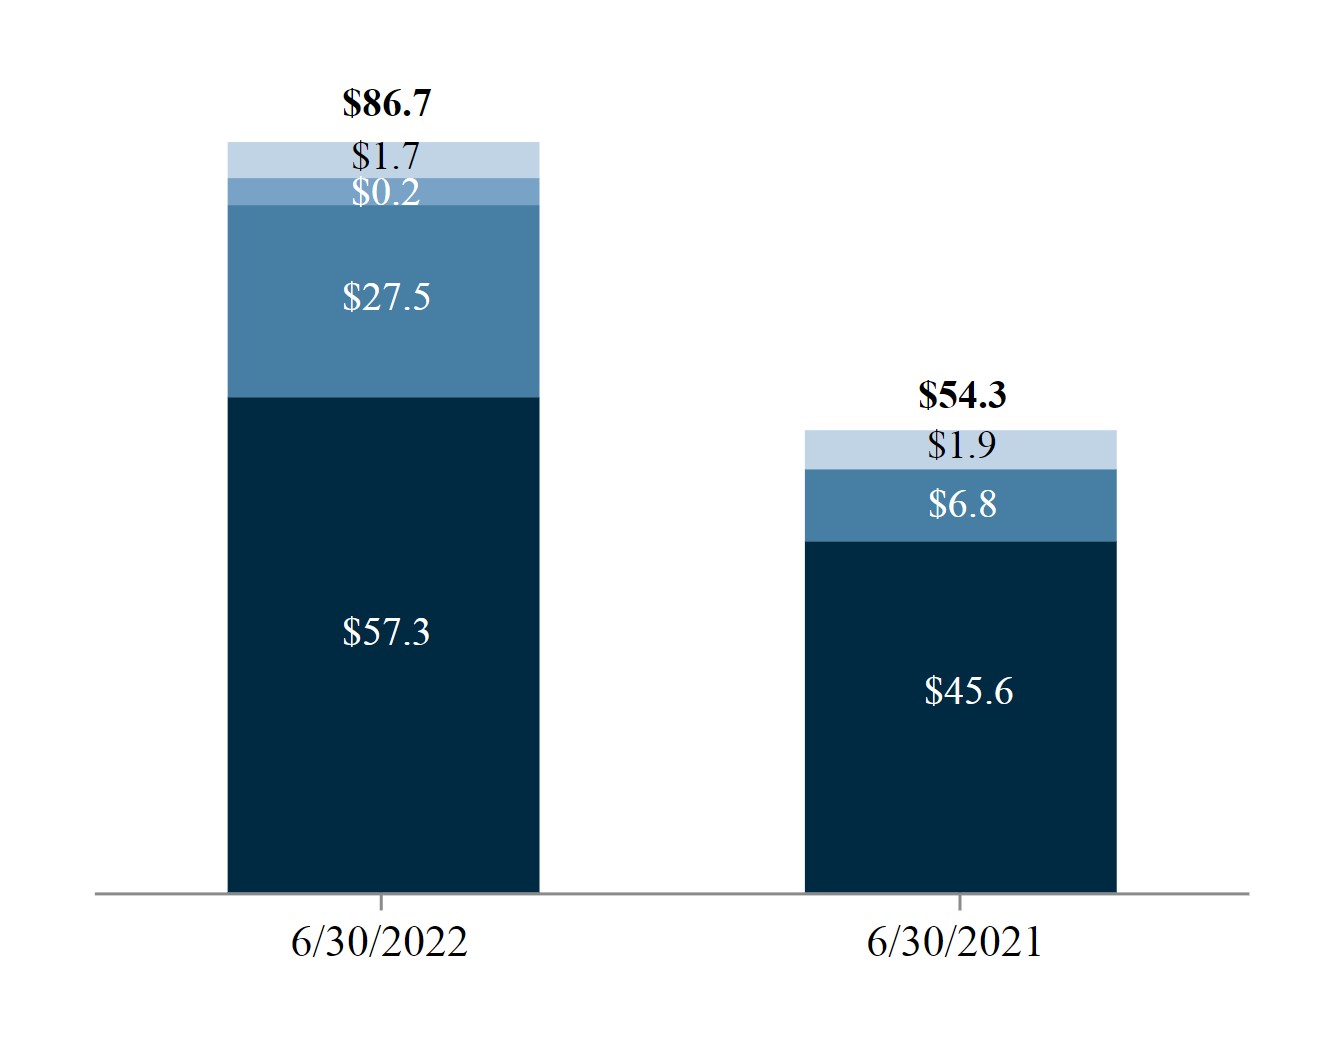
The chart below presents our perpetual capital AUM by segment ($ in billions):
| Credit | Real Assets | Secondary Solutions | Strategic Initiatives |
As of June 30, 2022, perpetual capital AUM of $86.7 billion included 75% from commingled funds and 25% from managed accounts. As of June 30, 2021, perpetual capital AUM of $54.3 billion included 66% from commingled funds and
34% from managed accounts. As of June 30, 2022, perpetual capital IGAUM from which we will generate fee related performance revenues totaled $22.8 billion, composed of $9.7 billion from managed accounts within the Credit Group and $13.1 billion from commingled funds within the Real Assets Group.
Management Fees By Type
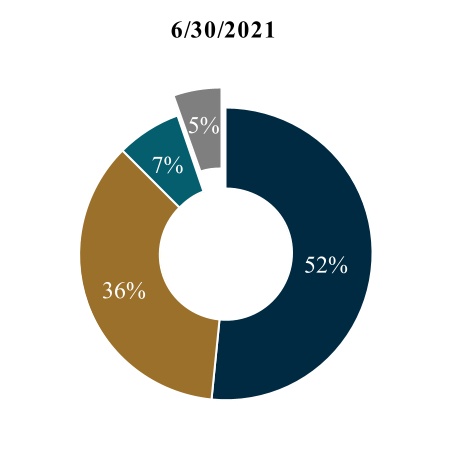
We view the duration of funds we manage as a metric to measure the stability of our future management fees. For both the three months ended June 30, 2022 and 2021, 95% of management fees were earned from perpetual capital or long-dated funds. The charts below present the composition of our segment management fees by the initial fund duration:

| Long-Dated Funds(1) | Perpetual Capital - Commingled Funds | Perpetual Capital - Managed Accounts | Other |
(1) Long-dated funds generally have a contractual life of five years or more at inception.
Fund Performance Metrics
Fund performance information for our investment funds considered to be “significant funds” is included throughout this discussion with analysis to facilitate an understanding of our results of operations for the periods presented. Our significant funds are commingled funds that either contributed at least 1% of our total management fees or represented at least 1% of the Company’s total FPAUM for the past two consecutive quarters. In addition to management fees, each of our significant funds may generate carried interest and incentive fees upon the achievement of performance hurdles. The fund performance information reflected in this discussion and analysis is not indicative of our overall performance. An investment in Ares is not an investment in any of our funds. Past performance is not indicative of future results. As with any investment, there is always the potential for gains as well as the possibility of losses. There can be no assurance that any of these funds or our other existing and future funds will achieve similar returns.
Fund performance metrics for significant funds may be marked as “NM” as it is not considered meaningful due to the limited time since the initial investment and/or early stage of capital deployment.
To further facilitate an understanding of the impact a significant fund may have on our results, we present our drawdown funds as either harvesting investments or deploying capital to indicate the fund's stage in its life cycle. A fund harvesting investments is generally not seeking to deploy capital into new investment opportunities, while a fund deploying capital is generally seeking new investment opportunities.
Consolidation and Deconsolidation of Ares Funds
Consolidated Funds represented approximately 5% of our AUM as of June 30, 2022, 2% of our management fees and less than 1% of our carried interest and incentive fees for the six months ended June 30, 2022. As of June 30, 2022, we consolidated 24 CLOs and 10 private funds and one SPAC, and as of June 30, 2021, we consolidated 21 CLOs, nine private funds and one SPAC.
The activity of the Consolidated Funds is reflected within the unaudited condensed consolidated financial statement line items indicated by reference thereto. The impact of the Consolidated Funds also typically will decrease management fees, carried interest allocation and incentive fees reported under GAAP to the extent these amounts are eliminated upon consolidation.
The assets and liabilities of our Consolidated Funds are held within separate legal entities and, as a result, the liabilities of our Consolidated Funds are typically non-recourse to us. Generally, the consolidation of our Consolidated Funds has a significant gross-up effect on our assets, liabilities and cash flows but has no net effect on the net income attributable to us or our stockholders' equity, except where a reallocation of ownership occurs based on specific redemption or liquidation preference terms. The net economic ownership interests of our Consolidated Funds, to which we have no economic rights, are reflected as redeemable and non-controlling interests in the Consolidated Funds in our unaudited condensed consolidated financial statements. Redeemable interest in Consolidated Funds represent the shares issued by Ares Acquisition Corporation (“AAC”) that are redeemable for cash by the public shareholders in connection with AAC’s failure to complete a business combination or tender offer associated with stockholder approval provisions.
We generally deconsolidate funds and CLOs when we are no longer deemed to have a controlling interest in the entity. During the six months ended June 30, 2022, we did not deconsolidate any entities. During the six months ended June 30, 2021, we deconsolidated one CLO as a result of a significant change in ownership.
The performance of our Consolidated Funds is not necessarily consistent with, or representative of, the combined performance trends of all of our funds.
For the actual impact that consolidation had on our results and further discussion on consolidation and deconsolidation of funds, see “Note 16. Consolidation” to our unaudited condensed consolidated financial statements included herein.
Results of Operations
Consolidated Results of Operations
We consolidate funds and entities where we are deemed to hold a controlling financial interest. The Consolidated Funds are not necessarily the same entities in each year presented due to changes in ownership, changes in limited partners' or investor rights, and the creation and termination of funds and entities. The consolidation of these funds and entities had no effect on net income attributable to us for the periods presented. As such, we separate the analysis of the Consolidated Funds and evaluate that activity in total. The following table and discussion sets forth information regarding our consolidated results of operations ($ in thousands):
| Three months ended June 30, | Favorable (Unfavorable) | Six months ended June 30, | Favorable (Unfavorable) | ||||||||||||||||||||||||||||||||||||||||||||
| 2022 | 2021 | $ Change | % Change | 2022 | 2021 | $ Change | % Change | ||||||||||||||||||||||||||||||||||||||||
| Revenues | |||||||||||||||||||||||||||||||||||||||||||||||
| Management fees | $ | 520,560 | $ | 367,286 | $ | 153,274 | 42% | $ | 997,892 | $ | 687,559 | $ | 310,333 | 45% | |||||||||||||||||||||||||||||||||
| Carried interest allocation | 47,304 | 852,521 | (805,217) | (94) | 225,593 | 1,150,056 | (924,463) | (80) | |||||||||||||||||||||||||||||||||||||||
| Incentive fees | 4,675 | 15,904 | (11,229) | (71) | 21,097 | 18,724 | 2,373 | 13 | |||||||||||||||||||||||||||||||||||||||
| Principal investment income (loss) | (4,387) | 47,127 | (51,514) | NM | 3,939 | 72,227 | (68,288) | (95) | |||||||||||||||||||||||||||||||||||||||
| Administrative, transaction and other fees | 33,278 | 11,981 | 21,297 | 178 | 67,908 | 24,641 | 43,267 | 176 | |||||||||||||||||||||||||||||||||||||||
| Total revenues | 601,430 | 1,294,819 | (693,389) | (54) | 1,316,429 | 1,953,207 | (636,778) | (33) | |||||||||||||||||||||||||||||||||||||||
| Expenses | |||||||||||||||||||||||||||||||||||||||||||||||
| Compensation and benefits | 375,775 | 269,689 | (106,086) | (39) | 729,612 | 501,539 | (228,073) | (45) | |||||||||||||||||||||||||||||||||||||||
| Performance related compensation | 41,073 | 656,381 | 615,308 | 94 | 173,884 | 877,813 | 703,929 | 80 | |||||||||||||||||||||||||||||||||||||||
| General, administrative and other expenses | 122,566 | 83,362 | (39,204) | (47) | 243,089 | 151,018 | (92,071) | (61) | |||||||||||||||||||||||||||||||||||||||
| Expenses of Consolidated Funds | 13,454 | 15,300 | 1,846 | 12 | 17,967 | 19,471 | 1,504 | 8 | |||||||||||||||||||||||||||||||||||||||
| Total expenses | 552,868 | 1,024,732 | 471,864 | 46 | 1,164,552 | 1,549,841 | 385,289 | 25 | |||||||||||||||||||||||||||||||||||||||
| Other income (expense) | |||||||||||||||||||||||||||||||||||||||||||||||
| Net realized and unrealized gains (losses) on investments | (1,775) | 4,977 | (6,752) | NM | 6,334 | 10,410 | (4,076) | (39) | |||||||||||||||||||||||||||||||||||||||
| Interest and dividend income | 1,476 | 4,482 | (3,006) | (67) | 2,978 | 5,442 | (2,464) | (45) | |||||||||||||||||||||||||||||||||||||||
| Interest expense | (17,221) | (6,907) | (10,314) | (149) | (32,867) | (13,602) | (19,265) | (142) | |||||||||||||||||||||||||||||||||||||||
| Other income (expense), net | 5,809 | (1,819) | 7,628 | NM | 7,593 | (5,968) | 13,561 | NM | |||||||||||||||||||||||||||||||||||||||
| Net realized and unrealized gains (losses) on investments of Consolidated Funds | (7,907) | (5,947) | (1,960) | (33) | 8,061 | 10,475 | (2,414) | (23) | |||||||||||||||||||||||||||||||||||||||
| Interest and other income of Consolidated Funds | 117,375 | 113,878 | 3,497 | 3 | 237,665 | 229,717 | 7,948 | 3 | |||||||||||||||||||||||||||||||||||||||
| Interest expense of Consolidated Funds | (79,253) | (58,974) | (20,279) | (34) | (153,266) | (129,999) | (23,267) | (18) | |||||||||||||||||||||||||||||||||||||||
| Total other income, net | 18,504 | 49,690 | (31,186) | (63) | 76,498 | 106,475 | (29,977) | (28) | |||||||||||||||||||||||||||||||||||||||
| Income before taxes | 67,066 | 319,777 | (252,711) | (79) | 228,375 | 509,841 | (281,466) | (55) | |||||||||||||||||||||||||||||||||||||||
| Income tax expense | 13,460 | 48,458 | 34,998 | 72 | 33,871 | 74,212 | 40,341 | 54 | |||||||||||||||||||||||||||||||||||||||
| Net income | 53,606 | 271,319 | (217,713) | (80) | 194,504 | 435,629 | (241,125) | (55) | |||||||||||||||||||||||||||||||||||||||
| Less: Net income (loss) attributable to non-controlling interests in Consolidated Funds | (15,022) | 5,027 | (20,049) | NM | 32,360 | 54,885 | (22,525) | (41) | |||||||||||||||||||||||||||||||||||||||
| Net income attributable to Ares Operating Group entities | 68,628 | 266,292 | (197,664) | (74) | 162,144 | 380,744 | (218,600) | (57) | |||||||||||||||||||||||||||||||||||||||
| Less: Net income (loss) attributable to redeemable interest in Ares Operating Group entities | (457) | 337 | (794) | NM | (58) | 369 | (427) | NM | |||||||||||||||||||||||||||||||||||||||
| Less: Net income attributable to non-controlling interests in Ares Operating Group entities | 29,354 | 124,311 | (94,957) | (76) | 76,608 | 180,353 | (103,745) | (58) | |||||||||||||||||||||||||||||||||||||||
| Net income attributable to Ares Management Corporation | 39,731 | 141,644 | (101,913) | (72) | 85,594 | 200,022 | (114,428) | (57) | |||||||||||||||||||||||||||||||||||||||
| Less: Series A Preferred Stock dividends paid | — | 5,425 | (5,425) | (100) | — | 10,850 | (10,850) | (100) | |||||||||||||||||||||||||||||||||||||||
| Less: Series A Preferred Stock redemption premium | — | 11,239 | 11,239 | 100 | — | 11,239 | 11,239 | 100 | |||||||||||||||||||||||||||||||||||||||
| Net income attributable to Ares Management Corporation Class A and non-voting common stockholders | $ | 39,731 | $ | 124,980 | (85,249) | (68) | $ | 85,594 | $ | 177,933 | (92,339) | (52) |
NM - Not Meaningful
Three and Six Months Ended June 30, 2022 Compared to Three and Six Months Ended June 30, 2021
Consolidated Results of Operations of the Company
Management Fees. Management fees increased by $153.3 million, or 42%, for the three months ended June 30, 2022 compared to the three months ended June 30, 2021 and by $310.3 million, or 45%, for the six months ended June 30, 2022 compared to the six months ended June 30, 2021. The increase was primarily driven by higher FPAUM from capital deployment in direct lending funds. The Landmark Acquisition, which was completed on June 2, 2021, contributed additional fees of $33.3 million and $77.8 million for the three and six months ended June 30, 2022, respectively, when compared to the three and six months ended June 30, 2021. The Black Creek Acquisition and Infrastructure Debt Acquisitions, which were completed subsequent to the second quarter of 2021, contributed additional fees of $32.5 million, $9.6 million and $59.9 million, $14.6 million for the three and six months ended June 30, 2022, respectively. For detail regarding the fluctuations of management fees within each of our segments see “—Results of Operations by Segment.”
Carried Interest Allocation. Carried interest allocation decreased by $805.2 million, or 94%, for the three months ended June 30, 2022 compared to the three months ended June 30, 2021 and by $924.5 million, or 80%, for the six months ended June 30, 2022 compared to the six months ended June 30, 2021. The activity was principally composed of the following ($ in millions):
| Three months ended June 30, 2022 | Primary Drivers | Three months ended June 30, 2021 | Primary Drivers | |||||||||||
| Credit funds | $ | 17.2 | Primarily from three direct lending funds and one alternative credit fund with $17.1 billion of IGAUM generating returns in excess of their hurdle rates. Ares Capital Europe V L.P. (“ACE V”) generated $15.7 million of carried interest allocation driven by net investment income on an increasing invested capital base. Ares Capital Europe III, L.P. (“ACE III”) and Ares Capital Europe IV L.P. (“ACE IV”) generated carried interest allocation of $2.4 million and $10.7 million, respectively, driven by net investment income during the period. Ares Pathfinder Fund, L.P. (“Pathfinder”) generated carried interest allocation of $10.9 million that was primarily driven by market appreciation of various investments. The activity was partially offset by a reversal of unrealized carried interest allocation from two direct lending funds due to lower net investment income and from two alternative credit funds due to market depreciation of investments during the period. | $ | 114.4 | Primarily from four direct lending funds and one alternative credit fund with $14.1 billion of IGAUM generating returns in excess of their hurdle rates. Ares Private Credit Solutions, L.P. (“PCS”), ACE IV and ACE V generated carried interest allocation of $18.1 million, $29.4 million, $8.7 million respectively, that was driven by net investment income on an increasing invested capital base. ACE III generated carried interest allocation of $16.4 million driven by net investment income during the period. Pathfinder generated carried interest allocation of $15.3 million that was primarily driven by market appreciation of various investments. | ||||||||
| Private equity funds | 0.4 | Market appreciation across several portfolio company investments that primarily operate in industries such as services, technology, retail and healthcare, generated carried interest allocation of $22.7 million from Ares Corporate Opportunities Fund V, L.P. (“ACOF V”) and $19.5 million from Ares Corporate Opportunities Fund VI, L.P. (“ACOF VI”). Conversely, the declining macroeconomic environment caused broad decreases in valuations of the publicly traded investments of our funds. Ares Special Situations Fund IV, L.P. (“SSF IV”) and Ares Special Opportunities Fund, L.P. (“ASOF”) had a reversal of unrealized carried interest of $13.4 million and $17.3 million, respectively. Ares Corporate Opportunities Fund IV, L.P. (“ACOF IV”) had a reversal of unrealized carried interest of $8.9 million primarily due to the decrease in valuation of its investment in the AZEK Company (“AZEK”). | 563.7 | ACOF IV generated carried interest allocation of $72.2 million primarily driven by market appreciation of its investment in AZEK following its initial public offering. In addition, market appreciation across several investments generated carried interest allocation of $390.7 million from ACOF V, $76.6 million from ASOF and $28.6 million from ACOF VI. | ||||||||||
| Real assets funds | 22.8 | Appreciation from properties within real estate equity funds, driven by increasing operating income primarily from industrial and multifamily investments, generated carried interest allocation of $6.5 million from Ares U.S. Real Estate Opportunity Fund III, L.P. (“AREOF III”), $2.4 million from US Real Estate Fund VIII, L.P. (“US VIII”), $3.2 million from US Real Estate Fund IX, L.P. ("US IX") and $6.4 million from four real estate equity funds. Ares Energy Investors Fund V, L.P. (“EIF V”) also generated $10.4 million of carried interest allocation due to market appreciation of certain investments. | 112.9 | Market appreciation from properties within real estate equity funds, primarily driven by gains generated across several industrial and multifamily assets, generated carried interest allocation of $13.4 million from US VIII, $16.6 million from US IX, and $44.5 million from Ares European Real Estate Fund V SCSp. ("EF V"). | ||||||||||
| Secondary solutions funds | 6.8 | Market appreciation of certain investments in a private equity secondaries fund, Landmark Real Estate Partners VIII, L.P. (“LREP VIII”), and Landmark Equity Partners XVI, L.P. (“LEP XVI”) and related vehicles that generated carried interest allocation of $2.0 million, $1.8 million and $1.5 million, respectively. | 61.4 | Market appreciation of investments in LEP XVI and LREP VIII that generated carried interest allocation of $51.8 million and $9.1 million, respectively. | ||||||||||
| Strategic initiatives funds | 0.1 | Carried interest allocation generated from an Asian secured lending fund primarily driven by higher net investment income. | 0.1 | Carried interest allocation generated from an Asian secured lending fund primarily driven by higher net investment income. | ||||||||||
| Carried interest allocation | $ | 47.3 | $ | 852.5 | ||||||||||
| Six months ended June 30, 2022 | Primary Drivers | Six months ended June 30, 2021 | Primary Drivers | |||||||||||
| Credit funds | $ | 91.5 | Primarily from four direct lending funds and one alternative credit fund with $19.1 billion of IGAUM generating returns in excess of their hurdle rates. ACE V generated carried interest allocation of $36.1 million driven by net investment income on an increasing invested capital base. PCS, ACE III and ACE IV generated carried interest allocation of $9.8 million, $9.0 million and $20.3 million, respectively, primarily driven by net investment income during the period. In addition, Pathfinder generated carried interest allocation of $25.2 million that was driven by market appreciation of various investments. The activity was partially offset by a reversal of unrealized carried interest allocation from one U.S. direct lending fund due to lower net investment income and from two alternative credit funds due to market depreciation of investments during the period. | $ | 200.1 | Primarily from four direct lending funds and one alternative credit fund with $14.1 billion of IGAUM generating returns in excess of their hurdle rates, primarily consisting of $33.7 million from PCS, $57.3 million from ACE IV and $14.5 million from ACE V. The carried interest allocation generated by these funds was driven by net investment income on an increasing invested capital base. ACE III generated carried interest allocation of $25.9 million primarily driven by net investment income during the period. In addition, Pathfinder generated carried interest allocation of $27.4 million that was driven by market appreciation of various investments. | ||||||||
| Private equity funds | (2.7) | The declining macroeconomic environment caused broad decreases in valuations of the publicly traded investments of our funds. ACOF IV had a reversal of unrealized carried interest of $60.6 million primarily from its diminishing investment in AZEK. Conversely, market appreciation across several portfolio company investments that primarily operate in industries such as services, technology, retail and healthcare, generated carried interest allocation of $39.7 million from ACOF V, $3.7 million from ASOF and $30.9 million from ACOF VI. | 747.3 | ACOF IV generated carried interest allocation of $178.0 million primarily due to market appreciation of its investment in AZEK following its initial public offering. In addition, market appreciation across several investments generated carried interest allocation of $390.7 million from ACOF V, $119.9 million from ASOF and $47.0 million from ACOF VI. | ||||||||||
| Real assets funds | 77.3 | Appreciation from properties within real estate equity funds, driven by increasing operating income primarily from industrial and multifamily investments, generated carried interest allocation of $23.3 million from AREOF III, $12.1 million from US VIII, $19.9 million from US IX and $19.8 million from four real estate equity funds. The appreciation was partially offset by the reversal of unrealized carried interest allocation of $5.4 million from EIF V. | 140.8 | Market appreciation from properties within real estate equity funds, primarily driven by gains generated across several industrial and multifamily assets, generated carried interest allocation of $21.5 million from US VIII, $25.8 million from US IX and $47.5 million from EF V. | ||||||||||
| Secondary solutions funds | 59.4 | Market appreciation of certain investments held in LREP VIII, and LEP XVI and related vehicles that generated carried interest allocation of $26.3 million and $18.5 million, respectively. Three private equity secondaries funds also generated carried interest allocation of $7.6 million. | 61.4 | Market appreciation of investments in LEP XVI and LREP VIII that generated carried interest allocation of $51.8 million and $9.1 million, respectively. | ||||||||||
| Strategic initiatives funds | 0.1 | Carried interest allocation generated from an Asian secured lending fund primarily driven by higher net investment income. | 0.5 | Carried interest allocation generated from an Asian secured lending fund primarily driven by higher net investment income. | ||||||||||
| Carried interest allocation | $ | 225.6 | $ | 1,150.1 |
Incentive Fees. Incentive fees decreased by $11.2 million, or 71%, for the three months ended June 30, 2022 compared to the three months ended June 30, 2021 and increased by $2.4 million, or 13%, for the six months ended June 30, 2022 compared to the six months ended June 30, 2021. The activity was principally composed of the following ($ in millions):
| Three months ended June 30, 2022 | Primary Drivers | Three months ended June 30, 2021 | Primary Drivers | ||||||||||||||
| Credit funds | $ | 0.4 | Incentive fees generated from one direct lending fund. | $ | 15.2 | Incentive fees generated from one alternative credit fund and from one CLO as a result of restructuring activity from a prior period. | |||||||||||
| Real assets funds | 3.9 | Incentive fees generated from an industrial real estate fund and ACRE. | 0.7 | Incentive fees generated from ACRE. | |||||||||||||
| Secondary Solutions | 0.4 | Incentive fees generated from a private equity secondaries fund. | — | N/A | |||||||||||||
| Incentive fees | $ | 4.7 | $ | 15.9 | |||||||||||||
| Six months ended June 30, 2022 | Primary Drivers | Six months ended June 30, 2021 | Primary Drivers | ||||||||||||||
| Credit funds | $ | 15.8 | Incentive fees generated from three direct lending funds and one alternative credit fund. | $ | 17.3 | Incentive fees generated from one alternative credit fund and from one CLO as a result of restructuring activity from a prior period. | |||||||||||
| Real assets funds | 4.9 | Incentive fees generated from an industrial real estate fund and ACRE. | 1.4 | Incentive fees generated from ACRE. | |||||||||||||
| Secondary Solutions | 0.4 | Incentive fees generated from a private equity secondaries fund. | — | N/A | |||||||||||||
| Incentive fees | $ | 21.1 | $ | 18.7 |
Principal Investment Income (Loss). Principal investment income (loss) decreased by $51.5 million to principal investment loss of $4.4 million for the three months ended June 30, 2022 compared to the three months ended June 30, 2021 and by $68.3 million, or 95%, to principal investment income of $3.9 million for the six months ended June 30, 2022 compared to the six months ended June 30, 2021. The activity for the three and six months ended June 30, 2022 was driven by a declining macroeconomic environment that has negatively impacted the global equity and credit markets, leading to a broad decrease in valuations. In spite of a weak second quarter, the results from the first quarter contributed to the positive result for the six months ended June 30, 2022 primarily due to realizations from the sale of underlying properties held by funds in our U.S. real estate equity strategy and market appreciation of various investments across funds in our infrastructure debt and U.S. and European direct lending strategies.
The activity for the three months ended June 30, 2021 was driven by market appreciation of several investments in ACOF IV, including its investment in AZEK, ACOF VI, and funds within our special opportunities and infrastructure opportunities strategies. The activity for the six months ended June 30, 2021 was primarily driven by market appreciation of ACOF IV’s investment in AZEK, various investments in ACOF III and ACOF VI.
Administrative, Transaction and Other Fees. Administrative, transaction and other fees increased by $21.3 million, or 178%, for the three months ended June 30, 2022 compared to the three months ended June 30, 2021 and by $43.3 million, or 176%, for the six months ended June 30, 2022 compared to the six months ended June 30, 2021. The increases were primarily due to new fee streams following the completion of the Black Creek Acquisition, including various property-related fees, such as acquisition, development and property management, and the distribution of shares in our non-traded REITs. These fees collectively contributed $13.8 million and $27.5 million for the three and six months ended June 30, 2022, respectively. We also earn administrative fees from the funds that were acquired in the Black Creek Acquisition that contributed $7.6 million and $15.2 million for the three and six months ended June 30, 2022, respectively. In addition, certain private funds pay administrative fees on invested capital and increases in deployment will result in a higher fee base. Administrative fees from these private funds increased by $1.8 million and $3.4 million for the three and six months ended June 30, 2022, respectively, compared to the three and six months ended June 30, 2021.
Compensation and Benefits. Compensation and benefits increased by $106.1 million, or 39%, for the three months ended June 30, 2022 compared to the three months ended June 30, 2021 and by $228.1 million, or 45%, for the six months ended June 30, 2022 compared to the six months ended June 30, 2021. The increases were primarily driven by (i) headcount growth to support the expansion of our business and (ii) strategic initiatives and acquisitions. Average headcount for the year-to-date period increased by 42% to 2,170 professionals for the 2022 period from 1,526 professionals for the same period in 2021.
Headcount growth attributable to the Black Creek Acquisition, Landmark Acquisition and Infrastructure Debt Acquisition collectively contributed $46.4 million and $97.7 million in recurring employment related costs for the three and six months ended June 30, 2022, respectively. The performance-based, acquisition-related compensation arrangements (“earnouts”) that were established in connection with the Black Creek Acquisition, Landmark Acquisition and Infrastructure Debt Acquisition also contributed $54.9 million and $102.9 million to the three and six months ended June 30, 2022, respectively. The earnouts are based on the achievement of revenue targets for certain funds. As all earnouts are subject to the continued and future services of senior professionals and advisors, they are required to be recorded as compensation expense and recognized ratably over the respective service periods. See “Note 9. Commitments and Contingencies” for a further description of the contingent liabilities related to these arrangements.
The following table presents equity compensation expense based on the different types of restricted unit awards ($ in thousands):
| Three months ended June 30, | Favorable (Unfavorable) | Six months ended June 30, | Favorable (Unfavorable) | |||||||||||||||||||||||||||||||||||||||||||||||||||||||||||||||||||||||
| 2022 | 2021 | $ Change | % Change | 2022 | 2021 | $ Change | % Change | |||||||||||||||||||||||||||||||||||||||||||||||||||||||||||||||||||
| Non-recurring awards: | ||||||||||||||||||||||||||||||||||||||||||||||||||||||||||||||||||||||||||
| Multi-year future grants | $ | 11,510 | $ | 10,263 | $ | (1,247) | (12) | $ | 22,407 | $ | 17,377 | $ | (5,030) | (29) | ||||||||||||||||||||||||||||||||||||||||||||||||||||||||||||
| Performance-based awards | — | 8,751 | 8,751 | 100 | — | 20,313 | 20,313 | 100 | ||||||||||||||||||||||||||||||||||||||||||||||||||||||||||||||||||
| Performance-based awards - accelerated | — | 14,011 | 14,011 | 100 | — | 14,011 | 14,011 | 100 | ||||||||||||||||||||||||||||||||||||||||||||||||||||||||||||||||||
| Other non-recurring awards | 1,126 | 6,260 | 5,134 | 82 | 2,946 | 12,490 | 9,544 | 76 | ||||||||||||||||||||||||||||||||||||||||||||||||||||||||||||||||||
| Total non-recurring awards | 12,636 | 39,285 | 26,649 | 68 | 25,353 | 64,191 | 38,838 | 61 | ||||||||||||||||||||||||||||||||||||||||||||||||||||||||||||||||||
| Recurring annual awards: | ||||||||||||||||||||||||||||||||||||||||||||||||||||||||||||||||||||||||||
| Discretionary awards | 24,166 | 18,778 | (5,388) | (29) | 45,134 | 35,953 | (9,181) | (26) | ||||||||||||||||||||||||||||||||||||||||||||||||||||||||||||||||||
| Bonus awards | 12,833 | 11,440 | (1,393) | (12) | 32,799 | 25,009 | (7,790) | (31) | ||||||||||||||||||||||||||||||||||||||||||||||||||||||||||||||||||
| Total recurring annual awards | 36,999 | 30,218 | (6,781) | (22) | 77,933 | 60,962 | (16,971) | (28) | ||||||||||||||||||||||||||||||||||||||||||||||||||||||||||||||||||
| Equity compensation expense, net | $ | 49,635 | $ | 69,503 | 19,868 | 29 | $ | 103,286 | $ | 125,153 | 21,867 | 17 |
Equity compensation expense decreased by $19.9 million and $21.9 million for the three and six months ended June 30, 2022, respectively, compared to the three and six months ended June 30, 2021. The decreases were primarily attributable to equity compensation expense recognized during the three and six months ended June 30, 2021 related to performance-based awards with market conditions that were granted to certain executive officers in the first quarter of 2021 and to one-time time-based awards granted to certain employees that substantially vested prior to 2022. The decrease in equity compensation expense was partially offset by the increase in awards granted as part of the recurring annual award programs. Additional multi-year future grants were approved in the first quarter of 2022 with grant dates in 2023, 2024 and 2025. Given that these future restricted units have been communicated to the recipient, we account for these awards as if they have been granted and recognize the compensation expense on a straight-line basis over the service period.
For detail regarding the fluctuations of compensation and benefits within each of our segments see “—Results of Operations by Segment.”
Performance Related Compensation. Performance related compensation decreased by $615.3 million, or 94%, for the three months ended June 30, 2022 compared to the three months ended June 30, 2021 and by $703.9 million, or 80%, for the six months ended June 30, 2022 compared to the six months ended June 30, 2021. Changes in performance related compensation are directly associated with the changes in carried interest allocation and incentive fees described above and may include performance allocations to charitable organizations as part of our philanthropic initiatives.
General, Administrative and Other Expenses. General, administrative and other expenses increased by $39.2 million, or 47%, for the three months ended June 30, 2022 compared to the three months ended June 30, 2021 and by $92.1 million, or 61%, for the six months ended June 30, 2022 compared to the six months ended June 30, 2021. The Black Creek Acquisition, Landmark Acquisition and Infrastructure Debt Acquisition have collectively contributed $30.9 million and $64.2 million in general, administrative and other expenses to the three and six months ended June 30, 2022, respectively, when compared to the same periods in 2021. These expenses increased primarily due to (i) amortization expense of $18.6 million and $41.4 million related to the intangible assets recorded in connection with the acquisitions and (ii) certain recurring operating expenses, including occupancy costs, information services, information technology and office services of $11.3 million and $20.7 million for the three and six months ended June 30, 2022, respectively, when compared to the same periods in 2021. The impact from the Black Creek Acquisition, Landmark Acquisition and Infrastructure Debt Acquisition has been excluded from the discussion below.
Certain expenses have also increased during the current period, including occupancy costs to support our growing headcount and information services and information technology to support the expansion of our business. Collectively, these expenses increased by $2.3 million and $5.4 million for the three and six months ended June 30, 2022, respectively, when compared to the same periods in 2021. Other operating expenses, most notably travel, marketing sponsorships and certain fringe benefits, collectively increased by $14.1 million and $23.2 million for the three and six months ended June 30, 2022, respectively, when compared to the same periods in 2021, as marketing and company events returned to pre-pandemic levels and travel continues to ramp up toward historical levels.
The increase in general, administrative and other expenses were partially offset by a decrease in acquisition related costs of $7.9 million and $7.4 million for the three and six months ended June 30, 2022, respectively, when compared to the three and six months ended June 30, 2021.
Net Realized and Unrealized Gains (Losses) on Investments. Net realized and unrealized gains (losses) on investments decreased by $6.8 million to a $1.8 million loss for the three months ended June 30, 2022 compared to the three months ended June 30, 2021 and by $4.1 million to a $6.3 million gain for the six months ended June 30, 2022 compared to the six months ended June 30, 2021. The activity for the three months ended June 30, 2022 was primarily attributable to unrealized losses on our investments in the subordinated notes of U.S. CLOs. The CSLLI returned a negative 4.4% for both the three and six months ended June 30, 2022 compared to 1.4% and 3.5% for the three and six months ended June 30, 2021, respectively. The activity for the three and six months ended June 30, 2022 and 2021 included unrealized gains from certain strategic initiative related investments made in connection with our acquisition of SSG. The activity for the three and six months ended June 30, 2021 was also attributable to unrealized gains on our investments in the subordinated notes of U.S. CLOs.
Interest Expense. Interest expense increased by $10.3 million, or 149%, for the three months ended June 30, 2022 compared to the three months ended June 30, 2021 and by $19.3 million, or 142%, for the six months ended June 30, 2022 compared to the six months ended June 30, 2021. The issuance of the 2052 Senior Notes in January 2022 increased interest expense by $4.7 million and $8.3 million for the three and six months ended June 30, 2022, respectively, when compared to the same periods in 2021. The issuance of the 2051 Subordinated Notes on the last day of the second quarter of 2021 increased interest expense by $4.6 million and $9.3 million for the three and six months ended June 30, 2022, respectively, when compared to the same periods in 2021.
Other Income (Expense), Net. Other income (expense), net increased by $7.6 million to other income, net of $5.8 million for the three months ended June 30, 2022 compared to the three months ended June 30, 2021 and by $13.6 million to other income, net of $7.6 million for the six months ended June 30, 2022 compared to the six months ended June 30, 2021. Other income (expense), net includes transaction gains (losses) associated with currency fluctuations impacting the revaluation of non-functional currency balances and was based on the fluctuations in currency exchange rates for the three and six months ended June 30, 2022 and 2021. Transaction gains during the three and six months ended June 30, 2022 were primarily attributable to the British pound weakening against the U.S. dollar and Euro, while transaction losses during the three and six months ended June 30, 2021 were primarily attributable to the British pound and Euro strengthening against the U.S. dollar.
Other income, net also includes the change in fair value of a contingent obligation recognized in connection with the Black Creek Acquisition. The purchase agreement with Black Creek contains a provision that requires us to record a contingent consideration liability that is dependent on the achievement of revenue targets for certain funds that were acquired in the Black Creek Acquisition. For the three and six months ended June 30, 2022, we recorded $0.2 million and $1.2 million, respectively, in expense for the revaluation of this contingent obligation. See “Note 9. Commitments and Contingencies” for a further description of the contingency.
Income Tax Expense Income tax expense decreased by $35.0 million, or 72%, for the three months ended June 30, 2022 compared to the three months ended June 30, 2021 and by $40.3 million, or 54%, for the six months ended June 30, 2022 compared to the six months ended June 30, 2021. The decreases were primarily driven by the 74% and 57% decreases in income before taxes for the Company and its consolidated subsidiaries for the three and six months ended June 30, 2022, respectively, compared to the three and six months ended June 30, 2021*.* The decreases in income tax expense were partially offset by the slight increases in weighted average daily ownership. The weighted average daily ownership for AMC common stockholders increased from 59.1% and 58.1% for the three and six months ended June 30, 2021 to 59.7% and 59.6% for the three and six months ended June 30, 2022. The changes in ownership were primarily driven by the issuance of Class A common stock in connection with stock option exercises and vesting of restricted stock awards. The increase in the weighted average daily ownership for the AMC common stockholders was partially offset by the issuance of AOG Units in connection with the Landmark Acquisition and the Black Creek Acquisition that increased the ownership of AOG Units not held by AMC.
Redeemable and Non-Controlling Interests. Net income attributable to redeemable and non-controlling interests in AOG entities represents results attributable to the holders of AOG Units and other ownership interests that are not held by
AMC. In connection with the SSG Acquisition, the former owners of SSG retained an ownership interest in a subsidiary of an AOG entity that is reflected as redeemable interest in AOG entities. Net income attributable to redeemable interest in AOG entities is allocated based on the ownership percentage for periods presented.
Net income attributable to non-controlling interests in AOG entities is generally allocated based on the weighted average daily ownership of the other AOG unitholders, except for income (loss) generated from certain joint venture partnerships. Net income (loss) is allocated to other strategic distribution partners with whom we have established joint ventures based on the respective ownership percentages and based on the activity of certain membership interests. For the three and six months ended June 30, 2022 and 2021, net loss of $3.6 million, net income of $1.0 million, $3.7 million and $3.0 million, respectively, was allocated based on ownership percentages of the strategic distribution partners and the activity of those membership interests.
Net income attributable to non-controlling interests in AOG entities decreased by $95.0 million, or 76%, for the three months ended June 30, 2022 compared to the three months ended June 30, 2021 and by $103.7 million, or 58%, for the six months ended June 30, 2022 compared to the six months ended June 30, 2021. The changes in the comparative periods are a result of the respective changes in income before taxes and weighted average daily ownership. The weighted average daily ownership for the non-controlling AOG unitholders decreased from 40.9% and 41.9% for the three and six months ended June 30, 2021 to 40.3% and 40.4% for the three and six months ended June 30, 2022.
Consolidated Results of Operations of the Consolidated Funds
The following table presents the results of operations of the Consolidated Funds ($ in thousands):
| Three months ended June 30, | Favorable (Unfavorable) | Six months ended June 30, | Favorable (Unfavorable) | |||||||||||||||||||||||||||||||||||||||||||||||||||||||||||||||||
| 2022 | 2021 | $ Change | % Change | 2022 | 2021 | $ Change | % Change | |||||||||||||||||||||||||||||||||||||||||||||||||||||||||||||
| Expenses of the Consolidated Funds | $ | (13,454) | $ | (15,300) | $ | 1,846 | 12% | $ | (17,967) | $ | (19,471) | $ | 1,504 | 8% | ||||||||||||||||||||||||||||||||||||||||||||||||||||||
| Net realized and unrealized gains (losses) on investments of Consolidated Funds | (7,907) | (5,947) | (1,960) | (33) | 8,061 | 10,475 | (2,414) | (23) | ||||||||||||||||||||||||||||||||||||||||||||||||||||||||||||
| Interest and other income of Consolidated Funds | 117,375 | 113,878 | 3,497 | 3 | 237,665 | 229,717 | 7,948 | 3 | ||||||||||||||||||||||||||||||||||||||||||||||||||||||||||||
| Interest expense of Consolidated Funds | (79,253) | (58,974) | (20,279) | (34) | (153,266) | (129,999) | (23,267) | (18) | ||||||||||||||||||||||||||||||||||||||||||||||||||||||||||||
| Income before taxes | 16,761 | 33,657 | (16,896) | (50) | 74,493 | 90,722 | (16,229) | (18) | ||||||||||||||||||||||||||||||||||||||||||||||||||||||||||||
| Income tax expense of Consolidated Funds | (23) | (46) | 23 | 50 | (48) | (74) | 26 | 35 | ||||||||||||||||||||||||||||||||||||||||||||||||||||||||||||
| Net income | 16,738 | 33,611 | (16,873) | (50) | 74,445 | 90,648 | (16,203) | (18) | ||||||||||||||||||||||||||||||||||||||||||||||||||||||||||||
| Less: Revenues attributable to Ares Management Corporation eliminated upon consolidation | 33,557 | 18,917 | 14,640 | 77 | 56,003 | 36,288 | 19,715 | 54 | ||||||||||||||||||||||||||||||||||||||||||||||||||||||||||||
| Less: Other income (expense), net attributable to Ares Management Corporation eliminated upon consolidation | (1,570) | 9,667 | (11,237) | NM | (13,691) | (525) | (13,166) | NM | ||||||||||||||||||||||||||||||||||||||||||||||||||||||||||||
| Add: General, administrative and other expense attributable to Ares Management Corporation eliminated upon consolidation | 227 | — | (227) | NM | 227 | — | (227) | NM | ||||||||||||||||||||||||||||||||||||||||||||||||||||||||||||
| Net income (loss) attributable to non-controlling interests in Consolidated Funds | $ | (15,022) | $ | 5,027 | (20,049) | NM | $ | 32,360 | $ | 54,885 | (22,525) | (41) |
NM - Not Meaningful
The results of operations of the Consolidated Funds primarily represents activity from certain CLOs that we are deemed to control. Expenses primarily reflect professional fees that were incurred as a result of debt issuance costs related to the issuance of new, refinanced or restructured CLOs. These fees were expensed in the period incurred, as CLO debt is recorded at fair value on our Consolidated Statements of Financial Condition. As of June 30, 2022 and June 30, 2021, we consolidated 24 and 21 CLOs, respectively. For the three and six months ended June 30, 2022, expenses were primarily driven by professional fees incurred from the issuance of a new U.S. CLO. For the three and six months ended June 30, 2021, expenses were primarily driven by professional fees incurred from the issuance of a new U.S. CLO and the restructure of the European CLOs legal entities. The increase in interest expense was attributable to the consolidation of three CLOs subsequent to the second quarter of 2021 and one CLO that closed during the last week of the second quarter of 2021.
Revenues, other income (expense), net and general, administrative and other expense attributable to AMC represents management fees, incentive fees, principal investment income, administrative, transaction and other fees and general, administrative and other expense that are attributable to AMC’s proportional share in the activity of the Consolidated Funds and is eliminated from the respective components of AMC’s results upon consolidation. The increase in revenues attributable to AMC for the three and six months ended June 30, 2022 when compared to the same periods in 2021, was primarily attributable to higher principal investment income from an insurance fund and an Asian corporate private equity fund. Other income (expense), net attributable to AMC also included decreases for the three and six months ended June 30, 2022 driven by unrealized losses on our investments in the subordinated notes of CLOs.
Segment Analysis
For segment reporting purposes, revenues and expenses are presented before giving effect to the results of our Consolidated Funds and the results attributable to non-controlling interests of joint ventures that we consolidate. As a result, segment revenues from management fees, fee related performance revenues, performance income and investment income are different than those presented on a consolidated basis in accordance with GAAP. Revenues recognized from Consolidated Funds are eliminated in consolidation and results attributable to the non-controlling interests of joint ventures have been excluded by us. Furthermore, expenses and the effects of other income (expense) are different than related amounts presented on a consolidated basis in accordance with GAAP due to the exclusion of the results of Consolidated Funds and the non-controlling interests of joint ventures.
Non-GAAP Financial Measures
We use the following non-GAAP measures to make operating decisions, assess performance and allocate resources:
-
Fee Related Earnings (“FRE”)
-
Realized Income (“RI”)
These non-GAAP financial measures supplement and should be considered in addition to and not in lieu of, the results of operations, which are discussed further under “—Components of Consolidated Results of Operations” and are prepared in accordance with GAAP. On January 1, 2022, we changed our segment composition and established the Real Assets Group. The Real Assets Group consists of the activities of the former Real Estate Group and the infrastructure and power strategy, now referred to as infrastructure opportunities, that was formerly presented within the Private Equity Group. The Real Assets Group also includes infrastructure debt following the Infrastructure Debt Acquisition. We reclassified activities from the infrastructure opportunities strategy in the Private Equity Group and from the former Real Estate Group to the Real Assets Group to better align the segment presentation with how the asset classes within the investment strategies are managed. Historical periods have been modified to conform to the current period presentation. The following table sets forth FRE and RI by reportable segment and OMG ($ in thousands):
| Three months ended June 30, | Favorable (Unfavorable) | Six months ended June 30, | Favorable (Unfavorable) | |||||||||||||||||||||||||||||||||||||||||||||||
| 2022 | 2021 | $ Change | % Change | 2022 | 2021 | $ Change | % Change | |||||||||||||||||||||||||||||||||||||||||||
| Fee Related Earnings: | ||||||||||||||||||||||||||||||||||||||||||||||||||
| Credit Group | $ | 218,998 | $ | 169,053 | $ | 49,945 | 30% | $ | 417,883 | $ | 317,257 | $ | 100,626 | 32% | ||||||||||||||||||||||||||||||||||||
| Private Equity Group | 15,631 | 12,363 | 3,268 | 26 | 36,031 | 30,275 | 5,756 | 19 | ||||||||||||||||||||||||||||||||||||||||||
| Real Assets Group | 49,025 | 19,850 | 29,175 | 147 | 88,462 | 37,133 | 51,329 | 138 | ||||||||||||||||||||||||||||||||||||||||||
| Secondary Solutions Group | 28,111 | 7,750 | 20,361 | 263 | 57,897 | 7,750 | 50,147 | NM | ||||||||||||||||||||||||||||||||||||||||||
| Strategic Initiatives | 8,282 | 9,642 | (1,360) | (14) | 16,019 | 18,569 | (2,550) | (14) | ||||||||||||||||||||||||||||||||||||||||||
| Operations Management Group | (100,268) | (71,503) | (28,765) | (40) | (190,843) | (134,566) | (56,277) | (42) | ||||||||||||||||||||||||||||||||||||||||||
| Fee Related Earnings | $ | 219,779 | $ | 147,155 | 72,624 | 49 | $ | 425,449 | $ | 276,418 | 149,031 | 54 | ||||||||||||||||||||||||||||||||||||||
| Realized Income: | ||||||||||||||||||||||||||||||||||||||||||||||||||
| Credit Group | $ | 242,631 | $ | 199,458 | $ | 43,173 | 22% | $ | 447,026 | $ | 350,207 | $ | 96,819 | 28% | ||||||||||||||||||||||||||||||||||||
| Private Equity Group | 12,869 | 29,114 | (16,245) | (56) | 33,427 | 50,985 | (17,558) | (34) | ||||||||||||||||||||||||||||||||||||||||||
| Real Assets Group | 55,603 | 32,126 | 23,477 | 73 | 110,965 | 52,439 | 58,526 | 112 | ||||||||||||||||||||||||||||||||||||||||||
| Secondary Solutions Group | 29,396 | 7,747 | 21,649 | 279 | 59,361 | 7,747 | 51,614 | NM | ||||||||||||||||||||||||||||||||||||||||||
| Strategic Initiatives | 8,188 | 10,067 | (1,879) | (19) | 10,951 | 16,725 | (5,774) | (35) | ||||||||||||||||||||||||||||||||||||||||||
| Operations Management Group | (101,442) | (71,565) | (29,877) | (42) | (192,468) | (134,363) | (58,105) | (43) | ||||||||||||||||||||||||||||||||||||||||||
| Realized Income | $ | 247,245 | $ | 206,947 | 40,298 | 19 | $ | 469,262 | $ | 343,740 | 125,522 | 37 |
NM - Not Meaningful
Income before provision for income taxes is the GAAP financial measure most comparable to RI and FRE. The following table presents the reconciliation of income before taxes as reported in the Condensed Consolidated Statements of Operations to RI and FRE of the reportable segments and OMG ($ in thousands):
| Three months ended June 30, | Six months ended June 30, | ||||||||||||||||||||||
| 2022 | 2021 | 2022 | 2021 | ||||||||||||||||||||
| Income before taxes | $ | 67,066 | $ | 319,777 | $ | 228,375 | $ | 509,841 | |||||||||||||||
| Adjustments: | |||||||||||||||||||||||
| Depreciation and amortization expense | 40,330 | 20,974 | 78,456 | 35,074 | |||||||||||||||||||
| Equity compensation expense | 50,144 | 69,504 | 103,161 | 125,153 | |||||||||||||||||||
| Acquisition-related compensation expense(1) | 59,491 | 4,630 | 107,492 | 4,630 | |||||||||||||||||||
| Acquisition and merger-related expense | 1,152 | 9,020 | 10,194 | 17,610 | |||||||||||||||||||
| Placement fees | (1,425) | 1,030 | (2,118) | 1,327 | |||||||||||||||||||
| Other expense, net | 12 | 619 | 1,993 | 146 | |||||||||||||||||||
| Net (income) expense of non-controlling interests in consolidated subsidiaries | 4,022 | (4,035) | (967) | (3,346) | |||||||||||||||||||
| (Income) loss before taxes of non-controlling interests in Consolidated Funds, net of eliminations | 14,999 | (5,073) | (32,408) | (54,959) | |||||||||||||||||||
| Total performance (income) loss—unrealized | 24,031 | (741,426) | (109,501) | (966,380) | |||||||||||||||||||
| Total performance related compensation—unrealized | (8,549) | 566,012 | 82,649 | 726,349 | |||||||||||||||||||
| Total net investment (income) loss—unrealized | (4,028) | (34,085) | 1,936 | (51,705) | |||||||||||||||||||
| Realized Income | 247,245 | 206,947 | 469,262 | 343,740 | |||||||||||||||||||
| Total performance income—realized | (70,094) | (127,013) | (113,962) | (201,958) | |||||||||||||||||||
| Total performance related compensation—realized | 44,058 | 90,080 | 72,633 | 149,937 | |||||||||||||||||||
| Total investment income—realized | (1,430) | (22,859) | (2,484) | (15,301) | |||||||||||||||||||
| Fee Related Earnings | $ | 219,779 | $ | 147,155 | $ | 425,449 | $ | 276,418 |
(1)Represents earnouts in connection with the Landmark Acquisition, the Black Creek Acquisition and the Infrastructure Debt Acquisition that are recorded as compensation expense and are presented within compensation and benefits in the Company’s Condensed Consolidated Statements of Operations.
For the specific components and calculations of these non-GAAP measures, as well as a reconciliation of the reportable segments to the most comparable measures in accordance with GAAP, see “Note 15. Segment Reporting” to our unaudited condensed consolidated financial statements included in this Quarterly Report on Form 10-Q. Discussed below are our results of operations for our reportable segments and OMG.
Results of Operations by Segment
Credit Group—Three and Six Months Ended June 30, 2022 Compared to Three and Six Months Ended June 30, 2021
Fee Related Earnings:
The following table presents the components of the Credit Group's FRE ($ in thousands):
| Three months ended June 30, | Favorable (Unfavorable) | Six months ended June 30, | Favorable (Unfavorable) | ||||||||||||||||||||||||||||||||||||||||||||
| 2022 | 2021 | $ Change | % Change | 2022 | 2021 | $ Change | % Change | ||||||||||||||||||||||||||||||||||||||||
| Management fees | $ | 323,171 | $ | 260,234 | $ | 62,937 | 24% | $ | 626,330 | $ | 493,111 | $ | 133,219 | 27% | |||||||||||||||||||||||||||||||||
| Fee related performance revenues | 275 | (39) | 314 | NM | 12,628 | 1,331 | 11,297 | NM | |||||||||||||||||||||||||||||||||||||||
| Other fees | 6,619 | 6,727 | (108) | (2) | 12,385 | 12,696 | (311) | (2) | |||||||||||||||||||||||||||||||||||||||
| Compensation and benefits | (93,287) | (85,892) | (7,395) | (9) | (198,983) | (167,095) | (31,888) | (19) | |||||||||||||||||||||||||||||||||||||||
| General, administrative and other expenses | (17,780) | (11,977) | (5,803) | (48) | (34,477) | (22,786) | (11,691) | (51) | |||||||||||||||||||||||||||||||||||||||
| Fee Related Earnings | $ | 218,998 | $ | 169,053 | 49,945 | 30 | $ | 417,883 | $ | 317,257 | 100,626 | 32 |
NM - Not Meaningful
Management Fees. The chart below presents Credit Group management fees and effective management fee rates ($ in millions):

Management fees on existing funds increased primarily from deployment of capital with Pathfinder, ACE V, SDL and Ares Private Credit Solutions II, L.P. (“PCS II”) collectively generating additional fees of $23.8 million and $50.7 million for the three and six months ended June 30, 2022, respectively, compared to the three and six months ended June 30, 2021. The launch of Ares Senior Direct Lending Fund II, L.P. (“SDL II”) at the end of the second quarter of 2021 also contributed to the increase in management fees, generating fees of $9.5 million and $17.3 million for the three and six months ended June 30,
- Management fees from ARCC, excluding Part I Fees described below, increased by $14.4 million and $29.6 million for the three and six months ended June 30, 2022, respectively, primarily due to an increase in the average size of ARCC's portfolio. The remaining increases in management fees from funds in existence in both periods was primarily driven by deployment of capital in other direct lending funds and SMAs. Management fees from CLOs also increased primarily due to the net addition of six CLOs from the prior year.
Part I Fees increased for the three and six months ended June 30, 2022 compared to the three and six months ended June 30, 2021 primarily due to an increase in pre-incentive fee net investment income generated by CADC, driven by an increase in the average size of its portfolio. The increase in the average size of CADC’s portfolio was driven by an increase in originations and by the partial allocation of the middle market lending portfolio acquired from Annaly Capital Management, Inc. The increase in Part I Fees was partially offset by lower fees generated from ARCC due to the decrease in its pre-incentive net investment income for the three months ended June 30, 2022 compared to the same period in the prior year, while an increase in ARCC’s pre-incentive net investment income contributed to the overall increase for the six months ended June 30, 2022 compared to same period in the prior year.
The decreases in effective management fee rate for the three and six months ended June 30, 2022 compared to the three and six months ended June 30, 2021 were primarily driven by growth in lower fee generating strategies such as CLOs and our alternative credit funds, as well as deployment in SDL and SDL II that have fee rates below 1.00%.
Fee Related Performance Revenues. Fee related performance revenues increased by $11.3 million for the six months ended June 30, 2022 compared to the six months ended June 30, 2021. The increase was primarily attributable to fee related performance revenues from three direct lending funds for the six months ended June 30, 2022 compared to one direct lending fund for the six months ended June 30, 2021. We expect the majority of our fee related performance revenues to be recognized in the fourth quarter in connection with the typical measurement period end date of each applicable fund’s performance against the annual performance hurdles.
Compensation and Benefits. Compensation and benefits increased by $7.4 million, or 9%, for the three months ended June 30, 2022 compared to the three months ended June 30, 2021 and by $31.9 million, or 19%, for the six months ended June 30, 2022 compared to the six months ended June 30, 2021. The increases were primarily driven by headcount growth and higher incentive compensation attributable to increased fee revenues and improved operating performance. The first quarter of 2022 included fee related performance compensation of $7.4 million from direct lending SMAs and payroll related taxes of $7.2 million primarily attributable to the increase in restricted unit awards that vested in the first quarter of 2022.
Average headcount for the year-to-date period increased by 4% to 435 investment and investment support professionals for the second quarter of 2022 from 417 professionals for the same period in 2021 as we added additional professionals to support our growing U.S. and European direct lending and alternative credit platforms.
General, Administrative and Other Expenses. General, administrative and other expenses increased by $5.8 million, or 48%, for the three months ended June 30, 2022 compared to the three months ended June 30, 2021 and by $11.7 million, or 51%, for the six months ended June 30, 2022 compared to the six months ended June 30, 2021. Travel, marketing sponsorships and certain fringe benefits collectively increased by $2.9 million and $5.4 million for the three and six months ended June 30, 2022, respectively, when compared to the same periods in 2021, as marketing and company events returned to pre-pandemic levels and travel continues to ramp up toward historical levels. In connection with our fundraising efforts, placement fees and certain supplemental distribution fees have also collectively increased by $1.2 million and $2.6 million for the three and six months ended June 30, 2022, respectively, when compared to the same periods in 2021. The increases were primarily associated with new commitments to PCS II and SDL II.
Realized Income:
The following table presents the components of the Credit Group's RI ($ in thousands):
| Three months ended June 30, | Favorable (Unfavorable) | Six months ended June 30, | Favorable (Unfavorable) | ||||||||||||||||||||||||||||||||||||||||||||
| 2022 | 2021 | $ Change | % Change | 2022 | 2021 | $ Change | % Change | ||||||||||||||||||||||||||||||||||||||||
| Fee Related Earnings | $ | 218,998 | $ | 169,053 | $ | 49,945 | 30 | % | $ | 417,883 | $ | 317,257 | $ | 100,626 | 32% | ||||||||||||||||||||||||||||||||
| Performance income—realized | 48,533 | 68,146 | (19,613) | (29) | 55,896 | 70,592 | (14,696) | (21) | |||||||||||||||||||||||||||||||||||||||
| Performance related compensation—realized | (29,358) | (43,485) | 14,127 | 32 | (33,938) | (45,540) | 11,602 | 25 | |||||||||||||||||||||||||||||||||||||||
| Realized net performance income | 19,175 | 24,661 | (5,486) | (22) | 21,958 | 25,052 | (3,094) | (12) | |||||||||||||||||||||||||||||||||||||||
| Investment income—realized | 1,609 | 1,240 | 369 | 30 | 2,024 | 1,240 | 784 | 63 | |||||||||||||||||||||||||||||||||||||||
| Interest and other investment income—realized | 6,387 | 5,969 | 418 | 7 | 12,113 | 9,638 | 2,475 | 26 | |||||||||||||||||||||||||||||||||||||||
| Interest expense | (3,538) | (1,465) | (2,073) | (142) | (6,952) | (2,980) | (3,972) | (133) | |||||||||||||||||||||||||||||||||||||||
| Realized net investment income | 4,458 | 5,744 | (1,286) | (22) | 7,185 | 7,898 | (713) | (9) | |||||||||||||||||||||||||||||||||||||||
| Realized Income | $ | 242,631 | $ | 199,458 | 43,173 | 22 | $ | 447,026 | $ | 350,207 | 96,819 | 28 |
Realized net performance income for the three and six months ended June 30, 2022 was primarily attributable to tax distributions from ACE III, ACE IV and PCS, and incentive fees from one alternative credit fund. Realized net performance income for the three and six months ended June 30, 2021 was primarily attributable to tax distributions on direct lending funds with European-style waterfalls, driven by net investment income.
Realized net investment income for the three and six months ended June 30, 2022 and 2021 was primarily attributable to interest income generated from our CLO investments. Realized net investment income for the three and six months ended June 30, 2022 is driven by liquidating distributions from a European direct lending fund and also includes income recognized in connection with distributions from a commercial finance fund. Interest expense, which is allocated based on the cost basis of investments, increased over the comparative periods primarily due to the issuance of the 2051 Subordinated Notes and the 2052 Senior Notes in June 2021 and January 2022, respectively.
Credit Group—Performance Income
The following table presents the accrued carried interest, also referred to as accrued performance income, and related performance compensation for the Credit Group. Accrued net performance income excludes net performance income that has been realized but not yet received as of the reporting date ($ in thousands):
| As of June 30, 2022 | As of December 31, 2021 | ||||||||||||||||||||||||||||||||||
| Accrued Performance Income | Accrued Performance Compensation | Accrued Net Performance Income | Accrued Performance Income | Accrued Performance Compensation | Accrued Net Performance Income | ||||||||||||||||||||||||||||||
| ACE III | $ | 101,574 | $ | 60,944 | $ | 40,630 | $ | 99,551 | $ | 59,731 | $ | 39,820 | |||||||||||||||||||||||
| ACE IV | 149,259 | 92,541 | 56,718 | 146,580 | 90,879 | 55,701 | |||||||||||||||||||||||||||||
| ACE V | 87,587 | 52,552 | 35,035 | 51,482 | 30,889 | 20,593 | |||||||||||||||||||||||||||||
| PCS | 117,428 | 69,187 | 48,241 | 132,050 | 77,780 | 54,270 | |||||||||||||||||||||||||||||
| PCS II | — | — | — | 9,053 | 5,345 | 3,708 | |||||||||||||||||||||||||||||
| Other credit funds | 174,523 | 125,111 | 49,412 | 156,717 | 105,064 | 51,653 | |||||||||||||||||||||||||||||
| Total Credit Group | $ | 630,371 | $ | 400,335 | $ | 230,036 | $ | 595,433 | $ | 369,688 | $ | 225,745 |
The following table presents the change in accrued performance income for the Credit Group ($ in thousands):
| As of December 31, 2021 | Activity during the period | As of June 30, 2022 | |||||||||||||||||||||||||||||||||||||||
| Waterfall Type | Accrued Performance Income | Change in Unrealized | Realized | Foreign Exchange and Other Adjustments | Accrued Performance Income | ||||||||||||||||||||||||||||||||||||
| Accrued Carried Interest | |||||||||||||||||||||||||||||||||||||||||
| ACE III | European | $ | 99,551 | $ | 8,971 | $ | (7,446) | $ | 498 | $ | 101,574 | ||||||||||||||||||||||||||||||
| ACE IV | European | 146,580 | 20,307 | (18,779) | 1,151 | 149,259 | |||||||||||||||||||||||||||||||||||
| ACE V | European | 51,482 | 36,105 | — | — | 87,587 | |||||||||||||||||||||||||||||||||||
| PCS | European | 132,050 | 9,822 | (24,143) | (301) | 117,428 | |||||||||||||||||||||||||||||||||||
| PCS II | European | 9,053 | (8,908) | — | (145) | — | |||||||||||||||||||||||||||||||||||
| Other credit funds | European | 156,453 | 25,216 | (2,364) | (5,043) | 174,262 | |||||||||||||||||||||||||||||||||||
| Other credit funds | American | 264 | (3) | — | — | 261 | |||||||||||||||||||||||||||||||||||
| Total accrued carried interest | 595,433 | 91,510 | (52,732) | (3,840) | 630,371 | ||||||||||||||||||||||||||||||||||||
| Other credit funds | Incentive | — | 3,164 | (3,164) | — | — | |||||||||||||||||||||||||||||||||||
| Total Credit Group | $ | 595,433 | $ | 94,674 | $ | (55,896) | $ | (3,840) | $ | 630,371 |
Credit Group—Assets Under Management
The tables below present rollforwards of AUM for the Credit Group ($ in millions):
| Syndicated Loans | High Yield | Multi-Asset Credit | Alternative Credit | U.S. Direct Lending | European Direct Lending | Total Credit Group | |||||||||||||||||||||||||||||||||||||||||
| Balance at 3/31/2022 | $ | 32,385 | $ | 3,553 | $ | 5,677 | $ | 18,594 | $ | 88,397 | $ | 48,317 | $ | 196,923 | |||||||||||||||||||||||||||||||||
| Net new par/equity commitments | 369 | 65 | 219 | 1,300 | 3,155 | 266 | 5,374 | ||||||||||||||||||||||||||||||||||||||||
| Net new debt commitments | 1,556 | — | — | — | 1,473 | 1,154 | 4,183 | ||||||||||||||||||||||||||||||||||||||||
| Capital reductions | (45) | — | — | — | (1) | (12) | (58) | ||||||||||||||||||||||||||||||||||||||||
| Distributions | (23) | (3) | 1 | (129) | (389) | (290) | (833) | ||||||||||||||||||||||||||||||||||||||||
| Redemptions | (114) | (89) | (41) | (95) | (55) | — | (394) | ||||||||||||||||||||||||||||||||||||||||
| Change in fund value | (591) | (329) | (477) | (421) | 130 | (1,596) | (3,284) | ||||||||||||||||||||||||||||||||||||||||
| Balance at 6/30/2022 | $ | 33,537 | $ | 3,197 | $ | 5,379 | $ | 19,249 | $ | 92,710 | $ | 47,839 | $ | 201,911 | |||||||||||||||||||||||||||||||||
| Syndicated Loans | High Yield | Multi-Asset Credit | Alternative Credit | U.S. Direct Lending | European Direct Lending | Total Credit Group | |||||||||||||||||||||||||||||||||||||||||
| Balance at 3/31/2021 | $ | 28,442 | $ | 2,927 | $ | 3,332 | $ | 13,943 | $ | 59,351 | $ | 43,121 | $ | 151,116 | |||||||||||||||||||||||||||||||||
| Net new par/equity commitments | 488 | 224 | 567 | 565 | 7,534 | 2,052 | 11,430 | ||||||||||||||||||||||||||||||||||||||||
| Net new debt commitments | 574 | — | — | — | 2,475 | 2,371 | 5,420 | ||||||||||||||||||||||||||||||||||||||||
| Capital reductions | (206) | — | — | — | (1,307) | (52) | (1,565) | ||||||||||||||||||||||||||||||||||||||||
| Distributions | (21) | — | (3) | (97) | (398) | (301) | (820) | ||||||||||||||||||||||||||||||||||||||||
| Redemptions | (78) | (74) | (62) | (180) | (44) | — | (438) | ||||||||||||||||||||||||||||||||||||||||
| Change in fund value | 107 | 75 | 95 | 262 | 975 | 930 | 2,444 | ||||||||||||||||||||||||||||||||||||||||
| Balance at 6/30/2021 | $ | 29,306 | $ | 3,152 | $ | 3,929 | $ | 14,493 | $ | 68,586 | $ | 48,121 | $ | 167,587 | |||||||||||||||||||||||||||||||||
| Syndicated Loans | High Yield | Multi-Asset Credit | Alternative Credit | U.S. Direct Lending | European Direct Lending | Total Credit Group | |||||||||||||||||||||||||||||||||||||||||
| Balance at 12/31/2021 | $ | 31,491 | $ | 3,632 | $ | 5,212 | $ | 17,424 | $ | 85,849 | $ | 49,102 | $ | 192,710 | |||||||||||||||||||||||||||||||||
| Net new par/equity commitments | 625 | 224 | 783 | 2,888 | 4,681 | 331 | 9,532 | ||||||||||||||||||||||||||||||||||||||||
| Net new debt commitments | 2,567 | — | — | — | 2,802 | 1,154 | 6,523 | ||||||||||||||||||||||||||||||||||||||||
| Capital reductions | (118) | — | — | — | (325) | (12) | (455) | ||||||||||||||||||||||||||||||||||||||||
| Distributions | (49) | (5) | 10 | (274) | (951) | (566) | (1,835) | ||||||||||||||||||||||||||||||||||||||||
| Redemptions | (180) | (174) | (61) | (299) | (90) | — | (804) | ||||||||||||||||||||||||||||||||||||||||
| Change in fund value | (799) | (480) | (565) | (490) | 744 | (2,170) | (3,760) | ||||||||||||||||||||||||||||||||||||||||
| Balance at 6/30/2022 | $ | 33,537 | $ | 3,197 | $ | 5,379 | $ | 19,249 | $ | 92,710 | $ | 47,839 | $ | 201,911 | |||||||||||||||||||||||||||||||||
| Syndicated Loans | High Yield | Multi-Asset Credit | Alternative Credit | U.S. Direct Lending | European Direct Lending | Total Credit Group | |||||||||||||||||||||||||||||||||||||||||
| Balance at 12/31/2020 | $ | 27,967 | $ | 2,863 | $ | 2,953 | $ | 12,897 | $ | 56,516 | $ | 42,276 | $ | 145,472 | |||||||||||||||||||||||||||||||||
| Net new par/equity commitments | 603 | 325 | 960 | 1,795 | 8,600 | 3,665 | 15,948 | ||||||||||||||||||||||||||||||||||||||||
| Net new debt commitments | 1,296 | — | — | — | 4,296 | 2,371 | 7,963 | ||||||||||||||||||||||||||||||||||||||||
| Capital reductions | (264) | — | — | — | (1,758) | (88) | (2,110) | ||||||||||||||||||||||||||||||||||||||||
| Distributions | (60) | — | (6) | (194) | (737) | (563) | (1,560) | ||||||||||||||||||||||||||||||||||||||||
| Redemptions | (167) | (157) | (140) | (415) | (85) | (11) | (975) | ||||||||||||||||||||||||||||||||||||||||
| Change in fund value | (69) | 121 | 162 | 410 | 1,754 | 471 | 2,849 | ||||||||||||||||||||||||||||||||||||||||
| Balance at 6/30/2021 | $ | 29,306 | $ | 3,152 | $ | 3,929 | $ | 14,493 | $ | 68,586 | $ | 48,121 | $ | 167,587 | |||||||||||||||||||||||||||||||||
The components of our AUM for the Credit Group are presented below ($ in billions):
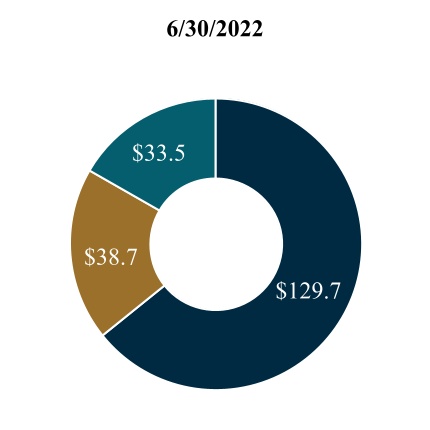
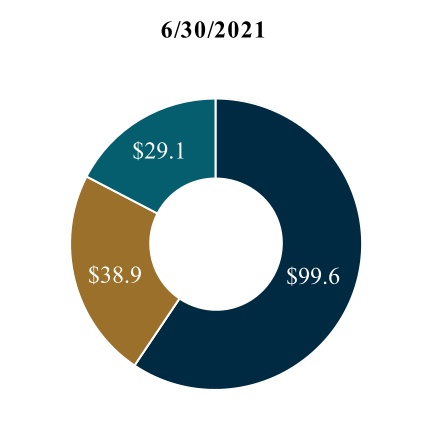
| AUM: $201.9 | AUM: $167.6 |
| FPAUM | AUM not yet paying fees | Non-fee paying(1) |
(1) Includes $12.4 billion and $8.5 billion of AUM of funds from which we indirectly earn management fees as of June 30, 2022 and 2021, respectively, and includes $1.0 billion and $0.9 billion of non-fee paying AUM based on our general partner commitment as of June 30, 2022 and 2021, respectively.
Credit Group—Fee Paying AUM
The tables below present rollforwards of fee paying AUM for the Credit Group ($ in millions):
| Syndicated Loans | High Yield | Multi-Asset Credit | Alternative Credit | U.S. Direct Lending | European Direct Lending | Total Credit Group | ||||||||||||||||||||||||||||||||||||||
| Balance at 3/31/2022 | $ | 30,301 | $ | 3,553 | $ | 5,189 | $ | 11,115 | $ | 47,187 | $ | 24,091 | $ | 121,436 | ||||||||||||||||||||||||||||||
| Commitments | 2,559 | 65 | 281 | 617 | 445 | — | 3,967 | |||||||||||||||||||||||||||||||||||||
| Subscriptions/deployment/increase in leverage | — | — | — | 1,112 | 4,847 | 2,454 | 8,413 | |||||||||||||||||||||||||||||||||||||
| Capital reductions | (45) | — | (29) | (14) | (49) | (55) | (192) | |||||||||||||||||||||||||||||||||||||
| Distributions | (16) | (3) | (19) | (92) | (608) | (115) | (853) | |||||||||||||||||||||||||||||||||||||
| Redemptions | (114) | (89) | (44) | (95) | (55) | (79) | (476) | |||||||||||||||||||||||||||||||||||||
| Change in fund value | (564) | (329) | (474) | (230) | 2 | (977) | (2,572) | |||||||||||||||||||||||||||||||||||||
| Balance at 6/30/2022 | $ | 32,121 | $ | 3,197 | $ | 4,904 | $ | 12,413 | $ | 51,769 | $ | 25,319 | $ | 129,723 | ||||||||||||||||||||||||||||||
| Syndicated Loans | High Yield | Multi-Asset Credit | Alternative Credit | U.S. Direct Lending | European Direct Lending | Total Credit Group | ||||||||||||||||||||||||||||||||||||||
| Balance at 3/31/2021 | $ | 26,800 | $ | 2,925 | $ | 2,833 | $ | 7,044 | $ | 32,301 | $ | 19,712 | $ | 91,615 | ||||||||||||||||||||||||||||||
| Commitments | 1,028 | 224 | 264 | 335 | 404 | — | 2,255 | |||||||||||||||||||||||||||||||||||||
| Subscriptions/deployment/increase in leverage | 695 | — | 314 | 685 | 3,408 | 1,440 | 6,542 | |||||||||||||||||||||||||||||||||||||
| Capital reductions | (206) | — | — | — | (29) | (213) | (448) | |||||||||||||||||||||||||||||||||||||
| Distributions | (12) | — | (27) | (137) | (493) | (321) | (990) | |||||||||||||||||||||||||||||||||||||
| Redemptions | (78) | (74) | (49) | (59) | (28) | (65) | (353) | |||||||||||||||||||||||||||||||||||||
| Change in fund value | (16) | 74 | 88 | 48 | 538 | 235 | 967 | |||||||||||||||||||||||||||||||||||||
| Balance at 6/30/2021 | $ | 28,211 | $ | 3,149 | $ | 3,423 | $ | 7,916 | $ | 36,101 | $ | 20,788 | $ | 99,588 | ||||||||||||||||||||||||||||||
| Syndicated Loans | High Yield | Multi-Asset Credit | Alternative Credit | U.S. Direct Lending | European Direct Lending | Total Credit Group | ||||||||||||||||||||||||||||||||||||||
| Balance at 12/31/2021 | $ | 30,327 | $ | 3,632 | $ | 4,714 | $ | 8,742 | $ | 46,128 | $ | 23,847 | $ | 117,390 | ||||||||||||||||||||||||||||||
| Commitments | 2,807 | 224 | 865 | 904 | 1,417 | — | 6,217 | |||||||||||||||||||||||||||||||||||||
| Subscriptions/deployment/increase in leverage | 1 | — | 5 | 3,566 | 7,320 | 4,440 | 15,332 | |||||||||||||||||||||||||||||||||||||
| Capital reductions | (118) | — | (29) | (25) | (1,394) | (1,212) | (2,778) | |||||||||||||||||||||||||||||||||||||
| Distributions | (29) | (5) | (27) | (315) | (1,825) | (352) | (2,553) | |||||||||||||||||||||||||||||||||||||
| Redemptions | (180) | (174) | (60) | (243) | (90) | (125) | (872) | |||||||||||||||||||||||||||||||||||||
| Change in fund value | (687) | (480) | (564) | (216) | 213 | (1,279) | (3,013) | |||||||||||||||||||||||||||||||||||||
| Balance at 6/30/2022 | $ | 32,121 | $ | 3,197 | $ | 4,904 | $ | 12,413 | $ | 51,769 | $ | 25,319 | $ | 129,723 | ||||||||||||||||||||||||||||||
| Syndicated Loans | High Yield | Multi-Asset Credit | Alternative Credit | U.S. Direct Lending | European Direct Lending | Total Credit Group | ||||||||||||||||||||||||||||||||||||||
| Balance at 12/31/2020 | $ | 27,171 | $ | 2,861 | $ | 2,457 | $ | 6,331 | $ | 32,337 | $ | 16,860 | $ | 88,017 | ||||||||||||||||||||||||||||||
| Commitments | 1,166 | 325 | 680 | 817 | 854 | — | 3,842 | |||||||||||||||||||||||||||||||||||||
| Subscriptions/deployment/increase in leverage | 695 | — | 314 | 1,303 | 4,310 | 4,460 | 11,082 | |||||||||||||||||||||||||||||||||||||
| Capital reductions | (264) | — | (18) | — | (754) | (248) | (1,284) | |||||||||||||||||||||||||||||||||||||
| Distributions | (22) | — | (34) | (240) | (1,547) | (471) | (2,314) | |||||||||||||||||||||||||||||||||||||
| Redemptions | (167) | (157) | (127) | (294) | (60) | (197) | (1,002) | |||||||||||||||||||||||||||||||||||||
| Change in fund value | (368) | 120 | 151 | (1) | 961 | 384 | 1,247 | |||||||||||||||||||||||||||||||||||||
| Balance at 6/30/2021 | $ | 28,211 | $ | 3,149 | $ | 3,423 | $ | 7,916 | $ | 36,101 | $ | 20,788 | $ | 99,588 | ||||||||||||||||||||||||||||||
The charts below present FPAUM for the Credit Group by its fee basis ($ in billions):
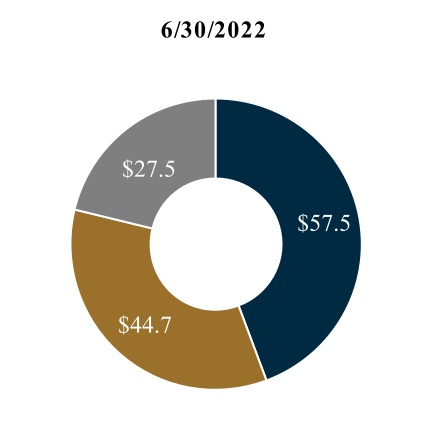
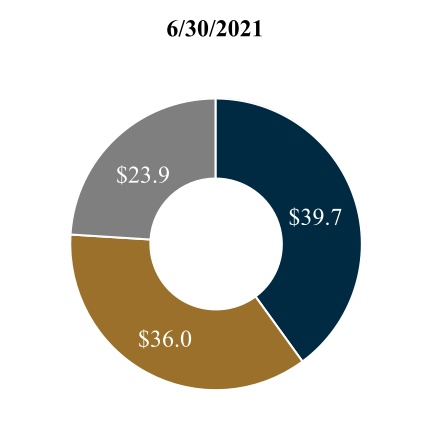
| FPAUM: $129.7 | FPAUM: $99.6 |
| Invested capital | Market value(1) | Collateral balances (at par) |
(1)Includes $29.6 billion and $22.7 billion from funds that primarily invest in illiquid strategies as of June 30, 2022 and 2021, respectively. The underlying investments held in these funds are generally subject to less market volatility than investments held in liquid strategies.
Credit Group—Fund Performance Metrics as of June 30, 2022
ARCC contributed approximately 41% of the Credit Group’s total management fees for the six months ended June 30, 2022. In addition, nine other significant funds, ACE III, ACE IV, ACE V, CADC, PCS, PCS II, SDL, SDL II and an open-ended secured finance fund, collectively contributed approximately 27% of the Credit Group’s management fees for the six months ended June 30, 2022.
The following table presents the performance data for our significant funds that are not drawdown funds in the Credit Group as of June 30, 2022 ($ in millions):
| Returns(%)****(1) | |||||||||||||||||||||||||||||||||||||||||||||||||||||
| Year of Inception | AUM | Current Quarter | Year-To-Date | Since Inception**(2)** | Primary Investment Strategy | ||||||||||||||||||||||||||||||||||||||||||||||||
| Fund | Gross | Net | Gross | Net | Gross | Net | |||||||||||||||||||||||||||||||||||||||||||||||
| ARCC(3) | 2004 | $ | 25,554 | N/A | 1.2 | N/A | 4.0 | N/A | 12.0 | U.S. Direct Lending | |||||||||||||||||||||||||||||||||||||||||||
| CADC(4) | 2017 | 4,029 | N/A | (3.9) | N/A | (3.2) | N/A | 5.3 | U.S. Direct Lending | ||||||||||||||||||||||||||||||||||||||||||||
| Open-ended secured finance fund(5) | 2018 | 1,979 | (1.8) | (1.9) | (1.4) | (1.7) | 2.5 | 1.8 | Alternative Credit | ||||||||||||||||||||||||||||||||||||||||||||
(1)Returns are time-weighted rates of return and include the reinvestment of income and other earnings from securities or other investments and reflect the deduction of all trading expenses.
(2)Since inception returns are annualized.
(3)Net returns are calculated using the fund's NAV and assume dividends are reinvested at the closest quarter-end NAV to the relevant quarterly ex-dividend dates. Additional information related to ARCC can be found in its financial statements filed with the SEC, which are not part of this report.
(4)Returns are shown for institutional share class. Net returns are calculated using the fund’s NAV and assume distributions are reinvested at the NAV on the date of distribution. Additional information related to CADC can be found in its financial statements filed with the SEC, which are not part of this report.
(5)Gross returns do not reflect the deduction of management fees or other expenses. Net returns are calculated by subtracting the applicable management fees and other expenses from the gross returns on a monthly basis. This fund is a master/feeder structure and its AUM and returns include activity from its' investment in an affiliated Ares fund. Returns presented in the table are expressed in U.S. Dollars and are for the master fund, excluding the share class hedges. The current quarter, year-to-date, and since inception returns (gross / net) for the pound sterling hedged Cayman feeder, the fund's sole feeder, are as follows: (1.9)% / (2.0)%, (1.5)% / (1.8)%, and 1.3% / 0.7%.
The following table presents the performance data of our significant drawdown funds as of June 30, 2022 ($ in millions):
| Year of Inception | AUM | Original Capital Commitments | Capital Invested to Date | Realized Value**(1)** | Unrealized Value**(2)** | Total Value | MoIC | IRR(%) | Primary Investment Strategy | ||||||||||||||||||||||||||||||||||||||||||||||||||||||||||||||
| Fund | Gross**(3)** | Net**(4)** | Gross**(5)** | Net**(6)** | |||||||||||||||||||||||||||||||||||||||||||||||||||||||||||||||||||
| Funds Harvesting Investments | |||||||||||||||||||||||||||||||||||||||||||||||||||||||||||||||||||||||
| ACE III(7) | 2015 | $ | 4,842 | $ | 2,822 | $ | 2,359 | $ | 1,033 | $ | 2,356 | $ | 3,389 | 1.6x | 1.4x | 11.8 | 8.5 | European Direct Lending | |||||||||||||||||||||||||||||||||||||||||||||||||||||
| PCS | 2017 | 3,684 | 3,365 | 2,653 | 1,434 | 2,084 | 3,518 | 1.4x | 1.3x | 12.6 | 9.0 | U.S. Direct Lending | |||||||||||||||||||||||||||||||||||||||||||||||||||||||||||
| Funds Deploying Capital | |||||||||||||||||||||||||||||||||||||||||||||||||||||||||||||||||||||||
| ACE IV Unlevered(8) | 2018 | 9,852 | 2,851 | 2,197 | 452 | 2,106 | 2,558 | 1.2x | 1.2x | 8.5 | 6.1 | European Direct Lending | |||||||||||||||||||||||||||||||||||||||||||||||||||||||||||
| ACE IV Levered(8) | 4,819 | 3,750 | 973 | 3,730 | 4,703 | 1.3x | 1.2x | 12.7 | 9.3 | ||||||||||||||||||||||||||||||||||||||||||||||||||||||||||||||
| SDL Unlevered | 2018 | 5,912 | 922 | 829 | 142 | 790 | 932 | 1.2x | 1.1x | 8.9 | 6.7 | U.S. Direct Lending | |||||||||||||||||||||||||||||||||||||||||||||||||||||||||||
| SDL Levered | 2,045 | 1,719 | 491 | 1,783 | 2,274 | 1.3x | 1.2x | 17.4 | 12.9 | ||||||||||||||||||||||||||||||||||||||||||||||||||||||||||||||
| ACE V Unlevered(9) | 2020 | 15,638 | 7,026 | 3,009 | 64 | 3,164 | 3,228 | 1.1x | 1.1x | 16.0 | 12.0 | European Direct Lending | |||||||||||||||||||||||||||||||||||||||||||||||||||||||||||
| ACE V Levered(9) | 6,376 | 2,729 | 99 | 2,954 | 3,053 | 1.1x | 1.1x | 25.6 | 19.1 | ||||||||||||||||||||||||||||||||||||||||||||||||||||||||||||||
| PCS II(10) | 2020 | 5,119 | 5,114 | 1,905 | — | 1,913 | 1,913 | 1.0x | 1.0x | 2.6 | 0.5 | U.S Direct Lending | |||||||||||||||||||||||||||||||||||||||||||||||||||||||||||
| SDL II Unlevered | 2021 | 13,405 | 1,989 | 529 | 8 | 542 | 550 | 1.1x | 1.0x | NM | NM | U.S Direct Lending | |||||||||||||||||||||||||||||||||||||||||||||||||||||||||||
| SDL II Levered | 5,936 | 1,503 | 46 | 1,558 | 1,604 | 1.1x | 1.1x | NM | NM |
- Fund performance metrics for significant funds may be marked as “NMˮ as it is not considered meaningful due to the limited time since the initial investment and/or early stage of capital deployment.
(1)Realized value represents the sum of all cash distributions to all partners and if applicable, exclude tax and incentive distributions made to the general partner.
(2)Unrealized value represents the fund's NAV reduced by the accrued incentive allocation, if applicable. There can be no assurance that unrealized values will be realized at the valuations indicated.
(3)The gross multiple of invested capital (“MoIC”) is calculated at the fund-level and is based on the interests of the fee-paying limited partners and if applicable, excludes interests attributable to the non-fee paying limited partners and/or the general partner which does not pay management fees or carried interest. The gross MoIC is before giving effect to management fees, carried interest and other expenses, as applicable, but after giving effect to credit facility interest expenses, as applicable. The funds may utilize a credit facility during the investment period and for general cash management purposes. Early in the life of a fund, the gross fund-level MoICs would generally have been lower had such fund called capital from its limited partners instead of utilizing the credit facility.
(4)The net MoIC is calculated at the fund-level and is based on the interests of the fee-paying limited partners and if applicable, excludes those interests attributable to the non-fee paying limited partners and/or the general partner which does not pay management fees or carried interest. The net MoIC is after giving effect to management fees and carried interest, other expenses and credit facility interest expenses, as applicable. The funds may utilize a credit facility during the investment period and for general cash management purposes. Early in the life of a fund, the net fund-level MoICs would generally have been lower had such fund called capital from its limited partners instead of utilizing the credit facility.
(5)The gross IRR is an annualized since inception gross internal rate of return of cash flows to and from the fund and the fund’s residual value at the end of the measurement period. Gross IRR reflects returns to the fee-paying limited partners and, if applicable, excludes interests attributable to the non-fee paying limited partners and/or the general partner which does not pay management fees or carried interest. The cash flow dates used in the gross IRR calculation are based on the actual dates of the cash flows. The gross IRRs are calculated before giving effect to management fees, carried interest and other expenses, as applicable, but after giving effect to credit facility interest expenses, as applicable. The funds may utilize a credit facility during the investment period and for general cash management purposes. Gross fund-level IRRs would generally have been lower had such fund called capital from its limited partners instead of utilizing the credit facility.
(6)The net IRR is an annualized since inception net internal rate of return of cash flows to and from the fund and the fund’s residual value at the end of the measurement period. Net IRRs reflect returns to the fee-paying limited partners and, if applicable, exclude interests attributable to the non-fee paying limited partners and/or the general partner which does not pay management fees or carried interest. The cash flow dates used in the net IRR calculations are based on the actual dates of the cash flows. The net IRRs are calculated after giving effect to management fees and carried interest, other expenses and credit facility interest expenses, as applicable. The funds may utilize a credit facility during the investment period and for general cash management purposes. Net fund-level IRRs would generally have been lower had such fund called capital from its limited partners instead of utilizing the credit facility.
(7)ACE III is made up of two feeder funds, one denominated in U.S. dollars and one denominated in Euros. The gross and net IRR and MoIC presented in the table are for the Euro denominated feeder fund. The gross and net IRR for the U.S. dollar denominated feeder fund are 12.4% and 9.1%, respectively. The gross and net MoIC for the U.S. dollar denominated feeder fund are 1.6x and 1.5x, respectively. Original capital commitments are converted to U.S. dollars at the prevailing exchange rate at the time of the fund's closing. All other values for ACE III are for the combined fund and are converted to U.S. dollars at the prevailing quarter-end exchange rate.
(8)ACE IV is made up of four parallel funds, two denominated in Euros and two denominated in pound sterling: ACE IV (E) Unlevered, ACE IV (G) Unlevered, ACE IV (E) Levered and ACE IV (G) Levered. The gross and net IRR and MoIC presented in the table are for ACE IV (E) Unlevered and ACE IV (E) Levered. Metrics for ACE IV (E) Levered are inclusive of a U.S. dollar denominated feeder fund, which has not been presented separately The gross and net IRR for ACE IV (G) Unlevered are 9.9% and 7.1%, respectively. The gross and net MoIC for ACE IV (G) Unlevered are 1.3x and 1.2x, respectively. The gross and net IRR for ACE IV (G) Levered are 13.7% and 9.9%, respectively. The gross and net MoIC for ACE IV (G) Levered are 1.4x and 1.3x, respectively. Original capital commitments are converted to U.S. dollars at the prevailing exchange rate at the time of the fund's closing. All other values for ACE IV Unlevered and ACE IV Levered are for the combined levered and unlevered parallel funds and are converted to U.S. dollars at the prevailing quarter-end exchange rate.
(9)ACE V is made up of four parallel funds, two denominated in Euros and two denominated in pound sterling: ACE V (E) Unlevered, ACE V (G) Unlevered, ACE V (E) Levered, and ACE V (G) Levered. The gross and net MoIC presented in the table are for ACE V (E) Unlevered and ACE V (E) Levered. Metrics for ACE V (E) Unlevered are inclusive of a Japanese yen denominated feeder fund, which has not been presented separately. Metrics for ACE V (E) Levered are inclusive of a U.S. dollar denominated feeder fund, which has not been presented separately. The gross and net IRR for ACE V (G) Unlevered are 16.3% and 12.1%, respectively. The gross and net MoIC for ACE V (G) Unlevered are 1.1x and 1.1x, respectively. The gross and net IRR for ACE V (G) Levered are 25.4% and 18.2%, respectively. The gross and net MoIC for ACE V (G) Levered are 1.1x and 1.1x, respectively. Original capital commitments are converted to U.S. dollars at the prevailing exchange rate at the time of the fund's closing. All other values for ACE V Unlevered and ACE V Levered are for the combined levered and unlevered parallel funds and are converted to U.S. dollars at the prevailing quarter-end exchange rate.
(10)Gross and net fund-level IRRs for PCS II are shown on a non-annualized basis as the time elapsed from the date of the first capital call is less than one year.
Private Equity Group—Three and Six Months Ended June 30, 2022 Compared to Three and Six Months Ended June 30, 2021
Fee Related Earnings:
The following table presents the components of the Private Equity Group's FRE ($ in thousands):
| Three months ended June 30, | Favorable (Unfavorable) | Six months ended June 30, | Favorable (Unfavorable) | ||||||||||||||||||||||||||||||||||||||||||||
| 2022 | 2021 | $ Change | % Change | 2022 | 2021 | $ Change | % Change | ||||||||||||||||||||||||||||||||||||||||
| Management fees | $ | 47,396 | $ | 39,975 | $ | 7,421 | 19% | $ | 93,353 | $ | 79,113 | $ | 14,240 | 18% | |||||||||||||||||||||||||||||||||
| Other fees | 408 | 248 | 160 | 65 | 705 | 356 | 349 | 98 | |||||||||||||||||||||||||||||||||||||||
| Compensation and benefits | (24,293) | (21,979) | (2,314) | (11) | (43,859) | (38,827) | (5,032) | (13) | |||||||||||||||||||||||||||||||||||||||
| General, administrative and other expenses | (7,880) | (5,881) | (1,999) | (34) | (14,168) | (10,367) | (3,801) | (37) | |||||||||||||||||||||||||||||||||||||||
| Fee Related Earnings | $ | 15,631 | $ | 12,363 | 3,268 | 26 | $ | 36,031 | $ | 30,275 | 5,756 | 19 |
Management Fees. The chart below presents Private Equity Group management fees and effective management fee rates ($ in millions):
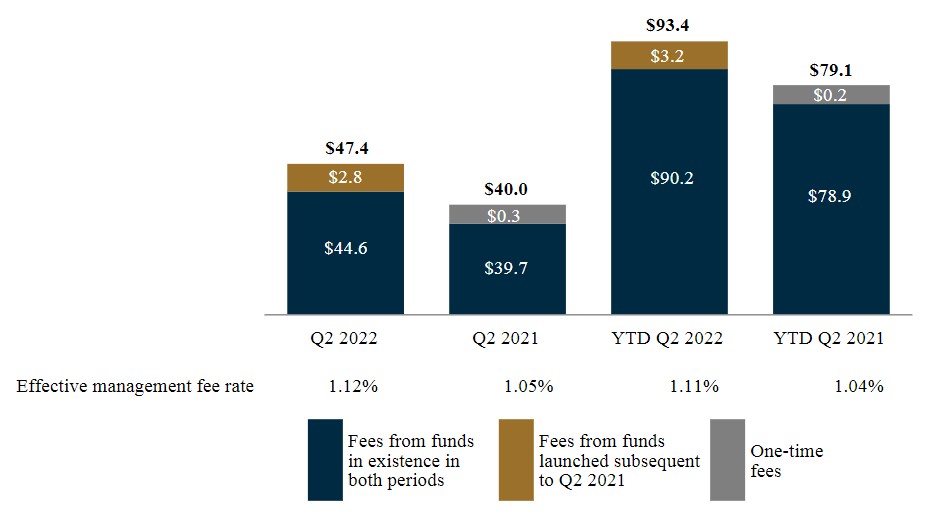
Management fees increased by $4.3 million and $9.1 million for the three and six months ended June 30, 2022, respectively, compared to the three and six months ended June 30, 2021 primarily due to new commitments in ACOF VI. Management fees also increased by $5.7 million and $10.8 million for the three and six months ended June 30, 2022, respectively, compared to the same periods in 2021 due to deployment in ASOF and our second special opportunities fund. When comparing the results of the three and six months ended June 30, 2022 with the three and six months ended June 30, 2021, the collective management fees from ACOF IV and ACOF V decreased by $2.0 million and $4.2 million, respectively, due to distributions that reduced the fee bases of the funds.
The increases in effective management fee rate for the three and six months ended June 30, 2022 compared to the three and six months ended June 30, 2021 were primarily driven by additional commitments to ACOF VI and increased deployment in ASOF and our second special opportunities fund, each of which have a higher effective management fee rate than the Private Equity Group’s average effective management fee rate.
Compensation and Benefits. Compensation and benefits increased by $2.3 million, or 11%, for the three months ended June 30, 2022 compared to the three months ended June 30, 2021 and by $5.0 million, or 13%, for the six months ended June 30, 2022 compared to the six months ended June 30, 2021. The increases were primarily driven by higher incentive compensation resulting from increased fee revenues and improved operating performance for the three and six months ended June 30, 2022, when compared to the same periods in 2021.
General, Administrative and Other Expenses. General, administrative and other expenses increased by $2.0 million, or 34%, for the three months ended June 30, 2022 compared to the three months ended June 30, 2021 and by $3.8 million, or 37%, for the six months ended June 30, 2022 compared to the six months ended June 30, 2021. Travel, marketing sponsorships and certain fringe benefits collectively increased by $1.3 million and $1.6 million for the three and six months ended June 30, 2022, respectively, when compared to the same periods in 2021, as marketing and company events returned to pre-pandemic levels and travel continues to ramp up toward historical levels. In connection with our fundraising efforts, placement fees has also increased by $1.1 million and $2.0 million for the three and six months ended June 30, 2022, respectively, when compared to the same periods in 2021. The increases were primarily associated with new commitments to our second special opportunities fund.
Realized Income:
The following table presents the components of the Private Equity Group's RI ($ in thousands):
| Three months ended June 30, | Favorable (Unfavorable) | Six months ended June 30, | Favorable (Unfavorable) | ||||||||||||||||||||||||||||||||||||||||||||
| 2022 | 2021 | $ Change | % Change | 2022 | 2021 | $ Change | % Change | ||||||||||||||||||||||||||||||||||||||||
| Fee Related Earnings | $ | 15,631 | $ | 12,363 | $ | 3,268 | 26 | % | $ | 36,031 | $ | 30,275 | $ | 5,756 | 19% | ||||||||||||||||||||||||||||||||
| Performance income—realized | — | 53,945 | (53,945) | (100) | 2,212 | 125,163 | (122,951) | (98) | |||||||||||||||||||||||||||||||||||||||
| Performance related compensation—realized | — | (43,197) | 43,197 | 100 | (1,786) | (100,223) | 98,437 | 98 | |||||||||||||||||||||||||||||||||||||||
| Realized net performance income | — | 10,748 | (10,748) | (100) | 426 | 24,940 | (24,514) | (98) | |||||||||||||||||||||||||||||||||||||||
| Investment income (loss)—realized | 672 | 2,633 | (1,961) | (74) | 2,275 | (6,265) | 8,540 | NM | |||||||||||||||||||||||||||||||||||||||
| Interest and other investment income—realized | 195 | 4,846 | (4,651) | (96) | 1,697 | 4,964 | (3,267) | (66) | |||||||||||||||||||||||||||||||||||||||
| Interest expense | (3,629) | (1,476) | (2,153) | (146) | (7,002) | (2,929) | (4,073) | (139) | |||||||||||||||||||||||||||||||||||||||
| Realized net investment income (loss) | (2,762) | 6,003 | (8,765) | NM | (3,030) | (4,230) | 1,200 | 28 | |||||||||||||||||||||||||||||||||||||||
| Realized Income | $ | 12,869 | $ | 29,114 | (16,245) | (56) | $ | 33,427 | $ | 50,985 | (17,558) | (34) |
NM - Not Meaningful
Realized net investment loss for the three and six months ended June 30, 2022 largely represents interest expense exceeding limited realization activity during these periods. Interest expense, which is allocated based on the cost basis of investments, has increased over the comparative periods primarily due to the issuance of the 2051 Subordinated Notes and the 2052 Senior Notes in June 2021 and January 2022, respectively.
The activity for the three and six months ended June 30, 2021 included realized net performance income and realized net investment income attributable to realizations from partial sales of ACOF IV’s position in AZEK. The activity for the six months ended June 30, 2021 also included a realized loss recognized in connection with an Asian corporate private equity fund’s sale of its investment in a dairy farm company. Realized net investment income (loss) for the three and six months ended June 30, 2021 also included interest expense allocations.
Private Equity Group—Performance Income
The following table presents the accrued carried interest, also referred to as accrued performance income, and related performance compensation for the Private Equity Group ($ in thousands):
| As of June 30, 2022 | As of December 31, 2021 | ||||||||||||||||||||||||||||||||||
| Accrued Performance Income | Accrued Performance Compensation | Accrued Net Performance Income | Accrued Performance Income | Accrued Performance Compensation | Accrued Net Performance Income | ||||||||||||||||||||||||||||||
| ACOF III | $ | 25,975 | $ | 20,780 | $ | 5,195 | $ | 43,510 | $ | 34,808 | $ | 8,702 | |||||||||||||||||||||||
| ACOF IV | 325,104 | 260,084 | 65,020 | 387,901 | 310,321 | 77,580 | |||||||||||||||||||||||||||||
| ACOF V | 705,783 | 564,626 | 141,157 | 666,074 | 532,859 | 133,215 | |||||||||||||||||||||||||||||
| ACOF VI | 104,135 | 83,308 | 20,827 | 73,261 | 58,608 | 14,653 | |||||||||||||||||||||||||||||
| ASOF | 342,564 | 239,795 | 102,769 | 338,857 | 237,200 | 101,657 | |||||||||||||||||||||||||||||
| Other funds | 34,307 | 20,613 | 13,694 | 33,526 | 21,787 | 11,739 | |||||||||||||||||||||||||||||
| Total Private Equity Group | $ | 1,537,868 | $ | 1,189,206 | $ | 348,662 | $ | 1,543,129 | $ | 1,195,583 | $ | 347,546 |
The following table presents the change in accrued carried interest for the Private Equity Group ($ in thousands):
| As of December 31, 2021 | Activity during the period | As of June 30, 2022 | |||||||||||||||||||||||||||||||||||||||
| Waterfall Type | Accrued Carried Interest | Change in Unrealized | Realized | Other Adjustments | Accrued Carried Interest | ||||||||||||||||||||||||||||||||||||
| ACOF III | American | $ | 43,510 | $ | (17,535) | $ | — | $ | — | $ | 25,975 | ||||||||||||||||||||||||||||||
| ACOF IV | American | 387,901 | (60,585) | (2,212) | — | 325,104 | |||||||||||||||||||||||||||||||||||
| ACOF V | American | 666,074 | 39,709 | — | — | 705,783 | |||||||||||||||||||||||||||||||||||
| ACOF VI | American | 73,261 | 30,874 | — | — | 104,135 | |||||||||||||||||||||||||||||||||||
| ASOF | European | 338,857 | 3,707 | — | — | 342,564 | |||||||||||||||||||||||||||||||||||
| Other funds | European | 7,356 | (6,992) | — | (316) | 48 | |||||||||||||||||||||||||||||||||||
| Other funds | American | 26,170 | 8,089 | — | — | 34,259 | |||||||||||||||||||||||||||||||||||
| Total Private Equity Group | $ | 1,543,129 | $ | (2,733) | $ | (2,212) | $ | (316) | $ | 1,537,868 |
Private Equity Group—Assets Under Management
The tables below present rollforwards of AUM for the Private Equity Group ($ in millions):
| Corporate Private Equity | Special Opportunities | Total Private Equity Group | ||||||||||||||||||||||||||||||||||||
| Balance at 3/31/2022 | $ | 21,206 | $ | 12,359 | $ | 33,565 | ||||||||||||||||||||||||||||||||
| Net new par/equity commitments | — | 230 | 230 | |||||||||||||||||||||||||||||||||||
| Capital reductions | (2) | (200) | (202) | |||||||||||||||||||||||||||||||||||
| Distributions | (105) | (33) | (138) | |||||||||||||||||||||||||||||||||||
| Change in fund value | 171 | (214) | (43) | |||||||||||||||||||||||||||||||||||
| Balance at 6/30/2022 | $ | 21,270 | $ | 12,142 | $ | 33,412 | ||||||||||||||||||||||||||||||||
| Corporate Private Equity | Special Opportunities | Total Private Equity Group | ||||||||||||||||||||||||||||||||||||
| Balance at 3/31/2021 | $ | 19,383 | $ | 5,990 | $ | 25,373 | ||||||||||||||||||||||||||||||||
| Net new par/equity commitments | 72 | — | 72 | |||||||||||||||||||||||||||||||||||
| Capital reductions | (2) | — | (2) | |||||||||||||||||||||||||||||||||||
| Distributions | (828) | (285) | (1,113) | |||||||||||||||||||||||||||||||||||
| Change in fund value | 1,978 | 602 | 2,580 | |||||||||||||||||||||||||||||||||||
| Balance at 6/30/2021 | $ | 20,603 | $ | 6,307 | $ | 26,910 | ||||||||||||||||||||||||||||||||
| Corporate Private Equity | Special Opportunities | Total Private Equity Group | ||||||||||||||||||||||||||||||||||||
| Balance at 12/31/2021 | $ | 21,639 | $ | 11,765 | $ | 33,404 | ||||||||||||||||||||||||||||||||
| Net new par/equity commitments | — | 800 | 800 | |||||||||||||||||||||||||||||||||||
| Capital reductions | (4) | (200) | (204) | |||||||||||||||||||||||||||||||||||
| Distributions | (390) | (131) | (521) | |||||||||||||||||||||||||||||||||||
| Change in fund value | 25 | (92) | (67) | |||||||||||||||||||||||||||||||||||
| Balance at 6/30/2022 | $ | 21,270 | $ | 12,142 | $ | 33,412 | ||||||||||||||||||||||||||||||||
| Corporate Private Equity | Special Opportunities | Total Private Equity Group | ||||||||||||||||||||||||||||||||||||
| Balance at 12/31/2020 | $ | 18,233 | $ | 5,721 | $ | 23,954 | ||||||||||||||||||||||||||||||||
| Net new par/equity commitments | 101 | (50) | 51 | |||||||||||||||||||||||||||||||||||
| Capital reductions | (5) | — | (5) | |||||||||||||||||||||||||||||||||||
| Distributions | (1,410) | (285) | (1,695) | |||||||||||||||||||||||||||||||||||
| Change in fund value | 3,684 | 921 | 4,605 | |||||||||||||||||||||||||||||||||||
| Balance at 6/30/2021 | $ | 20,603 | $ | 6,307 | $ | 26,910 | ||||||||||||||||||||||||||||||||
The components of our AUM for the Private Equity Group are presented below ($ in billions):

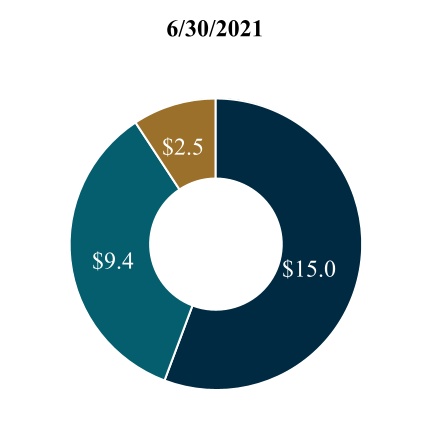
| AUM: $33.4 | AUM: $26.9 |
| FPAUM | Non-fee paying(1) | AUM not yet paying fees |
(1) Includes $1.2 billion and $1.2 billion of non-fee paying AUM based on our general partner commitment as of June 30, 2022 and 2021, respectively.
Private Equity Group—Fee Paying AUM
The tables below present rollforwards of fee paying AUM for the Private Equity Group ($ in millions):
| Corporate Private Equity | Special Opportunities | Total Private Equity Group | ||||||||||||||||||
| Balance at 3/31/2022 | $ | 12,186 | $ | 3,955 | $ | 16,141 | ||||||||||||||
| Subscriptions/deployment/increase in leverage | — | 2,099 | 2,099 | |||||||||||||||||
| Distributions | (51) | (479) | (530) | |||||||||||||||||
| Change in fund value | (3) | — | (3) | |||||||||||||||||
| Change in fee basis | (16) | — | (16) | |||||||||||||||||
| Balance at 6/30/2022 | $ | 12,116 | $ | 5,575 | $ | 17,691 | ||||||||||||||
| Corporate Private Equity | Special Opportunities | Total Private Equity Group | ||||||||||||||||||
| Balance at 3/31/2021 | $ | 11,807 | $ | 3,041 | $ | 14,848 | ||||||||||||||
| Commitments | 72 | — | 72 | |||||||||||||||||
| Subscriptions/deployment/increase in leverage | 338 | 336 | 674 | |||||||||||||||||
| Distributions | (450) | (118) | (568) | |||||||||||||||||
| Change in fund value | 1 | — | 1 | |||||||||||||||||
| Change in fee basis | (20) | — | (20) | |||||||||||||||||
| Balance at 6/30/2021 | $ | 11,748 | $ | 3,259 | $ | 15,007 | ||||||||||||||
| Corporate Private Equity | Special Opportunities | Total Private Equity Group | ||||||||||||||||||
| Balance at 12/31/2021 | $ | 12,473 | $ | 4,216 | $ | 16,689 | ||||||||||||||
| Subscriptions/deployment/increase in leverage | 17 | 2,196 | 2,213 | |||||||||||||||||
| Distributions | (138) | (837) | (975) | |||||||||||||||||
| Change in fund value | (2) | — | (2) | |||||||||||||||||
| Change in fee basis | (234) | — | (234) | |||||||||||||||||
| Balance at 6/30/2022 | $ | 12,116 | $ | 5,575 | $ | 17,691 | ||||||||||||||
| Corporate Private Equity | Special Opportunities | Total Private Equity Group | ||||||||||||||||||
| Balance at 12/31/2020 | $ | 14,770 | $ | 2,723 | $ | 17,493 | ||||||||||||||
| Commitments | 151 | — | 151 | |||||||||||||||||
| Subscriptions/deployment/increase in leverage | 446 | 820 | 1,266 | |||||||||||||||||
| Distributions | (861) | (284) | (1,145) | |||||||||||||||||
| Change in fee basis | (2,758) | — | (2,758) | |||||||||||||||||
| Balance at 6/30/2021 | $ | 11,748 | $ | 3,259 | $ | 15,007 | ||||||||||||||
The charts below present FPAUM for the Private Equity Group by its fee basis ($ in billions):
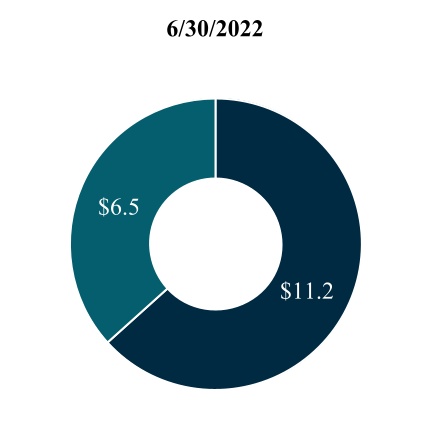
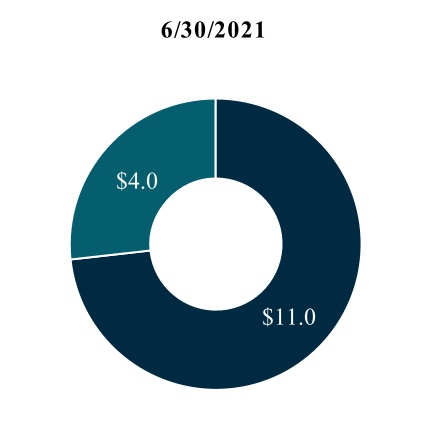
| FPAUM: $17.7 | FPAUM: $15.0 |
| Invested capital | Capital commitments |
Private Equity Group—Fund Performance Metrics as of June 30, 2022
Three significant funds, ACOF V, ASOF and ACOF VI, collectively contributed approximately 78% of the Private Equity Group’s management fees for the six months ended June 30, 2022.
The following table presents the performance data of our significant drawdown funds as of June 30, 2022 ($ in millions):
| Year of Inception | AUM | Original Capital Commitments | Capital Invested to Date | Realized Value**(1)** | Unrealized Value**(2)** | Total Value | MoIC | IRR(%) | Primary Investment Strategy | ||||||||||||||||||||||||||||||||||||||||||||||||||||||||||||||
| Fund | Gross**(3)** | Net**(4)** | Gross**(5)** | Net**(6)** | |||||||||||||||||||||||||||||||||||||||||||||||||||||||||||||||||||
| Funds Deploying Capital | |||||||||||||||||||||||||||||||||||||||||||||||||||||||||||||||||||||||
| ACOF V | 2017 | $ | 9,243 | $ | 7,850 | $ | 7,396 | $ | 3,201 | $ | 8,482 | $ | 11,683 | 1.6x | 1.4x | 15.6 | 11.1 | Corporate Private Equity | |||||||||||||||||||||||||||||||||||||||||||||||||||||
| ASOF | 2019 | 5,249 | 3,518 | 5,220 | 2,845 | 4,208 | 7,053 | 1.6x | 1.4x | 36.4 | 28.1 | Special Opportunities | |||||||||||||||||||||||||||||||||||||||||||||||||||||||||||
| ACOF VI | 2020 | 6,239 | 5,743 | 2,985 | 298 | 3,415 | 3,713 | 1.2x | 1.1x | 22.5 | 27.0 | Corporate Private Equity |
(1)Realized value represents the sum of all cash dividends, interest income, other fees and cash proceeds from realizations of interests in portfolio investments. Realized value excludes any proceeds related to bridge financings.
(2)Unrealized value represents the fair market value of remaining investments. Unrealized value does not take into account any bridge financings. There can be no assurance that unrealized investments will be realized at the valuations indicated.
(3)For the corporate private equity funds, the gross MoIC is calculated at the investment-level and is based on the interests of all partners. The gross MoIC is before giving effect to management fees, carried interest, as applicable, and other expenses. For the special opportunities funds, the gross MoIC is calculated at the fund-level and is based on the interests of the fee-paying limited partners and if applicable, excludes interests attributable to the non-fee paying limited partners and/or the general partner which does not pay management fees or carried interest. The gross MoIC is before giving effect to management fees, carried interest as applicable, and other expenses, but after giving effect to credit facility interest expenses, as applicable. The funds may utilize a credit facility during the investment period and for general cash management purposes. Early in the life of a fund, the gross fund-level MoICs would generally have been lower had such fund called capital from its limited partners instead of utilizing the credit facility. The gross MoICs for the corporate private equity funds are also calculated before giving effect to any bridge financings. Inclusive of bridge financings, the gross MoIC would be 1.5x for ACOF V and 1.2x for ACOF VI.
(4)The net MoIC for ASOF is calculated at the fund-level. The funds may utilize a credit facility during the investment period and for general cash management purposes. Early in the life of a fund, the net fund-level MoICs would generally have been lower had such fund called capital from its limited partners instead of utilizing the credit facility. The net MoIC for the corporate private equity funds is calculated at the investment level. For all funds, the net MoIC is based on the interests of the fee-paying limited partners and if applicable, excludes interests attributable to the non-fee paying limited partners and/or the general partner which does not pay management fees or performance fees. The net MoIC is after giving effect to management fees and carried interest, other expenses and credit facility interest expenses, as applicable. The net MoICs for the corporate private equity funds are also calculated before giving effect to any bridge financings. Inclusive of bridge financings, the net MoIC would be 1.3x for ACOF V and 1.1x for ACOF VI.
(5)For the corporate private equity funds, the gross IRR is an annualized since inception gross internal rate of return of cash flows to and from investments and the residual value of the investments at the end of the measurement period. Gross IRRs reflect returns to all partners. The cash flow dates used in the gross IRR calculation are based on the actual dates of the cash flows. The gross IRRs are calculated before giving effect to management fees, carried interest, as applicable, and other expenses. For the special opportunities funds the gross IRR is an annualized since inception gross internal rate of return of cash flows to and from the fund and the fund’s residual value at the end of the measurement period. Gross IRRs reflect returns to the fee-paying limited partners and, if applicable, excludes interests attributable to the non-fee paying limited partners and/or the general partner which does not pay management fees or carried interest. The cash flow dates used in the gross IRR calculation are based on the actual dates of the cash flows. The gross IRRs are calculated before giving effect to management fees, carried interest, as applicable, and other expenses, but after giving effect to credit facility interest expenses, as applicable. The gross IRRs for the corporate private equity funds are also calculated before giving effect to any bridge financings. Inclusive of bridge financings, the gross IRRs would be 15.5% for ACOF V and 21.4% for ACOF VI.
(6)The net IRR is an annualized since inception net internal rate of return of cash flows to and from the fund and the fund’s residual value at the end of the measurement period. Net IRRs reflect returns to the fee-paying limited partners and if applicable, exclude interests attributable to the non-fee paying limited partners and/or the general partner which does not pay management fees or carried interest. The cash flow dates used in the net IRR calculation are based on the actual dates of the cash flows. The net IRRs are calculated after giving effect to management fees, carried interest as applicable, and other expenses and exclude commitments by the general partner and non-fee paying limited partners who do not pay either management fees or carried interest. The funds may utilize a credit facility during the investment period and for general cash management purposes. Net fund-level IRRs would generally have been lower had such fund called capital from its limited partners instead of utilizing the credit facility. The net IRRs for the corporate private equity funds are also calculated before giving effect to any bridge financings. Inclusive of bridge financings, the net IRRs would be 11.2% for ACOF V and 21.9% for ACOF VI.
Real Assets Group—Three and Six Months Ended June 30, 2022 Compared to Three and Six Months Ended June 30, 2021
Fee Related Earnings:
The following table presents the components of the Real Assets Group's FRE ($ in thousands):
| Three months ended June 30, | Favorable (Unfavorable) | Six months ended June 30, | Favorable (Unfavorable) | ||||||||||||||||||||||||||||||||||||||||||||
| 2022 | 2021 | $ Change | % Change | 2022 | 2021 | $ Change | % Change | ||||||||||||||||||||||||||||||||||||||||
| Management fees | $ | 90,733 | $ | 42,932 | $ | 47,801 | 111% | $ | 163,220 | $ | 82,757 | $ | 80,463 | 97% | |||||||||||||||||||||||||||||||||
| Fee related performance revenues | 965 | 693 | 272 | 39 | 1,323 | 1,359 | (36) | (3) | |||||||||||||||||||||||||||||||||||||||
| Other fees | 8,565 | 275 | 8,290 | NM | 16,431 | 923 | 15,508 | NM | |||||||||||||||||||||||||||||||||||||||
| Compensation and benefits | (40,599) | (20,189) | (20,410) | (101) | (74,236) | (40,368) | (33,868) | (84) | |||||||||||||||||||||||||||||||||||||||
| General, administrative and other expenses | (10,639) | (3,861) | (6,778) | (176) | (18,276) | (7,538) | (10,738) | (142) | |||||||||||||||||||||||||||||||||||||||
| Fee Related Earnings | $ | 49,025 | $ | 19,850 | 29,175 | 147 | $ | 88,462 | $ | 37,133 | 51,329 | 138 |
NM - Not Meaningful
Management Fees. The chart below presents Real Assets Group management fees and effective management fee rates ($ in millions):
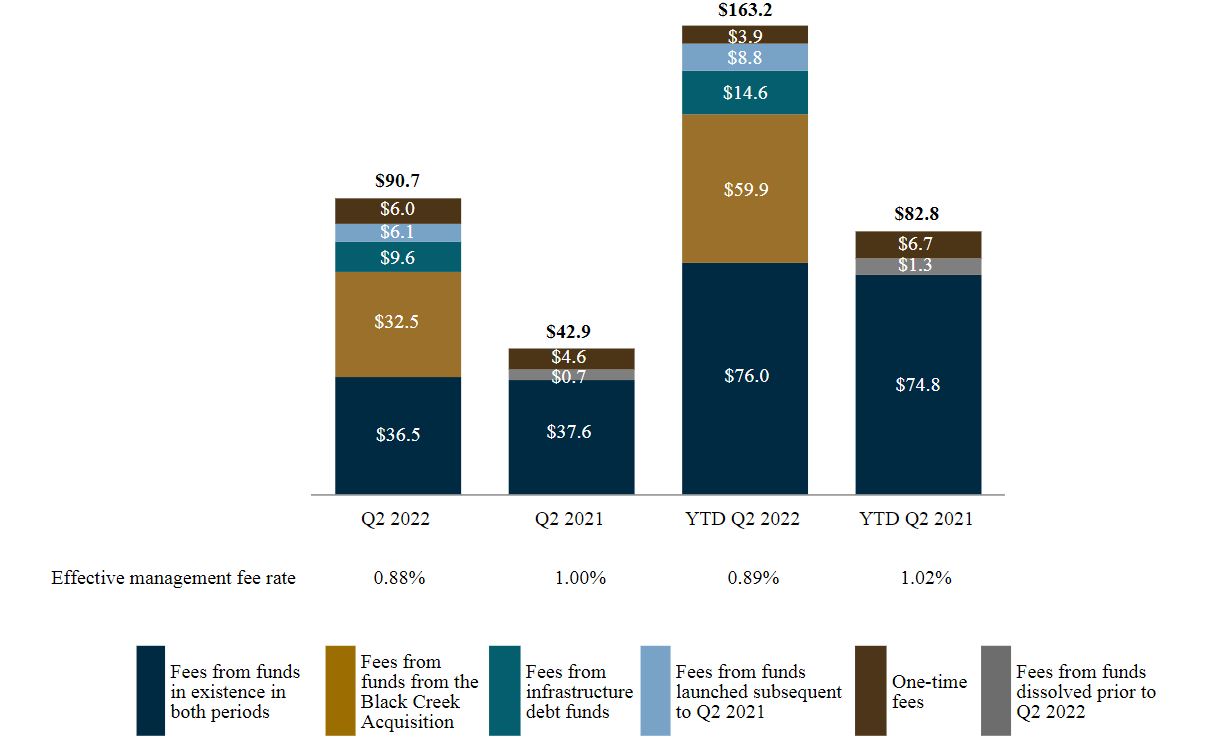
Management fees increased for the three and six months ended June 30, 2022 compared to the three and six months ended June 30, 2021 primarily due to funds from the Black Creek Acquisition and Infrastructure Debt Acquisition. Excluding one-time catch-up fees of $6.0 million and $3.9 million for the three and six months ended June 30, 2022, respectively, management fees also increased from new commitments to our tenth U.S. value add real estate fund and our sixth European real estate equity fund, collectively contributing fees of $7.0 million and $12.4 million for the three and six months ended June 30, 2022, respectively. Management fees from real estate debt funds increased by $2.2 million and $4.4 million for the three and six months ended June 30, 2022, respectively, compared to the three and six months ended June 30, 2021 primarily due to the continued fundraising and subsequent deployment within these open-ended funds.
The decreases in effective management fee rate for the three and six months ended June 30, 2022 compared to the three and six months ended June 30, 2021 were primarily due to recently acquired funds with effective management fees rates below 0.75%, including funds within our infrastructure debt strategy, our newly managed core/core-plus and industrial U.S. real estate equity funds and to increased deployment in our real estate debt funds. The decreases in effective management fee rates were partially offset by an increase in fee rates from other real estate equity funds. Our most recent real estate equity funds pay a fee on committed capital that increases once that capital is invested. As a result, our effective management fee rate decreases immediately following capital raising and increases as capital is subsequently deployed.
Other Fees. Other fees increased by $8.3 million for the three months ended June 30, 2022 compared to the three months ended June 30, 2021 and by $15.5 million for the six months ended June 30, 2022 compared to the six months ended June 30, 2021. These increases primarily represent fees that were generated under the investment management agreements of the funds that were acquired in the Black Creek Acquisition, including property-related fees, such as acquisition, development and property management. These property-related fees are recognized as services are performed which results in fluctuations in each period.
Compensation and Benefits. Compensation and benefits increased by $20.4 million, or 101%, for the three months ended June 30, 2022 compared to the three months ended June 30, 2021 and by $33.9 million, or 84%, for the six months ended June 30, 2022 compared to the six months ended June 30, 2021. Headcount growth attributable to the Black Creek Acquisition and Infrastructure Debt Acquisition have collectively contributed $15.7 million and $27.3 million to the increase in expenses for the three and six months ended June 30, 2022, respectively. Average headcount for the year-to-date period increased by 128% to 290 investment and investment support professionals for the second quarter of 2022 period from 127 professionals for the same period in 2021, including 138 professionals from the Black Creek Acquisition and the Infrastructure Debt Acquisition.
General, Administrative and Other Expenses. General, administrative and other expenses increased by $6.8 million, or 176%, for the three months ended June 30, 2022 compared to the three months ended June 30, 2021 and by $10.7 million, or 142%, for the six months ended June 30, 2022 compared to the six months ended June 30, 2021. The Black Creek Acquisition and Infrastructure Debt Acquisition have contributed general, administrative and other expenses of $4.1 million and $6.4 million for the three and six months ended June 30, 2022, respectively. These expenses were primarily driven by occupancy costs and information technology to support the expanding platform. During the second quarter of 2022, we also recognized $0.5 million in one-time expenses related to transition services received in connection with the Infrastructure Debt Acquisition.
Excluding the impact from the acquisitions, other operating expenses, most notably travel, marketing sponsorships and certain fringe benefits, collectively increased by $1.7 million and $2.6 million for the three and six months ended June 30, 2022, respectively, when compared to the same periods in 2021, as marketing and company events returned to pre-pandemic levels and travel continues to ramp up toward historical levels.
Realized Income:
The following table presents the components of the Real Assets Group's RI ($ in thousands):
| Three months ended June 30, | Favorable (Unfavorable) | Six months ended June 30, | Favorable (Unfavorable) | ||||||||||||||||||||||||||||||||||||||||||||
| 2022 | 2021 | $ Change | % Change | 2022 | 2021 | $ Change | % Change | ||||||||||||||||||||||||||||||||||||||||
| Fee Related Earnings | $ | 49,025 | $ | 19,850 | $ | 29,175 | 147% | $ | 88,462 | $ | 37,133 | $ | 51,329 | 138% | |||||||||||||||||||||||||||||||||
| Performance income—realized | 17,405 | 4,922 | 12,483 | 254 | 51,698 | 6,203 | 45,495 | NM | |||||||||||||||||||||||||||||||||||||||
| Performance related compensation—realized | (11,186) | (3,398) | (7,788) | (229) | (33,395) | (4,174) | (29,221) | NM | |||||||||||||||||||||||||||||||||||||||
| Realized net performance income | 6,219 | 1,524 | 4,695 | NM | 18,303 | 2,029 | 16,274 | NM | |||||||||||||||||||||||||||||||||||||||
| Investment income—realized | 432 | 10,530 | (10,098) | (96) | 3,885 | 12,036 | (8,151) | (68) | |||||||||||||||||||||||||||||||||||||||
| Interest and other investment income—realized | 2,640 | 1,511 | 1,129 | 75 | 5,417 | 3,865 | 1,552 | 40 | |||||||||||||||||||||||||||||||||||||||
| Interest expense | (2,713) | (1,289) | (1,424) | (110) | (5,102) | (2,624) | (2,478) | (94) | |||||||||||||||||||||||||||||||||||||||
| Realized net investment income | 359 | 10,752 | (10,393) | (97) | 4,200 | 13,277 | (9,077) | (68) | |||||||||||||||||||||||||||||||||||||||
| Realized Income | $ | 55,603 | $ | 32,126 | 23,477 | 73 | $ | 110,965 | $ | 52,439 | 58,526 | 112 |
NM - Not Meaningful
Realized net performance income and realized net investment income for the three and six months ended June 30, 2022 were primarily attributable to realizations from US VIII driven by multifamily property sales. Realized net performance income for the three and six months ended June 30, 2022 also included incentive fees generated from an industrial real estate fund and ACRE. Realized net investment income for the three and six months ended June 30, 2022 was also attributable to distributions from an infrastructure opportunities fund and from real estate debt vehicles, driven by operating income during the period.
Realized net performance income for the three and six months ended June 30, 2021 was primarily attributable to realizations from the sales of multiple properties held in U.S. and European real estate equity funds. Realized net investment income for the three and six months ended June 30, 2021 was primarily attributable to the sale of multiple properties held in a U.S. real estate equity fund and to distributions from real estate debt vehicles, driven by operating income during the period.
Realized net investment income for the three and six months ended June 30, 2022 and 2021 also included interest expense allocations based on the cost basis of investments. Interest expense, which is allocated based on the cost basis of investments, increased over the comparative periods primarily due to the issuance of the 2051 Subordinated Notes and the 2052 Senior Notes in June 2021 and January 2022, respectively.
Real Assets Group—Performance Income
The following table presents the accrued carried interest, also referred to as accrued performance income, and related performance compensation for the Real Assets Group. Accrued net performance income excludes net performance income that has been realized but not yet received as of the reporting date ($ in thousands):
| As of June 30, 2022 | As of December 31, 2021 | ||||||||||||||||||||||||||||||||||
| Accrued Performance Income | Accrued Performance Compensation | Accrued Net Performance Income | Accrued Performance Income | Accrued Performance Compensation | Accrued Net Performance Income | ||||||||||||||||||||||||||||||
| US VIII | $ | 52,169 | $ | 33,388 | $ | 18,781 | $ | 88,112 | $ | 56,391 | $ | 31,721 | |||||||||||||||||||||||
| US IX | 129,997 | 80,598 | 49,399 | 110,074 | 68,246 | 41,828 | |||||||||||||||||||||||||||||
| EF IV | 72,406 | 43,445 | 28,961 | 70,600 | 42,361 | 28,239 | |||||||||||||||||||||||||||||
| EF V | 59,959 | 41,971 | 17,988 | 69,946 | 48,962 | 20,984 | |||||||||||||||||||||||||||||
| AREOF III | 47,494 | 28,496 | 18,998 | 24,204 | 14,523 | 9,681 | |||||||||||||||||||||||||||||
| EIF V | 57,213 | 42,766 | 14,447 | 62,592 | 46,787 | 15,805 | |||||||||||||||||||||||||||||
| Other real assets funds | 154,228 | 93,908 | 60,320 | 113,932 | 68,599 | 45,333 | |||||||||||||||||||||||||||||
| Total Real Assets Group | $ | 573,466 | $ | 364,572 | $ | 208,894 | $ | 539,460 | $ | 345,869 | $ | 193,591 |
The following table presents the change in accrued performance income for the Real Assets Group ($ in thousands):
| As of December 31, 2021 | Activity during the period | As of June 30, 2022 | |||||||||||||||||||||||||||||||||||||||
| Waterfall Type | Accrued Performance Income | Change in Unrealized | Realized | Foreign Exchange and Other Adjustments | Accrued Performance Income | ||||||||||||||||||||||||||||||||||||
| Accrued Carried Interest | |||||||||||||||||||||||||||||||||||||||||
| US VIII | European | $ | 88,112 | $ | 12,125 | $ | (48,068) | $ | — | $ | 52,169 | ||||||||||||||||||||||||||||||
| US IX | European | 110,074 | 19,923 | — | — | 129,997 | |||||||||||||||||||||||||||||||||||
| EF IV | American | 70,600 | 1,806 | — | — | 72,406 | |||||||||||||||||||||||||||||||||||
| EF V | American | 69,946 | (9,987) | — | — | 59,959 | |||||||||||||||||||||||||||||||||||
| AREOF III | European | 24,204 | 23,290 | — | — | 47,494 | |||||||||||||||||||||||||||||||||||
| EIF V | European | 62,592 | (5,379) | — | — | 57,213 | |||||||||||||||||||||||||||||||||||
| Other real assets funds | European | 41,186 | 23,615 | (11) | 4,828 | 69,618 | |||||||||||||||||||||||||||||||||||
| Other real assets funds | American | 72,746 | 11,864 | — | — | 84,610 | |||||||||||||||||||||||||||||||||||
| Total accrued carried interest | 539,460 | 77,257 | (48,079) | 4,828 | 573,466 | ||||||||||||||||||||||||||||||||||||
| Other real assets funds | Incentive | — | 3,619 | (3,619) | — | — | |||||||||||||||||||||||||||||||||||
| Total Real Assets Group | $ | 539,460 | $ | 80,876 | $ | (51,698) | $ | 4,828 | $ | 573,466 |
Real Assets Group—Assets Under Management
The tables below present rollforwards of AUM for the Real Assets Group ($ in millions):
| U.S. Real Estate Equity | European Real Estate Equity | Real Estate Debt | Infrastructure Opportunities | Infrastructure Debt | Total Real Assets Group | |||||||||||||||||||||||||||||||||
| Balance at 3/31/2022 | $ | 27,961 | $ | 7,683 | $ | 10,225 | $ | 4,424 | $ | 8,234 | $ | 58,527 | ||||||||||||||||||||||||||
| Net new par/equity commitments | 1,699 | 835 | 629 | 65 | 137 | 3,365 | ||||||||||||||||||||||||||||||||
| Net new debt commitments | 400 | 419 | 625 | — | — | 1,444 | ||||||||||||||||||||||||||||||||
| Capital reductions | — | — | (34) | — | — | (34) | ||||||||||||||||||||||||||||||||
| Distributions | (303) | (51) | (48) | (299) | (186) | (887) | ||||||||||||||||||||||||||||||||
| Redemptions | (38) | — | (45) | — | — | (83) | ||||||||||||||||||||||||||||||||
| Change in fund value | 552 | (328) | 20 | 126 | (125) | 245 | ||||||||||||||||||||||||||||||||
| Balance at 6/30/2022 | $ | 30,271 | $ | 8,558 | $ | 11,372 | $ | 4,316 | $ | 8,060 | $ | 62,577 | ||||||||||||||||||||||||||
| U.S. Real Estate Equity | European Real Estate Equity | Real Estate Debt | Infrastructure Opportunities | Infrastructure Debt | Total Real Assets Group | |||||||||||||||||||||||||||||||||
| Balance at 3/31/2021 | $ | 4,909 | $ | 4,770 | $ | 7,450 | $ | 3,646 | $ | — | $ | 20,775 | ||||||||||||||||||||||||||
| Acquisitions | 760 | 784 | 394 | 268 | — | 2,206 | ||||||||||||||||||||||||||||||||
| Net new debt commitments | — | — | 525 | — | — | 525 | ||||||||||||||||||||||||||||||||
| Distributions | (256) | (201) | (35) | (282) | — | (774) | ||||||||||||||||||||||||||||||||
| Redemptions | — | — | (7) | — | — | (7) | ||||||||||||||||||||||||||||||||
| Change in fund value | 289 | 295 | 48 | 190 | — | 822 | ||||||||||||||||||||||||||||||||
| Balance at 6/30/2021 | $ | 5,702 | $ | 5,648 | $ | 8,375 | $ | 3,822 | $ | — | $ | 23,547 | ||||||||||||||||||||||||||
| U.S. Real Estate Equity | European Real Estate Equity | Real Estate Debt | Infrastructure Opportunities | Infrastructure Debt | Total Real Assets Group | |||||||||||||||||||||||||||||||||
| Balance at 12/31/2021 | $ | 24,677 | $ | 6,827 | $ | 9,659 | $ | 4,756 | $ | — | $ | 45,919 | ||||||||||||||||||||||||||
| Acquisitions | — | — | — | — | 8,184 | 8,184 | ||||||||||||||||||||||||||||||||
| Net new par/equity commitments | 3,297 | 2,018 | 856 | 65 | 187 | 6,423 | ||||||||||||||||||||||||||||||||
| Net new debt commitments | 1,105 | 419 | 1,025 | — | — | 2,549 | ||||||||||||||||||||||||||||||||
| Capital reductions | (234) | — | (63) | — | — | (297) | ||||||||||||||||||||||||||||||||
| Distributions | (1,054) | (359) | (95) | (321) | (186) | (2,015) | ||||||||||||||||||||||||||||||||
| Redemptions | (129) | — | (90) | — | — | (219) | ||||||||||||||||||||||||||||||||
| Change in fund value | 2,609 | (347) | 80 | (184) | (125) | 2,033 | ||||||||||||||||||||||||||||||||
| Balance at 6/30/2022 | $ | 30,271 | $ | 8,558 | $ | 11,372 | $ | 4,316 | $ | 8,060 | $ | 62,577 | ||||||||||||||||||||||||||
| U.S. Real Estate Equity | European Real Estate Equity | Real Estate Debt | Infrastructure Opportunities | Infrastructure Debt | Total Real Assets Group | |||||||||||||||||||||||||||||||||
| Balance at 12/31/2020 | $ | 4,404 | $ | 4,811 | $ | 5,593 | $ | 3,485 | $ | — | $ | 18,293 | ||||||||||||||||||||||||||
| Net new par/equity commitments | 1,194 | 878 | 597 | 268 | — | 2,937 | ||||||||||||||||||||||||||||||||
| Net new debt commitments | — | — | 2,405 | — | — | 2,405 | ||||||||||||||||||||||||||||||||
| Capital reductions | — | — | (232) | — | — | (232) | ||||||||||||||||||||||||||||||||
| Distributions | (300) | (296) | (68) | (335) | — | (999) | ||||||||||||||||||||||||||||||||
| Redemptions | — | — | (7) | — | — | (7) | ||||||||||||||||||||||||||||||||
| Change in fund value | 404 | 255 | 87 | 404 | — | 1,150 | ||||||||||||||||||||||||||||||||
| Balance at 6/30/2021 | $ | 5,702 | $ | 5,648 | $ | 8,375 | $ | 3,822 | $ | — | $ | 23,547 | ||||||||||||||||||||||||||
The components of our AUM for the Real Assets Group are presented below ($ in billions):
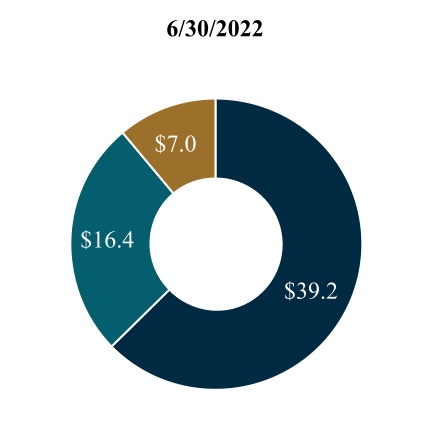
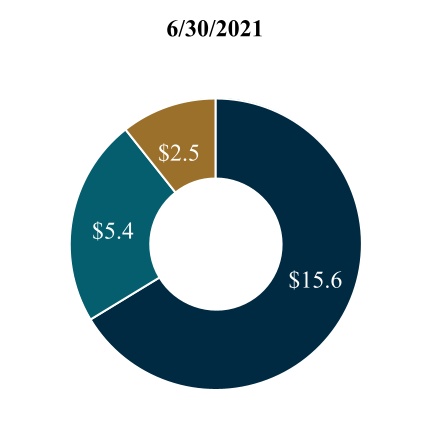
| AUM: $62.6 | AUM: $23.5 |
| FPAUM | Non-fee paying(1) | AUM not yet paying fees |
(1) Includes $0.6 billion and $0.3 billion of non-fee paying AUM based on our general partner commitment as of June 30, 2022 and 2021, respectively.
Real Assets Group—Fee Paying AUM
The tables below present rollforwards of fee paying AUM for the Real Assets Group ($ in millions):
| U.S. Real Estate Equity | European Real Estate Equity | Real Estate Debt | Infrastructure Opportunities | Infrastructure Debt | Total Real Assets Group | |||||||||||||||||||||||||||||||||
| Balance at 3/31/2022 | $ | 18,039 | $ | 5,012 | $ | 3,855 | $ | 4,323 | $ | 4,898 | $ | 36,127 | ||||||||||||||||||||||||||
| Commitments | 1,522 | 452 | 103 | — | — | 2,077 | ||||||||||||||||||||||||||||||||
| Subscriptions/deployment/increase in leverage | 255 | 163 | 194 | 151 | 759 | 1,522 | ||||||||||||||||||||||||||||||||
| Capital reductions | — | (10) | (80) | — | — | (90) | ||||||||||||||||||||||||||||||||
| Distributions | (207) | (27) | (88) | — | (48) | (370) | ||||||||||||||||||||||||||||||||
| Redemptions | (38) | — | (53) | — | — | (91) | ||||||||||||||||||||||||||||||||
| Change in fund value | 363 | (238) | 22 | — | (91) | 56 | ||||||||||||||||||||||||||||||||
| Balance at 6/30/2022 | $ | 19,934 | $ | 5,352 | $ | 3,953 | $ | 4,474 | $ | 5,518 | $ | 39,231 | ||||||||||||||||||||||||||
| U.S. Real Estate Equity | European Real Estate Equity | Real Estate Debt | Infrastructure Opportunities | Infrastructure Debt | Total Real Assets Group | |||||||||||||||||||||||||||||||||
| Balance at 3/31/2021 | $ | 4,036 | $ | 4,016 | $ | 2,768 | $ | 3,679 | $ | — | $ | 14,499 | ||||||||||||||||||||||||||
| Commitments | 608 | 357 | 102 | 268 | — | 1,335 | ||||||||||||||||||||||||||||||||
| Subscriptions/deployment/increase in leverage | 17 | 27 | 343 | — | — | 387 | ||||||||||||||||||||||||||||||||
| Distributions | (165) | (86) | (137) | (47) | — | (435) | ||||||||||||||||||||||||||||||||
| Redemptions | — | — | (7) | — | — | (7) | ||||||||||||||||||||||||||||||||
| Change in fund value | 1 | 25 | 44 | — | — | 70 | ||||||||||||||||||||||||||||||||
| Change in fee basis | (132) | — | — | (175) | — | (307) | ||||||||||||||||||||||||||||||||
| Balance at 6/30/2021 | $ | 4,365 | $ | 4,339 | $ | 3,113 | $ | 3,725 | $ | — | $ | 15,542 | ||||||||||||||||||||||||||
| U.S. Real Estate Equity | European Real Estate Equity | Real Estate Debt | Infrastructure Opportunities | Infrastructure Debt | Total Real Assets Group | |||||||||||||||||||||||||||||||||
| Balance at 12/31/2021 | $ | 15,687 | $ | 4,916 | $ | 3,516 | $ | 4,496 | $ | — | $ | 28,615 | ||||||||||||||||||||||||||
| Acquisitions | — | — | — | — | 4,855 | 4,855 | ||||||||||||||||||||||||||||||||
| Commitments | 2,548 | 1,607 | 106 | — | — | 4,261 | ||||||||||||||||||||||||||||||||
| Subscriptions/deployment/increase in leverage | 611 | 257 | 563 | 199 | 802 | 2,432 | ||||||||||||||||||||||||||||||||
| Capital reductions | — | (10) | (81) | — | — | (91) | ||||||||||||||||||||||||||||||||
| Distributions | (623) | (235) | (134) | (221) | (48) | (1,261) | ||||||||||||||||||||||||||||||||
| Redemptions | (129) | — | (100) | — | — | (229) | ||||||||||||||||||||||||||||||||
| Change in fund value | 1,848 | (364) | 83 | — | (91) | 1,476 | ||||||||||||||||||||||||||||||||
| Change in fee basis | (8) | (819) | — | — | — | (827) | ||||||||||||||||||||||||||||||||
| Balance at 6/30/2022 | $ | 19,934 | $ | 5,352 | $ | 3,953 | $ | 4,474 | $ | 5,518 | $ | 39,231 | ||||||||||||||||||||||||||
| U.S. Real Estate Equity | European Real Estate Equity | Real Estate Debt | Infrastructure Opportunities | Infrastructure Debt | Total Real Assets Group | |||||||||||||||||||||||||||||||||
| Balance at 12/31/2020 | $ | 3,659 | $ | 4,088 | $ | 2,505 | $ | 3,679 | $ | — | $ | 13,931 | ||||||||||||||||||||||||||
| Commitments | 909 | 451 | 202 | 268 | — | 1,830 | ||||||||||||||||||||||||||||||||
| Subscriptions/deployment/increase in leverage | 136 | 37 | 551 | — | — | 724 | ||||||||||||||||||||||||||||||||
| Capital reductions | — | — | (32) | — | — | (32) | ||||||||||||||||||||||||||||||||
| Distributions | (208) | (140) | (180) | (47) | — | (575) | ||||||||||||||||||||||||||||||||
| Redemptions | — | — | (7) | — | — | (7) | ||||||||||||||||||||||||||||||||
| Change in fund value | 1 | (97) | 74 | — | — | (22) | ||||||||||||||||||||||||||||||||
| Change in fee basis | (132) | — | — | (175) | — | (307) | ||||||||||||||||||||||||||||||||
| Balance at 6/30/2021 | $ | 4,365 | $ | 4,339 | $ | 3,113 | $ | 3,725 | $ | — | $ | 15,542 | ||||||||||||||||||||||||||
The charts below present FPAUM for the Real Assets Group by its fee basis ($ in billions):
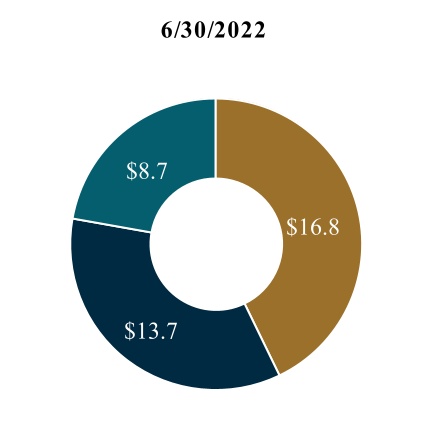
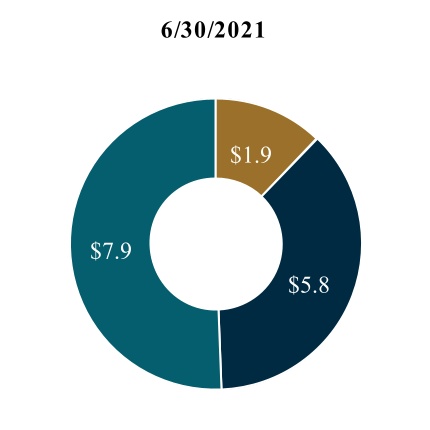
| FPAUM: $39.2 | FPAUM: $15.6 |
| Market value(1) | Invested capital/other(2) | Capital commitments |
(1)Amounts represent FPAUM from funds that primarily invest in illiquid strategies. The underlying investments held in these funds are generally subject to less market volatility than investments held in liquid strategies.
(2)Other consists of ACRE's FPAUM, which is based on ACRE’s stockholders’ equity.
Real Assets Group—Fund Performance Metrics as of June 30, 2022
Four significant funds, Ares Industrial Real Estate Income Trust, Inc. (“AIREIT”), Ares Real Estate Income Trust, Inc. (“AREIT”), Infrastructure Debt Fund IV (“IDF IV”) and an open-ended industrial real estate fund, collectively contributed approximately 40% of the Real Assets Group’s management fees for the six months ended June 30, 2022.
The following table presents the performance data for our significant funds that are not drawdown funds in the Real Assets Group as of June 30, 2022 ($ in millions):
| Returns(%)****(1) | |||||||||||||||||||||||||||||||||||||||||||||||||||||
| Year of Inception | AUM | Current Quarter | Year-To-Date | Since Inception**(2)** | Primary Investment Strategy | ||||||||||||||||||||||||||||||||||||||||||||||||
| Fund | Gross | Net | Gross | Net | Gross | Net | |||||||||||||||||||||||||||||||||||||||||||||||
| AREIT(3) | 2012 | $ | 4,565 | N/A | 3.1 | N/A | 10.8 | N/A | 8.1 | U.S. Real Estate Equity | |||||||||||||||||||||||||||||||||||||||||||
| AIREIT(4) | 2017 | 7,606 | N/A | 6.3 | N/A | 24.5 | N/A | 15.3 | U.S. Real Estate Equity | ||||||||||||||||||||||||||||||||||||||||||||
| Open-ended industrial real estate fund(5) | 2017 | 5,804 | 0.6 | 0.3 | 20.6 | 17.1 | 30.4 | 25.0 | U.S. Real Estate Equity |
(1)Returns are time-weighted rates of return and include the reinvestment of income and other earnings from securities or other investments and reflect the deduction of all trading expenses.
(2)Since inception returns are annualized.
(3)Returns are shown for institutional share class. Net returns are calculated using the fund’s NAV and assume distributions are reinvested at the NAV on the date of distribution. The inception date used in the calculation of the since inception return is the date in which the first shares of common stock were sold after converting to a NAV-based REIT. Additional information related to AREIT can be found in its financial statements filed with the SEC, which are not part of this report.
(4)Returns are shown for institutional share class. Net returns are calculated using the fund’s NAV and assume distributions are reinvested at the NAV on the date of distribution. Additional information related to AIREIT can be found in its financial statements filed with the SEC, which are not part of this report.
(5)Gross returns do not reflect the deduction of management fees, incentive fees, as applicable, or other expenses. Net returns are calculated by subtracting the applicable management fees, incentive fees, as applicable and other expenses from the gross returns on a quarterly basis.
The following table presents the performance data of our significant drawdown fund as of June 30, 2022 ($ in millions):
| Year of Inception | AUM | Original Capital Commitments | Capital Invested to Date | Realized Value**(1)** | Unrealized Value**(2)** | Total Value | MoIC | IRR(%) | Primary Investment Strategy | ||||||||||||||||||||||||||||||||||||||||||||||||||||||||||||||
| Fund | Gross**(3)** | Net**(4)** | Gross**(5)** | Net**(6)** | |||||||||||||||||||||||||||||||||||||||||||||||||||||||||||||||||||
| Fund Harvesting Investments | |||||||||||||||||||||||||||||||||||||||||||||||||||||||||||||||||||||||
| IDF IV(7) | 2018 | $ | 3,302 | $ | 4,012 | $ | 3,782 | $ | 1,608 | $ | 3,144 | $ | 4,752 | 1.1x | 1.1x | 7.6 | 5.4 | Infrastructure Debt | |||||||||||||||||||||||||||||||||||||||||||||||||||||
(1)Realized value includes distributions of operating income, sales and financing proceeds received.
(2)Unrealized value represents the fair market value of remaining investments. Unrealized value does not take into account any bridge financings. There can be no assurance that unrealized investments will be realized at the valuations indicated.
(3)The gross MoIC is calculated at the fund level and is based on the interests of the fee-paying limited partners and if applicable, excludes interests attributable to the non-fee paying limited partners and/or the general partner which does not pay management fees or carried interest. The gross MoIC is before giving effect to management fees, carried interest as applicable and other expenses. The funds may utilize a credit facility during the investment period and for general cash management purposes. Early in the life of a fund, the gross fund-level MoICs would generally have been lower had such fund called capital from its limited partners instead of utilizing the credit facility.
(4)The net MoIC is calculated at the fund-level and is based on the interests of the fee-paying limited partners and, if applicable, excludes interests attributable to the non fee-paying limited partners and/or the general partner which does not pay management fees or carried interest. The net MoIC is after giving effect to management fees, carried interest, as applicable, credit facility interest expense, as applicable, and other expenses. The funds may utilize a credit facility during the investment period and for general cash management purposes. Early in the life of a fund, the net fund-level MoICs would generally have been lower had such fund called capital from its limited partners instead of utilizing the credit facility.
(5)The gross IRR is an annualized since inception gross internal rate of return of cash flows to and from the fund and the fund’s residual value at the end of the measurement period. Gross IRR reflects returns to the fee-paying limited partners and, if applicable, excludes interests attributable to the non-fee paying limited partners and/or the general partner which does not pay management fees or carried interest. The cash flow dates used in the gross IRR calculation are based on the actual dates of the cash flows. The gross IRRs are calculated before giving effect to management fees, carried interest and other expenses, as applicable. The funds may utilize a credit facility during the investment period and for general cash management purposes. Gross fund-level IRRs would generally have been lower had such fund called capital from its limited partners instead of utilizing the credit facility.
(6)The net IRR is an annualized since inception net internal rate of return of cash flows to and from the fund and the fund’s residual value at the end of the measurement period. Net IRRs reflect returns to the fee-paying limited partners and, if applicable, exclude interests attributable to the non-fee paying limited partners and/or the general partner which does not pay management fees or carried interest. The cash flow dates used in the net IRR calculations are based on the actual dates of the cash flows. The net IRRs are calculated after giving effect to management fees and carried interest, other expenses and credit facility interest expenses, as applicable. The funds may utilize a credit facility during the investment period and for general cash management purposes. Net fund-level IRRs would generally have been lower had such fund called capital from its limited partners instead of utilizing the credit facility.
(7)IDF IV is made up of U.S. Dollar hedged, U.S. Dollar unhedged, Euro unhedged, Yen hedged parallel funds and a single investor U.S. Dollar parallel fund. The gross and net IRR and MoIC presented in the table are for the U.S. Dollar hedged parallel fund. The gross and net IRR for the U.S. Dollar unhedged parallel fund are 6.8% and 4.5%, respectively. The gross and net MoIC for the U.S. Dollar unhedged parallel fund are 1.1x and 1.1x, respectively. The gross and net IRR for the Euro unhedged parallel fund are 9.0% and 6.7%, respectively. The gross and net MoIC for the Euro unhedged parallel fund are 1.2x and 1.1x, respectively. The gross and net IRR for the Yen hedged parallel fund are 6.8% and 4.3%, respectively. The gross and net MoIC for the Yen hedged parallel fund are 1.1x and 1.1x, respectively. The gross and net IRR for the single investor U.S. Dollar parallel fund are 5.5% and 3.6%, respectively. The gross and net MoIC for the single investor U.S. Dollar parallel fund are 1.1x and 1.1x, respectively. Original capital commitments are converted to U.S. Dollars at the prevailing exchange rate at the time of fund's closing. All other values for IDF IV are for the combined fund and are converted to U.S. Dollars at the prevailing quarter-end exchange rate.
Secondary Solutions Group—Three and Six Months Ended June 30, 2022 Compared to the Period June 2, 2021 through June 30, 2021
The activity for the prior year period presented represents results subsequent to the Landmark Acquisition that closed on June 2, 2021 and is not comparable to the current year periods presented.
Fee Related Earnings:
The following table presents the components of the Secondary Solutions Group's FRE ($ in thousands):
| Three months ended June 30, 2022 | Six months ended June 30, 2022 | For the period June 2, 2021 through June 30, 2021 | |||||||||||||||
| Management fees | $ | 46,201 | $ | 90,705 | $ | 12,898 | |||||||||||
| Compensation and benefits | (15,133) | (26,773) | (4,289) | ||||||||||||||
| General, administrative and other expenses | (2,957) | (6,035) | (859) | ||||||||||||||
| Fee Related Earnings | $ | 28,111 | $ | 57,897 | $ | 7,750 |
Management Fees. The chart below presents Secondary Solutions Group management fees and effective management fee rates ($ in millions):

The activity for the periods presented represent management fees primarily from the Landmark Acquisition that closed on June 2, 2021. Management fees for the periods presented primarily consisted of fees from Landmark Equity Partners XV, L.P. (“LEP XV”), LEP XVI and LREP VIII. Collectively, these funds generated management fees of $24.4 million, $50.7 million, and $8.7 million for the three and six months ended June 30, 2022 and for the period from June 2, 2021 through June 30, 2021, respectively. Excluding one-time catch-up fees, management fees for the three and six months ended June 30, 2022 also included fees from our 17th private equity secondaries fund and ninth real estate secondaries fund, collectively generating $4.8 million and $9.7 million, respectively. The additional commitments to these funds also generated one-time catch-up fees of $4.1 million and $4.6 million for the three and six months ended June 30, 2022, respectively.
Realized Income:
The following table presents the components of the Secondary Solutions Group's RI ($ in thousands):
| Three months ended June 30, 2022 | Six months ended June 30, 2022 | For the period June 2, 2021 through June 30, 2021 | |||||||||||||||
| Fee Related Earnings | $ | 28,111 | $ | 57,897 | $ | 7,750 | |||||||||||
| Performance income—realized | 4,156 | 4,156 | — | ||||||||||||||
| Performance related compensation—realized | (3,514) | (3,514) | — | ||||||||||||||
| Realized net performance income | 642 | 642 | — | ||||||||||||||
| Interest and other investment income—realized | 2,200 | 2,844 | — | ||||||||||||||
| Interest Expense | (1,557) | (2,022) | — | ||||||||||||||
| Realized net investment income (loss) | 643 | 822 | (3) | ||||||||||||||
| Realized Income | $ | 29,396 | $ | 59,361 | $ | 7,747 |
Realized net performance income for the three and six months ended June 30, 2022 was primarily attributable to tax distributions from LREP VIII. Realized net investment income for the three and six months ended June 30, 2022 was primarily attributable to distributions from an infrastructure secondaries fund. Realized net investment income for the three and six months ended June 30, 2022 also included interest expense allocations based on the cost basis of investments.
Secondary Solutions Group—Performance Income
In the Secondary Solutions Group, we are entitled to carried interest from the funds with closings subsequent to the completion of the Landmark Acquisition and to carried interest we acquired through the purchase of an ownership interest in certain Landmark GP entities. The following table presents the accrued carried interest, also referred to as accrued performance income, and related performance compensation for the Secondary Solutions Group. Accrued net performance income excludes net performance income that has been realized but not yet received as of the reporting date ($ in thousands):
| As of June 30, 2022 | As of December 31, 2021 | ||||||||||||||||||||||||||||||||||||||||||||||||||||
| Accrued Performance Income | Accrued Performance Compensation | Accrued Net Performance Income | Accrued Performance Income | Accrued Performance Compensation | Accrued Net Performance Income | ||||||||||||||||||||||||||||||||||||||||||||||||
| LEP XVI | $ | 174,736 | $ | 148,526 | $ | 26,210 | $ | 159,490 | $ | 135,566 | $ | 23,924 | |||||||||||||||||||||||||||||||||||||||||
| LREP VIII | 103,395 | 87,886 | 15,509 | 80,772 | 68,656 | 12,116 | |||||||||||||||||||||||||||||||||||||||||||||||
| Other fee generating funds | 66,524 | 56,424 | 10,100 | 58,013 | 49,108 | 8,905 | |||||||||||||||||||||||||||||||||||||||||||||||
| Total Secondary Solutions Group | $ | 344,655 | $ | 292,836 | $ | 51,819 | $ | 298,275 | $ | 253,330 | $ | 44,945 |
The following table presents the change in accrued performance income for the Secondary Solutions Group ($ in thousands):
| As of December 31, 2021 | Activity during the period | As of June 30, 2022 | ||||||||||||||||||||||||||||||||||||
| Waterfall Type | Accrued Carried Interest | Change in Unrealized | Realized | Accrued Carried Interest | ||||||||||||||||||||||||||||||||||
| Accrued Carried Interest | ||||||||||||||||||||||||||||||||||||||
| LEP XVI | European | $ | 159,490 | $ | 15,246 | $ | — | $ | 174,736 | |||||||||||||||||||||||||||||
| LREP VIII | European | 80,772 | 26,273 | (3,650) | 103,395 | |||||||||||||||||||||||||||||||||
| Other fee generating funds | European | 58,013 | 8,621 | (110) | 66,524 | |||||||||||||||||||||||||||||||||
| Total accrued carried interest | 298,275 | 50,140 | (3,760) | 344,655 | ||||||||||||||||||||||||||||||||||
| Other secondary solutions funds | Incentive | — | 396 | (396) | — | |||||||||||||||||||||||||||||||||
| Total Secondary Solutions Group | $ | 298,275 | $ | 50,536 | $ | (4,156) | $ | 344,655 | ||||||||||||||||||||||||||||||
Secondary Solutions Group—Assets Under Management
The table below presents the rollforward of AUM for the Secondary Solutions Group ($ in millions):
| Private Equity Secondaries | Real Estate Secondaries | Infrastructure Secondaries | Total Secondary Solutions Group | |||||||||||||||||||||||
| Balance at 3/31/2022 | $ | 14,305 | $ | 7,530 | $ | 1,633 | $ | 23,468 | ||||||||||||||||||
| Net new par/equity commitments | 480 | 311 | 74 | 865 | ||||||||||||||||||||||
| Distributions | (178) | (267) | (106) | (551) | ||||||||||||||||||||||
| Change in fund value | 100 | (52) | 62 | 110 | ||||||||||||||||||||||
| Balance at 6/30/2022 | $ | 14,707 | $ | 7,522 | $ | 1,663 | $ | 23,892 | ||||||||||||||||||
| Private Equity Secondaries | Real Estate Secondaries | Infrastructure Secondaries | Total Secondary Solutions Group | |||||||||||||||||||||||
| Balance at 3/31/2021 | $ | — | $ | — | $ | — | $ | — | ||||||||||||||||||
| Acquisitions | 12,275 | 5,641 | 1,597 | 19,513 | ||||||||||||||||||||||
| Net new par/equity commitments | 100 | — | — | 100 | ||||||||||||||||||||||
| Distributions | (52) | (67) | (6) | (125) | ||||||||||||||||||||||
| Change in fund value | (7) | (4) | (1) | (12) | ||||||||||||||||||||||
| Balance at 6/30/2021 | $ | 12,316 | $ | 5,570 | $ | 1,590 | $ | 19,476 | ||||||||||||||||||
| Private Equity Secondaries | Real Estate Secondaries | Infrastructure Secondaries | Total Secondary Solutions Group | |||||||||||||||||||||||
| Balance at 12/31/2021 | $ | 13,833 | $ | 6,662 | $ | 1,624 | $ | 22,119 | ||||||||||||||||||
| Acquisitions | 199 | — | — | 199 | ||||||||||||||||||||||
| Net new par/equity commitments | 648 | 1,223 | 74 | 1,945 | ||||||||||||||||||||||
| Distributions | (287) | (687) | (152) | (1,126) | ||||||||||||||||||||||
| Change in fund value | 314 | 324 | 117 | 755 | ||||||||||||||||||||||
| Balance at 6/30/2022 | $ | 14,707 | $ | 7,522 | $ | 1,663 | $ | 23,892 | ||||||||||||||||||
| Private Equity Secondaries | Real Estate Secondaries | Infrastructure Secondaries | Total Secondary Solutions Group | |||||||||||||||||||||||
| Balance at 12/31/2020 | $ | — | $ | — | $ | — | $ | — | ||||||||||||||||||
| Acquisitions | 12,275 | 5,641 | 1,597 | 19,513 | ||||||||||||||||||||||
| Net new par/equity commitments | 100 | — | — | 100 | ||||||||||||||||||||||
| Distributions | (52) | (67) | (6) | (125) | ||||||||||||||||||||||
| Change in fund value | (7) | (4) | (1) | (12) | ||||||||||||||||||||||
| Balance at 6/30/2021 | $ | 12,316 | $ | 5,570 | $ | 1,590 | $ | 19,476 | ||||||||||||||||||
The components of our AUM for the Secondary Solutions Group are presented below ($ in billions):
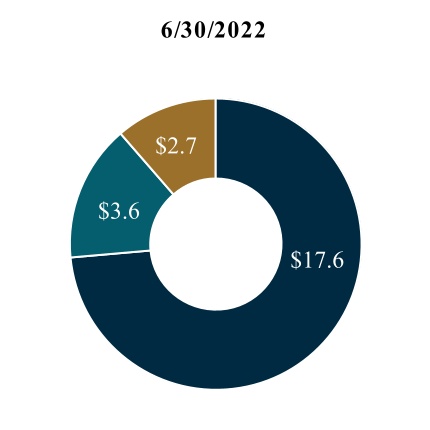
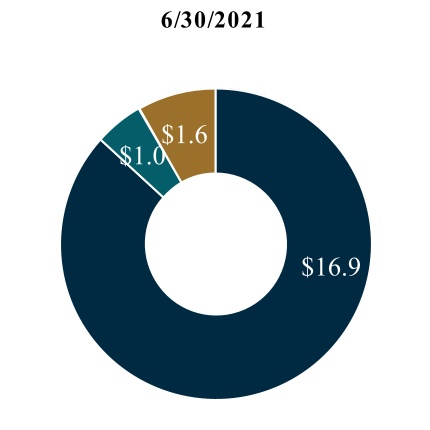
| AUM: $23.9 | AUM: $19.5 |
| FPAUM | Non-fee paying(1) | AUM not yet paying fees |
(1) Includes $0.4 billion and $0.3 billion of non-fee paying AUM based on our general partner commitment as of June 30, 2022 and 2021, respectively.
Secondary Solutions Group—Fee Paying AUM
The table below presents the rollforward of fee paying AUM for the Secondary Solutions Group ($ in millions):
| Private Equity Secondaries | Real Estate Secondaries | Infrastructure Secondaries | Total Secondary Solutions Group | |||||||||||||||||||||||
| Balance at 3/31/2022 | $ | 11,894 | $ | 4,969 | $ | 1,207 | $ | 18,070 | ||||||||||||||||||
| Commitments | 478 | 259 | 74 | 811 | ||||||||||||||||||||||
| Subscriptions/deployment/increase in leverage | 1 | 246 | 4 | 251 | ||||||||||||||||||||||
| Distributions | (48) | (260) | (80) | (388) | ||||||||||||||||||||||
| Change in fund value | 225 | (120) | 74 | 179 | ||||||||||||||||||||||
| Change in fee basis | (1,349) | (20) | — | (1,369) | ||||||||||||||||||||||
| Balance at 6/30/2022 | $ | 11,201 | $ | 5,074 | $ | 1,279 | $ | 17,554 | ||||||||||||||||||
| Private Equity Secondaries | Real Estate Secondaries | Infrastructure Secondaries | Total Secondary Solutions Group | |||||||||||||||||||||||
| Balance at 3/31/2021 | $ | — | $ | — | $ | — | $ | — | ||||||||||||||||||
| Acquisitions | 10,740 | 4,928 | 1,171 | 16,839 | ||||||||||||||||||||||
| Commitments | 100 | — | — | 100 | ||||||||||||||||||||||
| Subscriptions/deployment/increase in leverage | 2 | — | — | 2 | ||||||||||||||||||||||
| Change in fund value | (2) | — | — | (2) | ||||||||||||||||||||||
| Change in fee basis | (12) | — | — | (12) | ||||||||||||||||||||||
| Balance at 6/30/2021 | $ | 10,828 | $ | 4,928 | $ | 1,171 | $ | 16,927 | ||||||||||||||||||
| Private Equity Secondaries | Real Estate Secondaries | Infrastructure Secondaries | Total Secondary Solutions Group | |||||||||||||||||||||||
| Balance at 12/31/2021 | $ | 11,787 | $ | 5,389 | $ | 1,188 | $ | 18,364 | ||||||||||||||||||
| Acquisitions | 131 | — | — | 131 | ||||||||||||||||||||||
| Commitments | 595 | 839 | 74 | 1,508 | ||||||||||||||||||||||
| Subscriptions/deployment/increase in leverage | 58 | 246 | 16 | 320 | ||||||||||||||||||||||
| Distributions | (59) | (678) | (124) | (861) | ||||||||||||||||||||||
| Change in fund value | 71 | 722 | 125 | 918 | ||||||||||||||||||||||
| Change in fee basis | (1,382) | (1,444) | — | (2,826) | ||||||||||||||||||||||
| Balance at 6/30/2022 | $ | 11,201 | $ | 5,074 | $ | 1,279 | $ | 17,554 | ||||||||||||||||||
| Private Equity Secondaries | Real Estate Secondaries | Infrastructure Secondaries | Total Secondary Solutions Group | |||||||||||||||||||||||
| Balance at 12/31/2020 | $ | — | $ | — | $ | — | $ | — | ||||||||||||||||||
| Acquisitions | 10,740 | 4,928 | 1,171 | 16,839 | ||||||||||||||||||||||
| Commitments | 100 | — | — | 100 | ||||||||||||||||||||||
| Subscriptions/deployment/increase in leverage | 2 | — | — | 2 | ||||||||||||||||||||||
| Change in fund value | (2) | — | — | (2) | ||||||||||||||||||||||
| Change in fee basis | (12) | — | — | (12) | ||||||||||||||||||||||
| Balance at 6/30/2021 | $ | 10,828 | $ | 4,928 | $ | 1,171 | $ | 16,927 | ||||||||||||||||||
The chart below presents FPAUM for the Secondary Solutions Group by its fee basis ($ in billions):
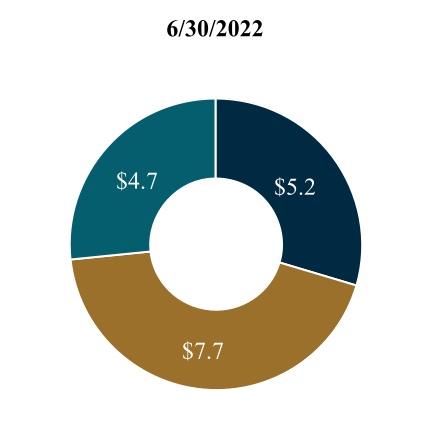
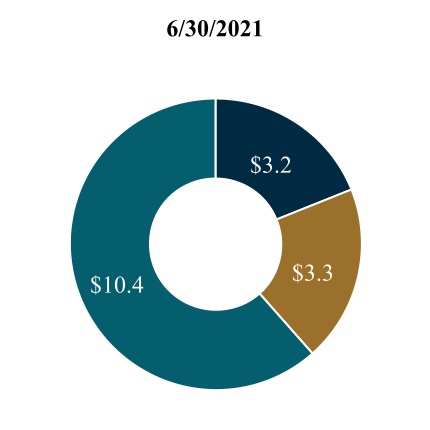
| FPAUM: $17.6 | FPAUM: $16.9 |
| Invested capital/other | Market value(1) | Capital commitments |
(1)Amounts represent FPAUM from funds that primarily invest in illiquid strategies. The underlying investments held in these funds are generally subject to less market volatility than investments held in liquid strategies.
Secondary Solutions Group—Fund Performance Metrics as of June 30, 2022
Secondary Solutions includes three significant funds, LEP XV, LEP XVI and LREP VIII, that collectively contributed approximately 56% of the Secondary Solutions Group’s management fees for the six months ended June 30, 2022.
The following table presents the performance data of our significant drawdown funds as of June 30, 2022 ($ in millions):
| Year of Inception | AUM | Original Capital Commitments | Capital Invested to Date | Realized Value**(1)** | Unrealized Value**(2)** | Total Value | MoIC | IRR(%) | Primary Investment Strategy | ||||||||||||||||||||||||||||||||||||||||||||||||||||||||||||||
| Fund | Gross**(3)** | Net**(4)** | Gross**(5)** | Net**(6)** | |||||||||||||||||||||||||||||||||||||||||||||||||||||||||||||||||||
| Funds Harvesting Investments | |||||||||||||||||||||||||||||||||||||||||||||||||||||||||||||||||||||||
| LEP XV(7) | 2013 | $ | 2,085 | $ | 3,250 | $ | 2,628 | $ | 2,531 | $ | 1,346 | $ | 3,877 | 1.6x | 1.5x | 19.5 | 14.1 | Private Equity Secondaries | |||||||||||||||||||||||||||||||||||||||||||||||||||||
| LEP XVI(7) | 2016 | 5,858 | 4,896 | 2,951 | 1,697 | 3,043 | 4,740 | 1.8x | 1.6x | 54.3 | 37.1 | Private Equity Secondaries | |||||||||||||||||||||||||||||||||||||||||||||||||||||||||||
| LREP VIII(7) | 2016 | 3,550 | 3,300 | 1,745 | 1,008 | 1,565 | 2,573 | 1.6x | 1.5x | 30.7 | 21.7 | Real Estate Secondaries |
- For all funds in the Secondary Solutions Group, returns are calculated from results of the underlying portfolio that are generally reported on a three month lag and may not include the impact of economic and market activities occurring in the current reporting period.
(1)Realized value represents the sum of all cash distributions to all limited partners and if applicable, exclude tax and incentive distributions made to the general partner.
(2)Unrealized value represents the limited partners' share of fund's NAV reduced by the accrued incentive allocation, if applicable. There can be no assurance that unrealized values will be realized at the valuations indicated.
(3)The gross MoIC is calculated at the fund-level and is based on the interests of all partners. If applicable, limiting the gross MoIC to exclude interests attributable to the non-fee paying limited partners and/or the general partner who does not pay management fees or carried interest would have no material impact on the result. The gross MoIC is before giving effect to management fees, carried interest as applicable and other expenses, but after giving effect to credit facility interest expenses, as applicable. The funds may utilize a short-term credit facility for general cash management purposes, as well as a long-term credit facility as permitted by the respective fund's governing documentation. The gross fund-level MoIC would have generally been lower had such fund called capital from its partners instead of utilizing the credit facility.
(4)The net MoIC is calculated at the fund-level and is based on the interests of the fee-paying limited partners and if applicable, excludes those interests attributable to the non-fee paying limited partners and/or the general partner which does not pay management fees or carried interest. The net MoIC is after giving effect to management fees and other expenses, carried interest and credit facility interest expense, as applicable. The funds may utilize a short-term credit facility for general cash management purposes, as well as a long-term credit facility as permitted by the respective fund's governing documentation. The net fund-level MoICs would generally have been lower had such fund called capital from its limited partners instead of utilizing the credit facility.
(5)The gross IRR is an annualized since inception gross internal rate of return of cash flows to and from the fund and the fund’s residual value at the end of the measurement period. Gross IRR reflects returns to all partners. If applicable, limiting the gross IRR to exclude interests attributable to the non-fee paying limited partners and/or the general partner who does not pay management fees or carried interest would have no material impact on the result. The cash flow dates used in the gross IRR calculation are based on the actual dates of the cash flows. The gross IRRs are calculated before giving effect to management fees, carried interest, as applicable, and other expenses, but after giving effect to credit facility interest expenses, as applicable. The funds may utilize a short-term credit facility for general cash management purposes, as well as a long-term credit facility as permitted by the respective fund's governing documents. The gross fund-level IRR would generally have been lower had such fund called capital from its partners instead of utilizing the credit facility.
(6)The net IRR is an annualized since inception net internal rate of return of cash flows to and from the fund and the fund’s residual value at the end of the measurement period. Net IRRs reflect returns to the fee-paying limited partners and, if applicable, exclude interests attributable to the non-fee paying limited partners and/or the general partner who does not pay management fees or carried interest. The cash flow dates used in the net IRR calculations are based on the actual dates of the cash flows. The net IRRs are calculated after giving effect to management fees and other expenses, carried interest and credit facility interest expenses, as applicable. The funds may utilize a short-term credit facility for general cash management purposes, as well as a long-term credit facility as permitted by the respective fund's governing documents. Net fund-level IRRs would generally have been lower had such fund called capital from its limited partners instead of utilizing the credit facility.
(7)The results of each fund is presented on a combined basis with the affiliated parallel funds or accounts, given that the investments are substantially the same.
Strategic Initiatives—Three and Six Months Ended June 30, 2022 Compared to Three and Six Months Ended June 30, 2021
Fee Related Earnings:
The following table presents the components of Strategic Initiatives’ FRE ($ in thousands):
| Three months ended June 30, | Favorable (Unfavorable) | Six months ended June 30, | Favorable (Unfavorable) | ||||||||||||||||||||||||||||||||||||||||||||
| 2022 | 2021 | $ Change | % Change | 2022 | 2021 | $ Change | % Change | ||||||||||||||||||||||||||||||||||||||||
| Management fees | $ | 17,380 | $ | 16,796 | $ | 584 | 3 | % | $ | 34,194 | $ | 32,419 | $ | 1,775 | 5% | ||||||||||||||||||||||||||||||||
| Other fees | 64 | 1 | 63 | NM | 114 | 80 | 34 | 43 | |||||||||||||||||||||||||||||||||||||||
| Compensation and benefits | (6,799) | (5,384) | (1,415) | (26) | (14,200) | (10,124) | (4,076) | (40) | |||||||||||||||||||||||||||||||||||||||
| General, administrative and other expenses | (2,363) | (1,771) | (592) | (33) | (4,089) | (3,806) | (283) | (7) | |||||||||||||||||||||||||||||||||||||||
| Fee Related Earnings | $ | 8,282 | $ | 9,642 | (1,360) | (14) | $ | 16,019 | $ | 18,569 | (2,550) | (14) | |||||||||||||||||||||||||||||||||||
NM - Not Meaningful
Management Fees. The chart below presents Strategic Initiatives management fees and effective management fee rates ($ in millions):
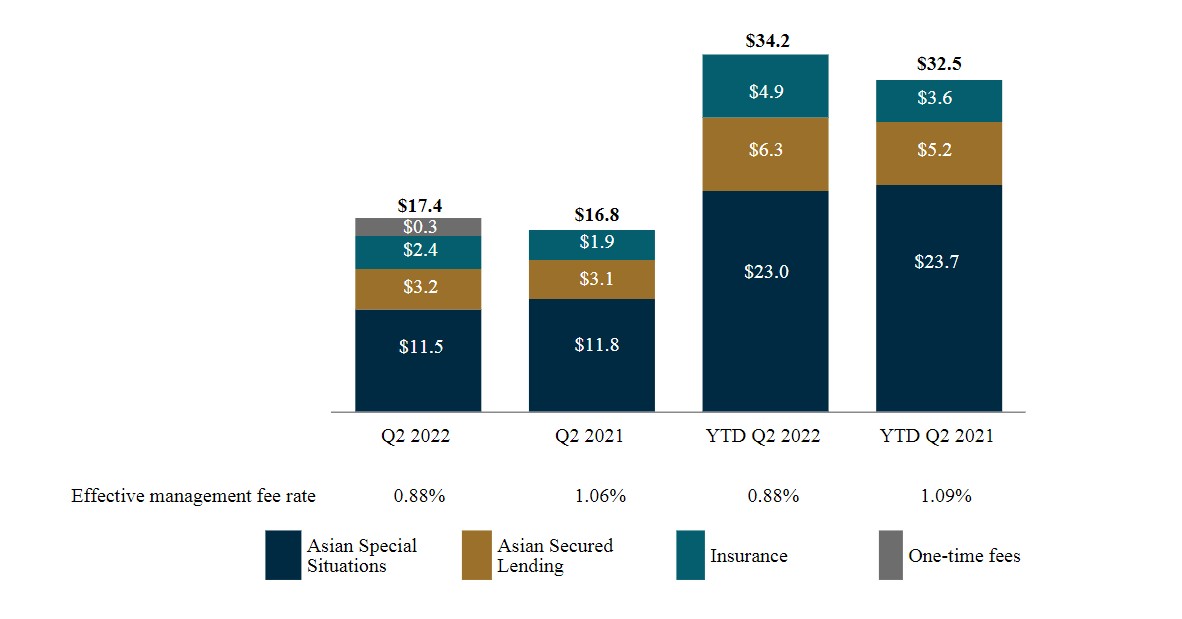
Management fees increased for the three and six months ended June 30, 2022 compared to the three and six months ended June 30, 2021 primarily driven by our sixth Asian special situations fund, including one-time catch up fees generated during the three months ended June 30, 2022, and by a higher asset base in our insurance strategy. Following the launch of our sixth Asian special situations fund, SSG Capital Partners V, L.P. (“SSG Fund V”) had a reduction in fee basis that partially offset the increase in management fees over the comparative periods.
The decreases in effective management fee rate for the three and six months ended June 30, 2022 compared to the three and six months ended June 30, 2021 were primarily driven by the growing fee base of our insurance strategy, which has an effective management fee rate of 0.30%. The effective management fee rate also decreased due to the launch of our sixth Asian special situations fund in the first quarter of 2022. Our sixth Asian special situations fund pays a fee on committed capital that increases once that capital is invested. As a result, our effective management fee rate decreases immediately following capital raising and increases as capital is subsequently deployed.
Compensation and Benefits. Compensation and benefits increased by $1.4 million, or 26%, for the three months ended June 30, 2022 compared to the three months ended June 30, 2021 and by $4.1 million, or 40%, for the six months ended June 30, 2022 compared to the six months ended June 30, 2021. The increases in salaries and benefits for the three and six months
ended June 30, 2022 were driven by headcount growth across all strategies to support our strategic initiatives and to merit increases. Average headcount for the year-to-date period increased by 32% to 58 investment and investment support professionals from 44 professionals for the same period in 2021.
Realized Income:
The following table presents the components of Strategic Initiatives RI ($ in thousands):
| Three months ended June 30, | Favorable (Unfavorable) | Six months ended June 30, | Favorable (Unfavorable) | ||||||||||||||||||||||||||||||||||||||||||||
| 2022 | 2021 | $ Change | % Change | 2022 | 2021 | $ Change | % Change | ||||||||||||||||||||||||||||||||||||||||
| Fee Related Earnings | $ | 8,282 | $ | 9,642 | $ | (1,360) | (14)% | $ | 16,019 | $ | 18,569 | $ | (2,550) | (14)% | |||||||||||||||||||||||||||||||||
| Investment income (loss)-realized | (3) | 322 | (325) | NM | 858 | 322 | 536 | 166 | |||||||||||||||||||||||||||||||||||||||
| Interest and other investment income-realized | 5,514 | 2,628 | 2,886 | 110 | 5,517 | 2,661 | 2,856 | 107 | |||||||||||||||||||||||||||||||||||||||
| Interest expense | (5,605) | (2,525) | (3,080) | (122) | (11,443) | (4,827) | (6,616) | (137) | |||||||||||||||||||||||||||||||||||||||
| Realized net investment income (loss) | (94) | 425 | (519) | NM | (5,068) | (1,844) | (3,224) | (175) | |||||||||||||||||||||||||||||||||||||||
| Realized Income | $ | 8,188 | $ | 10,067 | (1,879) | (19) | $ | 10,951 | $ | 16,725 | (5,774) | (35) |
NM - Not Meaningful
Realized net investment loss for the three and six months ended June 30, 2022 was primarily attributable to interest expense allocations based on the cost basis of investments. Interest expense has increased over the comparative periods primarily due to the issuance of the 2051 Subordinated Notes and the 2052 Senior Notes in June 2021 and January 2022, respectively. The activity for the three and six months ended June 30, 2022 also included interest income generated from an insurance fund.
The activity for the three and six months ended June 30, 2021 included realized net investment income attributable to distributions from an investment vehicle that manages a portfolio of non-performing loans. Realized net investment income (loss) for the three and six months ended June 30, 2021 also included interest expense allocations based on the cost basis of investments.
Strategic Initiatives—Assets Under Management
The tables below present rollforwards of AUM for Strategic Initiatives ($ in millions):
| Asian Special Situations | Asian Secured Lending | APAC Direct Lending | Insurance | SPACs | Total Strategic Initiatives | |||||||||||||||||||||||||||||||||||||||
| Balance at 3/31/2022 | $ | 6,950 | $ | 2,471 | $ | 362 | $ | 1,753 | $ | — | $ | 1,000 | $ | 12,536 | ||||||||||||||||||||||||||||||
| Net new par/equity commitments | 275 | — | — | 157 | — | 432 | ||||||||||||||||||||||||||||||||||||||
| Distributions | (61) | (53) | — | (58) | — | (172) | ||||||||||||||||||||||||||||||||||||||
| Change in fund value | (59) | (40) | (26) | (150) | — | (275) | ||||||||||||||||||||||||||||||||||||||
| Balance at 6/30/2022 | $ | 7,105 | $ | 2,378 | $ | 336 | $ | 1,702 | $ | 1,000 | $ | 12,521 | ||||||||||||||||||||||||||||||||
| Asian Special Situations | Asian Secured Lending | APAC Direct Lending | Insurance | SPACs | Total Strategic Initiatives | |||||||||||||||||||||||||||||||||||||||
| Balance at 3/31/2021 | $ | 6,991 | $ | — | $ | — | $ | 1,903 | $ | 1,000 | $ | 9,894 | ||||||||||||||||||||||||||||||||
| Net new par/equity commitments(1) | 551 | — | — | (71) | — | 480 | ||||||||||||||||||||||||||||||||||||||
| Net new debt commitments | 29 | — | — | — | — | 29 | ||||||||||||||||||||||||||||||||||||||
| Distributions | (210) | — | — | (40) | — | (250) | ||||||||||||||||||||||||||||||||||||||
| Change in fund value | 131 | — | — | 82 | — | 213 | ||||||||||||||||||||||||||||||||||||||
| Balance at 6/30/2021 | $ | 7,492 | $ | — | $ | — | $ | 1,874 | $ | 1,000 | $ | 10,366 | ||||||||||||||||||||||||||||||||
| Asian Special Situations | Asian Secured Lending | APAC Direct Lending | Insurance | SPACs | Total Strategic Initiatives | |||||||||||||||||||||||||||||||||||||||
| Balance at 12/31/2021 | $ | 6,239 | $ | 2,456 | $ | — | $ | 1,928 | $ | 1,000 | $ | 11,623 | ||||||||||||||||||||||||||||||||
| Net new par/equity commitments | 1,135 | 10 | 362 | 110 | — | 1,617 | ||||||||||||||||||||||||||||||||||||||
| Capital reductions | — | (5) | — | — | — | (5) | ||||||||||||||||||||||||||||||||||||||
| Distributions | (204) | (71) | — | (51) | — | (326) | ||||||||||||||||||||||||||||||||||||||
| Change in fund value | (65) | (12) | (26) | (285) | — | (388) | ||||||||||||||||||||||||||||||||||||||
| Balance at 6/30/2022 | $ | 7,105 | $ | 2,378 | $ | 336 | $ | 1,702 | $ | 1,000 | $ | 12,521 | ||||||||||||||||||||||||||||||||
| Asian Special Situations | Asian Secured Lending | APAC Direct Lending | Insurance | SPACs | Total Strategic Initiatives | |||||||||||||||||||||||||||||||||||||||
| Balance at 12/31/2020 | $ | 7,018 | $ | — | $ | — | $ | 2,243 | $ | — | $ | 9,261 | ||||||||||||||||||||||||||||||||
| Net new par/equity commitments(1) | 553 | — | — | (373) | 1,000 | 1,180 | ||||||||||||||||||||||||||||||||||||||
| Net new debt commitments | 29 | — | — | — | — | 29 | ||||||||||||||||||||||||||||||||||||||
| Distributions | (326) | — | — | (54) | — | (380) | ||||||||||||||||||||||||||||||||||||||
| Change in fund value | 218 | — | — | 58 | — | 276 | ||||||||||||||||||||||||||||||||||||||
| Balance at 6/30/2021 | $ | 7,492 | $ | — | $ | — | $ | 1,874 | $ | 1,000 | $ | 10,366 | ||||||||||||||||||||||||||||||||
| (1) Reallocation of capital among the segments may occur for pools of capital with investment mandates in more than one investment strategy. This reallocation activity is presented within net new par/equity commitments and may result in balances presented to be negative. | ||||||||||||||||||||||||||||||||||||||||||||
The components of our AUM for Strategic Initiatives are presented below ($ in billions):
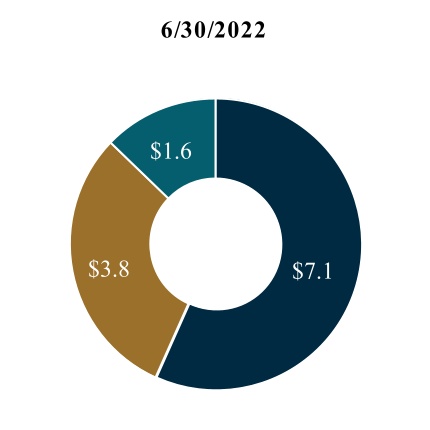
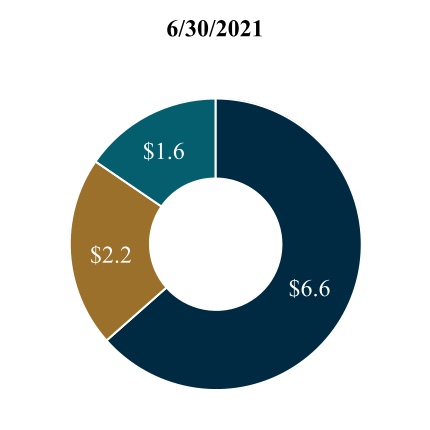
| AUM: $12.5 | AUM: $10.4 |
| FPAUM | AUM not yet paying fees | Non-fee paying(1) |
(1) Includes $0.2 billion and $0.1 billion of non-fee paying AUM based on our general partner commitment as of June 30, 2022 and 2021.
Strategic Initiatives—Fee Paying AUM
The tables below present rollforwards of fee paying AUM for Strategic Initiatives ($ in millions):
| Asian Special Situations | Asian Secured Lending | APAC Direct Lending | Insurance | Total Strategic Initiatives | |||||||||||||||||||||||||||||||||||||
| Balance at 3/31/2022 | $ | 4,242 | $ | 1,183 | $ | — | $ | 1,847 | $ | 7,272 | |||||||||||||||||||||||||||||||
| Commitments | 275 | — | — | 141 | 416 | ||||||||||||||||||||||||||||||||||||
| Subscriptions/deployment/increase in leverage | 179 | 394 | — | (38) | 535 | ||||||||||||||||||||||||||||||||||||
| Capital reductions | (8) | (215) | — | — | (223) | ||||||||||||||||||||||||||||||||||||
| Distributions | (93) | (230) | — | (3) | (326) | ||||||||||||||||||||||||||||||||||||
| Change in fund value | (21) | 2 | — | (317) | (336) | ||||||||||||||||||||||||||||||||||||
| Change in fee basis | (8) | — | — | (238) | (246) | ||||||||||||||||||||||||||||||||||||
| Balance at 6/30/2022 | $ | 4,566 | $ | 1,134 | $ | — | $ | 1,392 | $ | 7,092 | |||||||||||||||||||||||||||||||
| Asian Special Situations | Asian Secured Lending | APAC Direct Lending | Insurance | Total Strategic Initiatives | |||||||||||||||||||||||||||||||||||||
| Balance at 3/31/2021 | $ | 4,648 | $ | — | $ | — | $ | 1,978 | $ | 6,626 | |||||||||||||||||||||||||||||||
| Commitments(1) | — | — | — | (68) | (68) | ||||||||||||||||||||||||||||||||||||
| Subscriptions/deployment/increase in leverage | 585 | — | — | — | 585 | ||||||||||||||||||||||||||||||||||||
| Capital reductions | (179) | — | — | — | (179) | ||||||||||||||||||||||||||||||||||||
| Distributions | (381) | — | — | (40) | (421) | ||||||||||||||||||||||||||||||||||||
| Change in fund value | — | — | — | 78 | 78 | ||||||||||||||||||||||||||||||||||||
| Balance at 6/30/2021 | $ | 4,673 | $ | — | $ | — | $ | 1,948 | $ | 6,621 | |||||||||||||||||||||||||||||||
| . | Asian Special Situations | Asian Secured Lending | APAC Direct Lending | Insurance | Total Strategic Initiatives | ||||||||||||||||||||||||||||||||||||
| Balance at 12/31/2021 | $ | 3,605 | $ | 1,115 | $ | — | $ | 2,067 | $ | 6,787 | |||||||||||||||||||||||||||||||
| Commitments | 1,747 | — | — | 133 | 1,880 | ||||||||||||||||||||||||||||||||||||
| Subscriptions/deployment/increase in leverage | 389 | 639 | — | (38) | 990 | ||||||||||||||||||||||||||||||||||||
| Capital reductions | (10) | (223) | — | — | (233) | ||||||||||||||||||||||||||||||||||||
| Distributions | (302) | (277) | — | (4) | (583) | ||||||||||||||||||||||||||||||||||||
| Change in fund value | (20) | (120) | — | (528) | (668) | ||||||||||||||||||||||||||||||||||||
| Change in fee basis | (843) | — | — | (238) | (1,081) | ||||||||||||||||||||||||||||||||||||
| Balance at 6/30/2022 | $ | 4,566 | $ | 1,134 | $ | — | $ | 1,392 | $ | 7,092 | |||||||||||||||||||||||||||||||
| Asian Special Situations | Asian Secured Lending | APAC Direct Lending | Insurance | Total Strategic Initiatives | |||||||||||||||||||||||||||||||||||||
| Balance at 12/31/2020 | $ | 4,353 | $ | — | $ | — | $ | 2,243 | $ | 6,596 | |||||||||||||||||||||||||||||||
| Commitments(1) | — | — | — | (298) | (298) | ||||||||||||||||||||||||||||||||||||
| Subscriptions/deployment/increase in leverage | 1,123 | — | — | — | 1,123 | ||||||||||||||||||||||||||||||||||||
| Capital reductions | (180) | — | — | — | (180) | ||||||||||||||||||||||||||||||||||||
| Distributions | (623) | — | — | (54) | (677) | ||||||||||||||||||||||||||||||||||||
| Change in fund value | — | — | — | 57 | 57 | ||||||||||||||||||||||||||||||||||||
| Balance at 6/30/2021 | $ | 4,673 | $ | — | $ | — | $ | 1,948 | $ | 6,621 | |||||||||||||||||||||||||||||||
| (1) Reallocation of capital among the segments may occur for pools of capital with investment mandates in more than one investment strategy. This reallocation activity is presented within commitments and may result in balances presented to be negative. | |||||||||||||||||||||||||||||||||||||||||
The charts below present FPAUM for Strategic Initiatives by its fee basis ($ in billions):
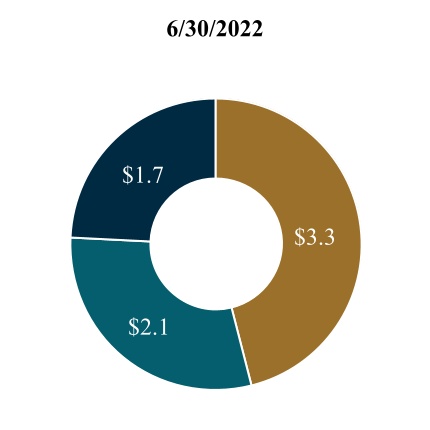
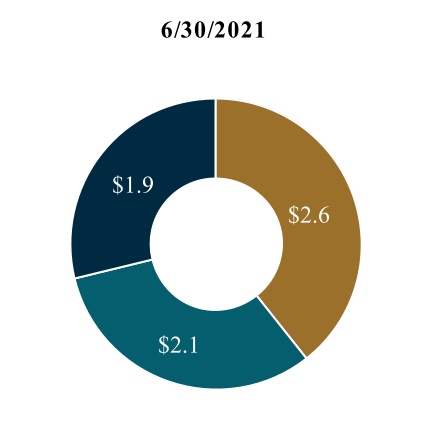
| FPAUM: $7.1 | FPAUM: $6.6 |
| Market value | Invested capital/other | Capital commitments |
Operations Management Group—Three and Six Months Ended June 30, 2022 Compared to Three and Six Months Ended June 30, 2021
Fee Related Earnings:
The following table presents the components of the Operations Management Group’s FRE ($ in thousands):
| Three months ended June 30, | Favorable (Unfavorable) | Six months ended June 30, | Favorable (Unfavorable) | ||||||||||||||||||||||||||||||||||||||||||||
| 2022 | 2021 | $ Change | % Change | 2022 | 2021 | $ Change | % Change | ||||||||||||||||||||||||||||||||||||||||
| Other fees | $ | 6,298 | $ | — | $ | 6,298 | NM | $ | 12,174 | $ | — | $ | 12,174 | NM | |||||||||||||||||||||||||||||||||
| Compensation and benefits | (71,341) | (48,429) | (22,912) | (47) | (135,408) | (92,836) | (42,572) | (46) | |||||||||||||||||||||||||||||||||||||||
| General, administrative and other expenses | (35,225) | (23,074) | (12,151) | (53) | (67,609) | (41,730) | (25,879) | (62) | |||||||||||||||||||||||||||||||||||||||
| Fee Related Earnings | $ | (100,268) | $ | (71,503) | (28,765) | (40) | $ | (190,843) | $ | (134,566) | (56,277) | (42) |
NM - Not Meaningful
Other Fees. Other fees of $6.3 million and $12.2 million for the three and six months ended June 30, 2022, respectively, represents fees earned through Ares Wealth Management Solutions, LLC (“AWMS”) primarily from asset-based fees that we earn from our non-traded REITs and accompanying 1031 exchange programs. Other fees also includes trade-based fees from the sale and distribution of our non-traded REITs, net of amounts reallowed to participating broker-dealers.
Compensation and Benefits. Compensation and benefits increased by $22.9 million, or 47%, for the three months ended June 30, 2022 compared to the three months ended June 30, 2021 and by $42.6 million, or 46%, for the six months ended June 30, 2022 compared to the six months ended June 30, 2021. Headcount growth attributable to the Black Creek Acquisition, including AWMS, Landmark Acquisition and Infrastructure Debt Acquisition collectively contributed $10.1 million and $20.2 million in recurring employment related costs for the three and six months ended June 30, 2022, respectively. Additionally, in connection with the sale and distribution of shares in our non-traded REITs, we have incurred employee commission expense of $7.2 million and $14.1 million during the three and six months ended June 30, 2022, respectively. The increases in salaries and benefits were further driven by (i) the expansion of our strategy and relationship management teams to support global fundraising, and (ii) the expansion of our business operations teams to support the growth of our business and other strategic initiatives.
Average headcount for the year-to-date period increased by 48% to 1,176 operations management professionals from 792 professionals for the same period in 2021. Average headcount for our operations management professionals increased by 189 professionals from the Black Creek Acquisition, including AWMS, the Landmark Acquisition, including increases from reflecting headcount for the full period in 2022, and Infrastructure Debt Acquisition.
General, Administrative and Other Expenses. General, administrative and other expenses increased by $12.2 million, or 53%, for the three months ended June 30, 2022 compared to the three months ended June 30, 2021 and by $25.9 million, or 62%, for the six months ended June 30, 2022 compared to the six months ended June 30, 2021. The Black Creek Acquisition, Landmark Acquisition and Infrastructure Debt Acquisition collectively contributed $4.9 million and $8.0 million for the three and six months ended June 30, 2022, respectively, when compared to the same periods in 2021. To support investment offerings in the global wealth management channel, AMWS facilitates product development, distribution, marketing and client management activities. As we build out our retail distribution infrastructure and capabilities to support prospective sales and AUM growth, we expect marketing and distribution expenses, including travel, to increase in future periods.
Certain expenses have also increased during the current period, including occupancy costs to support our growing headcount and information services and information technology to support the expansion of our business. Collectively, these expenses increased by $1.6 million and $3.5 million for the three and six months ended June 30, 2022, respectively, when compared to the same periods in 2021. Additionally, professional service fees, recruiting fees and insurance costs collectively rose by $3.0 million and $6.9 million for the three and six months ended June 30, 2022, respectively, largely to support the expanding platform.
Other operating expenses, most notably travel, marketing sponsorships and certain fringe benefits, collectively increased by $3.9 million and $5.9 million for the three and six months ended June 30, 2022, respectively, when compared to the same periods in 2021 as marketing and company events returned to pre-pandemic levels and travel continues to ramp up toward historical levels.
Realized Income:
The following table presents the components of the OMG's RI ($ in thousands):
| Three months ended June 30, | Favorable (Unfavorable) | Six months ended June 30, | Favorable (Unfavorable) | ||||||||||||||||||||||||||||||||||||||||||||
| 2022 | 2021 | $ Change | % Change | 2022 | 2021 | $ Change | % Change | ||||||||||||||||||||||||||||||||||||||||
| Fee Related Earnings | $ | (100,268) | $ | (71,503) | $ | (28,765) | (40) | % | $ | (190,843) | $ | (134,566) | $ | (56,277) | (42)% | ||||||||||||||||||||||||||||||||
| Interest and other investment income (loss)—realized | (995) | 85 | (1,080) | NM | (1,279) | 440 | (1,719) | NM | |||||||||||||||||||||||||||||||||||||||
| Interest expense | (179) | (147) | (32) | (22) | (346) | (237) | (109) | (46) | |||||||||||||||||||||||||||||||||||||||
| Realized net investment income (loss) | (1,174) | (62) | (1,112) | NM | (1,625) | 203 | (1,828) | NM | |||||||||||||||||||||||||||||||||||||||
| Realized Income | $ | (101,442) | $ | (71,565) | (29,877) | (42) | $ | (192,468) | $ | (134,363) | (58,105) | (43) |
NM - Not Meaningful
Liquidity and Capital Resources
Management assesses liquidity in terms of our ability to generate cash to fund operating, investing and financing activities. Management believes that the Company is well-positioned and its liquidity will continue to be sufficient for its foreseeable working capital needs, contractual obligations, dividend payments, pending acquisitions and strategic initiatives.
Sources and Uses of Liquidity
Our sources of liquidity are (1) cash on hand, (2) net working capital, (3) cash from operations, including management fees and fee related performance revenues, which are collected monthly, quarterly or semi-annually, and net realized performance income, which may be unpredictable as to amount and timing, (4) fund distributions related to our investments that are unpredictable as to amount and timing and (5) net borrowing from the Credit Facility. As of June 30, 2022, our cash and cash equivalents were $252.9 million, and we had $395.0 million borrowings outstanding under our Credit Facility. Our ability to draw from the Credit Facility is subject to a leverage and other covenants. We remain in compliance with all covenants as of June 30, 2022. We believe that these sources of liquidity will be sufficient to fund our working capital requirements and to meet our commitments in the ordinary course of business and under the current market conditions for the foreseeable future. Cash flows from management fees may be impacted by a slowdown or declines in deployment, declines or write downs in valuations, or a slowdown or negatively impacted fundraising. In addition, management fees may be subject to deferral and fee related performance revenues may be subject to hold backs. Declines or delays and transaction activity may impact our fund distributions and net realized performance income which could adversely impact our cash flows and liquidity. Market conditions may make it difficult to extend the maturity or refinance our existing indebtedness or obtain new indebtedness with similar terms.
We expect that our primary liquidity needs will continue to be to (1) provide capital to facilitate the growth of our existing investment management businesses, (2) fund our investment commitments, (3) provide capital to facilitate our expansion into businesses that are complementary to our existing investment management businesses as well as other strategic growth initiatives, (4) pay operating expenses, including cash compensation to our employees, and make payments under the tax receivable agreement (“TRA”), (5) fund capital expenditures, (6) service our debt, (7) pay income taxes, (8) make dividend payments to our Class A and non-voting common stockholders in accordance with our dividend policy and (9) pay distributions to AOG unitholders.
In the normal course of business, we expect to pay dividends to our Class A and non-voting common stockholders that are aligned with our expected fee related earnings after an allocation of current taxes paid. For the purposes of determining this amount, we allocate the current taxes paid to FRE and to realized incentive and investment income in a manner that may be disproportionate to earnings generated by these metrics, and the actual taxes paid on these metrics should they be considered separately. Additionally, our methodology uses the tax benefits from certain expenses that are not included in these non-GAAP metrics, such as equity-based compensation from the vesting of restricted units and the exercise of stock options and from the amortization of intangible assets, among others. We allocate the taxes by multiplying the statutory tax rate currently in effect by our realized performance and net investment income and removing this amount from total current taxes. The remaining current tax paid is the amount that we allocate to FRE. We use this method to allocate the current provision for income taxes to approximate the amount of cash that is available to pay dividends to our stockholders. If cash flows from operations were insufficient to fund dividends over a sustained period of time, we expect that we would suspend or reduce paying such dividends. In addition, there is no assurance that dividends would continue at the current levels or at all.
Our ability to obtain debt financing and complete stock offerings provides us with additional sources of liquidity. For further discussion of financing transactions occurring in the current period, see “Cash Flows” within this section and “Note 8. Debt” and “Note 14. Equity and Redeemable Interest” to our unaudited condensed consolidated financial statements included in this Quarterly Report on Form 10-Q.
Our unaudited condensed consolidated financial statements reflect the cash flows of our operating businesses as well as those of our Consolidated Funds. The assets of our Consolidated Funds, on a gross basis, are significantly larger than the assets of our operating businesses and therefore have a substantial effect on our reported cash flows. The primary cash flow activities of our Consolidated Funds include: (1) raising capital from third-party investors, which is reflected as non-controlling interests of our Consolidated Funds, (2) financing certain investments by issuing debt, (3) purchasing and selling investment securities, (4) generating cash through the realization of certain investments, (5) collecting interest and dividend income and (6) distributing cash to investors. Our Consolidated Funds are generally accounted for as investment companies under GAAP; therefore, the character and classification of all Consolidated Fund transactions are presented as cash flows from operations. Liquidity available at our Consolidated Funds is not available for corporate liquidity needs, and debt of the Consolidated Funds is non–recourse to the Company except to the extent of the Company's investment in the fund.
Cash Flows
We consolidate funds where we are deemed to hold a controlling interest. The Consolidated Funds are not necessarily the same entities in each year presented due to changes in ownership, changes in limited partners' rights and the creation or termination of funds. The consolidation of these funds had no effect on cash flows attributable to us for the periods presented. As such, we evaluate the activity of the Consolidated Funds and the eliminations resulting from consolidation separately. The following tables and discussion summarize our condensed consolidated statements of cash flows by activities attributable to the Company and to our Consolidated Funds. For more details on the activity of the Company and Consolidated Funds, refer to “Note 16. Consolidation” to our unaudited condensed consolidated financial statements included in this Quarterly Report on Form 10-Q.
| Six months ended June 30, | |||||||||||
| ($ in thousands) | 2022 | 2021 | |||||||||
| Net cash provided by operating activities | $ | 358,175 | $ | 254,096 | |||||||
| Net cash used in the Consolidated Funds' operating activities, net of eliminations | (926,373) | (1,323,139) | |||||||||
| Net cash used in operating activities | (568,198) | (1,069,043) | |||||||||
| Net cash used in the Company's investing activities | (320,125) | (786,096) | |||||||||
| Net cash provided by (used in) the Company's financing activities | (116,458) | 571,176 | |||||||||
| Net cash provided by the Consolidated Funds' financing activities, net of eliminations | 931,952 | 1,323,696 | |||||||||
| Net cash provided by financing activities | 815,494 | 1,894,872 | |||||||||
| Effect of exchange rate changes | (17,959) | 3,361 | |||||||||
| Net change in cash and cash equivalents | $ | (90,788) | $ | 43,094 |
Operating Activities
In the table below cash flows from operations have been summarized to present (i) cash generated from our core operating activities, primarily consisting of profits generated principally from management fees and fee related performance revenues after covering for operating expenses and fee related performance compensation, (ii) net realized performance income and (iii) net cash from investment related activities including purchases, sales and net realized investment income. We generated meaningful cash flow from operations in each period presented.
| Six months ended June 30, | Favorable (Unfavorable) | ||||||||||||||||||||||
| 2022 | 2021 | $ Change | % Change | ||||||||||||||||||||
| Core operating activities | $ | 416,026 | $ | 329,369 | $ | 86,657 | 26% | ||||||||||||||||
| Net realized performance income | 80,849 | 25,984 | 54,865 | NM | |||||||||||||||||||
| Net cash used in investment related activities | (138,700) | (101,257) | (37,443) | 37 | |||||||||||||||||||
| Net cash provided by operating activities | $ | 358,175 | $ | 254,096 | 104,079 | 41 |
NM - Not Meaningful
Cash generated from our core operating activities continues to increase as a result of growing fee revenues and an expanding fee related earnings margin. Net realized performance income represents a source of cash and includes incentive fees that are realized annually at the end of the measurement period, which is typically at the end of the calendar year. Cash from
these realizations are generally received in the period subsequent to the measurement period. Our incentive fee realizations were higher in the fourth quarter of 2021 compared to the fourth quarter of 2020, which resulted in an increase in cash payments received over the comparative period. Net cash used in investment related activities primarily represents net purchases associated with funding capital commitments in our investment portfolio, which represent a use of cash. Our capital commitments continue to increase with our growing assets under management. For further discussion of our capital commitments, see “Note 9. Commitments and Contingencies,” to our unaudited condensed consolidated financial statements included in this Quarterly Report on Form 10-Q.
Net cash used in the Consolidated Funds’ operating activities continues to be principally attributable to net purchases of investment securities by recently launched funds during both periods. Net cash used in the Consolidated Funds’ operating activities for the six months ended June 30, 2021 included the purchase of U.S. Treasury securities following the initial public offering of our SPAC.
Our working capital needs are generally rising to support the growth of our business, while the capital requirements needed to support fund-related activities vary based upon the specific investment activities being conducted during such period.
Investing Activities
| Six months ended June 30, | |||||||||||
| 2022 | 2021 | ||||||||||
| Purchase of furniture, equipment and leasehold improvements, net of disposals | $ | (18,448) | $ | (7,952) | |||||||
| Acquisitions, net of cash acquired | (301,677) | (778,144) | |||||||||
| Net cash used in investing activities | $ | (320,125) | $ | (786,096) |
Net cash used in the Company's investing activities was principally composed of cash used to complete the Infrastructure Debt Acquisition in the current period and cash used to complete the Landmark Acquisition in the prior year period. We also used cash to purchase furniture, fixtures, equipment and leasehold improvements during both years to support the growth in our staffing levels and expanding our global presence.
Financing Activities
| Six months ended June 30, | |||||||||||
| 2022 | 2021 | ||||||||||
| Net proceeds from issuance of Class A and non-voting common stock | $ | — | $ | 827,430 | |||||||
| Net repayments of Credit Facility | (20,000) | — | |||||||||
| Proceeds from issuance of senior and subordinated notes | 488,915 | 450,000 | |||||||||
| Class A and non-voting common stock dividends | (222,912) | (157,509) | |||||||||
| AOG unitholder distributions | (183,454) | (130,669) | |||||||||
| Series A Preferred Stock dividends | — | (10,850) | |||||||||
| Redemption of Series A Preferred Stock | — | (310,000) | |||||||||
| Stock option exercises | 8,644 | 14,027 | |||||||||
| Taxes paid related to net share settlement of equity awards | (189,485) | (100,838) | |||||||||
| Other financing activities | 1,834 | (10,415) | |||||||||
| Net cash provided by (used in) the Company's financing activities | $ | (116,458) | $ | 571,176 |
As a result of generating higher fee related earnings, we increased the level of dividends paid to a growing shareholder base of Class A and non-voting common stockholders and distributions paid to AOG unitholders, resulting in net cash used in the Company’s financing activities for the six months ended June 30, 2022. Net proceeds from the issuance of the 2052 Senior Notes contributed to additional cash inflow for the six months ended June 30, 2022. These proceeds were used primarily to fund the Infrastructure Debt Acquisition.
In connection with the vesting of restricted units that are granted to our employees under the Equity Incentive Plan, we withhold shares equal to the fair value of our employee’s withholding tax liabilities and pay the taxes on their behalf. This use of cash increased from the prior period primarily as a result of our appreciating stock price, which is the basis on which employee compensation is recognized, and a higher number of restricted units that vested in the current period. The net settlement of shares minimizes the dilutive impact of our Equity Incentive Plan as fewer shares are issued upon vesting. For the six months ended June 30, 2022 and 2021, we retained and did not issue 2.4 million shares and 2.1 million shares, respectively.
Net cash provided by the Company's financing activities for the six months ended June 30, 2021 was principally composed of net proceeds from the public offering of Class A common stock, private offering of Class A common stock and
non-voting common stock to SMBC and the issuance of the 2051 Subordinated Notes. These proceeds were largely used to fund the Landmark Acquisition and redeem the Series A Preferred Stock.
| Six months ended June 30, | |||||||||||
| 2022 | 2021 | ||||||||||
| Contributions from redeemable and non-controlling interests in Consolidated Funds, net of eliminations | $ | 218,280 | $ | 962,829 | |||||||
| Distributions to non-controlling interests in Consolidated Funds, net of eliminations | (53,638) | (72,289) | |||||||||
| Borrowings under loan obligations by Consolidated Funds | 814,183 | 492,887 | |||||||||
| Repayments under loan obligations by Consolidated Funds | (46,873) | (59,731) | |||||||||
| Net cash provided by the Consolidated Funds' financing activities | $ | 931,952 | $ | 1,323,696 |
Net cash provided by the Consolidated Funds’ financing activities for the six months ended June 30, 2022 was primarily attributable to the borrowings of one newly issued CLO.
Net cash provided by the Consolidated Funds’ financing activities for the six months ended June 30, 2021 was principally attributable to contributions from shareholders in the initial public offering of our SPAC and to the borrowings of a newly issued CLO.
Capital Resources
We intend to use a portion of our available liquidity to pay cash dividends to our Class A and non-voting common stockholders on a quarterly basis in accordance with our dividend policy. Our ability to make cash dividends is dependent on a myriad of factors, including among others: general economic and business conditions; our strategic plans and prospects; our business and investment opportunities; timing of capital calls by our funds in support of our commitments; our financial condition and operating results; working capital requirements and other anticipated cash needs; contractual restrictions and obligations; legal, tax and regulatory restrictions; restrictions on the payment of distributions by our subsidiaries to us and other relevant factors.
We are required to maintain minimum net capital balances for regulatory purposes for our broker-dealer entities and certain subsidiaries operating outside the U.S. These net capital requirements in the U.S. are met in part by retaining cash, cash equivalents and investment securities. As a result, we may be restricted in our ability to transfer cash between different operating entities and jurisdictions. As of June 30, 2022, we were required to maintain approximately $45.8 million in net assets within these subsidiaries to meet regulatory net capital and capital adequacy requirements. We remain in compliance with all regulatory requirements.
Holders of AOG Units, subject to the terms of the exchange agreement, may exchange their AOG Units for shares of our Class A common stock on a one-for-one basis. These exchanges are expected to result in increases in the tax basis of the tangible and intangible assets of AMC that otherwise would not have been available. These increases in tax basis may increase depreciation and amortization for U.S. income tax purposes and thereby reduce the amount of tax that we would otherwise be required to pay in the future. We entered into the TRA that provides payment to the TRA recipients of 85% of the amount of actual cash savings, if any, in U.S. federal, state, local and foreign income tax or franchise tax that we actually realize as a result of these increases in tax basis and of certain other tax benefits related to entering into the TRA, including tax benefits attributable to payments under the TRA and interest accrued thereon. Future payments under the TRA in respect of subsequent exchanges are expected to be substantial. The TRA liability balance was $99.0 million and $100.5 million as of June 30, 2022 and December 31, 2021, respectively.
For a discussion of our debt obligations, including the debt obligations of our consolidated funds, see “Note 8. Debt,” to our unaudited condensed consolidated financial statements included in this Quarterly Report on Form 10-Q.
Critical Accounting Estimates
We prepare our unaudited condensed consolidated financial statements in accordance with GAAP. In applying many of these accounting principles, we need to make assumptions, estimates or judgments that affect the reported amounts of assets, liabilities, revenues and expenses in our unaudited condensed consolidated financial statements. We base our estimates and judgments on historical experience and other assumptions that we believe are reasonable under the circumstances. These assumptions, estimates or judgments, however, are both subjective and subject to change, and actual results may differ from our assumptions and estimates. Actual results may also differ from our estimates and judgments due to risks and uncertainties. If actual amounts are ultimately different from our estimates, the revisions are included in our results of operations for the period in which the actual amounts become known. For a summary of our significant accounting policies, see “Note 2. Summary of Significant Accounting Policies,” to our unaudited condensed consolidated financial statements included in this Quarterly Report on Form 10-Q and in our Annual Report on Form 10-K for the year ended December 31, 2021. For a summary of our critical accounting estimates, please see "Management's Discussion and Analysis of Financial Condition and Results of Operations—Critical Accounting Estimates" in our Annual Report on Form 10-K.
Recent Accounting Pronouncements
Information regarding recent accounting pronouncements and their impact on the Company can be found in “Note 2. Summary of Significant Accounting Policies,” of our unaudited condensed consolidated financial statements included in this Quarterly Report on Form 10-Q.
Commitments and Contingencies
In the normal course of business, we enter into contractual obligations that may require future cash payments. We may also engage in off-balance sheet arrangements, including transactions in derivatives, guarantees, capital commitments to funds, indemnifications and potential contingent repayment obligations. For further discussion of our derivatives, guarantees, capital commitments, indemnification arrangements and contingent obligations, see “Note 7. Derivative Financial Instruments” and “Note 9. Commitments and Contingencies” to our unaudited condensed consolidated financial statements included in this Quarterly Report on Form 10-Q.
Previous: Item 1. Financial Statements · Next: Item 3. Quantitative and Qualitative Disclosures About Market Risk