 filings.tools
Item 5. Market for Registrant’s Common Equity, Related Stockholder Matters and Issuer Purchases of Equity Securities.
5K characters. Original on sec.gov · Markdown
Item 5. Market for Registrant’s Common Equity, Related Stockholder Matters and Issuer Purchases of Equity Securities.
Our stock trades on the New York Stock Exchange under the trading symbol “ATO.” The dividends paid per share of our common stock for fiscal 2018 and 2017 are listed below.
| Fiscal 2018 | Fiscal 2017 | |||||||
| Quarter ended: | ||||||||
| December 31 | $ | 0.485 | $ | 0.450 | ||||
| March 31 | 0.485 | 0.450 | ||||||
| June 30 | 0.485 | 0.450 | ||||||
| September 30 | 0.485 | 0.450 | ||||||
| $ | 1.94 | $ | 1.80 |
Dividends are payable at the discretion of our Board of Directors out of legally available funds. The Board of Directors typically declares dividends in the same fiscal quarter in which they are paid. The number of record holders of our common stock on October 31, 2018 was 12,550. Future payments of dividends, and the amounts of these dividends, will depend on our financial condition, results of operations, capital requirements and other factors. We sold no securities during fiscal 2018 that were not registered under the Securities Act of 1933, as amended.
Performance Graph
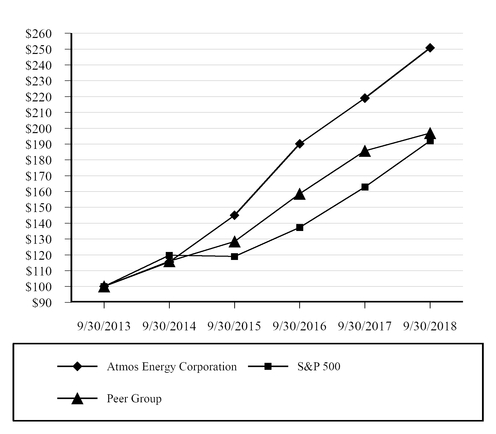
The performance graph and table below compares the yearly percentage change in our total return to shareholders for the last five fiscal years with the total return of the S&P 500 Stock Index (S&P 500) and the cumulative total return of a customized peer company group, the Comparison Company Index. The Comparison Company Index is comprised of natural gas distribution companies with similar revenues, market capitalizations and asset bases to that of the Company. The graph and table below assume that $100.00 was invested on September 30, 2013 in our common stock, the S&P 500 and in the common stock of the companies in the Comparison Company Indices, as well as a reinvestment of dividends paid on such investments throughout the period.
Comparison of Five-Year Cumulative Total Return
among Atmos Energy Corporation, S&P 500 Index
and Comparison Company Index
| Cumulative Total Return | |||||||||||||||||
| 9/30/2013 | 9/30/2014 | 9/30/2015 | 9/30/2016 | 9/30/2017 | 9/30/2018 | ||||||||||||
| Atmos Energy Corporation | 100.00 | 115.52 | 145.03 | 190.13 | 218.98 | 250.80 | |||||||||||
| S&P 500 Stock Index | 100.00 | 119.73 | 119.00 | 137.36 | 162.92 | 192.10 | |||||||||||
| Peer Group | 100.00 | 116.03 | 128.49 | 158.62 | 185.66 | 196.95 |
The Comparison Company Index reflects the cumulative total return of companies in our peer group, which is comprised of a hybrid group of utility companies, primarily natural gas distribution companies, recommended by our independent executive compensation consulting firm and approved by the Board of Directors. The companies in the index are Alliant Energy Corporation, Ameren Corporation, CenterPoint Energy, Inc., CMS Energy Corporation, DTE Energy Company, National Fuel Gas Company, NiSource Inc., ONE Gas, Inc., Spire Inc. (formerly The Laclede Group, Inc.), Vectren Corporation, WEC Energy Group, Inc., WGL Holdings, Inc., and Xcel Energy, Inc.
| (1) | WGL Holdings Inc. was acquired prior to September 30, 2018. As a result, the cumulative total return of this company is not included in the Comparison Company Index represented in the graph above. |
The following table sets forth the number of securities authorized for issuance under our equity compensation plans at September 30, 2018.
| Number of securities to be issued upon exercise of outstanding options, restricted stock units, warrants and rights | Weighted-average exercise price of outstanding options, warrants and rights | Number of securities remaining available for future issuance under equity compensation plans (excluding securities reflected in column (a)) | |||||||
| (a) | (b) | (c) | |||||||
| Equity compensation plans approved by security holders: | |||||||||
| 1998 Long-Term Incentive Plan | 1,041,519 | (1) | $ | — | 1,752,235 | ||||
| Total equity compensation plans approved by security holders | 1,041,519 | — | 1,752,235 | ||||||
| Equity compensation plans not approved by security holders | — | — | — | ||||||
| Total | 1,041,519 | $ | — | 1,752,235 |
| (1) | Comprised of a total of 422,996 time-lapse restricted stock units, 343,952 director share units and 274,571 performance-based restricted stock units at the target level of performance granted under our 1998 Long-Term Incentive Plan. |
Previous: Item 4. Mine Safety Disclosures. · Next: Item 6. Selected Financial Data.