 filings.tools
Broadcom 10-K 2022-10-30
Filed 2022-12-16. 23 sections, 496K characters. Original on sec.gov · Markdown · JSON
Cover and table of contents
UNITED STATES SECURITIES AND EXCHANGE COMMISSION
Washington, DC 20549
Form 10-K
| (MARK ONE) | ||||||||
| ☑ | ANNUAL REPORT PURSUANT TO SECTION 13 OR 15(d) OF THE SECURITIES EXCHANGE ACT OF 1934 |
For the fiscal year ended October 30, 2022
OR
| ☐ | TRANSITION REPORT PURSUANT TO SECTION 13 OR 15(d) OF THE SECURITIES EXCHANGE ACT OF 1934 |
For the transition period from to
| Broadcom Inc. | |||||||||||||||||||||||||||||
| Delaware | 1320 Ridder Park Drive | 001-38449 | 35-2617337 | ||||||||||||||||||||||||||
| (State or Other Jurisdiction of Incorporation or Organization) | San Jose, | CA | 95131-2313 | (Commission File Number) | (I.R.S. Employer Identification No.) | ||||||||||||||||||||||||
| (408) | 433-8000 | ||||||||||||||||||||||||||||
| (Exact Name of Registrant as Specified in Its Charter Address of Principal Executive Offices, Including Zip Code Registrant’s Telephone Number, Including Area Code) |
| Securities registered pursuant to Section 12(b) of the Act: | ||||||||
| Title of Each Class | Trading Symbol(s) | Name of Each Exchange on Which Registered | ||||||
| Common Stock, $0.001 par value | AVGO | The NASDAQ Global Select Market |
| Securities registered pursuant to Section 12(g) of the Act: None |
Indicate by check mark if the registrant is a well-known seasoned issuer, as defined in Rule 405 of the Securities Act. Yes ☑ No ☐
Indicate by check mark if the registrant is not required to file reports pursuant to Section 13 or Section 15(d) of the Act. Yes ☐ No ☑
Indicate by check mark whether the registrant (1) has filed all reports required to be filed by Section 13 or 15(d) of the Securities Exchange Act of 1934 during the preceding 12 months (or for such shorter period that the registrant was required to file such reports), and (2) has been subject to such filing requirements for the past 90 days. Yes ☑ No ☐
Indicate by check mark whether the registrant has submitted electronically every Interactive Data File required to be submitted pursuant to Rule 405 of Regulation S-T (§232.405 of this chapter) during the preceding 12 months (or for such shorter period that the registrant was required to submit such files). Yes ☑ No ☐
Indicate by check mark whether the registrant is a large accelerated filer, an accelerated filer, a non-accelerated filer, a smaller reporting company, or an emerging growth company. See the definitions of “large accelerated filer,” “accelerated filer,” “smaller reporting company,” and “emerging growth company” in Rule 12b-2 of the Exchange Act.
| Large accelerated filer | ☑ | Accelerated filer | ☐ | Non-accelerated filer | ☐ | Smaller reporting company | ☐ | Emerging growth company | ☐ |
If an emerging growth company, indicate by check mark if the registrant has elected not to use the extended transition period for complying with any new or revised financial accounting standards provided pursuant to Section 13(a) of the Exchange Act. ☐
Indicate by check mark whether the registrant has filed a report on and attestation to its management’s assessment of the effectiveness of its internal control over financial reporting under Section 404(b) of the Sarbanes-Oxley Act (15 U.S.C. 7262(b)) by the registered public accounting firm that prepared or issued its audit report. ☑
Indicate by check mark whether the registrant is a shell company (as defined in Rule 12b-2 of the Exchange Act). Yes ☐ No ☑
The aggregate market value of voting and non-voting common equity held by non-affiliates as of April 29, 2022, based upon the closing sale price of such shares on The Nasdaq Global Select Market on such date was approximately $220.1 billion.
As of November 25, 2022, there were 417,886,140 shares of our common stock outstanding.
Documents Incorporated by Reference
Portions of the registrant’s definitive Proxy Statement for its 2023 Annual Meeting of Stockholders are incorporated by reference into Part III of this Annual Report on Form 10-K.
BROADCOM INC.
2022 ANNUAL REPORT ON FORM 10-K
TABLE OF CONTENTS
PART I
The following discussion should be read in conjunction with the consolidated financial statements and notes thereto included elsewhere in this Annual Report on Form 10-K. This Annual Report on Form 10-K contains forward-looking statements within the meaning of the federal securities laws and particularly in Item 1: “Business,” Item 1A: “Risk Factors,” Item 3: “Legal Proceedings” and Item 7: “Management’s Discussion and Analysis of Financial Condition and Results of Operations” of this Annual Report on Form 10-K. These statements are indicated by words or phrases such as “anticipate,” “expect,” “estimate,” “seek,” “plan,” “believe,” “could,” “intend,” “will,” and similar words or phrases. These forward-looking statements may include projections of financial information; statements about historical results that may suggest trends for our business; statements of the plans, strategies, and objectives of management for future operations; statements of expectation or belief regarding future events (including any acquisitions we may make), technology developments, our products, product sales, expenses, liquidity, cash flow and growth rates, or enforceability of our intellectual property rights; any backlog; and the effects of seasonality on our business. Such statements are based on current expectations, estimates, forecasts and projections of our industry performance and macroeconomic conditions, based on management’s judgment, beliefs, current trends and market conditions, and involve risks and uncertainties that may cause actual results to differ materially from those contained in the forward-looking statements. We derive most of our forward-looking statements from our operating budgets and forecasts, which are based upon many detailed assumptions. While we believe that our assumptions are reasonable, we caution that it is very difficult to predict the impact of known factors, and it is impossible for us to anticipate all factors that could affect our actual results. Accordingly, we caution you not to place undue reliance on these statements. Material factors that could cause actual results to differ materially from our expectations are summarized and disclosed under “Risk Factors” in Part I, Item 1A of this Annual Report on Form 10-K.
Unless stated otherwise or the context otherwise requires, references to “Broadcom,” “we,” “our,” and “us” mean Broadcom Inc. and its consolidated subsidiaries. Our fiscal year ends on the Sunday closest to October 31 in a 52-week year and the first Sunday in November in a 53-week year. We refer to our fiscal years by the calendar year in which they end. For example, the fiscal year ended October 30, 2022 was a 52-week year.
Item 1. BUSINESS
Overview
We are a global technology leader that designs, develops and supplies a broad range of semiconductor and infrastructure software solutions. Our over 50-year history of innovation dates back to our diverse origins from Hewlett-Packard Company, AT&T, LSI Corporation, Broadcom Corporation, Brocade Communications Systems LLC, CA, Inc. and Symantec Enterprise Security. Over the years, we have assembled a large team of semiconductor and software design engineers around the world. We maintain design, product and software development engineering resources at locations in the U.S., Asia, Europe and Israel, providing us with engineering expertise worldwide. We strategically focus our research and development resources to address niche opportunities in our target markets and leverage our extensive portfolio of U.S. and other patents, and other intellectual property (“IP”) to integrate multiple technologies and create system-on-chip (“SoC”) component and software solutions that target growth opportunities. We design products and software that deliver high-performance and provide mission critical functionality.
We develop semiconductor devices with a focus on complex digital and mixed signal complementary metal oxide semiconductor (“CMOS”) based devices and analog III-V based products. We have a history of innovation in the semiconductor industry and offer thousands of products that are used in end products such as enterprise and data center networking, home connectivity, set-top boxes (“STB”), broadband access, telecommunication equipment, smartphones and base stations, data center servers and storage systems, factory automation, power generation and alternative energy systems, and electronic displays. We differentiate ourselves through our high performance design and integration capabilities and focus on developing products for target markets where we believe we can earn attractive margins.
Our infrastructure software solutions enable customers to plan, develop, automate, manage, and secure applications across mainframe, distributed, mobile, and cloud platforms. Many of the largest companies in the world, including most of the Fortune 500, and many government agencies rely on our software solutions to help manage and secure their on-premise and hybrid cloud environments. Our portfolio of industry-leading infrastructure and security software is designed to modernize, optimize, and secure the most complex hybrid environments, enabling scalability, agility, automation, insights, resiliency and security. We also offer mission critical fibre channel storage area networking (“FC SAN”) products and related software in the form of modules, switches and subsystems incorporating multiple semiconductor products.
Business Strategy
Our strategy is to combine best-of-breed technology leadership in semiconductor and infrastructure software solutions, with unmatched scale, on a common sales and administrative platform to deliver a comprehensive suite of infrastructure technology products to the world’s leading business and government customers. We seek to achieve this through responsibly financed acquisitions of category-leading businesses and technologies, as well as investing extensively in research and development, to ensure our products retain their technology leadership. This strategy results in a robust business model designed to drive diversified and sustainable operating and financial results.
Products and Markets
Semiconductor Solutions
Semiconductors are made by imprinting a network of electronic components onto a semiconductor wafer. These devices are designed to perform various functions such as processing, amplifying and selectively filtering electronic signals, controlling electronic system functions and processing, and transmitting and storing data. Our digital and mixed signal products are based on silicon wafers with CMOS transistors offering fast switching speeds and low power consumption, which are both critical design factors for the markets we serve. We also offer analog products, which are based on III-V semiconductor materials that have higher electrical conductivity than silicon, and thus tend to have better performance characteristics in radio frequency (“RF”), and optoelectronic applications. III-V refers to elements from the 3rd and 5th groups in the periodic table of chemical elements. Examples of these materials used in our products are gallium arsenide (“GaAs”) and indium phosphide (“InP”).
We provide semiconductor solutions for managing the movement of data in data center, service provider, enterprise and embedded networking applications. We provide a broad variety of RF semiconductor devices, wireless connectivity solutions, custom touch controllers and inductive charging solutions for the wireless market. We also provide semiconductor solutions for enabling the STB and broadband access applications and for enabling secure movement of digital data to and from host machines, such as servers, personal computers and storage systems, to the underlying storage devices, such as hard disk drives (“HDD”) and solid-state drives (“SSD”).
Our product portfolio ranges from discrete devices to complex sub-systems that include multiple device types and may also incorporate firmware for interfacing between analog and digital systems. In some cases, our products include mechanical hardware that interfaces with optoelectronic or capacitive sensors. We focus on markets that require high quality and the
technology leadership and integrated performance characteristic of our products. The table below presents our material semiconductor product families and their major end markets and applications during fiscal year 2022.
| Major End Markets | Major Applications | Material Product Families | |||||||||
| Broadband | • STB and Broadband Access | • STB SoCs | |||||||||
| • DSL/PON gateways | |||||||||||
| • DOCSIS cable modem | |||||||||||
| • DSLAM/PON optical line termination | |||||||||||
| • Wi-Fi access point SoCs | |||||||||||
| Networking | • Data Center, Service Provider, Enterprise and Embedded Networking | • Ethernet switching and routing merchant silicon | |||||||||
| • Embedded processors and controllers | |||||||||||
| • Custom silicon solutions | |||||||||||
| • Optical and copper PHYs | |||||||||||
| • Fiber optic transmitter and receiver components | |||||||||||
| Wireless | • Mobile Device Connectivity | • RF front end modules and filters | |||||||||
| • Wi-Fi, Bluetooth, GPS/GNSS SoCs | |||||||||||
| • Custom touch controllers | |||||||||||
| • Inductive charging ASICs | |||||||||||
| Storage | • Servers and Storage Systems | • SAS and RAID controllers and adapters | |||||||||
| • PCIe switches | |||||||||||
| • Fibre channel host bus adapters | |||||||||||
| • Ethernet NIC | |||||||||||
| • HDD and SSD | • Read channel based SoCs; Custom flash controllers | ||||||||||
| • Preamplifiers | |||||||||||
| Industrial | • Factory Automation, Renewable Energy and Automotive Electronics | • Optocouplers | |||||||||
| • Industrial fiber optics | |||||||||||
| • Motion control encoders and subsystems | |||||||||||
| • Light emitting diode | |||||||||||
| • Ethernet PHYs, switch ICs and camera microcontrollers | |||||||||||
Set-Top Box Solutions: We offer complete SoC platform solutions for cable, satellite, Internet Protocol television, over-the-top and terrestrial STBs. Our products enable global service providers to introduce new and enhanced technologies and services in STBs, including transcoding, digital video recording functionality, higher definition video processing, increased networking capabilities, and more tuners to enable faster channel change and more simultaneous recordings. We are also enabling service providers in deploying High Efficiency Video Coding (“HEVC”), a video compression format that is a successor to the H.264/MPEG-4 format. HEVC enables ultra-high definition (“Ultra HD”), services by effectively doubling the capacity of existing networks to deploy new or existing content. Our families of STB solutions support the complete range of resolutions, from standard definition, to high definition, and Ultra HD.
Broadband Access Solutions: We offer complete SoC platform solutions for digital subscriber line (“DSL”), cable, passive optical networking (“PON”) and wireless local area network for both consumer premise equipment (“CPE”) and central office (“CO”) deployments. Our CPE devices are used in broadband modems, residential gateways and Wi-Fi access points and routers. Our CO devices, including DSL Access Multiplexer (“DSLAM”), cable modem termination systems and PON optical line termination medium access controller, are empowering modern operator broadband infrastructure. Our products enable global service providers to continue to deploy next generation broadband access technologies across multiple standards, including G.fast, Data Over Cable Service Interface Specifications (“DOCSIS”), PON and Wi-Fi to provide more bandwidth and faster speeds to consumers.
Ethernet Switching & Routing: Ethernet is a ubiquitous interconnection technology that enables high performance and cost effective networking infrastructure. We offer a broad set of Ethernet switching and routing products that are optimized for data center, service provider network, enterprise network, and embedded network applications. In the data center market, our high capacity, low latency, switching silicon supports advanced protocols around virtualization and multi-pathing. Our Ethernet switching fabric technologies provide the ability to build highly scalable flat networks supporting tens of thousands of servers. Our service provider switch portfolio enables carrier/service provider networks to support a large number of services in the wireless backhaul, access, aggregation and core of their networks. For enterprise networks and embedded Ethernet applications, we offer product families that combine multi-layer switching capabilities and support lower power modes that comply with industry standards around energy efficient Ethernet.
Embedded Processors & Controllers: Our embedded processors leverage our ARM central processing unit and Ethernet switching technology to deliver SoCs for high performance embedded applications in a wide range of communication products such as voice-over-internet-protocol, telephony, point-of-sale devices and enterprise and retail access points and gateways. We offer a range of knowledge-based processors to enable high-performance decision-making for packet processing in a variety of advanced devices in the enterprise, metro, access, edge and core networking spaces. We also offer a range of Ethernet controllers for servers and storage systems supporting multiple generations of Ethernet technology.
Custom Silicon Solutions: We provide advanced technology and IP platforms for customers to design and develop application specific integrated circuits (“ASICs”), targeting data center compute offload, legacy and new 5G radio infrastructure, and wired communication networks. Our custom silicon provides the platform to integrate embedded logic, memory, serializer/deserializer (“SerDes”) technology, IP cores and processor cores. The ASICs are custom products built to individual customers specifications.
Physical Layer Devices: These devices, also referred to as PHYs, are transceivers that enable the reception and transmission of Ethernet data packets over a physical medium such as copper wire or optical fibers. Our high performance Ethernet transceivers are built upon a proprietary digital signal processing communication architecture optimized for high-speed network connections and support the latest standards and advanced features, such as energy efficient Ethernet, data encryption and time synchronization. We also offer a range of automotive Ethernet products, including PHYs, switches and camera microcontrollers, to meet growing consumer demand for in-vehicle connectivity and smart vision.
Fiber Optic Components: We supply a wide array of optical components to the Ethernet networking, storage, and access, metro- and long-haul telecommunication markets. Our optical components enable the high speed reception and transmission of data through optical fibers.
RF Semiconductor Devices: Our RF semiconductor devices selectively filter, as well as amplify and route, RF signals. Filters enable modern wireless communication systems to support a large number of subscribers simultaneously by ensuring that the multiple transmissions and receptions of voice and data streams do not interfere with each other. We were among the first to deliver commercial film bulk acoustic resonator (“FBAR”) filters that offer technological advantages over competing filter technologies, to allow mobile handsets to function more efficiently in today's congested RF spectrum. FBAR technology has a significant market share within the cellular handset market. Our RF products include multi-chip module front-end modules that integrate transmit/receive switching and filtering functions for multiple frequency bands, filter modules and discrete filters, all using our proprietary FBAR technology.
Our expertise in FBAR technology, amplifier design, and module integration enables us to offer industry-leading performance in cellular RF transceiver applications.
Connectivity Solutions: Our connectivity solutions include discrete and integrated Wi-Fi and Bluetooth solutions, and global positioning system/global navigation satellite system (“GPS/GNSS”) receivers, designed for use in mobile devices including smartphones, tablets and wearable products.
Wi-Fi allows devices on a local area network to communicate wirelessly, adding the convenience of mobility to the utility of high-speed data networks. We offer a family of high performance, low power Wi-Fi chipsets. Bluetooth is a low power technology that enables direct connectivity between devices. We offer a complete family of Bluetooth silicon and software solutions that enable manufacturers to easily and cost-effectively add Bluetooth functionality to virtually any device. These solutions include combination chips that offer integrated Wi-Fi and Bluetooth functionality, which provides significant performance advantages over discrete solutions.
We also offer a family of GPS, assisted-GPS and GNSS semiconductor products, software and data services. These products are part of a broader location platform that leverages a broad range of communications technologies, including Wi-Fi, Bluetooth and GPS, to provide more accurate location and navigation capabilities.
Custom Touch Controllers: Our touch controllers process signals from touch screens in mobile handsets and tablets.
Inductive Charging ASICs: Our custom inductive charging ASIC devices offer high efficiency and are highly integrated solutions for mobile and wearable devices.
SAS, RAID & PCIe Products: We provide serial attached small computer system interface (“SAS”) and redundant array of independent disks (“RAID”) controller and adapter solutions to server and storage system original equipment manufacturers (“OEMs”). These solutions enable secure and high speed data transmission between a host computer, such as a server, and storage peripheral devices, such as HDD, SSD and optical disk drives and disk and tape-based storage systems. Some of these solutions are delivered as stand-alone semiconductors, typically as a controller. Other solutions are delivered as circuit boards, known as adapter products, which incorporate our semiconductors onto a circuit board with other features. RAID technology is a critical part of our server storage connectivity solutions as it provides protection against the loss of critical data resulting from HDD failures.
We also provide interconnect semiconductors that support the peripheral component interconnect express (“PCIe”) communication standards. PCIe is the primary interconnection mechanism inside computing systems today.
Fibre Channel Products: We provide fibre channel host bus adapters, which connect host computers such as servers to FC SANs.
Ethernet Network Interface Card (“NIC”) Controllers: Our Ethernet NIC controllers are designed for high-performance virtualization, intelligent flow processing, secure data center connectivity, and machine learning.
HDD & SSD Products: We provide read channel-based SoCs and preamplifiers to HDD OEMs. These are the critical chips required to read, write and protect data. An HDD SoC is an integrated circuit (“IC”) that combines the functionality of a read channel, serial interface, memory and a hard disk controller in a small, high-performance, low-power and cost-effective package. Read channels convert analog signals that are generated by reading the stored data on the physical media into digital signals.
In addition, we sell preamplifiers, which are complex, high speed, mixed signal devices that enable writing and reading data to and from the HDD heads. The preamplifier interfaces with the SoC to provide the electronics data path in a HDD.
We also provide custom flash controllers to SSD OEMs. An SSD stores data in flash memory instead of on a hard disk, providing high speed access to the data. Flash controllers manage the underlying flash memory in SSDs, performing critical functions such as reading and writing data to and from the flash memory and performing error correction, wear leveling and bad block management.
Industrial End Markets: We also provide a broad variety of products for the general industrial and automotive markets, including optocouplers, industrial fiber optics, motion encoders, light emitting diode devices, and Ethernet ICs. Our industrial products are used in a diverse set of applications, spanning industrial automation, power generation and distribution systems, medical systems and equipment, defense and aerospace, and vehicle subsystems including those used in electric vehicle powertrain, infotainment and advanced driver assistance system.
Infrastructure Software
Our infrastructure software solutions enables customers greater choice and flexibility to build, run, manage, connect and protect applications at scale across diversified and distributed environments.
Our mainframe software provides market-leading DevOps, AIOps, Security and Data Management Systems solutions. We help enterprises embrace open tools and technologies, integrate their mainframe into their cloud infrastructures, and amplify the value of their mainframe investments. By partnering with our customers and providing creative value-added programs, we help customers overcome challenges related to skills development, technical education, strategy and planning, and the need for cloud-like pricing flexibility to support their overall business success with the platform.
Our distributed software solutions enable global enterprises to optimize the planning, development and delivery of software, powering their business critical digital services. Our solutions are designed to enable customers to innovate, improve customer experience, and drive profitability by aligning business, development, and operational teams. Our products, organized in the domains of ValueOps, DevOps, and AIOps, deliver end-to-end visibility across all stages of the digital lifecycle and help our customers realize better business outcomes and better experiences for their customers.
Our Symantec cyber security software solutions help organizations and governments secure against threats and compliance risks by protecting their users and data on any app, device, or network. Our integrated cyber defense approach simplifies cyber security with comprehensive solutions designed to secure critical business assets across on-premises and cloud infrastructures. Our Symantec solutions utilize rich threat intelligence from a global network of security engineers, threat analyst and researchers, as well as advanced artificial intelligence (“AI”) and machine-learning engines, enabling customers to protect data, connect authorized users with trusted applications, and detect and respond to the most advanced targeted attacks.
We also offer mission critical FC SAN products designed to help customers reduce the cost and complexity of managing business information within a shared data storage environment, enabling high levels of availability of mission critical applications in the form of modules, switches and subsystems incorporating multiple semiconductor products. We deliver reliable and simplified management of these FC SAN products through our software-based management tools designed to maximize uptime, dramatically simplify storage area networking deployment and management, and provide high levels of visibility and insight into the storage network.
The table below presents our software portfolios and their material offerings during fiscal year 2022.
| Software Portfolio | Portfolio Description | Major Portfolio Offerings | |||||||||
| Mainframe Software | • Solutions for DevOps, AIOps, Security and Database Management Systems | • Operational Analytics & Management | |||||||||
| • Automation | |||||||||||
| • Database & Database Management | |||||||||||
| • Application Development & Testing | |||||||||||
| • Identity & Access Management | |||||||||||
| • Compliance & Data Protection | |||||||||||
| • Security Insights | |||||||||||
| Distributed Software | • Solutions that optimize the planning, development and delivery of business critical services | • ValueOps | |||||||||
| • DevOps | |||||||||||
| • AIOps | |||||||||||
| Symantec Cyber Security | • Comprehensive threat protection and compliance solutions that secure against threats and compliance risks by protecting users and data on any app, device, or network | • Endpoint Security | |||||||||
| • Network Security | |||||||||||
| • Information Security | |||||||||||
| • Identity Security | |||||||||||
| FC SAN Management | • Solutions that transforms current storage networks with autonomous SAN capabilities | • Fibre Channel Switch | |||||||||
| Payment Security | • Arcot payment authentication network powered by 3-D Secure | • Payment Security Suite |
Operational Analytics & Management*:* These solutions combine big data, machine learning and AI with mainframe expertise to deliver meaningful and actionable insights to augment and automate day-to-day operations and deliver exceptional customer experiences.
Automation**:** These solutions reduce manual effort by enabling customers to proactively optimize resources and orchestrate automation across enterprise applications and systems.
Databases & Database Management*:* These high-performance databases and management tools store, organize, and manage mainframe data to ensure optimal performance, efficient administration, and reliability of critical systems.
Application Development & Testing*:* These solutions enable customers to accelerate software delivery while increasing code quality through the use of our agile processes and tools, and DevOps solutions. Our open-first strategy helps customers modernize their mainframe environment through the use of open source and open application programming technologies across people, process, tooling and applications, resulting in greater synergy and alignment with their corporate information technology (“IT”).
Identity & Access Management*:* These solutions manage mainframe access and elevate it with modern practices such as multi-factor authentication, managing access for privileged users, and supporting all external security managers.
Compliance & Data Protection*:* These solutions locate and protect sensitive mainframe data to ensure compliance and identify risk, identify and proactively respond to potential risks and bad actors, and reduce risk and lighten security management load with automated identification and authorization cleanup.
Security Insights Platform*:* This solution helps ensure a trusted environment for customers and their employees by quickly interpreting and assessing mainframe security posture, identifying risks and developing remediation steps on an ongoing and ad hoc basis. This data is available for use with in-house tools for security information and event management.
ValueOps*:* This solution delivers value stream management capabilities that enable customers to schedule, track, and manage work throughout its lifecycle from investment planning to execution. It aligns business and development teams across the enterprise, increasing transparency, reducing inefficiencies, and improving time to value.
DevOps: This solution offers capabilities that empower users of our agile processes and tools to track development progress and deploy releases confidently with assurance of feature completeness, high-quality and reduced risk. Key stakeholders have a single view of key insights into release progress, health, quality, and defect trends, and metrics that drive focus, gauge readiness, and help to ensure successful, quality releases.
AIOps: This solution combines application, infrastructure and network monitoring and correlation with intelligent remediation capabilities to help customers create more resilient production environments and improve customer experience.
Endpoint Security: Endpoints are the critical last line of defense against cyber attackers. Our Symantec endpoint security solutions prevent, detect and respond to emerging threats across all devices and operating systems including laptops, desktops, tablets, mobile phones, servers and cloud workloads through an intelligent AI driven security console and single agent.
Network Security: Email and web access are the lifeblood and essential communication means for every modern organization. We have a full array of network security solutions, as well as a shared set of advanced threat protection technologies to stop inbound and outbound threats targeting end users, information and key infrastructure.
Information Security: Information protection and compliance is critical to managing risk. We offer integrated information security solutions, based on an efficient, single-policy that can be applied across the entire environment, to help organizations identify and protect risky users, applications and their most sensitive data everywhere across endpoints, on-premises networks, cloud services and private applications.
Identity Security: User identities are under attack by cyber criminals hoping to exploit their access and privileges and do harm. We mitigate these attacks by positively identifying legitimate users, enforcing granular access control policies, and streamlining access governance to prevent unauthorized access to sensitive resources and data.
Fibre Channel Switch Products: Our Brocade Fibre Channel switch products provide interconnection, bandwidth and high-speed switching between servers and storage devices which are in a FC SAN. FC SANs are networks dedicated to mission critical storage traffic, and enable simultaneous high speed and secure connections among multiple host computers and multiple storage arrays.
Payment Security Suite: This is a software as a service (“SaaS”)-based payment authentication service to help banks and merchants protect against fraud and ensure a hassle-free online shopping experience for their customers.
Research and Development
We are committed to continuous investment in product development and enhancement, with a focus on rapidly introducing new, proprietary products and releases. Many of our products have grown out of our own research and development efforts, and have given us competitive advantages in certain target markets due to performance differentiation. However, we opportunistically seek to enhance our capabilities through the acquisition of engineers with complementary research and development skills and complementary technologies and businesses. We focus our research and development efforts on the development of mission critical, innovative, sustainable and higher value product platforms and those that improve the quality and stability in our broadly deployed products. We leverage our design capabilities in markets where we believe our innovation and reputation will allow us to earn attractive margins by developing high value-add products.
We plan to continue investing in product development, both organically and through acquisitions, to drive growth in our business. We also invest in process development and improvements to product features and functions, as well as fabrication capabilities to optimize processes for devices that are manufactured internally. Our field application engineers, design engineers, and product and software development engineers are located in many places around the world, and in many cases near our top customers. This enhances our customer reach and our visibility into new product opportunities and, in the case of our semiconductor customers, enables us to support our customers in each stage of their product development cycle, from the early stages of production design to volume manufacturing and future growth. By collaborating with our customers, we have opportunities to develop high value-added, customized products for them that leverage our existing technologies. We anticipate that we will continue to make significant research and development expenditures in order to maintain our competitive position, and to ensure a continuous flow of innovative and sustainable product platforms.
Customers, Sales and Distribution
We sell our products through our direct sales force and a select network of distributors and channel partners globally. Distributors and OEMs, or their contract manufacturers, typically account for the substantial majority of our semiconductor sales. A relatively small number of customers account for a significant portion of our net revenue. Sales to distributors accounted for 56% and 53% of our net revenue for fiscal years 2022 and 2021, respectively. We believe aggregate sales to our top five end customers, through all channels, accounted for approximately 35% of our net revenue for each of our fiscal years 2022 and 2021. We believe aggregate sales to Apple Inc., through all channels, accounted for approximately 20% of our net revenue for each of fiscal years 2022 and 2021. We expect to continue to experience significant customer concentration in future periods. The loss of, or significant decrease in demand from, any of our top five end customers could have a material adverse effect on our business, results of operations and financial condition.
Many of our semiconductor customers design products in North America or Europe that are then manufactured in Asia. To serve customers around the world, we have strategically developed relationships with large global electronic component distributors, complemented by a number of regional distributors with customer relationships based on their respective product ranges. We also sell our products to a wide variety of OEMs or their contract manufacturers. We have established
strong relationships with leading OEM customers across multiple target markets. Our direct sales force focuses on supporting our large OEM customers, and has specialized product and service knowledge that enables us to sell specific offerings at key levels throughout a customer’s organization. Certain customers require us to contract with them directly and with specified intermediaries, such as contract manufacturers. Many of our major customer relationships have been in place for many years and are often the result of years of collaborative product development. This has enabled us to build our extensive IP portfolio and develop critical expertise regarding our customers’ requirements, including substantial system-level knowledge. This collaboration has provided us with key insights into our customers' businesses and has enabled us to be more efficient and productive and to better serve our target markets and customers. Many of our customers and their contract manufacturers often require time critical delivery of our products to multiple locations around the world. With sales offices located in various countries, our primary warehouse in Malaysia, and dedicated regional customer support call centers, where we address customer issues and handle logistics and other order fulfillment requirements, we believe we are well-positioned to support our customers throughout the design, technology transfer and manufacturing stages across all geographies.
Our software customers are in most major industries worldwide, including banks, insurance companies, other financial services providers, government agencies, global IT service providers, telecommunication providers, transportation companies, manufacturers, technology companies, retailers, educational organizations and health care institutions. Our customers generally consist of large enterprises that have computing environments from multiple vendors and are highly complex. We remain focused on strengthening relationships and increasing penetration within our existing core, mainframe-centric, and Symantec endpoint customers and expanding the adoption of our enterprise software offerings with these customers. We believe our enterprise-wide license model will continue to offer our customers reduced complexity, more flexibility and an easier renewal process that will help drive revenue growth.
Manufacturing Operations
We focus on maintaining an efficient global supply chain and a variable, low-cost operating model. Accordingly, we outsource a majority of our manufacturing operations, utilizing third-party foundry and assembly and test capabilities, as well as some of our corporate infrastructure functions. The majority of our front-end wafer manufacturing operations is outsourced to external foundries, including Taiwan Semiconductor Manufacturing Company Limited (“TSMC”). We use third-party contract manufacturers for a significant majority of our assembly and test operations, including Advanced Semiconductor Engineering, Inc., Foxconn Technology Group, Amkor Technology, Inc. and Siliconware Precision Industries Co., Ltd. We use our internal fabrication facilities for products utilizing our innovative and proprietary processes, such as our FBAR filters for wireless communications and our vertical-cavity surface emitting laser and side emitting lasers-based on GaAs and InP lasers for fiber optic communications, while outsourcing commodity processes such as standard CMOS. By doing so, we can protect our IP and accelerate time to market for our products. The majority of our internal III-V semiconductor wafer fabrication is done in the U.S. and Singapore.
We also have a long history of operating in Asia where we manufacture and source the majority of our products and materials. We store the majority of our product inventory in our warehouse in Malaysia and our presence in Asia places us in close proximity to many of our customers’ manufacturing facilities.
Manufacturing Materials and Suppliers
Our manufacturing operations employ a wide variety of semiconductors, electromechanical components and assemblies and raw materials. We purchase materials from hundreds of suppliers on a global basis. These purchases are generally on a purchase order basis and some parts are not readily available from alternate suppliers due to their unique design or the length of time and cost necessary for re-design or qualification. To address the potential disruption in our supply chain, we may use a number of techniques, including redesigning products for alternative components, making incremental or “lifetime” purchases, or qualifying more than one source of supply. Our long-term relationships with our suppliers allow us to proactively manage our technology development and product discontinuance plans, and to monitor our suppliers' financial health. Some suppliers may, nonetheless, extend their lead times, limit supplies, increase prices or cease to produce necessary parts for our products. If these are unique or highly specialized components, we may not be able to find a substitute quickly, or at all.
Competition
The markets in which we participate are highly competitive. Our competitors range from large, international companies offering a wide range of products to smaller companies specializing in narrow markets. The competitive landscape is changing as a result of a trend toward consolidation within many industries, as some of our competitors have merged with or been acquired by other competitors, while others have begun collaborating with each other. We expect this consolidation trend to continue. We expect competition in the markets in which we participate to continue to increase as existing competitors improve or expand their product offerings and as new companies enter the market. Additionally, our ability to compete effectively depends on a number of factors, including: quality, technical performance, price, product features, product system
compatibility, system-level design capability, engineering expertise, responsiveness to customers, new product innovation, product availability, delivery timing and reliability, and customer sales and technical support.
In the semiconductor market, we compete with integrated device manufacturers, fabless semiconductor companies, as well as the internal resources of large, integrated OEMs. Our primary competitors are Amlogic Inc., Analog Devices, Inc., Advanced Micro Devices, Inc., Cisco Systems, Inc., Wolfspeed, Inc. (f/k/a Cree, Inc.), GlobalFoundries Inc., Hamamatsu Photonics K.K., Heidenhain Corporation, HiSilicon Technologies Co. Ltd., iC-Haus GmbH, Intel Corporation, Lumentum Holdings Inc., MACOM Technology Solutions Holdings, Inc., MaxLinear, Inc., Marvell Technology, Inc., MediaTek Inc., NVIDIA Corporation, Microchip Technology Incorporated, Mitsubishi Electric Corporation, Murata Manufacturing Co., Ltd., NXP Semiconductors N.V., ON Semiconductor Corporation, OSRAM Licht AG, Qorvo, Inc., Qualcomm Inc., Realtek Semiconductor Corp., Renesas Electronics Corporation, Skyworks Solutions, Inc., STMicroelectronics N.V., Sumitomo Corporation, Synaptics Incorporated, TDK-EPC Corporation, Toshiba Corporation, Texas Instruments, Inc. and II-VI Incorporated. We compete based on the strength and expertise of our high speed proprietary design expertise, FBAR technology, amplifier design, module integration, proprietary materials processes, multiple storage protocols and mixed-signal design, our broad product portfolio, support of key industry standards, reputation for quality products, and our customer relationships.
In the infrastructure software market, we compete with large enterprise software vendors who continue to expand their product and service offerings and consolidate offerings into broad product lines, and smaller, niche players focused on specific markets. Our primary competitors are Atlassian Corporation, Plc, BMC Software Inc., BeyondTrust Corporation, Cisco Systems, Inc., CrowdStrike Holdings, Inc., CyberArk Software, Ltd., International Business Machines Corporation, Micro Focus International plc, Microsoft Corporation, New Relic, Inc., Oracle Corporation, Proofpoint, Inc., Rocket Software, Inc., SailPoint Technologies Holdings, Inc., Salesforce.com, Inc., ServiceNow, Inc., SolarWinds Corporation, Splunk, Inc. and Zscaler, Inc. We compete based on our breadth of portfolio of enterprise management tools, breadth and synergy of offerings, our platform and hardware independence, our global reach, and our deep customer relationships and industry experience.
Intellectual Property
Our success depends in part upon our ability to protect our IP. To accomplish this, we rely on a combination of IP rights, including patents, copyrights, trademarks, service marks, trade secrets and similar IP, as well as customary contractual protections with our customers, suppliers, employees and consultants, and through security measures to protect our trade secrets. We believe our current product expertise, key engineering talent and IP portfolio provide us with a strong platform from which to develop application specific products in key target markets.
As of October 30, 2022, we had 17,035 U.S. and other patents and 618 U.S. and other pending patent applications. The expiration dates of our patents range from 2022 to 2041, with a small number of patents expiring in the near future, none of which are expected to be material to our IP portfolio. We are not substantially dependent on any single patent or group of related patents.
We focus our patent application program to a greater extent on those inventions and improvements that we believe are likely to be incorporated into our products, as contrasted with more basic research. However, we do not know how many of our pending patent applications will result in the issuance of patents or the extent to which the examination process could require us to narrow our claims.
We and our predecessors have also entered into a variety of IP licensing and cross-licensing arrangements that have both benefited our business and enabled some of our competitors. A portion of our revenue comes from IP licensing royalty payments and from litigation settlements relating to such IP. We also license third-party technologies that are incorporated into some elements of our design activities, products and manufacturing processes. Historically, licenses of the third-party technologies used by us have generally been available to us on acceptable terms.
The industries in which we compete are characterized by the existence of a large number of patents, copyrights, trademarks and trade secrets and by the vigorous pursuit, protection and enforcement of IP rights, including by patent holding companies that do not make or sell products. Some of our customer agreements require us to indemnify our customers for third-party IP infringement claims arising from our products. Claims of this sort could harm our relationships with our customers and might deter future customers from doing business with us. With respect to any IP rights claims against us or our customers or distributors, we may be required to defend ourselves or our customers or distributors in litigation, cease manufacturing the infringing products, pay damages, expend resources to develop non-infringing technology, seek a license which may not be available on commercially reasonable terms or at all, or relinquish patents or other IP rights.
With respect to our infrastructure software, the proprietary portions of our source code for our products are protected both as a trade secret and as copyrighted works. Except with respect to software components that are subject to open source licenses, our customers do not generally have access to the source code for our products. Rather, on-premise customers typically access only the executable code for our products, and SaaS customers access only the functionality of our SaaS offerings. Under certain contingent circumstances, some of our customers are beneficiaries of a source code escrow
arrangement that would enables them to obtain a limited right to access and use our source code if specific conditions are met.
Employees
Our success depends on our continued ability to attract, motivate and retain our workforce. As the source of our technological and product innovations, our engineering and technical personnel are a significant asset. Competition for these and other talented employees is significant in many locations where we operate, such as Silicon Valley and Southeast Asia.
We measure our employees’ engagement by our voluntary attrition rate and employee feedback. Our global voluntary attrition rate in fiscal year 2022 was approximately 6.5%, below the technology industry benchmark (AON, 2022 Salary Increase and Turnover Study — Second Edition, September 2022).
We also track the portion of our workforce in research and development roles. As of October 30, 2022, we had approximately 20,000 employees worldwide, with approximately 63% in research and development roles. By geography, approximately 54% of our employees are located in North America, 35% in Asia, and 11% in Europe, the Middle East and Africa.
Governmental Regulation
Our semiconductor manufacturing operations and research and development involve the use of hazardous substances and are regulated under international, federal, state and local laws governing health, safety and the environment. These regulations include limitations on discharge of pollutants to air, water, and soil; remediation requirements; product chemical content limitations; manufacturing chemical use and handling restrictions; pollution control requirements; waste minimization considerations; and treatment, transport, storage and disposal of solid and hazardous wastes. We are also subject to regulation by the U.S. Occupational Safety and Health Administration and similar health and safety laws in other jurisdictions.
We believe that our properties and operations at our facilities comply in all material respects with applicable environmental laws and worker health and safety laws. However, the risk of environmental liabilities cannot be completely eliminated and there can be no assurance that the application of environmental, health and safety laws to our business will not require us to incur significant expenditures.
We are also regulated under a number of international, federal, state and local laws regarding recycling, product packaging and product content requirements, including legislation enacted in the U.S., European Union and China, among a growing number of jurisdictions, which have placed greater restrictions on the use of lead, among other restricted substances, in electronic products, which affects materials composition and semiconductor packaging. In addition, our business is subject to various import/export regulations, such as the U.S. Export Administration Regulations, and applicable executive orders, and rules of industrial standards bodies, like the International Organization for Standardization, as well as regulation by other agencies, such as the U.S. Federal Trade Commission (“FTC”). These laws, regulations and orders are complex, may change frequently and with limited notice, have generally and may continue to become more stringent over time. We may incur significant expenditures in future periods as a result.
Seasonality
Historically, our net revenue has typically been higher in the second half of the fiscal year than in the first half, primarily due to seasonality in our wireless communications products. These products have historically experienced seasonality due to launches of new mobile devices manufactured by our OEM customers. However, from time to time, typical seasonality and industry cyclicality are overshadowed by other factors such as wider macroeconomic effects, the timing of significant product transitions and launches by large OEMs, particularly with our wireless communications products. We have a diversified business portfolio and we believe that our overall revenue is less susceptible to seasonal variations as a result of this diversification.
Other Information
Our website is www.broadcom.com. You may access our annual reports on Form 10-K, quarterly reports on Form 10-Q, current reports on Form 8-K and other reports (and amendments thereto) filed or furnished pursuant to Section 13(a) or 15(d) of the Securities Exchange Act of 1934 (the “Exchange Act”) with the Securities and Exchange Commission (the “SEC”), as well as proxy statements filed by Broadcom, free of charge at the “Investor Center - SEC Filings” section of our website at www.broadcom.com, as soon as reasonably practicable after such material is electronically filed with, or furnished to, the SEC. Such periodic reports, proxy statements and other information are also available at the SEC’s website at www.sec.gov. The reference to our website address does not constitute incorporation by reference of the information contained on or accessible through our website.
Information About Our Executive Officers
The following table provides information regarding our executive officers as of December 16, 2022:
| Name and Title | Age | Position and Offices | ||||||
| Hock E. Tan | 71 | President, Chief Executive Officer and Director | ||||||
| Kirsten M. Spears | 58 | Chief Financial Officer and Chief Accounting Officer | ||||||
| Mark D. Brazeal | 54 | Chief Legal and Corporate Affairs Officer | ||||||
| Charlie B. Kawwas, Ph.D. | 52 | President, Semiconductor Solutions Group |
Hock E. Tan has served as our President and Chief Executive Officer since March 2006. He held several executive leadership positions at Integrated Circuit Systems, Inc., a publicly traded timing solutions IC company, including President and Chief Executive Officer from 1999 until its acquisition by Integrated Device Technology, Inc. in 2005, Chief Operating Officer from 1996 to 1999 and Senior Vice President and Chief Financial Officer from 1995 to 1999. He was Vice President of Finance at Commodore International, Ltd. from 1992 to 1994, and held senior management positions at PepsiCo, Inc. and General Motors Corporation. He was also managing director of Pacven Investment, Ltd., a venture capital fund in Singapore, from 1988 to 1992, and was managing director of Hume Industries Ltd. in Malaysia from 1983 to 1988.
Kirsten M. Spears has served as our Chief Financial Officer and Chief Accounting Officer since December 2020. She served as our Principal Accounting Officer from March 2016 to December 2020 and Vice President and Corporate Controller from May 2014 to December 2020. She was Vice President and Corporate Controller at LSI Corporation from 2007 until its acquisition by us in 2014. She held several management positions in accounting and reporting at LSI from 1997 to 2007. She also worked for PriceWaterhouseCoopers prior to joining LSI.
Mark D. Brazeal has served as our Chief Legal and Corporate Affairs Officer since December 2021. He served as our Chief Legal Officer from March 2017 to December 2021. He was Chief Legal Officer and Senior Vice President, IP Licensing for SanDisk Corporation from 2014 until its acquisition by Western Digital Corporation in 2016. He held several senior legal positions at Broadcom Corporation from 2000 to 2014, including Senior Vice President and Senior Deputy General Counsel in charge of all commercial, operational, IP licensing and litigation matters. He was also an attorney in the transactional and IP groups at the law firms of Wilson Sonsini Goodrich & Rosati, Yuasa & Hara and Howrey & Simon prior to joining Broadcom Corporation.
Charlie B. Kawwas has served as our President, Semiconductor Solutions Group since July 2022. He served as our Chief Operating Officer from December 2020 to July 2022, Senior Vice President and Chief Sales Officer from June 2015 to December 2020 and Senior Vice President, Worldwide Sales from May 2014 to June 2015. He was head of worldwide sales at LSI Corporation from 2010 until its acquisition by us in 2014. He held several executive leadership positions at LSI from 2007 to 2010, including Vice President of Sales and Marketing for the networking division and Vice President of Marketing for the networking and storage products group. He was also the leader of Product Line Management for the Optical Ethernet and Multi-service Edge portfolio at Nortel Networks Corporation prior to joining LSI.
Item 1A. RISK FACTORS
Our business, operations and financial results are subject to various risks and uncertainties, including those described below, that could adversely affect our business, financial condition, results of operations, cash flows, and the trading price of our common stock. Many of the following risks and uncertainties are, and may continue to be, exacerbated by the COVID-19 pandemic. The following material factors, among others, could cause our actual results to differ materially from historical results and those expressed in forward-looking statements made by us or on our behalf in filings with the SEC, press releases, communications with investors and oral statements.
Risk Factors Summary
The following is a summary of the principal risks that could adversely affect our business, operations and financial results.
Risks Related to Our Business
-
Adverse global economic conditions could have a negative effect on us.
-
We operate in the highly cyclical semiconductor industry.
-
The majority of our sales come from a small number of customers and a reduction in demand or loss of one or more of our significant customers may adversely affect our business.
-
Dependence on contract manufacturing and suppliers of critical components within our supply chain may adversely affect our ability to bring products to market.
-
We purchase a significant amount of the materials used in our products from a limited number of suppliers.
-
Our business is subject to various governmental regulations and trade restrictions. Compliance with these regulations may cause us to incur significant expense and, if we fail to maintain compliance, we may be forced to cease manufacture and distribution of certain products or subjected to administrative proceedings and civil or criminal penalties.
-
Global political and economic conditions and other factors related to our international operations could adversely affect us.
-
The COVID-19 pandemic has disrupted normal business activity.
-
We are subject to risks associated with our distributors and other channel partners, including product inventory levels and product sell-through.
-
Our dependence on senior management and if we are unable to attract and retain qualified personnel, we may not be able to execute our business strategy effectively.
-
The failure to complete or realize the expected benefits of our acquisition of VMware, Inc. (“VMware Merger”) may adversely affect our business and our stock price.
-
We may pursue acquisitions, investments, joint ventures and dispositions, which could adversely affect our results of operations.
-
We may be involved in legal proceedings, including IP, securities litigation, and employee-related claims.
-
Our operating results are subject to substantial quarterly and annual fluctuations.
-
Failure to adjust our manufacturing and supply chain to accurately meet customer demand could adversely affect our results of operations.
-
Winning business in the semiconductor solutions industry is subject to a lengthy process that often requires us to incur significant expense, from which we may ultimately generate no revenue.
-
Competition in our industries could prevent us from growing our revenue.
-
A prolonged disruption of our manufacturing facilities, research and development facilities, warehouses or other significant operations, or those of our suppliers, could have a material adverse effect on us.
-
We may be unable to maintain appropriate manufacturing capacity or product yields at our own manufacturing facilities.
-
An impairment of the confidentiality, integrity, or availability of our IT systems, or those of one or more of our corporate infrastructure vendors, could have a material adverse effect on our business.
-
Our ability to maintain or improve gross margin.
-
Our ability to protect the significant amount of IP in our business.
-
Incompatibility of our software products with operating environments, platforms, or third-party products, demand for our products and services could decrease.
-
Failure to enter into software license agreements on a satisfactory basis could adversely affect us.
-
Licensed third party software used in our products may not be available to us in the future, which may delay product development and production or cause us to incur additional expense.
-
Use of open source code sources, which, under certain circumstances could materially adversely affect us.
-
Failure of our software products to manage and secure IT infrastructures and environments could have a material adverse effect on our business.
-
We are subject to warranty claims, product recalls and product liability.
-
The complexity of our products could result in unforeseen delays or expense or undetected defects or bugs.
-
We make substantial investments in research and development and unsuccessful investments could materially adversely affect our business, financial condition and results of operations.
-
We collect, use, store, or otherwise process personal information, which subjects us to privacy and data security laws and contractual commitments, and our actual or perceived failure to comply with such laws and commitments could harm our business.
-
We are subject to environmental, health and safety laws, which could increase our costs, restrict our operations and require expenditures.
-
Social and environmental regulations, policies and provisions, as well as customer and investor demands, may make our supply chain more complex and may adversely affect our relationships with customers and investors.
-
The average selling prices of semiconductor products in our markets have often decreased rapidly and may do so in the future.
-
Fluctuations in foreign exchange rates could result in losses.
Risks Relating to Taxes
-
Changes in tax legislation or policies could materially impact our financial position and results of operations.
-
Our corporate income taxes could significantly increase if we are unable to maintain our tax concessions or if our assumptions and interpretations regarding tax laws and concessions prove to be incorrect.
-
Our income taxes and overall cash tax costs are affected by a number of factors that could materially, adversely affect financial results.
Risks Relating to Our Indebtedness
-
Our substantial indebtedness could adversely affect our financial health and our ability to execute our business strategy.
-
The instruments governing our indebtedness impose certain restrictions on our business.
-
Servicing our debt requires a significant amount of cash, and we may not have sufficient cash flows from our business to pay our substantial debt.
Risks Relating to Owning Our Common Stock
-
Volatility of our stock price could result in substantial losses for our investors as well as class action litigation against us and our management.
-
The amount and frequency of our stock repurchases may fluctuate.
-
A substantial amount of our stock is held by a small number of large investors.
-
There can be no assurance that we will continue to declare cash dividends.
For a more complete discussion of the material risks facing our business, see below.
Risks Related to Our Business
Adverse global economic conditions could have a negative effect on our business, results of operations and financial condition and liquidity.
A general slowdown in the global economy, including a recession, or in a particular region or industry, an increase in trade tensions with U.S. trading partners, inflation or a tightening of the credit markets could negatively impact our business, financial condition and liquidity. Adverse global economic conditions have from time to time caused or exacerbated significant slowdowns in the industries and markets in which we operate, which have adversely affected our business and results of operations. Macroeconomic weakness and uncertainty also make it more difficult for us to accurately forecast revenue, gross m
Showing the first 8K of 104K characters. Open the full section
Item 1B. UNRESOLVED STAFF COMMENTS
None.
Item 2. PROPERTIES
We are headquartered in San Jose, California and our primary warehouse is located in Malaysia. We conduct our administration, manufacturing, research and development, sales and marketing in both owned and leased facilities. We believe that our owned and leased facilities are adequate for our present operations. We do not identify or allocate assets by operating segment.
As of October 30, 2022, our owned and leased facilities in excess of 100,000 square feet consisted of:
| (In square feet) | United States | Other Countries | Total | |||||||||||||||||
| Owned facilities 1 | 2,586,368 | 928,888 | 3,515,256 | |||||||||||||||||
| Leased facilities 2 | 796,508 | 1,310,661 | 2,107,169 | |||||||||||||||||
| Total facilities | 3,382,876 | 2,239,549 | 5,622,425 | |||||||||||||||||
| _______________ | ||||||||||||||||||||
| 1 Includes 318,000 square feet and 153,000 square feet of property owned in Malaysia subject to a 60-year land lease with the state authority expiring in May 2051 and March 2077, respectively, subject to renewal at our option. | ||||||||||||||||||||
| 2 Building leases expire on varying dates through February 2046 and generally include renewals at our option. |
Item 3. LEGAL PROCEEDINGS
The information set forth under Note 14. “Commitments and Contingencies” included in Part II, Item 8. of this Annual Report on Form 10-K, is incorporated herein by reference. For an additional discussion of certain risks associated with legal proceedings, see “Risk Factors” above.
Item 4. MINE SAFETY DISCLOSURES
None.
PART II
Item 5. MARKET FOR REGISTRANT’S COMMON EQUITY, RELATED STOCKHOLDER MATTERS AND ISSUER PURCHASES OF EQUITY SECURITIES
Market Information
Broadcom common stock is listed on The Nasdaq Global Select Market under the symbol “AVGO”.
Holders
As of November 25, 2022, there were 1,060 holders of record of our common stock. A substantially greater number of stockholders are “street name” or beneficial holders, whose shares are held of record by banks, brokers and other financial institutions.
Unregistered Sales of Equity Securities
On August 1, 2022, we issued 9,923 restricted shares of our common stock to one individual in connection with our acquisition of a company. The restrictions lapse over three years subject to the individual's continued employment. The issuance of these shares was exempt from registration under the Securities Act of 1933, as amended, in reliance upon Section 4(a)(2) thereof.
Issuer Purchases of Equity Securities
During the fiscal quarter ended October 30, 2022, we paid approximately $274 million in employee withholding taxes due upon the vesting of net settled equity awards. We withheld approximately 1 million shares of common stock from employees in connection with such net share settlement at an average price of $502.62 per share. These shares may be deemed to be “issuer purchases” of shares.
In December 2021, our Board of Directors authorized a stock repurchase program to repurchase up to $10 billion of our common stock from time to time on or prior to December 31, 2022. During fiscal year 2022, we repurchased and retired approximately 12 million shares of our common stock for $7 billion under this stock repurchase program.
In May 2022, our Board of Directors authorized another stock repurchase program to repurchase up to an additional $10 billion of our common stock from time to time through December 31, 2023.
Repurchases under our stock repurchase programs may be effected through a variety of methods, including open market or privately negotiated purchases. The timing and amount of shares repurchased will depend on the stock price, business and market conditions, corporate and regulatory requirements, alternative investment opportunities, acquisition opportunities, and other factors. We are not obligated to repurchase any specific amount of shares of common stock, and the stock repurchase programs may be suspended or terminated at any time.
Stock Performance Graph
The following graph shows a comparison of cumulative total return for our common stock, the Standard & Poor’s 500 Stock Index (the “S&P 500 Index”) and the NASDAQ 100 Index for the five fiscal years ended October 30, 2022. The total return graph and table assume that $100 was invested on October 27, 2017 (the last trading day of our fiscal year 2017) in each of Broadcom Inc. common stock, the S&P 500 Index and the NASDAQ 100 Index and assume that all dividends are reinvested. Indexes are calculated on a month-end basis.
The comparisons in the graph below are based on historical data and are not indicative of, or intended to forecast, the possible future performance of our common stock.
Comparison of Five Year Cumulative Total Return
Among Broadcom Inc., the S&P 500 Index and the NASDAQ 100 Index
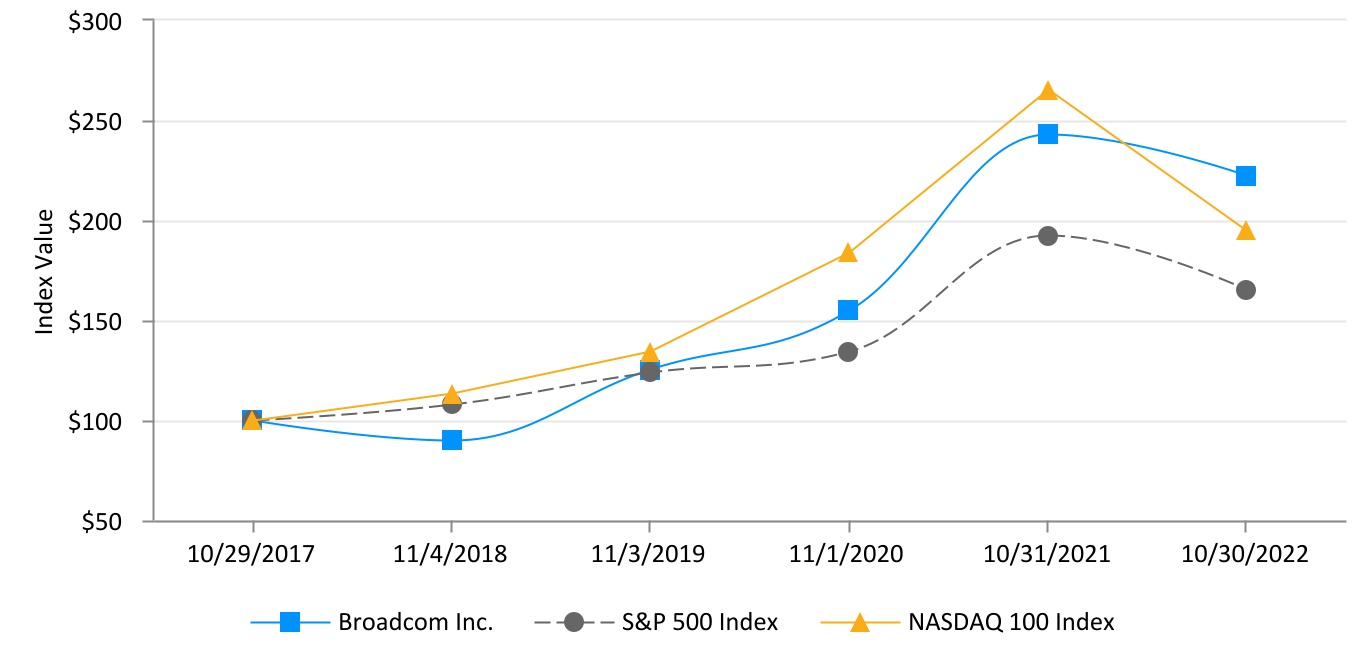
| October 29, 2017 | November 4, 2018 | November 3, 2019 | November 1, 2020 | October 31, 2021 | October 30, 2022 | |||||||||||||||||||||||||||||||||
| Broadcom Inc. | $ | 100.00 | $ | 89.74 | $ | 125.30 | $ | 154.78 | $ | 242.74 | $ | 222.41 | ||||||||||||||||||||||||||
| S&P 500 Index | $ | 100.00 | $ | 107.58 | $ | 123.66 | $ | 134.35 | $ | 192.01 | $ | 165.18 | ||||||||||||||||||||||||||
| NASDAQ 100 Index | $ | 100.00 | $ | 113.29 | $ | 134.24 | $ | 183.52 | $ | 265.05 | $ | 194.63 |
The graph and the table above shall not be deemed “filed” with the SEC for the purposes of Section 18 of the Exchange Act or otherwise subject to the liabilities of that section, nor shall it be deemed incorporated by reference in any filing made by us with the SEC, regardless of any general incorporation language in such filing.
Item 6. [RESERVED]
Item 7. MANAGEMENT’S DISCUSSION AND ANALYSIS OF FINANCIAL CONDITION AND RESULTS OF OPERATIONS
This Management’s Discussion and Analysis of Financial Condition and Results of Operations should be read in conjunction with our consolidated financial statements and notes thereto, which appear elsewhere in this Annual Report on Form 10-K. This discussion may contain forward-looking statements based upon current expectations that involve risks and uncertainties. Our actual results may differ materially from those anticipated in these forward-looking statements as a result of various factors, including those set forth under the caption “Risk Factors” or in other parts of this Annual Report on Form 10-K.
The following section generally discusses our financial condition and results of operations for our fiscal year ended October 30, 2022 (“fiscal year 2022”) compared to our fiscal year ended October 31, 2021 (“fiscal year 2021”). A discussion regarding our financial condition and results of operations for fiscal year 2021 compared to our fiscal year ended November 1, 2020 (“fiscal year 2020”) can be found in Part II, Item 7 of our Annual Report on Form 10-K for fiscal year 2021, filed with the Securities and Exchange Commission (the “SEC”) on December 17, 2021.
Overview
We are a global technology leader that designs, develops and supplies a broad range of semiconductor and infrastructure software solutions. We develop semiconductor devices with a focus on complex digital and mixed signal complementary metal oxide semiconductor based devices and analog III-V based products. We have a history of innovation in the semiconductor industry and offer thousands of products that are used in end products such as enterprise and data center networking, home connectivity, set-top boxes, broadband access, telecommunication equipment, smartphones and base stations, data center servers and storage systems, factory automation, power generation and alternative energy systems, and electronic displays. Our infrastructure software solutions enable customers to plan, develop, automate, manage and secure applications across mainframe, distributed, mobile and cloud platforms. Our portfolio of industry-leading infrastructure and security software is designed to modernize, optimize, and secure the most complex hybrid environments, enabling scalability, agility, automation, insights, resiliency and security. We also offer mission critical fibre channel storage area networking (“FC SAN”) products and related software in the form of modules, switches and subsystems incorporating multiple semiconductor products.
We have two reportable segments: semiconductor solutions and infrastructure software. Our semiconductor solutions segment includes all of our product lines and intellectual property (“IP”) licensing. Our infrastructure software segment includes our mainframe, distributed and cyber security solutions, and our FC SAN business.
Our strategy is to combine best-of-breed technology leadership in semiconductor and infrastructure software solutions, with unmatched scale, on a common sales and administrative platform to deliver a comprehensive suite of infrastructure technology products to the world’s leading business and government customers. We seek to achieve this through responsibly financed acquisitions of category-leading businesses and technologies, as well as investing extensively in research and development, to ensure our products retain their technology leadership. This strategy results in a robust business model designed to drive diversified and sustainable operating and financial results.
The demand for our products has been affected in the past, and is likely to continue to be affected in the future, by various factors, including the following:
-
gain or loss of significant customers;
-
general economic and market conditions in the industries and markets in which we compete;
-
our distributors’ product inventory and end customer demand;
-
the rate at which our present and future customers and end-users adopt our products and technologies in our target markets, and the rate at which our customers' products that include our technology are accepted in their markets;
-
the shift to cloud-based information technology solutions and services, such as hyperscale computing, which may adversely affect the timing and volume of sales of our products for use in traditional enterprise data centers; and
-
the timing, rescheduling or cancellation of expected customer orders.
COVID-19 Update
The COVID-19 pandemic and the efforts to control it disrupted, and reduced the efficiency of, normal business activities in much of the world. The pandemic resulted in authorities around the world implementing numerous unprecedented measures that created supply chain and market disruption, impacting our workforce and operations, and those of our customers, contract manufacturers, suppliers and logistics providers.
While the demand environment for our semiconductor products was consistent with our expectations for fiscal year 2022, with robust and increased profitability driven by the supply imbalance, the macroeconomic environment remains uncertain and it may not be sustainable over the longer term. We continue to experience various constraints in our supply chain, including with respect to wafers and substrates. Although supply lead times have stabilized, we continue to have difficulties in obtaining some necessary components and inputs in a timely manner to meet demand.
In response to the pandemic, we have taken extensive measures to protect the health and safety of our employees and contractors at our facilities. We continue to monitor the implications of the pandemic on our operations and may modify our business practices and policies from time to time.
Our ability to predict the impact of the pandemic on our business remains limited and its effects on our business are unlikely to be fully realized, or reflected in our financial results, until future periods.
Fiscal Year Highlights
Highlights during fiscal year 2022 include the following:
-
We generated $16,736 million of cash from operations.
-
We paid $7,032 million in cash dividends.
-
We repurchased $7,000 million of common stock.
Pending Acquisition of VMware, Inc.
On May 26, 2022, we entered into an Agreement and Plan of Merger (the “VMware Merger Agreement”) to acquire all of the outstanding shares of VMware, Inc. (“VMware”) in a cash-and-stock transaction (the “VMware Merger”) that values VMware at approximately $61 billion, based on the closing price of Broadcom common stock on May 25, 2022. We will also assume VMware’s closing date outstanding debt, net of expected cash.
Under the terms of the VMware Merger Agreement, each share of VMware common stock issued and outstanding immediately prior to the effective time of the VMware Merger will be indirectly converted into the right to receive, at the election of the holder of such share of VMware common stock, either $142.50 in cash, without interest, or 0.2520 shares of Broadcom common stock. The stockholder election will be subject to proration, such that the total number of shares of VMware common stock entitled to receive cash and the total number of shares of VMware common stock entitled to receive Broadcom common stock, will, in each case, be equal to 50% of the aggregate number of shares of VMware common stock issued and outstanding immediately prior to the effective time of the VMware Merger.
We will assume all outstanding VMware restricted stock unit (“RSU”) awards and performance stock unit awards held by continuing employees. The assumed awards will be converted into RSU awards for shares of Broadcom common stock. All outstanding in-the-money VMware stock options and RSU awards held by non-employee directors will be accelerated and converted into the right to receive cash and shares of Broadcom common stock, in equal parts.
Effective upon the effective time of the VMware Merger, one member of the VMware Board of Directors, to be mutually agreed by us and VMware, will be added to our Board of Directors.
In connection with the execution of the VMware Merger Agreement, we entered into a commitment letter on May 26, 2022, with certain financial institutions that committed to provide, subject to the terms and conditions of the commitment letter, a senior unsecured bridge facility in an aggregate principal amount of $32 billion.
The VMware Merger, which is expected to be completed in our fiscal year ending October 29, 2023 (“fiscal year 2023”), is subject to satisfaction or waiver of customary closing conditions, including the expiration or termination of the waiting period under the Hart-Scott-Rodino Antitrust Improvement Act of 1976 and clearance under the antitrust laws of the European Union and certain other jurisdictions. On October 3, 2022, we registered approximately 59 million shares of our common stock. On November 4, 2022, VMware stockholders adopted the VMware Merger Agreement. We and VMware each have termination rights under the VMware Merger Agreement and, under specified circumstances, upon termination of the agreement, we and VMware would be required to pay the other a termination fee of $1.5 billion.
Net Revenue
A majority of our net revenue is derived from sales of a broad range of semiconductor devices that are incorporated into electronic products, as well as from modules, switches and subsystems. Net revenue is also generated from the sale of software solutions that enable our customers to plan, develop, automate, manage, and secure applications across mainframe, distributed, mobile, and cloud platforms.
Our overall net revenue, as well as the percentage of total net revenue generated by sales in our semiconductor solutions and infrastructure software segments, have varied from quarter to quarter, due largely to fluctuations in end-
market demand, including the effects of seasonality, which are discussed in detail in Part I, Item 1. Business under “Seasonality” of this Annual Report on Form 10-K.
Distributors and original equipment manufacturers (“OEMs”), or their contract manufacturers, typically account for the substantial majority of our semiconductor sales. To serve customers around the world, we have strategically developed relationships with large global electronic component distributors, complemented by a number of regional distributors with customer relationships based on their respective product ranges. We have established strong relationships with leading OEM customers across multiple target markets. Our direct sales force focuses on supporting our large OEM customers and has specialized product and service knowledge that enables us to sell specific offerings at key levels throughout a customer’s organization. Certain customers require us to contract with them directly and with specified intermediaries, such as contract manufacturers. Many of our major customer relationships have been in place for many years and are often the result of years of collaborative product development. This has enabled us to build our extensive IP portfolio and develop critical expertise regarding our customers’ requirements, including substantial system-level knowledge. This collaboration has provided us with key insights into our customers' businesses and has enabled us to be more efficient and productive and to better serve our target markets and customers. We recognize revenue upon the delivery of our products to the distributors, which can cause our quarterly net revenue to fluctuate significantly. Such revenue is reduced for estimated returns and distributor allowances.
Our software customers generally consist of large enterprises that have computing environments from multiple vendors and are highly complex. We believe our enterprise-wide license model will continue to offer our customers reduced complexity, more flexibility and an easier renewal process that will help drive revenue growth.
Costs and Expenses
Cost of products sold. Cost of products sold consists primarily of the costs for semiconductor wafers and other materials, as well as the costs of assembling and testing those products and materials. Such costs include personnel and overhead related to our manufacturing operations, which include stock-based compensation expense, related occupancy, computer services, equipment costs, manufacturing quality, order fulfillment, warranty adjustments, inventory adjustments including write-downs for inventory obsolescence, and acquisition costs, which include direct transaction costs and acquisition-related costs.
Although we outsource a significant portion of our manufacturing activities, we do have some proprietary semiconductor fabrication facilities. If we are unable to utilize our owned fabrication facilities at a desired level, the fixed costs associated with these facilities will not be fully absorbed, resulting in higher average unit costs and lower gross margins.
Cost of subscriptions and services. Cost of subscriptions and services consists of personnel, project costs associated with professional services or support of our subscriptions and services revenue, and allocated facilities costs and other corporate expenses. Personnel costs include stock-based compensation expense.
Total cost of revenue also includes amortization of acquisition-related intangible assets and restructuring charges.
Research and development. Research and development expense consists primarily of personnel costs for our engineers engaged in the design and development of our products and technologies, including stock-based compensation expense. These expenses also include project material costs, third-party fees paid to consultants, prototype development expense, allocated facilities costs and other corporate expenses and computer services costs related to supporting computer tools used in the engineering and design process.
Selling, general and administrative. Selling expense consists primarily of compensation and associated costs for sales and marketing personnel, including stock-based compensation expense, sales commissions paid to our independent sales representatives, advertising costs, trade shows, corporate marketing, promotion, travel related to our sales and marketing operations, related occupancy and equipment costs, and other marketing costs. General and administrative expense consists primarily of compensation and associated costs for executive management, finance, human resources and other administrative personnel, including stock-based compensation expense, outside professional fees, allocated facilities costs, acquisition-related costs and other corporate expenses.
Amortization of acquisition-related intangible assets. In connection with our acquisitions, we recognize intangible assets that are being amortized over their estimated useful lives. We also recognize goodwill, which is not amortized, and in-process research and development (“IPR&D”), which is initially capitalized as an indefinite-lived intangible asset, in connection with the acquisitions. Upon completion of each underlying project, IPR&D assets are reclassified as amortizable purchased intangible assets and amortized over their estimated useful lives.
Restructuring, impairment and disposal charges. Restructuring, impairment and disposal charges consist primarily of compensation costs associated with employee exit programs, alignment of our global manufacturing operations, rationalizing product development program costs, facility and lease abandonments, fixed asset impairment, IPR&D impairment, and other exit costs, including curtailment of service or supply agreements.
Interest expense. Interest expense includes coupon interest, commitment fees, accretion of original issue discount, amortization of debt premiums and debt issuance costs, and expenses related to debt modifications or extinguishments.
Other income (expense), net. Other income (expense), net includes interest income, gains or losses on investments, foreign currency remeasurement, and other miscellaneous items.
Provision for income taxes. We have structured our operations to maximize the benefit from tax incentives extended to us in various jurisdictions to encourage investment or employment. Our tax incentives from the Singapore Economic Development Board provide that any qualifying income earned in Singapore is subject to tax incentives or reduced rates of Singapore income tax, subject to our compliance with the conditions specified in these incentives and legislative developments. These Singapore tax incentives are presently expected to expire in November 2025. The corporate income tax rate in Singapore that would otherwise apply to us would be 17%. We also have a tax holiday on our qualifying income in Malaysia, which is scheduled to expire in 2028.
Each tax incentive and tax holiday is also subject to our compliance with various operating and other conditions. If we cannot, or elect not to, comply with any such operating conditions specified, we could, in some instances, be required to refund previously realized material tax benefits, or if such tax incentive or tax holiday is terminated prior to its expiration absent a new incentive applying, we will lose the related tax benefits earlier than scheduled. We may elect to modify our operational structure and tax strategy, which may not be as beneficial to us as the benefits provided under the present tax concession arrangements. Before taking into consideration the effects of the U.S. Tax Cuts and Jobs Act and other indirect tax impacts, the effect of these tax incentives and tax holiday was to decrease the provision for income taxes by approximately $1,821 million and $1,156 million for fiscal years 2022 and 2021, respectively.
Our interpretations and conclusions regarding the tax incentives are not binding on any taxing authority, and if our assumptions about tax and other laws are incorrect or if these tax incentives are substantially modified or rescinded, we could suffer material adverse tax and other financial consequences, which would increase our expenses, reduce our profitability and adversely affect our cash flows. In addition, taxable income in any jurisdiction is dependent upon acceptance of our operational practices and intercompany transfer pricing by local tax authorities as being on an arm’s length basis. Due to inconsistencies in application of the arm’s length standard among taxing authorities, as well as lack of adequate treaty-based protection, transfer pricing challenges by tax authorities could, if successful, substantially increase our income tax expense.
Critical Accounting Estimates
The preparation of financial statements in accordance with generally accepted accounting principles in the United States (“GAAP”) requires us to make estimates and assumptions that affect the reported amounts of assets and liabilities and disclosure of contingent assets and liabilities at the date of the financial statements and the reported amounts of revenue and expenses during the reporting period. We base our estimates and assumptions on current facts, historical experience and various other factors that we believe to be reasonable under the circumstances, the results of which form the basis for making judgments about the carrying values of assets and liabilities and the accrual of costs and expenses that are not readily apparent from other sources. Our actual financial results may differ materially and adversely from our estimates. Our critical accounting policies are those that affect our historical financial statements materially and involve difficult, subjective or complex judgments by management. Those policies include revenue recognition, valuation of goodwill and long-lived assets, and income taxes. See Note 2. “Summary of Significant Accounting Policies” included in Part II, Item 8. of this Annual Report on Form 10-K for further information on our critical accounting policies and estimates.
Revenue recognition. We account for a contract with a customer when both parties have approved the contract and are committed to perform their respective obligations, each party’s rights can be identified, payment terms can be identified, the contract has commercial substance, and it is probable we will collect substantially all of the consideration we are entitled to. Revenue is recognized when, or as, performance obligations are satisfied by transferring control of a promised product or service to a customer. Our products and services can be broadly categorized as sales of products and subscriptions and services.
We recognize products revenue from sales to direct customers and distributors when control transfers to the customer. An allowance for distributor credits covering price adjustments is made based on our estimate of historical experience rates as well as considering economic conditions and contractual terms. To date, actual distributor claims activity has been materially consistent with the provisions we have made based on our historical estimates. However, because of the inherent nature of estimates, there is always a risk that there could be significant differences between actual amounts and our estimates. Different judgments or estimates could result in variances that might be significant to reported operating results. We also record reductions of revenue for rebates in the same period that the related revenue is recorded. We accrue 100% of potential rebates at the time of sale. We reverse the accrual of unclaimed rebate amounts as specific rebate programs contractually end and when we believe unclaimed rebates are no longer subject to payment and will not be paid. Thus, the reversal of unclaimed rebates may have a positive impact on our net revenue and net income in subsequent periods.
Valuation of goodwill and long-lived assets. We perform an annual impairment review of our goodwill during the fourth fiscal quarter of each year, and more frequently if we believe indicators of impairment exist. The process of evaluating the potential impairment of goodwill is highly subjective and requires significant judgment. To review for impairment, we first assess qualitative factors to determine whether events or circumstances lead to a determination that it is more likely than not that the fair value of any of our reporting units is less than its carrying amount. Our qualitative assessment of the recoverability of goodwill, whether performed annually or based on specific events or circumstances, considers various macroeconomic, industry-specific and company-specific factors. These factors include: (i) severe adverse industry or economic trends; (ii) significant company-specific actions, including exiting an activity in conjunction with restructuring of operations; (iii) current, historical or projected deterioration of our financial performance; or (iv) a sustained decrease in our market capitalization below our net book value. After assessing the totality of events and circumstances, if we determine that it is not more likely than not that the fair value of any of our reporting units is less than its carrying amount, no further assessment is performed. If we determine that it is more likely than not that the fair value of any of our reporting units is less than its carrying amount, we calculate the fair value of that reporting unit and compare the fair value to the reporting unit’s net book value.
Determining the fair value of a reporting unit involves the use of significant estimates and assumptions. Our goodwill impairment test uses both the income approach and the market approach to estimate a reporting unit's fair value. The income approach is based on the discounted cash flow method that uses the reporting unit estimates for forecasted future financial performance, including revenues, operating expenses, and taxes, as well as working capital and capital asset requirements. These estimates are developed as part of our long-term planning process based on assumed market segment growth rates and our assumed market segment share, estimated costs based on historical data and various internal estimates. Projected cash flows are then discounted to a present value employing a discount rate that properly accounts for the estimated market weighted-average cost of capital, as well as any risk unique to the subject cash flows. The market approach is based on weighting the financial multiples of comparable companies and applying a control premium. A reporting unit's carrying value represents the assignment of various assets and liabilities, excluding certain corporate assets and liabilities, such as cash and debt.
We assess the impairment of long-lived assets, including purchased IPR&D, property, plant and equipment, and intangible assets, whenever events or changes in circumstances indicate that the carrying value of such assets may not be recoverable. Factors we consider important which could trigger an impairment review include: (i) significant under-performance relative to historical or projected future operating results, (ii) significant changes in the manner of our use of the acquired assets or the strategy for our overall business, or (iii) significant negative industry or economic trends. The process of evaluating the potential impairment of long-lived assets under the accounting guidance on property, plant and equipment, and intangible assets is also highly subjective and requires significant judgment. In order to estimate the fair value of long-lived assets, we typically make various assumptions about the future prospects of our business or the part of our business to which the long-lived assets relate. We also consider market factors specific to the business and estimate future cash flows to be generated by the business, which requires significant judgment as it is based on assumptions about market demand for our products over a number of future years. Based on these assumptions and estimates, we determine whether we need to take an impairment charge to reduce the value of the long-lived assets stated on our consolidated balance sheets to reflect their estimated fair value. Assumptions and estimates about future values and remaining useful lives are complex and often subjective. They can be affected by a variety of factors, including external factors, such as the real estate market, industry and economic trends, and internal factors, such as changes in our business strategy and our internal forecasts. Although we believe the assumptions and estimates we have made in the past have been reasonable and appropriate, changes in assumptions and estimates could materially impact our reported financial results.
Income taxes. Significant management judgment is required in developing our provision for or benefit from income taxes, including the determination of deferred tax assets and liabilities and any valuation allowances that might be required against the deferred tax assets. We have considered projected future taxable income and ongoing prudent and feasible tax planning strategies in assessing the need for valuation allowances. An adjustment to the valuation allowance will either increase or decrease our provision for or benefit from income taxes in the period such determination is made. In evaluating the exposure associated with various tax filing positions, we accrue an income tax liability when such positions do not meet the more-likely-than-not threshold for recognition.
The calculation of our tax liabilities involves dealing with uncertainties in the application of complex tax laws and regulations in a multitude of jurisdictions. We recognize potential liabilities for anticipated tax audit issues in the U.S. and other tax jurisdictions based on our estimate of whether, and the extent to which, additional taxes, interest, and penalties will be due. If our estimate of income tax liabilities proves to be less than the actual amount ultimately assessed, a further charge to tax expense would be required. If the payment of these amounts ultimately proves to be unnecessary, the reversal of the accrued liabilities would result in tax benefits being recognized in the period when we determine the liabilities no longer exist.
Fiscal Year Presentation
We operate on a 52- or 53-week fiscal year ending on the Sunday closest to October 31 in a 52-week year and the first Sunday in November in a 53-week year. Our fiscal years 2022, 2021 and 2020 consisted of 52 weeks.
The financial statements included in Part II, Item 8. of this Annual Report on Form 10-K are presented in accordance with GAAP and expressed in U.S. dollars.
Results of Operations
Fiscal Year 2022 Compared to Fiscal Year 2021
The following table sets forth our results of operations for the periods presented:
| Fiscal Year Ended | ||||||||||||||||||||||||||
| October 30, 2022 | October 31, 2021 | October 30, 2022 | October 31, 2021 | |||||||||||||||||||||||
| (In millions) | (As a percentage of net revenue) | |||||||||||||||||||||||||
| Statements of Operations Data: | ||||||||||||||||||||||||||
| Net revenue: | ||||||||||||||||||||||||||
| Products | $ | 26,277 | $ | 20,886 | 79 | % | 76 | % | ||||||||||||||||||
| Subscriptions and services | 6,926 | 6,564 | 21 | 24 | ||||||||||||||||||||||
| Total net revenue | 33,203 | 27,450 | 100 | 100 | ||||||||||||||||||||||
| Cost of revenue: | ||||||||||||||||||||||||||
| Cost of products sold | 7,629 | 6,555 | 23 | 24 | ||||||||||||||||||||||
| Cost of subscriptions and services | 627 | 607 | 2 | 2 | ||||||||||||||||||||||
| Amortization of acquisition-related intangible assets | 2,847 | 3,427 | 8 | 13 | ||||||||||||||||||||||
| Restructuring charges | 5 | 17 | — | — | ||||||||||||||||||||||
| Total cost of revenue | 11,108 | 10,606 | 33 | 39 | ||||||||||||||||||||||
| Gross margin | 22,095 | 16,844 | 67 | 61 | ||||||||||||||||||||||
| Research and development | 4,919 | 4,854 | 15 | 18 | ||||||||||||||||||||||
| Selling, general and administrative | 1,382 | 1,347 | 4 | 5 | ||||||||||||||||||||||
| Amortization of acquisition-related intangible assets | 1,512 | 1,976 | 5 | 7 | ||||||||||||||||||||||
| Restructuring, impairment and disposal charges | 57 | 148 | — | — | ||||||||||||||||||||||
| Total operating expenses | 7,870 | 8,325 | 24 | 30 | ||||||||||||||||||||||
| Operating income | $ | 14,225 | $ | 8,519 | 43 | % | 31 | % |
Net Revenue
A relatively small number of customers account for a significant portion of our net revenue. Sales of products to distributors accounted for 56% and 53% of our net revenue for fiscal years 2022 and 2021, respectively. Direct sales to WT Microelectronics Co., Ltd., a distributor, accounted for 20% and 18% of our net revenue for fiscal years 2022 and 2021, respectively. We believe aggregate sales to our top five end customers, through all channels, accounted for approximately 35% of our net revenue for each of fiscal years 2022 and 2021. We believe aggregate sales to Apple Inc., through all channels, accounted for approximately 20% of our net revenue for each of fiscal years 2022 and 2021. We expect to continue to experience significant customer concentration in future periods. The loss of, or significant decrease in demand from, any of our top five end customers could have a material adverse effect on our business, results of operations and financial condition.
From time to time, some of our key semiconductor customers place large orders or delay orders, causing our quarterly net revenue to fluctuate significantly. This is particularly true of our wireless products as fluctuations may be magnified by the timing of launches, and seasonal variations in sales, of mobile devices. The COVID-19 pandemic and macroeconomic uncertainties may cause our net revenue to fluctuate significantly and impact our results of operations.
Although we recognize revenue for the majority of our products when title and control transfer in Penang, Malaysia, we disclose net revenue by country based primarily on the geographic shipment or delivery location specified by our distributors, OEMs, contract manufacturers, channel partners, or software customers. In each of fiscal years 2022 and 2021, approximately 35% of our net revenue came from shipments or deliveries to China (including Hong Kong). However, the end customers for either our products or for the end products into which our products are incorporated, are frequently located in countries other than China (including Hong Kong). As a result, we believe that a substantially smaller percentage of our net revenue is ultimately dependent on sales of either our product or our customers’ product incorporating our product, to end customers located in China (including Hong Kong).
The following tables set forth net revenue by segment for the periods presented:
| Fiscal Year Ended | ||||||||||||||||||||||||||
| Net Revenue by Segment | October 30, 2022 | October 31, 2021 | $ Change | % Change | ||||||||||||||||||||||
| (In millions, except percentages) | ||||||||||||||||||||||||||
| Semiconductor solutions | $ | 25,818 | $ | 20,383 | $ | 5,435 | 27 | % | ||||||||||||||||||
| Infrastructure software | 7,385 | 7,067 | 318 | 4 | % | |||||||||||||||||||||
| Total net revenue | $ | 33,203 | $ | 27,450 | $ | 5,753 | 21 | % |
| Fiscal Year Ended | ||||||||||||||
| Net Revenue by Segment | October 30, 2022 | October 31, 2021 | ||||||||||||
| (As a percentage of net revenue) | ||||||||||||||
| Semiconductor solutions | 78 | % | 74 | % | ||||||||||
| Infrastructure software | 22 | 26 | ||||||||||||
| Total net revenue | 100 | % | 100 | % |
Net revenue from our semiconductor solutions segment increased due to strong product demand, primarily for networking, server storage and broadband products, as well as higher demand for our wireless content in mobile devices. Net revenue from our infrastructure software segment increased primarily due to higher demand for our mainframe solutions and FC SAN products.
Gross Margin
Gross margin was $22,095 million, or 67% of net revenue, for fiscal year 2022, compared to $16,844 million, or 61% of net revenue, for fiscal year 2021. The increase was primarily due to lower amortization of acquisition-related intangible assets, mainly from our 2016 acquisition of Broadcom Corporation and, to a lesser extent, favorable margin within our semiconductor solutions segment.
Research and Development Expense
Research and development expense increased $65 million, or 1%, in fiscal year 2022, compared to the prior fiscal year. The increase was primarily due to higher variable employee compensation expense and engineering project costs, partially offset by lower stock-based compensation expense reflecting the full vesting of certain equity awards and the effects of forfeitures.
Selling, General and Administrative Expense
Selling, general and administrative expense increased $35 million, or 3%, in fiscal year 2022, compared to the prior fiscal year. The increase was primarily due to higher variable employee compensation expense, offset in part by lower stock-based compensation expense.
Amortization of Acquisition-Related Intangible Assets
Amortization of acquisition-related intangible assets recognized in operating expenses decreased $464 million, or 23%, in fiscal year 2022, compared to the prior fiscal year. The decrease was primarily due to lower amortization of certain intangible assets from our acquisition of CA, Inc.
Restructuring, Impairment and Disposal Charges
Restructuring, impairment and disposal charges recognized in operating expenses decreased $91 million, or 61%, in fiscal year 2022, compared to the prior fiscal year. The decrease was primarily due to lower employee termination costs following the completion of key restructuring activities from acquisitions.
Stock-Based Compensation Expense
Total stock-based compensation expense was $1,533 million and $1,704 million for fiscal years 2022 and 2021, respectively. The decrease primarily reflects the full vesting of certain equity awards and the effect of forfeitures.
The following table sets forth the total unrecognized compensation cost related to unvested stock-based awards outstanding and expected to vest as of October 30, 2022, which we expect to recognize over the remaining weighted-average service period of 2.7 years.
| Fiscal Year: | Unrecognized Compensation Cost, Net of Expected Forfeitures | |||||||
| (In millions) | ||||||||
| 2023 | $ | 1,221 | ||||||
| 2024 | 846 | |||||||
| 2025 | 507 | |||||||
| 2026 | 130 | |||||||
| Total | $ | 2,704 |
During the first quarter of fiscal year ended November 3, 2019 (“fiscal year 2019”), our Compensation Committee approved a broad-based program of multi-year equity grants of time- and market-based RSUs (the “Multi-Year Equity Awards”) in lieu of our annual employee equity awards historically granted on March 15 of each year. Each Multi-Year Equity Award vests on the same basis as four annual grants made March 15 of each year, beginning in fiscal year 2019, with successive four-year vesting periods. We recognize stock-based compensation expense related to the Multi-Year Equity Awards from the grant date through their respective vesting date, ranging from 4 years to 7 years.
Segment Operating Results
| Fiscal Year Ended | ||||||||||||||||||||||||||
| Operating Income by Segment | October 30, 2022 | October 31, 2021 | $ Change | % Change | ||||||||||||||||||||||
| (In millions, except percentages) | ||||||||||||||||||||||||||
| Semiconductor solutions | $ | 15,075 | $ | 10,976 | $ | 4,099 | 37 | % | ||||||||||||||||||
| Infrastructure software | 5,219 | 4,936 | 283 | 6 | % | |||||||||||||||||||||
| Unallocated expenses | (6,069) | (7,393) | 1,324 | (18) | % | |||||||||||||||||||||
| Total operating income | $ | 14,225 | $ | 8,519 | $ | 5,706 | 67 | % |
Operating income from our semiconductor solutions segment increased primarily due to higher net revenue from networking, server storage, broadband, and wireless products, as well as higher gross margin. Operating income from our infrastructure software segment increased primarily due to higher demand for our mainframe solutions and FC SAN products.
Unallocated expenses include amortization of acquisition-related intangible assets; stock-based compensation expense; restructuring, impairment and disposal charges; acquisition-related costs; and other costs that are not used in evaluating the results of, or in allocating resources to, our segments. Unallocated expenses decreased 18% in fiscal year 2022, compared to the prior fiscal year, primarily due to lower amortization of acquisition-related intangible assets.
Non-Operating Income and Expenses
Interest expense. Interest expense was $1,737 million and $1,885 million for fiscal years 2022 and 2021, respectively. The decrease was primarily due to lower losses on extinguishment of debt. We expect to incur additional interest expense in future periods as a result of indebtedness associated with the pending VMware Merger.
Other income (expense), net. Other income (expense), net, includes interest income, gains or losses on investments, foreign currency remeasurement and other miscellaneous items. Other expense, net, was $54 million for fiscal year 2022, compared to other income, net, of $131 million for fiscal year 2021. The change was primarily due to changes in investment gains or losses.
Provision for income taxes. The provision for income taxes was $939 million and $29 million for fiscal years 2022 and 2021, respectively. The increase was primarily due to higher income from continuing operations before income taxes.
Liquidity and Capital Resources
The following section discusses our principal liquidity and capital resources as well as our primary liquidity requirements and uses of cash. Our cash and cash equivalents are maintained in highly liquid investments with remaining maturities of 90 days or less at the time of purchase. We believe our cash equivalents are liquid and accessible.
Our primary sources of liquidity as of October 30, 2022 consisted of: (i) $12,416 million in cash and cash equivalents, (ii) cash we expect to generate from operations and (iii) available capacity under our $7.5 billion unsecured revolving credit
facility (the “Revolving Facility”). In addition, we may also generate cash from the sale of assets and debt or equity financing from time to time.
Our short-term and long-term liquidity requirements primarily arise from: (i) business acquisitions and investments we may make from time to time, including the pending VMware Merger, (ii) working capital requirements, (iii) research and development and capital expenditure needs, (iv) cash dividend payments (if and when declared by our Board of Directors), (v) interest and principal payments related to our $41,218 million of outstanding indebtedness, (vi) share repurchases, and (vii) payment of income taxes. Our ability to fund these requirements will depend, in part, on our future cash flows, which are determined by our future operating performance and, therefore, subject to prevailing global macroeconomic conditions and financial, business and other factors, some of which are beyond our control. We expect capital expenditures to be higher in fiscal year 2023 as compared to fiscal year 2022. Our debt and liquidity needs will increase as a result of the pending VMware Merger, and we intend to fund the cash portion of the consideration with $32 billion in new, fully committed debt financing.
We believe that our cash and cash equivalents on hand, cash flows from operations, and the Revolving Facility, as well as the committed debt funding related to the pending VMware Merger, will provide sufficient liquidity to operate our business and fund our current and assumed obligations for at least the next 12 months. For additional information regarding our cash requirement from contractual obligations, indebtedness and lease obligations, see Note 14. “Commitments and Contingencies”, Note 10. “Borrowings” and Note 6. “Leases” in Part II, Item 8 of this Annual Report on Form 10-K.
From time to time, we engage in discussions with third parties regarding potential acquisitions of, or investments in, businesses, technologies and product lines. Any such transaction, or evaluation of potential transactions, could require significant use of our cash and cash equivalents, or require us to increase our borrowings to fund such transactions. If we do not have sufficient cash to fund our operations or finance growth opportunities, including acquisitions, or unanticipated capital expenditures, our business and financial condition could suffer. In such circumstances, we may seek to obtain new debt or equity financing. However, we cannot assure you that such additional financing will be available on terms acceptable to us or at all. Our ability to service our senior unsecured notes and any other indebtedness we may incur will depend on our ability to generate cash in the future. We may also elect to sell additional debt or equity securities for reasons other than those specified above.
In addition, we may, at any time and from time to time, seek to retire or purchase our outstanding debt through cash tenders and/or exchanges for equity or debt, in open-market purchases, privately negotiated transactions or otherwise. Such tenders, exchanges or purchases, if any, will be upon such terms and at such prices as we may determine, and will depend on prevailing market conditions, our liquidity requirements, contractual restrictions and other factors. The amounts involved may be material.
Working Capital
Working capital increased to $11,452 million at October 30, 2022 from $10,305 million at October 31, 2021. The increase was attributable to the following:
-
Accounts receivable increased to $2,958 million at October 30, 2022 from $2,071 million at October 31, 2021, primarily due to revenue linearity and less receivables sold through factoring arrangements.
-
Inventory increased to $1,925 million at October 30, 2022 from $1,297 million at October 31, 2021, primarily to support customer demand and due to higher material costs.
-
Cash and cash equivalents increased to $12,416 million at October 30, 2022 from $12,163 million at October 31, 2021, primarily due to $16,736 million in net cash provided by operating activities and $1,935 million in proceeds from long-term borrowings, partially offset by $7,032 million of dividend payments, $7,000 million of common stock repurchases, $2,361 million of debt payments, and $1,455 million of employee withholding tax payments related to net settled equity awards.
-
Other current assets increased to $1,205 million at October 30, 2022 from $1,055 million at October 31, 2021, primarily due to an increase in prepaid taxes, offset in part by a decrease in short-term investments.
These increases in working capital were offset in part by the following:
-
Other current liabilities increased to $4,412 million at October 30, 2022 from $3,839 million at October 31, 2021, primarily due to increases in contract liabilities, taxes payable and interest payable.
-
Current portion of long-term debt increased to $440 million at October 30, 2022 from $290 million at October 31, 2021, primarily due to certain debt instruments becoming due within the next twelve months, offset in part by repayments.
-
Employee compensation and benefits increased to $1,202 million at October 30, 2022 from $1,066 million at October 31, 2021, primarily due to higher variable compensation based on current fiscal year performance.
Capital Returns
| Fiscal Year Ended | ||||||||||||||
| Cash Dividends Declared and Paid | October 30, 2022 | October 31, 2021 | ||||||||||||
| (In millions, except per share data) | ||||||||||||||
| Dividends per share to common stockholders | $ | 16.40 | $ | 14.40 | ||||||||||
| Dividends to common stockholders | $ | 6,733 | $ | 5,913 | ||||||||||
| Dividends per share to preferred stockholders | $ | 80.00 | $ | 80.00 | ||||||||||
| Dividends to preferred stockholders | $ | 299 | $ | 299 |
In December 2021, our Board of Directors authorized a stock repurchase program to repurchase up to $10 billion of our common stock from time to time on or prior to December 31, 2022. During fiscal year 2022, we repurchased and retired approximately 12 million shares of our common stock for $7 billion under this stock repurchase program. In May 2022, our Board of Directors authorized another stock repurchase program to repurchase up to an additional $10 billion of our common stock from time to time through December 31, 2023.
Repurchases under our stock repurchase programs may be effected through a variety of methods, including open market or privately negotiated purchases. The timing and amount of shares repurchased will depend on the stock price, business and market conditions, corporate and regulatory requirements, alternative investment opportunities, acquisition opportunities, and other factors. We are not obligated to repurchase any specific amount of shares of common stock, and the stock repurchase programs may be suspended or terminated at any time.
During fiscal years 2022 and 2021, we paid approximately $1,455 million and $1,299 million, respectively, in employee withholding taxes due upon the vesting of net settled equity awards. We withheld approximately 3 million shares of common stock from employees in connection with such net share settlements during each of fiscal years 2022 and 2021.
Cash Flows
| Fiscal Year Ended | ||||||||||||||
| October 30, 2022 | October 31, 2021 | |||||||||||||
| (In millions) | ||||||||||||||
| Net cash provided by operating activities | $ | 16,736 | $ | 13,764 | ||||||||||
| Net cash used in investing activities | (667) | (245) | ||||||||||||
| Net cash used in financing activities | (15,816) | (8,974) | ||||||||||||
| Net change in cash and cash equivalents | $ | 253 | $ | 4,545 |
Operating Activities
Cash provided by operating activities consisted of net income adjusted for certain non-cash and other items and changes in assets and liabilities. The $2,972 million increase in cash provided by operations during fiscal year 2022 compared to fiscal year 2021 was due to $4,759 million higher net income and certain non-cash adjustments including deferred taxes and other non-cash taxes, offset by a decrease in amortization of intangible assets and stock-based compensation, as well as a $1,527 million decrease resulting from changes in operating assets and liabilities.
Investing Activities
Cash flows from investing activities primarily consisted of cash used for acquisitions, capital expenditures, and sales and purchases of investments. The $422 million increase in cash used in investing activities for fiscal year 2022 compared to fiscal year 2021 was primarily due to a $238 million increase in cash paid for acquisitions and $169 million lower net proceeds from sales of investments.
Financing Activities
Cash flows from financing activities primarily consisted of dividend payments, stock repurchases, proceeds and payments related to our long-term borrowings, and employee withholding tax payments related to net settled equity awards. The $6,842 million increase in cash used in financing activities for fiscal year 2022 compared to fiscal year 2021 was primarily
due to $7,000 million in common stock repurchases, a $820 million increase in dividend payments, and a $156 million increase in employee withholding tax payments related to net settled equity awards, offset in part by a $1,165 million change in net borrowing activities.
Accounting Changes and Recent Accounting Standards
For a description of accounting changes and recent accounting standards, including the expected dates of adoption and estimated effects, if any, in our consolidated financial statements, see Note 2. “Summary of Significant Accounting Policies” included in Part II, Item 8. of this Annual Report on Form 10-K.
Item 7A. QUANTITATIVE AND QUALITATIVE DISCLOSURES ABOUT MARKET RISK
Foreign Currency Exchange Risk
From time to time, we use foreign exchange forward contracts to hedge a portion of our exposures to changes in currency exchange rates, which result from our global operating and financing activities. We do not use derivative financial instruments for trading or speculative purposes. Gains and losses from foreign currency transactions, as well as foreign exchange forward contracts, were not significant for any period presented in the consolidated financial statements included in this Form 10-K. As of October 30, 2022, we did not have any outstanding foreign exchange forward contracts.
Interest Rate Risk
Changes in interest rates affect the fair value of our outstanding debt. As of October 30, 2022, we had $41.2 billion in principal amount of debt outstanding. The carrying amount of the debt was $39.5 billion, and the estimated aggregate fair value of debt was $33.0 billion. As of October 30, 2022, a hypothetical 50 basis points increase or decrease in market interest rates would change the fair value of debt by a decrease or increase of approximately $1.6 billion. However, this hypothetical change in interest rates would not impact the interest expense on our debt as we only had fixed rate senior notes outstanding. To hedge variability of cash flows due to changes in the benchmark interest rate of anticipated future debt issuances, we have entered, and in the future may enter, into treasury rate lock contracts.
Item 8. FINANCIAL STATEMENTS AND SUPPLEMENTARY DATA
BROADCOM INC.
INDEX TO CONSOLIDATED FINANCIAL STATEMENTS
REPORT OF INDEPENDENT REGISTERED PUBLIC ACCOUNTING FIRM
To the Board of Directors and Stockholders of Broadcom Inc.
Opinions on the Financial Statements and Internal Control over Financial Reporting
We have audited the accompanying consolidated balance sheets of Broadcom Inc. and its subsidiaries (the “Company”) as of October 30, 2022 and October 31, 2021, and the related consolidated statements of operations, of comprehensive income, of stockholders’ equity and of cash flows for each of the three years in the period ended October 30, 2022, including the related notes and financial statement schedule listed in the index appearing under Item 15(a)(2) (collectively referred to as the “consolidated financial statements”). We also have audited the Company's internal control over financial reporting as of October 30, 2022, based on criteria established in Internal Control - Integrated Framework (2013) issued by the Committee of Sponsoring Organizations of the Treadway Commission (COSO).
In our opinion, the consolidated financial statements referred to above present fairly, in all material respects, the financial position of the Company as of October 30, 2022 and October 31, 2021, and the results of its operations and its cash flows for each of the three years in the period ended October 30, 2022 in conformity with accounting principles generally accepted in the United States of America. Also in our opinion, the Company maintained, in all material respects, effective internal control over financial reporting as of October 30, 2022, based on criteria established in Internal Control - Integrated Framework (2013) issued by the COSO.
Change in Accounting Principle
As discussed in Note 6 to the consolidated financial statements, the Company changed the manner in which it accounts for leases in fiscal 2020.
Basis for Opinions
The Company's management is responsible for these consolidated financial statements, for maintaining effective internal control over financial reporting, and for its assessment of the effectiveness of internal control over financial reporting, included in Management’s Report on Internal Control Over Financial Reporting appearing under Item 9A. Our responsibility is to express opinions on the Company’s consolidated financial statements and on the Company's internal control over financial reporting based on our audits. We are a public accounting firm registered with the Public Company Accounting Oversight Board (United States) (PCAOB) and are required to be independent with respect to the Company in accordance with the U.S. federal securities laws and the applicable rules and regulations of the Securities and Exchange Commission and the PCAOB.
We conducted our audits in accordance with the standards of the PCAOB. Those standards require that we plan and perform the audits to obtain reasonable assurance about whether the consolidated financial statements are free of material misstatement, whether due to error or fraud, and whether effective internal control over financial reporting was maintained in all material respects.
Our audits of the consolidated financial statements included performing procedures to assess the risks of material misstatement of the consolidated financial statements, whether due to error or fraud, and performing procedures that respond to those risks. Such procedures included examining, on a test basis, evidence regarding the amounts and disclosures in the consolidated financial statements. Our audits also included evaluating the accounting principles used and significant estimates made by management, as well as evaluating the overall presentation of the consolidated financial statements. Our audit of internal control over financial reporting included obtaining an understanding of internal control over financial reporting, assessing the risk that a material weakness exists, and testing and evaluating the design and operating effectiveness of internal control based on the assessed risk. Our audits also included performing such other procedures as we considered necessary in the circumstances. We believe that our audits provide a reasonable basis for our opinions.
Definition and Limitations of Internal Control over Financial Reporting
A company’s internal control over financial reporting is a process designed to provide reasonable assurance regarding the reliability of financial reporting and the preparation of financial statements for external purposes in accordance with generally accepted accounting principles. A company’s internal control over financial reporting includes those policies and procedures that (i) pertain to the maintenance of records that, in reasonable detail, accurately and fairly reflect the transactions and dispositions of the assets of the company; (ii) provide reasonable assurance that transactions are recorded as necessary to permit preparation of financial statements in accordance with generally accepted accounting principles, and that receipts and
expenditures of the company are being made only in accordance with authorizations of management and directors of the company; and (iii) provide reasonable assurance regarding prevention or timely detection of unauthorized acquisition, use, or disposition of the company’s assets that could have a material effect on the financial statements.
Because of its inherent limitations, internal control over financial reporting may not prevent or detect misstatements. Also, projections of any evaluation of effectiveness to future periods are subject to the risk that controls may become inadequate because of changes in conditions, or that the degree of compliance with the policies or procedures may deteriorate.
Critical Audit Matters
The critical audit matter communicated below is a matter arising from the current period audit of the consolidated financial statements that was communicated or required to be communicated to the audit committee and that (i) relates to accounts or disclosures that are material to the consolidated financial statements and (ii) involved our especially challenging, subjective, or complex judgments. The communication of critical audit matters does not alter in any way our opinion on the consolidated financial statements, taken as a whole, and we are not, by communicating the critical audit matter below, providing a separate opinion on the critical audit matter or on the accounts or disclosures to which it relates.
Uncertain Tax Positions (UTPs)
As described in Notes 2 and 12 to the consolidated financial statements, the gross unrecognized tax benefits balance was $5,117 m
Showing the first 8K of 203K characters. Open the full section
Item 9. CHANGES IN AND DISAGREEMENTS WITH ACCOUNTANTS ON ACCOUNTING AND FINANCIAL DISCLOSURE
Not applicable.
Item 9A. CONTROLS AND PROCEDURES
Evaluation of Disclosure Controls and Procedures
Our management, with the participation of our Chief Executive Officer (“CEO”) and Chief Financial Officer (“CFO”), evaluated the effectiveness of our disclosure controls and procedures as of October 30, 2022. The term “disclosure controls and procedures,” as defined in Rules 13a-15(e) and 15d-15(e) under the Exchange Act, means controls and other procedures of a company that are designed to ensure that information required to be disclosed by a company in the reports that it files or submits under the Exchange Act is recorded, processed, summarized and reported within the time periods specified in the SEC’s rules and forms. Disclosure controls and procedures include, without limitation, controls and procedures designed to ensure that information required to be disclosed by a company in the reports that it files or submits under the Exchange Act is accumulated and communicated to our management, including its principal executive and principal financial officers, as appropriate to allow timely decisions regarding required disclosure. Management recognizes that any controls and procedures, no matter how well designed and operated, can provide only reasonable assurance of achieving their objectives and management necessarily applies its judgment in evaluating the cost-benefit relationship of possible controls and procedures. Based on the evaluation of our disclosure controls and procedures as of October 30, 2022, our CEO and CFO concluded that, as of such date, our disclosure controls and procedures were effective at the reasonable assurance level.
Management’s Report on Internal Control Over Financial Reporting
Our management is responsible for establishing and maintaining adequate internal control over financial reporting. Internal control over financial reporting is defined in Rules 13a-15(f) and 15d-15(f) promulgated under the Exchange Act as a process designed by, or under the supervision of, our principal executive and principal financial officers and effected by the Board, management and other personnel, to provide reasonable assurance regarding the reliability of financial reporting and the preparation of financial statements for external purposes in accordance with GAAP and includes those policies and procedures that:
-
pertain to the maintenance of records that in reasonable detail accurately and fairly reflect the transactions and dispositions of the assets;
-
provide reasonable assurance that transactions are recorded as necessary to permit preparation of financial statements in accordance with GAAP, and that receipts and expenditures of us are being made only in accordance with authorizations of management and directors; and
-
provide reasonable assurance regarding prevention or timely detection of unauthorized acquisition, use or disposition of our assets that could have a material effect on the financial statements.
Because of its inherent limitations, internal control over financial reporting may not prevent or detect misstatements. Projections of any evaluation of effectiveness to future periods are subject to the risk that controls may become inadequate because of changes in conditions, or that the degree of compliance with the policies or procedures may deteriorate.
Our management assessed the effectiveness of our internal control over financial reporting as of October 30, 2022. In making this assessment, our management used the criteria set forth by the Committee of Sponsoring Organizations of the Treadway Commission in Internal Control-Integrated Framework (2013). Based on this assessment, our management concluded that, as of October 30, 2022, our internal control over financial reporting is effective based on those criteria.
The effectiveness of our internal control over financial reporting, as of October 30, 2022 has been audited by PricewaterhouseCoopers LLP, an independent registered public accounting firm, as stated in their report which is included in Part II, Item 8. of this Annual Report on Form 10-K.
Changes in Internal Control over Financial Reporting
No change in our internal control over financial reporting (as defined in Rules 13a-15(f) and 15d-15(f) under the Exchange Act) occurred during the fourth quarter ended October 30, 2022 that has materially affected, or is reasonably likely to materially affect, our internal control over financial reporting. Although we have modified our workplace practices globally due to the COVID-19 pandemic, resulting in some of our employees working remotely, this has not meaningfully affected our internal controls over financial reporting. We are continually monitoring and assessing the COVID-19 situation on our internal controls to minimize the impact on their design and operating effectiveness.
Item 9B. OTHER INFORMATION
None.
Item 9C. DISCLOSURE REGARDING FOREIGN JURISDICTIONS THAT PREVENT INSPECTIONS
Not applicable.
PART III
Item 10. DIRECTORS, EXECUTIVE OFFICERS AND CORPORATE GOVERNANCE
The information required by Item 10 is incorporated herein by reference from sections entitled “Board of Directors,” “Corporate Governance” and “Proposal 1 — Election of Directors” in our definitive Proxy Statement for our 2023 Annual Meeting of Stockholders. Our executive officers are listed at the end of Item 1 of this Annual Report on Form 10-K.
Item 11. EXECUTIVE COMPENSATION
The information required by Item 11 is incorporated herein by reference from sections entitled “Board of Directors — Director Compensation,” “Board of Directors — Board Committees — Compensation Committee — Compensation Committee Interlocks and Insider Participation,” “Compensation Discussion and Analysis,” “Compensation Committee Report” and “Executive Compensation” in our definitive Proxy Statement for our 2023 Annual Meeting of Stockholders.
Item 12. SECURITY OWNERSHIP OF CERTAIN BENEFICIAL OWNERS AND MANAGEMENT AND RELATED STOCKHOLDER MATTERS
The information required by Item 12 is incorporated herein by reference from sections entitled “Stockholder Information — Security Ownership of Certain Beneficial Owners, Directors and Executive Officers” and “Equity Compensation Plan Information” in our definitive Proxy Statement for our 2023 Annual Meeting of Stockholders.
Item 13. CERTAIN RELATIONSHIPS AND RELATED TRANSACTIONS, AND DIRECTOR INDEPENDENCE
The information required by Item 13 is incorporated herein by reference from sections entitled “Board of Directors” and “Certain Relationships and Related Party Transactions” in our definitive Proxy Statement for our 2023 Annual Meeting of Stockholders.
Item 14. PRINCIPAL ACCOUNTANT FEES AND SERVICES
The information required by Item 14 is incorporated herein by reference from the section entitled “Proposal 2 — Ratification of Appointment of Independent Registered Public Accounting Firm” in our definitive Proxy Statement for our 2023 Annual Meeting of Stockholders.
PART IV
Item 15. EXHIBITS AND FINANCIAL STATEMENT SCHEDULES
(a) The following are filed as part of this Annual Report on Form 10-K:
- Financial Statements
The following consolidated financial statements are included in Item 8 of this Annual Report on Form 10-K:
- Financial Statement Schedules
The financial statement schedule of the Registrant and its subsidiaries for fiscal years 2022, 2021 and 2020 required by Item 15(a) (Schedule II, Valuation and Qualifying Accounts) is included in Item 8 of this Annual Report on Form 10-K:
| Page | |||||
| Schedule II - Valuation and Qualifying Accounts | 89 |
Schedules not filed have been omitted because they are not applicable, are not required or the information required to be set forth therein is included in the financial statements or notes thereto.
- Exhibits
The documents set forth below are filed herewith or incorporated by reference to the location indicated.
| Incorporated by Reference | ||||||||||||||||||||||||||
| Exhibit Number | Description | Form (File No.) | Filing Date | Filed Herewith | ||||||||||||||||||||||
| 3.2 | Certificate of Designation of the 8.00% Mandatory Convertible Preferred Stock, Series A. | Broadcom Inc. Current Report on Form 8-K (Commission File No. 001-38449) | September 30, 2019 | |||||||||||||||||||||||
| 3.3 | Amended and Restated Bylaws. | Broadcom Inc. Current Report on Form 8-K12B (Commission File No. 001-38449) | April 4, 2018 | |||||||||||||||||||||||
| 4.1 | Form of Common Stock Certificate. | Broadcom Inc. Quarterly Report on Form 10-Q (Commission File No. 001-38449) | June 14, 2018 | |||||||||||||||||||||||
| 4.2 | Form of Certificate of the 8.00% Mandatory Convertible Preferred Stock, Series A (included in the Exhibit 3.2). | Broadcom Inc. Current Report on Form 8-K (Commission File No. 001-38449) | September 30, 2019 | |||||||||||||||||||||||
| 4.3 | Description of Common Stock. | Broadcom Inc. Annual Report on Form 10-K (Commission File No. 001-38449) | December 20, 2019 | |||||||||||||||||||||||
| 4.4 | Description of 8.00% Mandatory Convertible Preferred Stock, Series A. | Broadcom Inc. Annual Report on Form 10-K (Commission File No. 001-38449) | December 20, 2019 | |||||||||||||||||||||||
| 4.5 | Indenture, dated as of January 19, 2017, by and among the Broadcom Corporation and Broadcom Cayman Finance Limited (the “Co-Issuers”), the guarantors and Wilmington Trust, National Association, as trustee. | Broadcom Limited Current Report on Form 8-K (Commission File No. 001-37690) | January 20, 2017 | |||||||||||||||||||||||
| 4.6 | Supplement Indenture to the January 2017 Indenture, dated as of April 9, 2018. | Broadcom Inc. Current Report on Form 8-K (Commission File No. 001-38449) | April 9, 2018 | |||||||||||||||||||||||
| 4.7 | Second Supplement Indenture to the January 2017 Indenture, dated as of January 25, 2019. | Broadcom Inc. Current Report on Form 8-K (Commission File No. 001-38449) | January 25, 2019 | |||||||||||||||||||||||
| 4.8 | Form of 3.000% Senior Notes due 2022 (included in Exhibit 4.5). | Broadcom Limited Current Report on Form 8-K (Commission File No. 001-37690) | January 20, 2017 | |||||||||||||||||||||||
| 4.9 | Form of 3.625% Senior Notes due 2024 (included in Exhibit 4.5). | Broadcom Limited Current Report on Form 8-K (Commission File No. 001-37690) | January 20, 2017 | |||||||||||||||||||||||
| 4.10 | Form of 3.875% Senior Notes due 2027 (included in Exhibit 4.5). | Broadcom Limited Current Report on Form 8-K (Commission File No. 001-37690) | January 20, 2017 | |||||||||||||||||||||||
| 4.11 | Indenture, dated as of October 17, 2017, by and among the Co-Issuers, the guarantors and Wilmington Trust, National Association, as trustee. | Broadcom Limited Current Report on Form 8-K (Commission File No. 001-37690) | October 17, 2017 | |||||||||||||||||||||||
| 4.12 | Supplemental Indenture to October 2017 Indenture, dated as of April 9, 2018. | Broadcom Inc. Current Report on Form 8-K (Commission File No. 001-38449) | April 9, 2018 |
| Incorporated by Reference | ||||||||||||||||||||||||||
| Exhibit Number | Description | Form (File No.) | Filing Date | Filed Herewith | ||||||||||||||||||||||
| 4.13 | Second Supplemental Indenture to October 2017 Indenture, dates as of January 25, 2019. | Broadcom Inc. Current Report on Form 8-K (Commission File No. 001-38449) | January 25, 2019 | |||||||||||||||||||||||
| 4.14 | Form of 2.650% Senior Notes due 2023 (included in Exhibit 4.11). | Broadcom Limited Current Report on Form 8-K (Commission File No. 001-37690) | October 17, 2017 | |||||||||||||||||||||||
| 4.15 | Form of 3.125% Senior Notes due 2025 (included in Exhibit 4.11). | Broadcom Limited Current Report on Form 8-K (Commission File No. 001-37690) | October 17, 2017 | |||||||||||||||||||||||
| 4.16 | Form of 3.500% Senior Notes due 2028 (included in Exhibit 4.11). | Broadcom Limited Current Report on Form 8-K (Commission File No. 001-37690) | October 17, 2017 | |||||||||||||||||||||||
| 4.17 | Indenture, dated as of April 5, 2019, by and among the Company, as Issuer, Broadcom Technologies Inc., Broadcom Corporation and Broadcom Cayman Finance Limited (the “2019 Guarantors”), and Wilmington Trust, National Association, as trustee. | Broadcom Inc. Current Report on Form 8-K (Commission File No. 001-38449) | April 5, 2019 | |||||||||||||||||||||||
| 4.18 | Form of 3.625% Senior Notes due 2024 (included in Exhibit 4.17). | Broadcom Inc. Current Report on Form 8-K (Commission File No. 001-38449) | April 5, 2019 | |||||||||||||||||||||||
| 4.19 | Form of 4.250% Senior Notes due 2026 (included in Exhibit 4.17). | Broadcom Inc. Current Report on Form 8-K (Commission File No. 001-38449) | April 5, 2019 | |||||||||||||||||||||||
| 4.20 | Form of 4.750% Senior Notes due 2029 (included in Exhibit 4.17). | Broadcom Inc. Current Report on Form 8-K (Commission File No. 001-38449) | April 5, 2019 | |||||||||||||||||||||||
| 4.21 | Indenture, dated as of April 9, 2020, by and among the Company, as Issuer, Broadcom Technologies Inc. and Broadcom Corporation (the “2020 Guarantors”), and Wilmington Trust, National Association, as trustee. | Broadcom Inc. Current Report on Form 8-K (Commission File No. 001-38449) | April 9, 2020 | |||||||||||||||||||||||
| 4.22 | Form of 4.700% Senior Notes due 2025 (included in Exhibit 4.21). | Broadcom Inc. Current Report on Form 8-K (Commission File No. 001-38449) | April 9, 2020 | |||||||||||||||||||||||
| 4.23 | Form of 5.000% Senior Notes due 2030 (included in Exhibit 4.21). | Broadcom Inc. Current Report on Form 8-K (Commission File No. 001-38449) | April 9, 2020 | |||||||||||||||||||||||
| 4.24 | Indenture, dated as of May 8, 2020, by and among the Company, as Issuer, the 2020 Guarantors, and Wilmington Trust, National Association, as trustee. | Broadcom Inc. Current Report on Form 8-K (Commission File No. 001-38449) | May 8, 2020 | |||||||||||||||||||||||
| 4.25 | Form of 2.250% Senior Notes due 2023 (included in Exhibit 4.24). | Broadcom Inc. Current Report on Form 8-K (Commission File No. 001-38449) | May 8, 2020 |
| Incorporated by Reference | ||||||||||||||||||||||||||
| Exhibit Number | Description | Form (File No.) | Filing Date | Filed Herewith | ||||||||||||||||||||||
| 32.2 | Certification of Principal Financial Officer of Broadcom Inc. Pursuant to 18 U.S.C. Section 1350, As Adopted Pursuant to Section 906 of the Sarbanes-Oxley Act of 2002. | X | ||||||||||||||||||||||||
| 99.1 | Voting Agreement, dated as of May 26, 2022, by and among Broadcom Inc., Michael S. Dell and Susan Lieberman Dell Separate Property Trust. | Broadcom Inc. Current Report on Form 8-K (Commission File No. 001-38449) | May 26, 2022 | |||||||||||||||||||||||
| 99.2 | Voting Agreement, dated as of May 26, 2022, by and among Broadcom Inc., Silver Lake Partners IV, L.P., Silver Lake Technology Investors IV, L.P., Silver Lake Partners V DE (AIV), L.P., Silver Lake Technology Investors V, L.P., SL SPV-2, L.P. and Silver Lake Group, L.L.C. | Broadcom Inc. Current Report on Form 8-K (Commission File No. 001-38449) | May 26, 2022 | |||||||||||||||||||||||
| 101.INS | XBRL Instance Document - the instance document does not appear in the Interactive Data File because its XBRL tags are embedded within the Inline XBRL document. | X | ||||||||||||||||||||||||
| 101.SCH | XBRL Schema Document | X | ||||||||||||||||||||||||
| 101.CAL | XBRL Calculation Linkbase Document | X | ||||||||||||||||||||||||
| 101.DEF | XBRL Definition Linkbase Document | X | ||||||||||||||||||||||||
| 101.LAB | XBRL Labels Linkbase Document | X | ||||||||||||||||||||||||
| 101.PRE | XBRL Presentation Linkbase Document | X | ||||||||||||||||||||||||
| 104 | Cover Page Interactive Data File - the cover page interactive data file does not appear in the Interactive Data File because its XBRL tags are embedded within the Inline XBRL document. | X |
Notes:
| + | Indicates a management contract or compensatory plan or arrangement. | |||||||
| # | Schedules have been omitted pursuant to Item 601(b)(2) of Regulation S-K. Broadcom Inc. hereby undertakes to furnish supplementally copies of any omitted schedules upon request by the SEC. | |||||||
| * | Certain information omitted pursuant to a request for confidential treatment filed with the SEC. |
Item 16. FORM 10-K SUMMARY
None.
SIGNATURES
Pursuant to the requirements of Section 13 or 15(d) of the Securities Exchange Act of 1934, the Registrant has duly caused this report to be signed on its behalf by the undersigned, thereunto duly authorized.
| BROADCOM INC. | |||||||||||
| By: | /s/ Hock E. Tan | ||||||||||
| Name: | Hock E. Tan | ||||||||||
| Title: | President and Chief Executive Officer |
Date: December 16, 2022
POWER OF ATTORNEY
Each person whose individual signature appears below hereby authorizes and appoints Hock E. Tan, Kirsten M. Spears and Mark D. Brazeal, and each of them, with full power of substitution and resubstitution and full power to act without the other, as his or her true and lawful attorney-in-fact and agent to act in his or her name, place and stead and to execute in the name and on behalf of each person, individually and in each capacity stated below, and to file any and all amendments to this Annual Report on Form 10-K, and to file the same, with all exhibits thereto, and other documents in connection therewith, with the Securities and Exchange Commission, granting unto said attorneys-in-fact and agents, and each of them, full power and authority to do and perform each and every act and thing, ratifying and confirming all that said attorneys-in-fact and agents or any of them or their or his substitute or substitutes may lawfully do or cause to be done by virtue thereof.
Pursuant to the requirements of the Securities Exchange Act of 1934, this Annual Report on Form 10-K has been signed by the following persons on behalf of the Registrant in the capacities indicated and on the dates indicated.
| Signature | Title | Date | ||||||||||||
| /s/ Hock E. Tan | President and Chief Executive Officer and Director (Principal Executive Officer) | December 16, 2022 | ||||||||||||
| Hock E. Tan | ||||||||||||||
| /s/ Kirsten M. Spears | Chief Financial Officer (Principal Financial Officer and Principal Accounting Officer) | December 16, 2022 | ||||||||||||
| Kirsten M. Spears | ||||||||||||||
| /s/ Henry Samueli | Chairman of the Board of Directors | December 16, 2022 | ||||||||||||
| Henry Samueli | ||||||||||||||
| /s/ Eddy W. Hartenstein | Lead Independent Director | December 16, 2022 | ||||||||||||
| Eddy W. Hartenstein | ||||||||||||||
| /s/ Diane M. Bryant | Director | December 16, 2022 | ||||||||||||
| Diane M. Bryant | ||||||||||||||
| /s/ Gayla J. Delly | Director | December 16, 2022 | ||||||||||||
| Gayla J. Delly | ||||||||||||||
| /s/ Raul F. Fernandez | Director | December 16, 2022 | ||||||||||||
| Raul F. Fernandez | ||||||||||||||
| /s/ Check Kian Low | Director | December 16, 2022 | ||||||||||||
| Check Kian Low | ||||||||||||||
| /s/ Justine F. Page | Director | December 16, 2022 | ||||||||||||
| Justine F. Page | ||||||||||||||
| /s/ Harry L. You | Director | December 16, 2022 | ||||||||||||
| Harry L. You |