 filings.tools
Avery Dennison 10-K 2023-12-30
Filed 2024-02-21. 24 sections, 433K characters. Original on sec.gov · Markdown · JSON
Cover and table of contents
UNITED STATES SECURITIES AND EXCHANGE COMMISSION
WASHINGTON, DC 20549
FORM 10-K
| x | ANNUAL REPORT PURSUANT TO SECTION 13 OR 15(d) OF THE SECURITIES EXCHANGE ACT OF 1934 |
For the fiscal year ended December 30, 2023 or
| o | TRANSITION REPORT PURSUANT TO SECTION 13 OR 15(d) OF THE SECURITIES EXCHANGE ACT OF 1934 |
For the transition period from to
Commission file number 1-7685
AVERY DENNISON CORPORATION
(Exact Name of Registrant as Specified in Its Charter)
| Delaware | 95-1492269 | ||||
| (State of Incorporation) | (I.R.S. Employer Identification No.) | ||||
| 8080 Norton Parkway | |||||
| Mentor, Ohio | 44060 | ||||
| (Address of Principal Executive Offices) | (Zip Code) |
Registrant’s telephone number, including area code:
(440) 534-6000
Securities registered pursuant to Section 12(b) of the Act:
| Title of Each Class | Trading Symbol(s) | Name of each exchange on which registered | ||||||||||||
| Common stock, $1 par value | AVY | New York Stock Exchange | ||||||||||||
| 1.25% Senior Notes due 2025 | AVY25 | Nasdaq Stock Market |
Securities registered pursuant to Section 12(g) of the Act:
Not applicable.
Indicate by check mark if the registrant is a well-known seasoned issuer, as defined in Rule 405 of the Securities Act. Yes x No o
Indicate by check mark if the registrant is not required to file reports pursuant to Section 13 or 15(d) of the Act. Yes o No x
Indicate by check mark whether the registrant (1) has filed all reports required to be filed by Section 13 or 15(d) of the Securities Exchange Act of 1934 during the preceding 12 months (or for such shorter period that the registrant was required to file such reports), and (2) has been subject to such filing requirements for the past 90 days. Yes x No o
Indicate by check mark whether the registrant has submitted electronically every Interactive Data File required to be submitted pursuant to Rule 405 of Regulation S-T (§232.405 of this chapter) during the preceding 12 months (or for such shorter period that the registrant was required to submit such files). Yes x No o
Indicate by check mark whether the registrant is a large accelerated filer, an accelerated filer, a non-accelerated filer, a smaller reporting company, or an emerging growth company. See the definitions of “large accelerated filer,” “accelerated filer,” “smaller reporting company,” and “emerging growth company” in Rule 12b-2 of the Exchange Act.
| Large Accelerated Filer x | Accelerated filer o | Non-accelerated filer o | Smaller reporting company o | |||||||||||||||||
| Emerging growth company o |
If an emerging growth company, indicate by check mark if the registrant has elected not to use the extended transition period for complying with any new or revised financial accounting standards provided pursuant to Section 13(a) of the Exchange Act. o
Indicate by check mark whether the registrant has filed a report on and attestation to its management’s assessment of the effectiveness of its internal control over financial reporting under Section 404(b) of the Sarbanes-Oxley Act (15 U.S.C. 7262(b)) by the registered public accounting firm that prepared or issued its audit report.x
If securities are registered pursuant to Section 12(b) of the Act, indicate by check mark whether the financial statements of the registrant included in the filing reflect the correction of an error to previously issued financial statements. o
Indicate by check mark whether any of those error corrections are restatements that required a recovery analysis of incentive-based compensation received by any of the registrant’s executive officers during the relevant recovery period pursuant to §240.10D-1(b). o
Indicate by check mark whether the registrant is a shell company (as defined in Rule 12b-2 of the Act). Yes o No x
The aggregate market value of voting and non-voting common equity held by non-affiliates as of July 1, 2023, the last business day of the registrant’s most recently completed second fiscal quarter, was approximately $13.7 billion.
Number of shares of common stock, $1 par value, outstanding as of January 27, 2024, the end of the registrant’s most recent fiscal month: 80,508,663.
The following documents are incorporated by reference into the Parts of this Form 10-K indicated below:
| Document | Incorporated by reference into: | |||||||
| Portions of Definitive Proxy Statement for Annual Meeting of Stockholders to be held on April 25, 2024 | Parts III, IV |
AVERY DENNISON CORPORATION
FISCAL YEAR 2023 ANNUAL REPORT ON FORM 10-K
TABLE OF CONTENTS
Safe Harbor Statement
The matters discussed in this Annual Report on Form 10-K contain “forward-looking statements” within the meaning of the Private Securities Litigation Reform Act of 1995. These statements, which are not statements of historical fact, contain estimates, assumptions, projections and/or expectations regarding future events, which may or may not occur. Words such as “aim,” “anticipate,” “assume,” “believe,” “continue,” “could,” “estimate,” “expect,” “foresee,” “guidance,” “intend,” “may,” “might,” “objective,” “plan,” “potential,” “project,” “seek,” “shall,” “should,” “target,” “will,” “would,” or variations thereof, and other expressions that refer to future events and trends, identify forward-looking statements. Our forward-looking statements, and financial or other business targets, are subject to certain risks and uncertainties, which could cause our actual results to differ materially from the expected results, performance or achievements expressed or implied by such forward-looking statements.
We believe that the most significant risk factors that could affect our financial performance in the near term include: (i) the impacts to underlying demand for our products from global economic conditions, political uncertainty, and changes in environmental standards and governmental regulations; (ii) competitors’ actions, including pricing, expansion in key markets, and product offerings; (iii) the cost and availability of raw materials; (iv) the degree to which higher costs can be offset with productivity measures and/or passed on to customers through price increases, without a significant loss of volume; (v) foreign currency fluctuations; and (vi) the execution and integration of acquisitions.
Certain risks and uncertainties are discussed in more detail under “Risk Factors” and “Management’s Discussion and Analysis of Financial Condition and Results of Operations” in this Annual Report on Form 10-K for the fiscal year ended December 30, 2023. Actual results and trends may differ materially from historical or anticipated results depending on a variety of factors, including but not limited to, risks and uncertainties related to the following:
-
International Operations – worldwide economic, social, political and market conditions; changes in political conditions, including those related to China, the Russia-Ukraine war, the Israel-Hamas war and related hostilities in the Middle East; fluctuations in foreign currency exchange rates; and other risks associated with international operations, including in emerging markets
-
Our Business – fluctuations in demand affecting sales to customers; fluctuations in the cost and availability of raw materials and energy; changes in our markets due to competitive conditions, technological developments, laws and regulations, tariffs and customer preferences; increasing environmental standards; the impact of competitive products and pricing; execution and integration of acquisitions; selling prices; customer and supplier concentrations or consolidations; financial condition of distributors; outsourced manufacturers; product and service quality; restructuring and other productivity actions; timely development and market acceptance of new products, including sustainable or sustainably-sourced products; investment in development activities and new production facilities; successful implementation of new manufacturing technologies and installation of manufacturing equipment; our ability to generate sustained productivity improvement; our ability to achieve and sustain targeted cost reductions; collection of receivables from customers; our sustainability and governance practices; and epidemics, pandemics or other outbreaks of illness
-
Information Technology – disruptions in information technology systems, cyber attacks or other security breaches; and successful installation of new or upgraded information technology systems
-
Income Taxes – fluctuations in tax rates; changes in tax laws and regulations, and uncertainties associated with interpretations of such laws and regulations; retention of tax incentives; outcome of tax audits; and the realization of deferred tax assets
-
Human Capital – recruitment and retention of employees and collective labor arrangements
-
Our Indebtedness – credit risks; our ability to obtain adequate financing arrangements and maintain access to capital; fluctuations in interest rates; volatility in financial markets; and compliance with our debt covenants
-
Ownership of Our Stock – potential significant variability of our stock price and amounts of future dividends and share repurchases
-
Legal and Regulatory Matters – protection and infringement of intellectual property; impact of legal and regulatory proceedings, including with respect to environmental, compliance and anti-corruption, environmental, health and safety, and trade compliance
-
Other Financial Matters – fluctuations in pension costs and goodwill impairment
Our forward-looking statements are made only as of February 21, 2024. We assume no duty to update these forward-looking statements to reflect new, changed or unanticipated events or circumstances, other than as may be required by law.
PART I
Item 1. BUSINESS
Company Background
Avery Dennison Corporation (“Avery Dennison” or the “Company” and generally referred to as “we” or “us”) was incorporated in Delaware in 1977 as Avery International Corporation, the successor corporation to a California corporation of the same name incorporated in 1946. In 1990, we merged one of our subsidiaries into Dennison Manufacturing Company (“Dennison”), as a result of which Dennison became our wholly-owned subsidiary and in connection with which we changed our name to Avery Dennison Corporation. You can learn more about us by visiting our website at www.averydennison.com. Our website address provided in this Annual Report on Form 10-K is not intended to function as a hyperlink and the information on our website is not, nor should it be considered, part of this report or incorporated by reference into this report.
Business Overview and Reportable Segments
We are a global materials science and digital identification solutions company that provides a wide range of branding and information solutions that optimize labor and supply chain efficiency, reduce waste, advance sustainability, circularity and transparency, and better connect brands and consumers. Our products and solutions include labeling and functional materials, radio-frequency identification ("RFID") inlays and tags, software applications that connect the physical and digital, and a variety of products and solutions that enhance branded packaging and carry or display information that improves the customer experience. We serve an array of industries worldwide, including home and personal care, apparel, general retail, e-commerce, logistics, food and grocery, pharmaceuticals and automotive.
Our reportable segments for fiscal year 2023 were:
-
Materials Group; and
-
Solutions Group
In 2023, our Materials Group and Solutions Group reportable segments comprised approximately 69% and 31%, respectively, of our total net sales.
In 2023, international operations constituted a substantial majority of our business, representing approximately 69% of our net sales. As of December 30, 2023, we operated over 200 manufacturing and distribution facilities in more than 50 countries.
Materials Group
Our Materials Group business is a leading provider to pressure-sensitive label and graphics industries worldwide. Our innovative products include label materials, graphics and reflective materials and functional bonding materials, such as tapes. Our label materials enhance shelf appeal for brands, inform shoppers, advance circularity, increase transparency, help reduce waste and improve operational supply chain efficiency. Our graphics portfolio offers highly engineered materials that range from vehicle wraps to architectural films. Materials Group plays a key role in advancing our fast-growing intelligent labels business, providing the materials science capabilities and process engineering expertise essential to developing and manufacturing intelligent labels at scale.
Our Materials Group manufactures and sells Fasson®-, JAC®-, and Avery Dennison®-brand pressure-sensitive label materials and performance tapes products, Avery Dennison®- and Mactac®-brand graphics, and Avery Dennison®-brand reflective products. Materials Group’s business tends not to be seasonal, except for certain outdoor graphics and reflective products.
Pressure-sensitive materials consist primarily of papers, plastic films, metal foils and fabrics, which are coated with internally-developed and purchased adhesives, and then laminated with specially-coated backing papers and films. They are then sold in roll or sheet form with either solid or patterned adhesive coatings in a wide range of face materials, sizes, thicknesses and adhesive properties.
A pressure-sensitive, or self-adhesive, material is one that adheres to a surface by press-on contact. It generally consists of four layers: a face material, which may be paper, metal foil, plastic film or fabric; an adhesive, which may be permanent or removable; a release coating; and a backing material to protect the adhesive from premature contact with other surfaces that can also serve as a carrier for supporting and dispensing individual labels. When the products are ready for use, the release coating and protective backing are removed, exposing the adhesive so that the label or other face material may be pressed or rolled into place. Because they are easy to apply without the need for adhesive activation, self-adhesive materials can provide cost savings compared to other materials that require heat- or moisture-activated adhesives, while also offering aesthetic and other advantages over alternative technologies.
Label materials are sold worldwide to label converters for labeling, decorating and specialty applications in the home and personal care, beer and beverage, durables, pharmaceutical, wine and spirits, food and logistics market segments. When used in package decoration applications, the visual appeal of self-adhesive materials can help increase sales of the products on which the materials are applied. Self-adhesive materials are also used to convey variable information, such as RFID inlays to enable digital identities on items and bar codes for mailing or weight and price information for packaged
meats and other foods. Self-adhesive materials provide consistent and versatile adhesion and are available in a large selection of materials, which can be made into labels of varying sizes and shapes.
Our graphics and reflective products include a variety of films and other products that are sold to the architectural, commercial sign, digital printing and other related market segments. We also sell durable cast and reflective films to the construction, automotive and fleet transportation market segments and reflective films for traffic and safety applications. We provide sign shops, commercial printers and designers a broad range of pressure-sensitive materials that allow them to create impactful and informative brand and decorative graphics. We offer a wide array of pressure-sensitive vinyl and specialty materials designed for digital imaging, screen printing and sign cutting applications.
Our performance tapes products include a variety of Fasson®-brand and Avery Dennison®-brand tapes and other pressure-sensitive adhesive-based materials and converted products, mechanical fasteners and performance polymers. Our pressure-sensitive adhesive-based materials are available in roll form and in a wide range of face materials, sizes, thicknesses and adhesive properties. These materials and converted products are used in non-mechanical fastening, bonding and sealing systems for various automotive, electronics, building and construction, general industrial, personal care, and medical applications. Our performance tapes products include Yongle®-brand tapes for wire harnessing and cable wrapping in automotive, electrical and general industrial applications. The mechanical fasteners are primarily precision-extruded and injection-molded plastic devices used in various automotive, general industrial and retail applications.
Our larger competitors in label materials include UPM Raflatac, a subsidiary of UPM Corporation; Fedrigoni Self-Adhesives; Lintec Corporation; Flexcon Corporation, Inc.; and an array of smaller regional and local companies. For graphics and reflective products, our largest competitors are 3M Company (“3M”) and the Orafol Group. For performance tapes products, our competitors include 3M; Tesa-SE, a subsidiary of Beiersdorf AG; Nitto Denko Corporation; and numerous regional and specialty suppliers. For fastener products, there are a variety of competitors supplying extruded and injection molded fasteners and fastener attaching equipment. We believe that entry of competitors into the field of pressure-sensitive adhesives and materials is limited by technical knowledge and capital requirements. We believe that our technical expertise, size and scale of operations, broad line of quality products and reliable service, product and process innovation, distribution capabilities, brand strength and product innovation are the primary advantages in maintaining and further developing our competitive position.
Solutions Group
Our Solutions Group is a leading global provider of information and branding products and solutions that cover a breadth of customer needs from digital identification and data management, branding and embellishment, as well as productivity, pricing and retail media. We empower customers across multiple retail and industry segments to connect the physical and digital worlds, leveraging our industry-leading RFID solutions. Our technology addresses complex customer challenges, provides transparency and visibility across supply chains, improves labor and waste efficiency, and enables better consumer experiences at the point of purchase and beyond. Market segments served include the global apparel, logistics, food and grocery, and general retail industries. As a large ultra-high frequency RFID solutions provider, we leverage our innovation and data management capabilities, global footprint and market access in the ongoing advancement of our intelligent labels business.
The branding solutions of the Solutions Group include brand embellishments, graphic tickets, tags, and labels, and sustainable packaging. Solutions Group’s information solutions include item-level RFID solutions; visibility and loss prevention solutions; price ticketing and marking; care, content, and country of origin compliance solutions; brand protection and security solutions; and Vestcom®-brand shelf-edge productivity and media solutions.
In the Solutions Group, our primary competitors include Checkpoint Systems, Inc., a subsidiary of CCL Industries Inc.; R-pac International Corporation; and SML Group Limited. We believe that our product, process and solution innovation, global distribution network, reliable service, product quality and consistency, and ability to serve customers consistently with comprehensive solutions close to where they manufacture, source and sell are the key advantages in maintaining and further developing our competitive position.
Research, Development and Innovation
As a global leader in materials science, we innovate to develop and introduce new products and solutions that help customers solve for some of the most complex problems in the industries we serve. Our vision is to leverage the strengths of our Materials and Solutions businesses to lead at the intersection of the physical and digital worlds. Our decades of experience creating solutions for customers and our core capabilities in materials science, engineering and process technology enable us to drive continuous innovation throughout our industries. Our innovation efforts focus on anticipating market and customer challenges and opportunities, and applying technology to address them. Our investment in innovation aims to accelerate growth, expand margins and enable customer success by leveraging scalable innovation platforms and delivering sustainability initiatives and advanced technologies.
Many of our new products result from our research and development efforts. These efforts are directed primarily toward developing products and solutions, operating techniques and improving productivity, sustainability and product performance, often in close association with our customers or end users. These efforts provide intellectual property that leverages our research and development relating to adhesives, as well as printing and coating technologies, films, release
and ink chemistries in Materials Group. We focus on research projects related to RFID, external embellishments, data and digital solutions and printing technologies in Solutions Group, in each case for which we have and license a number of patents. Additionally, our research and development efforts include sustainable innovation and design of products that advance the circular economy, reduce materials and waste, use recycled content, and extend product end-of-life or enable product recycling.
Acquisitions and Venture Investments
In addition to our investments to support organic growth, we have pursued complementary and synergistic acquisitions. In 2023, we acquired Silver Crystal Group ("Silver Crystal"), a Canada-based provider of sports apparel customization and application solutions across in-venue, direct-to-business and e-commerce platforms; LG Group, Inc. ("Lion Brothers"), a Maryland-based designer and manufacturer of apparel brand embellishments; and Thermopatch, Inc. ("Thermopatch"), a New York-based manufacturer specializing in labeling, embellishments and transfers for the sports, industrial laundry, workwear and hospitality industries. The aggregate purchase consideration for these 2023 acquisitions was approximately $231 million. In 2022, we acquired TexTrace AG (“TexTrace”), a Switzerland-based technology developer specializing in custom-made woven and knitted radio-frequency identification products that can be sewn onto or inserted into garments, as well as Rietveld Serigrafie B.V. and Rietveld Screenprinting Serigrafi Baski Matbaa Tekstil Ithalat Ihracat Sanayi ve Ticaret Limited Sirketi (collectively, “Rietveld”), a Netherlands-based provider of external embellishment solutions and application and printing methods for performance brands and team sports in Europe. The aggregate purchase consideration for the acquisitions of TexTrace and Rietveld was approximately $35 million. During 2023, we also made one venture investment in a company developing technological solutions that we believe have the potential to advance our businesses. For information regarding our acquisitions, see Note 2, “Business Acquisitions,” in the Notes to Consolidated Financial Statements. For information regarding our venture investments, see Note 9, “Fair Value Measurements,” in the Notes to Consolidated Financial Statements.
Patents, Trademarks and Licenses
The loss of individual patents or licenses would not be material to us taken as a whole, nor to our operating segments individually. Our principal trademarks are Avery Dennison, our logo, and Fasson. We believe these trademarks are strong in the market segments in which we operate.
Human Capital Resources
Our Global Workforce
With approximately 69% of our 2023 net sales originating outside the U.S. and approximately 40% of our net sales originating in emerging markets (Asia Pacific, Latin America, Eastern Europe and Middle East/Northern Africa), our employees are located in more than 50 countries to best serve our customers. Approximately 83% of our employees at year-end 2023 were located outside the U.S. and approximately 66% were located in emerging markets.
The charts below show our global employee population by region and operational function. Over 19,000 of our approximately 35,000 employees at year-end 2023, representing approximately 56% of our global workforce, were in Asia Pacific, serving our customers in that region. At that time, approximately 65% of our global workforce worked in the operations of our manufacturing facilities or in positions directly supporting them from other locations.
| Workforce by Region | |||||
| Asia Pacific | 56 | % | |||
| North America | 22 | ||||
| Europe | 18 | ||||
| Latin America | 4 | ||||
| Workforce by Function | |||||
| Operations | 65 | % | |||
| Non-Operations | 35 |
Talent & Development
Attracting, developing and retaining highly-skilled talent is critical to our ability to continuously deliver sustainable growth. We provide ongoing support and resources to our team members worldwide to ensure that their skills evolve with our business needs, industry trends and human capital management best practices, as well as enable increased productivity, peak performance and career growth. We have robust talent review and succession planning processes that provide individually targeted development opportunities for our team members. We emphasize on-the-job development and coaching, and also provide facilitator-led and direct-access online training, responsibility for executing special projects and, in some cases, cross-functional or cross-regional work assignments.
Pay & Benefits
Our compensation philosophy is to offer market-based, competitive wages and benefits in the markets where we compete for talent – all of our employees were paid at least the applicable legal minimum wage, and over 98% of our employees were paid above the applicable legal minimum wage at year-end 2023. Pay is generally positioned around the market median, with variances based on knowledge, skills, years of experience and performance. In addition to base wages, our compensation and benefit programs — which vary by region, country and business unit — include short-term incentives (generally paid in cash), long-term incentives (e.g., cash- or stock-based awards), employee savings plans, healthcare and insurance benefits, health savings and flexible spending accounts, paid time off, family leave and employee assistance programs. We annually evaluate pay equity, making adjustments where appropriate. In 2023, we reviewed pay equity (considering total base, annual incentive compensation and long term incentives) with respect to gender for all non-manufacturing employees globally, as well as manufacturing employees in the U.S. and certain other countries, and with respect to race/ethnicity for all U.S. employees. We offer flexible work arrangements for our office-based workforce to provide them with greater flexibility to balance their work and personal commitments, while ensuring that we meet the needs of our business. Our infrastructure, information security and digital tools support employee efficiency and effectiveness wherever they work.
Employee Engagement
Because we believe that an engaged workforce promotes retention and minimizes employee turnover, we annually conduct a global employee engagement survey. With a focus on continuous improvement, in 2023 we launched our survey using a more advanced platform providing real-time access to results, improved analytics and ability to connect data throughout the employee experience, more meaningful comparisons to external benchmarks, and ongoing pulse survey capability. Our business and functional teams use the anonymized results of our survey to identify and implement actions to address potential opportunities for improvement. While employee engagement is the result of many factors, we believe strong, encouraging and open leadership, as well as a continued effort to foster a collaborative, supportive culture, leads to strong workforce engagement.
Workforce Health & Safety
Safety is one of our highest priorities, and we continually work to ensure our manufacturing facilities, distribution centers and administrative offices focus on safety, so that anyone working in or visiting one of our locations feels and remains safe from injury. Our global Recordable Incident Rate of 0.22 in 2023 was significantly lower than the Occupational Safety and Health Administration manufacturing industry average of 3.2 in 2022 (the most recent available industry average).
Diversity, Equity & Inclusion
Our diversity, equity and inclusion ("DEI") efforts are intended to foster an environment where employees can grow and be increasingly productive and innovative, enhancing our reputation as a great place to work and allowing us to attract and retain talent for the benefit of our stakeholders. These efforts continue to gain momentum and create impact. In 2023, we significantly increased the number of questions we asked around DEI in our annual employee engagement survey. By aligning to external best practice questions, we can more deeply understand our DEI progress and opportunities. Our DEI global strategic pillars of focus continue to be: increasing the number of women who hold leadership positions; enhancing the experience of our manufacturing employees; increasing representation and inclusion for underrepresented groups, with priority populations and actions established regionally; and making merit and transparency even more foundational to our employee experience. During 2023, we continued conducting listening sessions to better understand both our strengths and areas of opportunity, and have deployed programmatic strategies such as leadership development programming; sponsorship and mentorship programs; connection events to build a culture of inclusion for our manufacturing employees across the globe; and talent analytics and pipeline modeling to further advance inclusion. Additionally, our Regional DEI Councils and Employee Resource Groups ("ERGs") continue to be integral in advancing our DEI strategy. ERGs, which are open to all employees, bring team members who have shared interests, providing them a means to collectively amplify their voices.
Manufacturing and Environmental Matters
We use various raw materials – primarily paper, plastic films and resins, as well as specialty chemicals purchased from various commercial and industrial sources – that are subject to price fluctuations. Although shortages can occur from time to time, these raw materials are generally available.
We produce a majority of our self-adhesive materials using water-based emulsion and hot-melt adhesive technologies. A portion of our manufacturing process for self-adhesive materials utilizes organic solvents, which, unless controlled, could be emitted into the atmosphere or contaminate soil or groundwater. Emissions from these operations contain small amounts of volatile organic compounds, which are regulated by federal, state, local and foreign governments. We continue to evaluate the use of alternative materials and technologies to minimize these emissions. In connection with the maintenance and acquisition of certain manufacturing equipment, we invest in solvent capture and control units to assist in regulating these emissions.
We have developed adhesives and adhesive processing systems that minimize the use of solvents. Emulsion adhesives, hot-melt adhesives, and solventless and emulsion silicone systems have been installed in many of our facilities.
Based on current information, we do not believe that the cost of complying with applicable laws regulating the emission or discharge of materials into the environment, or otherwise relating to the protection of the environment, will have a material effect upon our capital expenditures, consolidated financial position, results of operations or competitive position.
For information regarding our potential responsibility for cleanup costs at certain hazardous waste sites, see Note 8, “Contingencies,” in the Notes to Consolidated Financial Statements.
Available Information
Our Annual Reports on Form 10-K, Quarterly Reports on Form 10-Q, Current Reports on Form 8-K and amendments to those reports filed with, or furnished to, the Securities and Exchange Commission (“SEC”) pursuant to Section 13(a) or 15(d) of the Securities Exchange Act of 1934, as amended (the “Exchange Act”), are available free of charge on our investor website at www.investors.averydennison.com as soon as reasonably practicable after they are electronically filed with or furnished to the SEC. This website address is not intended to function as a hyperlink and the information located there is not, nor should it be considered, part of this report or incorporated by reference into this report. We also make available on the investors section of our website under Corporate Governance – the following documents as currently in effect: (i) Amended and Restated Certificate of Incorporation; (ii) Amended and Restated Bylaws; (iii) Corporate Governance Guidelines; (iv) Code of Conduct, which applies to our directors, officers and employees; (v) Code of Ethics for our Chief Executive Officer and Senior Financial Officers; (vi) charters of the Audit, Talent and Compensation, Governance and Finance Committees of our Board of Directors; and (vii) Audit Committee Complaint Procedures for Accounting and Auditing Matters. These documents are also available free of charge upon written request to our Corporate Secretary, Avery Dennison Corporation, 8080 Norton Parkway, Mentor, Ohio 44060.
Reports filed with or furnished to the SEC may be viewed at www.sec.gov.
Item 1A. RISK FACTORS
The risk factors described in this section could materially adversely affect our business, including our results of operations, cash flows and financial condition, and cause the value of our securities to decline. This list of risks is not exhaustive. Our ability to attain our goals and objectives is dependent on numerous factors and risks, including, but not limited to, the most significant ones described in this section.
Risk Related to Our International Operations
The demand for our products is impacted by the effects of, and changes in, worldwide economic, social, political and market conditions, which have had in the past and could in the future have a material adverse effect on our business.
We have operations in more than 50 countries and our domestic and international operations are strongly influenced by matters beyond our control, including changes in political, social, economic and labor conditions (including governmental shutdowns), tax laws (including U.S. taxes on foreign earnings), and international trade regulations (including tariffs), as well as the impact these changes have on demand for our products. In 2023, approximately 69% of our net sales were from international operations.
Macroeconomic developments such as impacts from slower growth in geographic regions in which we operate; inflation; raw material, freight and labor availability and cost; energy costs; political, social, supply chain and other disruptions; epidemics, pandemics or other outbreaks of illness, disease or virus; and uncertainty in the global credit or financial markets leading to a loss of consumer confidence could result in a material adverse effect on our business as a result of, among other things, lower consumer spending, reduced asset valuations, diminished liquidity and credit availability, volatility in securities prices, credit rating downgrades and fluctuations in foreign currency exchange rates.
Tensions remain in relations between the U.S. and China. In recent years, the U.S. government imposed or increased tariffs on various products imported into the U.S. from China. This has resulted in reciprocal tariffs on goods imported from the U.S. into China. The impacts on our operations to date have not been significant. However, our business could be significantly impacted if additional tariffs or other restrictions are imposed on products. These actions or other developments in international trade relations could have a material adverse effect on our business.
In addition, business and operational disruptions or delays caused by political, social or economic instability and unrest – such as recent civil, political and economic disturbances in Argentina, Afghanistan, Syria, Iraq, Yemen, Iran, Turkey, North Korea, Hong Kong and Sri Lanka and the related impact on global stability, the Russia-Ukraine war, the Israel-Hamas war, terrorist attacks and the potential for other hostilities or natural disasters in various parts of the world – could contribute to a climate of economic and political uncertainty that could have a material adverse effect on our business. The Russia-Ukraine war that began in February 2022 continued in 2023 and we maintained our position of not shipping products for the Russian market throughout the year. The impact of the continuing war and our exit from our Russia-related business, as well as any further retaliatory actions taken by Russia, the U.S., the European Union and other jurisdictions, is unknown and could have a material adverse effect on our business. In October 2023, the war between Israel and Hamas began. Our sales in Israel in 2022 were less than 1% of our total net sales and have declined since the beginning of the war. We have experienced some disruptions in our operations in Israel and implemented plans to address these disruptions, which included sourcing production from alternative locations while focusing on the continued safety of our Israeli employees and their families. The impact of this war and any related hostilities in the Middle East region or elsewhere is unknown and could have a material adverse effect on our business.
We are not able to predict the duration and severity of adverse economic, social, political or market conditions in the U.S. or other countries.
Foreign currency exchange rates, and fluctuations in those rates, may materially adversely affects our business.
The substantial majority of our net sales in 2023 was in foreign currencies. Fluctuations in currency exchange rates, such as those associated with the Argentine peso and Chinese renminbi which had unfavorable impacts in 2023, may result in a variety of negative effects, including lower net sales, increased costs, lower gross margin percentages, increased allowance for credit losses and/or write-offs of accounts receivable, and required recognition of impairments of capitalized assets, including goodwill and other intangible assets. Foreign currency translation decreased our net sales in 2023 by approximately $58 million compared to the prior year.
We monitor our foreign currency exposures and may use hedging instruments to mitigate transactional exposure to changes in foreign currencies. The effectiveness of our hedges in part depends on our ability to accurately forecast our future cash flows, which is particularly difficult during periods of uncertain demand for our products and services and highly volatile foreign currency exchange rates. Our hedging activities may offset only a portion, or none at all, of the material adverse financial effects of unfavorable movements in foreign currency exchange rates over the limited time the hedges are in place and we may incur significant losses from these activities.
Our strategy includes increased growth in emerging markets, including China, which creates greater exposure to unstable political conditions, civil unrest, economic volatility, contagious disease and other risks applicable to international operations.
A significant amount of our net sales – approximately 40% in 2023 – originated in emerging markets, which includes countries in Asia Pacific, Latin America, Eastern Europe and Middle East/Northern Africa. The profitable growth of our business in emerging markets is a significant focus of our long-term growth strategy and our regional results have and can fluctuate significantly based on their economic conditions. Our business operations have been and may continue to be adversely affected by the current and future political environment in China, including as a result of its response to tariffs imposed by the U.S. government on goods imported from China, tariffs imposed by China on U.S. goods, the increasing use of economic sanctions and export control restrictions, any trade agreements entered into between the U.S. and China, and tensions related to Hong Kong and Taiwan. Our ability to operate in China or other emerging markets has been and may continue to be adversely affected by changes in the laws and regulations of these jurisdictions or their interpretation thereof, including those relating to taxation, import and export tariffs, raw materials, environmental regulations, land use rights, property, foreign currency conversion, the regulation of private enterprises and other matters.
Epidemics, pandemics or other outbreaks of illness, disease or virus and other adverse developments in emerging markets materially adversely affected our business at various times during the 2020-2023 period. There have been and could be further disruptions in our supply chain or ability to manufacture our products, as well as temporary closures of our facilities or those of our suppliers or customers, which have impacted and could in the future impact our sales and operating results.
If we are unable to successfully expand our business in emerging markets or achieve the return on capital we expect from our in
Showing the first 8K of 66K characters. Open the full section
Item 1B. UNRESOLVED STAFF COMMENTS
None.
Item 1C. CYBERSECURITY
Cybersecurity Risk Management and Strategy
Our cybersecurity risk management ("CSRM") program, which is designed to protect the confidentiality, integrity and availability of our critical systems and information, includes a comprehensive cybersecurity incident response plan.
We design and assess our program based on the ISO 27000 and the National Institute of Standards and Technology (NIST) SP-800 and Cybersecurity Framework ("CSF"). We use these frameworks to help us identify, assess and manage cybersecurity risks relevant to our business. It is not intended to suggest that we meet any particular technical standards, specifications or requirements.
Our CSRM program complements our overall enterprise risk management program, using similar methodologies and governance processes to identify risks and mitigating strategies.
Our CSRM program includes risk assessments designed to help identify potentially material cybersecurity risks to our critical systems, information, products and services, as well as our broader enterprise IT environment; an IT security team principally responsible for managing our cybersecurity risk assessment processes, security controls and response to any cybersecurity events; the use of third party experts and service providers, where appropriate, to assess, test and otherwise assist with protecting our security environment; cybersecurity awareness training for our employees and further training for our incident response personnel and senior management; a cybersecurity incident response plan that includes procedures for assessing and coordinating our response to cybersecurity events; and a third-party risk management process for service providers, suppliers and vendors.
We have not experienced cybersecurity events that have materially affected our operations, results of operations, or financial condition. However, we face certain ongoing risks from cybersecurity threats that, if realized, would be reasonably likely to materially affect us, including our operations, results of operations, or financial condition.
Risks and uncertainties related to cybersecurity are discussed in greater detail under “Risks Related to Information Technology” in Item 1A of this report.
Cybersecurity Governance
Our Board of Directors (our “Board”) considers cybersecurity risk as part of its risk oversight function and has delegated to the Audit Committee primary responsibility for overseeing our CSRM program and engaging with management on cybersecurity and other risks related to our IT controls and security at least twice per year. Management updates the Audit Committee, if and as needed, regarding any significant cybersecurity events, as well as events that may have had lesser potential impact.
In addition to reports from its Chair on the Audit Committee's discussions on cybersecurity, our Board members receive periodic presentations on cybersecurity topics from our Chief Information Officer and our Information Security Officer ("ISO") as part of their continuing education on risks impacting public companies.
Our cybersecurity leadership team ("CSLT"), which includes leaders accountable for security operations, incident response, risk and compliance, data security, application security, digital solutions security, vulnerability management and operational technology security, is responsible for assessing and managing our risks from cybersecurity threats. The team has primary responsibility for our overall CSRM program and supervises both our internal cybersecurity personnel and our external cybersecurity consultants. Information security personnel maintain a variety of technical and managerial security certifications and have broad security experience in manufacturing, finance, software and IT environments.
The CSLT supervises our efforts to prevent, detect, mitigate and remediate cybersecurity risks and incidents through a variety of means, which may include briefings from internal security personnel; threat intelligence and other information obtained from governmental, public or private sources, including external consultants; and reports from cybersecurity systems deployed in our IT environment.
Item 2. PROPERTIES
As of December 30, 2023, we operated manufacturing facilities in excess of 100,000 square feet in the reportable segments and locations listed below.
Materials Group
| U.S. | Peachtree City, Georgia; Fort Wayne, Greenfield, and Lowell, Indiana; Fairport Harbor, Mentor, Oak Harbor, and Painesville, Ohio; Mill Hall, Pennsylvania | ||||
| Non-U.S. | Soignies and Turnhout, Belgium; Vinhedo, Brazil; Guangzhou, Kunshan, and Zhuozhou, China; Champ-sur-Drac, France; Gotha, Germany; Pune and Noida, India; Longford, Ireland; Kibbutz Hanita, Israel; Rodange, Luxembourg; Bangi, Malaysia; Queretaro, Mexico; Rayong, Thailand; and Cramlington, United Kingdom |
Solutions Group
| U.S. | New Century, Kansas and Miamisburg, Ohio | ||||
| Non-U.S. | Dhaka, Bangladesh; Guangzhou, Nansha, Panyu, and Suzhou, China; Bufalo, Honduras; Ancarano, Italy; Kulim, Malaysia; and Long An Province, Vietnam |
In addition to the manufacturing facilities described above, our other principal facilities include our corporate headquarters and divisional office in Mentor, Ohio and our divisional and corporate offices located in Dallas, Texas; Vinhedo, Brazil; Hong Kong and Kunshan, China; and Oegstgeest, the Netherlands.
We own all of the principal properties identified above, except for the facilities in the following locations, which are leased: Hong Kong, Panyu and Zhuozhou, China; Bufalo, Honduras; Kibbutz Hanita, Israel; New Century, Kansas; Mentor, Ohio; and Oegstgeest, the Netherlands.
We consider all our properties, whether owned or leased, suitable and adequate for our current needs. We generally expand production capacity as needed to meet increased demand. Owned buildings and plant equipment are insured against major losses from fire and other usual business risks, subject to applicable deductibles. We are not aware of any material defects in title to, or significant encumbrances on, our properties, except for certain mortgage liens.
Item 3. LEGAL PROCEEDINGS
See Note 8, “Contingencies,” in the Notes to Consolidated Financial Statements.
Item 4. MINE SAFETY DISCLOSURES
Item 5. MARKET FOR REGISTRANT’S COMMON EQUITY, RELATED STOCKHOLDER MATTERS AND ISSUER PURCHASES OF EQUITY SECURITIES
(a)Our common stock is listed under the ticker symbol “AVY” on the New York Stock Exchange. We did not sell securities in any unregistered transactions during fiscal year 2023. We have historically paid quarterly cash dividends. Future dividend payments are subject to the approval by our Board of Directors based on our earnings, capital requirements, financial condition and other factors.
We had 3,600 shareholders of record as of December 30, 2023, the last day of our 2023 fiscal year.
Stockholder Return Performance
The graph below compares the cumulative stockholder return on our common stock, including reinvestment of dividends, with the return on the S&P 500 Stock Index, S&P 500 Industrials Index and Dow Jones U.S. Container & Packaging Index, in each case for the five-year period ending December 31, 2023. In 2023, we disaggregated our market basket used in previous years into the S&P 500 Industrials Index and the Dow Jones U.S. Container & Packaging Index, of which we are a member. We believe this presentation provides greater clarity on our relative performance, reflecting it in a manner more consistent with the methodology used by peer companies.
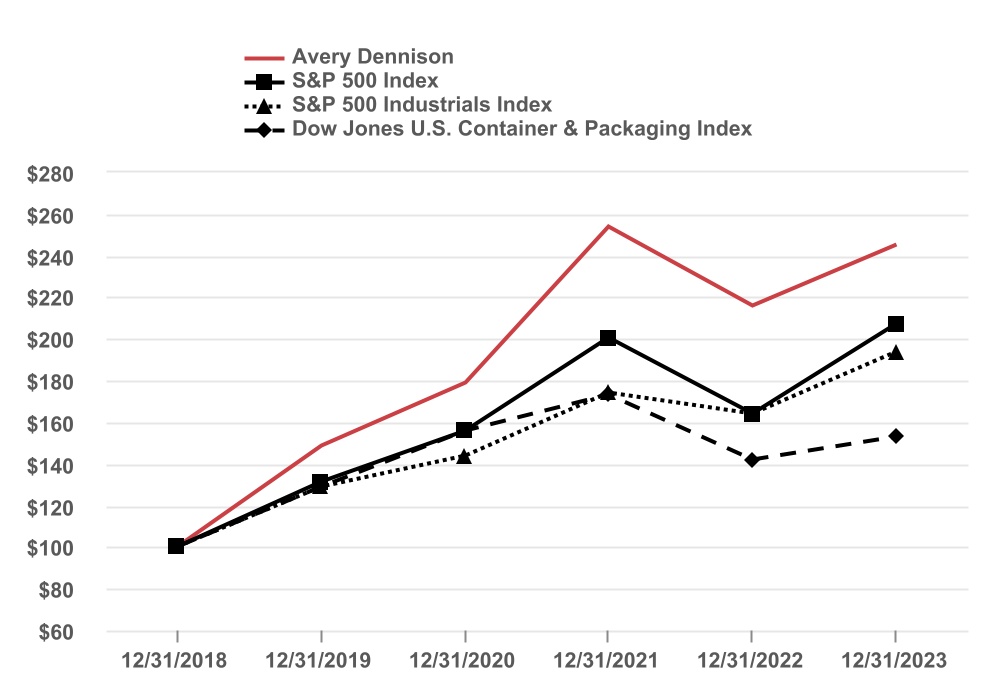
Total Return Analysis**(1)**
| 12/31/2018 | 12/31/2019 | 12/31/2020 | 12/31/2021 | 12/31/2022 | 12/31/2023 | |||||||||||||||
| Avery Dennison | $ | 100 | $ | 149 | $ | 179 | $ | 254 | $ | 216 | $ | 245 | ||||||||
| S&P 500 Index | 100 | 131 | 156 | 200 | 164 | 207 | ||||||||||||||
| S&P 500 Industrials Index | 100 | 129 | 144 | 174 | 164 | 194 | ||||||||||||||
| Dow Jones U.S. Container & Packaging Index | 100 | 129 | 156 | 173 | 142 | 153 |
(1)Assumes $100 invested on December 31, 2018 and reinvestment of dividends.
(b)Not applicable.
(c)Repurchases of Equity Securities by Issuer
Repurchases by us or our “affiliated purchasers” (as defined in Rule 10b-18(a)(3) of the Exchange Act) of registered equity securities in the fourth quarter of 2023 are shown in the table below. Repurchased shares may be reissued under our long-term incentive plan or used for other corporate purposes.
| Period**(1)** | Total number of shares purchased**(2)** | Average price paid per share**(3)** | Total number of shares purchased as part of publicly announced plans**(2)(4)** | Approximate dollar value of shares that may yet be purchased under the plans**(5)** | ||||||||||||||||||||||
| October 1, 2023 – October 28, 2023 | 59.1 | $ | 178.5 | 59.1 | $ | 602.6 | ||||||||||||||||||||
| October 29, 2023 – November 25, 2023 | 55.7 | 176.2 | 55.7 | 592.8 | ||||||||||||||||||||||
| November 26, 2023 – December 30, 2023 | — | — | — | 592.8 | ||||||||||||||||||||||
| Total | 114.8 | $ | 177.5 | 114.8 | $ | 592.8 |
(1)The periods shown are our fiscal months during the thirteen-week quarter ended December 30, 2023.
(2)Shares in thousands.
(3)Average price paid per share includes transaction costs to acquire the shares and excludes the non-deductible 1% excise tax on the net value of repurchases imposed under the Inflation Reduction Act of 2022.
(4)In April 2022, our Board authorized the repurchase of shares of our common stock with a fair market value of up to $750 million, excluding any fees, commissions or other expenses related to such purchases, in addition to the amount outstanding under our previous Board authorization. Board authorizations remain in effect until shares in the amount authorized thereunder have been repurchased..
(5)Dollars in millions.
Item 6. RESERVED
Item 7. MANAGEMENT’S DISCUSSION AND ANALYSIS OF FINANCIAL CONDITION AND RESULTS OF OPERATIONS
ORGANIZATION OF INFORMATION
Management’s Discussion and Analysis of Financial Condition and Results of Operations, or MD&A, provides management’s views on our financial condition and results of operations, should be read in conjunction with the Consolidated Financial Statements and related notes thereto, and includes the sections shown below.
NON-GAAP FINANCIAL MEASURES
We report our financial results in conformity with accounting principles generally accepted in the United States of America, or GAAP, and also communicate with investors using certain non-GAAP financial measures. These non-GAAP financial measures are not in accordance with, nor are they a substitute for or superior to, the comparable GAAP financial measures. These non-GAAP financial measures are intended to supplement the presentation of our financial results prepared in accordance with GAAP. We use these non-GAAP financial measures internally to evaluate trends in our underlying performance, as well as to facilitate comparison to the results of competitors for quarters and year-to-date periods, as applicable. Based on feedback from investors and financial analysts, we believe that the supplemental non-GAAP financial measures we provide are also useful to their assessments of our performance and operating trends, as well as liquidity. Reconciliations are provided in accordance with Regulation G and S-K and reconcile our non-GAAP financial measures with the most directly comparable GAAP financial measures.
Our non-GAAP financial measures exclude the impact of certain events, activities or strategic decisions. The accounting effects of these events, activities or decisions, which are included in the GAAP financial measures, may make it more difficult to assess our underlying performance in a single period. By excluding the accounting effects, positive or negative, of certain items (e.g., restructuring charges, outcomes of certain legal proceedings, certain effects of strategic transactions and related costs, losses from debt extinguishments, gains or losses from curtailment or settlement of pension obligations, gains or losses on sales of certain assets, gains or losses on venture investments, currency adjustments due to highly inflationary economies, and other items), we believe that we are providing meaningful supplemental information that facilitates an understanding of our core operating results and liquidity measures. While some of the items we exclude from GAAP financial measures recur, they tend to be disparate in amount, frequency or timing.
We use the non-GAAP financial measures defined below in this MD&A.
-
Sales change ex. currency refers to the increase or decrease in net sales, excluding the estimated impact of foreign currency translation, the reclassification of sales between segments; where applicable, an extra week in our fiscal year; the calendar shift resulting from the extra week in the prior fiscal year; and currency adjustment for transitional reporting of highly inflationary economies. The estimated impact of foreign currency translation is calculated on a constant currency basis, with prior-period results translated at current period average exchange rates to exclude the effect of foreign currency fluctuations.
-
Organic sales change refers to sales change ex. currency, excluding the estimated impact of acquisitions and product line divestitures.
We believe that sales change ex. currency and organic sales change assist investors in evaluating the sales change from the ongoing activities of our businesses and enhance their ability to evaluate our results from period to period.
-
Adjusted free cash flow refers to cash flow provided by operating activities, less payments for property, plant and equipment, software and other deferred charges, plus proceeds from company-owned life insurance policies, plus proceeds from sales of property, plant and equipment, plus (minus) net proceeds from insurance and sales (purchases) of investments. Where applicable, adjusted free cash flow is also adjusted for certain acquisition-related transaction costs. We believe that adjusted free cash flow assists investors by showing the amount of cash we have available for debt reductions, dividends, share repurchases, and acquisitions.
-
Operational working capital as a percentage of annualized current quarter net sales refers to trade accounts receivable and inventories, net of accounts payable, and excludes cash and cash equivalents, short-term borrowings, deferred taxes, other current assets and other current liabilities, as well as net current assets or liabilities held-for-sale divided by annualized current quarter net sales. We believe that operational working
capital as a percentage of annualized current quarter net sales assists investors in assessing our working capital requirements because it excludes the impact of fluctuations attributable to our financing and other activities (which affect cash and cash equivalents, deferred taxes, other current assets and other current liabilities) that tend to be disparate in amount, frequency or timing, and may increase the volatility of working capital as a percentage of sales from period to period. The items excluded from this measure are not significantly influenced by our day-to-day activities managed at the operating level and do not necessarily reflect the underlying trends in our operations.
OVERVIEW AND OUTLOOK
Fiscal Year
Our fiscal years generally consist of 52 weeks, but every fifth or sixth fiscal year consists of 53 weeks; our 2023, 2022, and 2021 fiscal years consisted of 52-week periods ending December 30, 2023, December 31, 2022 and January 1, 2022, respectively.
Net Sales
The factors impacting reported net sales change, as compared to the prior-year period, are shown in the table below.
| 2023 | 2022 | |||||||||||||
| Reported net sales change | (8) | % | 8 | % | ||||||||||
| Foreign currency translation | 1 | 6 | ||||||||||||
| Sales change ex. currency(1) | (7) | % | 13 | % | ||||||||||
| Acquisitions | (1) | (4) | ||||||||||||
| Organic sales change(1) | (8) | % | 10 | % |
(1) Totals may not sum due to rounding.
In 2023, net sales decreased on an organic basis primarily due to lower volume, partially offset by the impact of pricing actions. In 2022, net sales increased on an organic basis primarily due to pricing actions, partially offset by lower volume/mix.
Net Income
Net income decreased from approximately $757 million in 2022 to approximately $503 million in 2023. The major factors affecting this decrease
Showing the first 8K of 73K characters. Open the full section
Item 7A. QUANTITATIVE AND QUALITATIVE DISCLOSURES ABOUT MARKET RISK
Risk Management
We are exposed to the impact of changes in foreign currency exchange rates and interest rates. We generally do not purchase or hold foreign currency or interest rate or commodity contracts for trading purposes.
Our objective in managing our exposure to foreign currency changes is to reduce the risk to our earnings and cash flow associated with foreign exchange rate changes. As a result, we enter into foreign exchange forward, option and swap contracts to reduce risks associated with the value of our existing foreign currency assets, liabilities, firm commitments and anticipated foreign revenues and costs, when available and appropriate. The gains and losses on these contracts are intended to offset changes in the related exposures. We do not hedge our foreign currency translation exposure in a manner that would entirely eliminate the effects of changes in foreign exchange rates on our net income.
Our objective in managing our exposure to interest rate changes is to reduce the impact of interest rate changes on earnings and cash flows. To achieve this objective, we may periodically use interest rate contracts to manage our exposure to interest rate changes.
Additionally, we enter into certain natural gas futures contracts to reduce the risks associated with natural gas we anticipate using in our manufacturing operations. These amounts are not material to our financial statements.
In the normal course of operations, we also face other risks that are either non-financial or non-quantifiable. These risks principally include changes in economic or political conditions, other risks associated with international operations, commodity price risk, and legal and compliance risk, which are not reflected in the analyses described below.
Foreign Exchange Value-At-Risk
We use a Value-At-Risk (“VAR”) model to determine the estimated maximum potential one-day loss in earnings associated with our foreign exchange positions and contracts. This approach assumes that market rates or prices for foreign exchange positions and contracts are normally distributed. VAR model estimates are made assuming normal market conditions. The model includes foreign exchange derivative contracts. Forecasted transactions, firm commitments, accounts receivable and accounts payable denominated in foreign currencies, which certain of these instruments are intended to hedge, are excluded from the model.
The VAR model is a risk analysis tool and does not represent actual losses in fair value that we could incur, nor does it consider the potential effect of favorable changes in market factors.
In both 2023 and 2022, the VAR was estimated using a variance-covariance methodology. The currency correlation was based on one-year historical data obtained from one of our domestic banks. A 95% confidence level was used for a one-day time horizon.
The estimated maximum potential one-day loss in earnings for our foreign exchange positions and contracts was not significant at year-end 2023 or 2022.
Interest Rate Sensitivity
In 2023 and 2022, an assumed 41 and 12 basis point, respectively, increase in interest rates affecting our variable-rate borrowings (10% of our weighted average interest rate on floating rate debt) would not have had a significant impact on interest expense.
Item 8. FINANCIAL STATEMENTS AND SUPPLEMENTARY DATA
Report of Independent Registered Public Accounting Firm
To the Board of Directors and Shareholders of Avery Dennison Corporation
Opinions on the Financial Statements and Internal Control over Financial Reporting
We have audited the accompanying consolidated balance sheets of Avery Dennison Corporation and its subsidiaries (the “Company”) as of December 30, 2023 and December 31, 2022, and the related consolidated statements of income, of comprehensive income, of shareholders’ equity and of cash flows for each of the three years in the period ended December 30, 2023, including the related notes (collectively referred to as the “consolidated financial statements”). We also have audited the Company’s internal control over financial reporting as of December 30, 2023, based on criteria established in Internal Control – Integrated Framework (2013) issued by the Committee of Sponsoring Organizations of the Treadway Commission (COSO).
In our opinion, the consolidated financial statements referred to above present fairly, in all material respects, the financial position of the Company as of December 30, 2023 and December 31, 2022, and the results of its operations and its cash flows for each of the three years in the period ended December 30, 2023 in conformity with accounting principles generally accepted in the United States of America. Also in our opinion, the Company maintained, in all material respects, effective internal control over financial reporting as of December 30, 2023, based on criteria established in Internal Control – Integrated Framework (2013) issued by the COSO.
Basis for Opinions
The Company’s management is responsible for these consolidated financial statements, for maintaining effective internal control over financial reporting, and for its assessment of the effectiveness of internal control over financial reporting, included in Management’s Report on Internal Control Over Financial Reporting appearing under Item 9A. Our responsibility is to express opinions on the Company’s consolidated financial statements and on the Company’s internal control over financial reporting based on our audits. We are a public accounting firm registered with the Public Company Accounting Oversight Board (United States) (PCAOB) and are required to be independent with respect to the Company in accordance with the U.S. federal securities laws and the applicable rules and regulations of the Securities and Exchange Commission and the PCAOB.
We conducted our audits in accordance with the standards of the PCAOB. Those standards require that we plan and perform the audits to obtain reasonable assurance about whether the consolidated financial statements are free of material misstatement, whether due to error or fraud, and whether effective internal control over financial reporting was maintained in all material respects.
Our audits of the consolidated financial statements included performing procedures to assess the risks of material misstatement of the consolidated financial statements, whether due to error or fraud, and performing procedures that respond to those risks. Such procedures included examining, on a test basis, evidence regarding the amounts and disclosures in the consolidated financial statements. Our audits also included evaluating the accounting principles used and significant estimates made by management, as well as evaluating the overall presentation of the consolidated financial statements. Our audit of internal control over financial reporting included obtaining an understanding of internal control over financial reporting, assessing the risk that a material weakness exists, and testing and evaluating the design and operating effectiveness of internal control based on the assessed risk. Our audits also included performing such other procedures as we considered necessary in the circumstances. We believe that our audits provide a reasonable basis for our opinions.
Definition and Limitations of Internal Control over Financial Reporting
A company’s internal control over financial reporting is a process designed to provide reasonable assurance regarding the reliability of financial reporting and the preparation of financial statements for external purposes in accordance with generally accepted accounting principles. A company’s internal control over financial reporting includes those policies and procedures that (i) pertain to the maintenance of records that, in reasonable detail, accurately and fairly reflect the transactions and dispositions of the assets of the company; (ii) provide reasonable assurance that transactions are recorded as necessary to permit preparation of financial statements in accordance with generally accepted accounting principles, and that receipts and expenditures of the company are being made only in accordance with authorizations of management and directors of the company; and (iii) provide reasonable assurance regarding prevention or timely detection of unauthorized acquisition, use, or disposition of the company’s assets that could have a material effect on the financial statements.
Bec
Showing the first 8K of 192K characters. Open the full section
Item 9. CHANGES IN AND DISAGREEMENTS WITH ACCOUNTANTS ON ACCOUNTING AND FINANCIAL DISCLOSURE
None.
Item 9A. CONTROLS AND PROCEDURES
Disclosure Controls and Procedures. As of the end of the period covered by this report, we carried out an evaluation, under the supervision and with the participation of our management, including our Chief Executive Officer and our Chief Financial Officer, of the effectiveness of the design and operation of our disclosure controls and procedures (as defined in Rule 13a-15(e) and 15d-15(e) of the Exchange Act). Based upon that evaluation, our Chief Executive Officer and Chief Financial Officer concluded that our disclosure controls and procedures were effective in providing reasonable assurance that information is recorded, processed, summarized and reported within the time periods specified in the SEC’s rules and forms, and that such information is accumulated and communicated to our management, including our Chief Executive Officer and our Chief Financial Officer as appropriate, to allow for timely decisions regarding required disclosure.
Management’s Report on Internal Control Over Financial Reporting. We are responsible for establishing and maintaining adequate internal control over financial reporting (as defined in Rule 13a-15(f) and 15d-15(f) of the Exchange Act). Under the supervision and with the participation of our management, including our Chief Executive Officer and our Chief Financial Officer, we conducted an evaluation of the effectiveness of our internal control over financial reporting based upon the framework in Internal Control – Integrated Framework (2013) issued by the Committee of Sponsoring Organizations of the Treadway Commission. Based on that evaluation, our management concluded that our internal control over financial reporting was effective as of December 30, 2023.
The effectiveness of our internal control over financial reporting as of December 30, 2023 has been audited by PricewaterhouseCoopers LLP, an independent registered public accounting firm, as stated in the Report of Independent Registered Public Accounting Firm contained in Item 8 of this report.
Changes in Internal Control over Financial Reporting. There have been no changes in our internal control over financial reporting during the most recent fiscal quarter that have materially affected, or are reasonably likely to materially affect, our internal control over financial reporting.
Item 9B. OTHER INFORMATION
None of our directors or executive officers adopted or terminated a Rule 10b5-1 trading arrangement or a non-Rule 10b5-1 trading arrangement (as defined in Item 408(c) of Regulation S-K) during the fourth quarter of 2023.
Item 9C. DISCLOSURE REGARDING FOREIGN JURISDICTIONS THAT PREVENT INSPECTIONS
Item 10. DIRECTORS, EXECUTIVE OFFICERS AND CORPORATE GOVERNANCE
The information concerning directors and corporate governance required by this Item is incorporated herein by reference from the definitive proxy statement for our Annual Meeting of Stockholders to be held on April 25, 2024 (our “2024 Proxy Statement”), which will be filed with the SEC pursuant to Regulation 14A within 120 days of the end of the fiscal year covered by this report. The information concerning executive officers required by this Item appears, in part, as referenced below. If applicable, information concerning any late filings under Section 16(a) of the Exchange Act is incorporated by reference from our 2024 Proxy Statement.
The information required by this Item concerning our Audit Committee is incorporated by reference from our 2024 Proxy Statement.
INFORMATION ABOUT OUR EXECUTIVE OFFICERS**(1)**
| Name and Position | Age | Executive Officer Since | Former Positions within Past Five Years/ Officer Positions with Avery Dennison | |||||||||||||||||||||||
| Deon M. Stander President and Chief Executive Officer | 55 | August 2016 | 2022-2023 | President and Chief Operating Officer | ||||||||||||||||||||||
| 2015-2022 | Vice President and General Manager, RBIS | |||||||||||||||||||||||||
| 2013-2015 | Vice President and General Manager, Global Commercial and Innovation, RBIS | |||||||||||||||||||||||||
| 2010-2012 | Vice President and General Manager, Global Commercial, RBIS | |||||||||||||||||||||||||
| Mitchell R. Butier Executive Chairman | 52 | March 2007 | 2022-2023 | Chairman and Chief Executive Officer | ||||||||||||||||||||||
| 2019-2022 | Chairman, President and Chief Executive Officer | |||||||||||||||||||||||||
| 2016-2019 | President and Chief Executive Officer | |||||||||||||||||||||||||
| 2015-2016 | President and Chief Operating Officer | |||||||||||||||||||||||||
| 2014-2015 | President, Chief Operating Officer and Chief Financial Officer | |||||||||||||||||||||||||
| 2010-2014 | Senior Vice President and Chief Financial Officer | |||||||||||||||||||||||||
| 2007-2010 | Vice President, Global Finance and Chief Accounting Officer | |||||||||||||||||||||||||
| Gregory S. Lovins Senior Vice President and Chief Financial Officer | 51 | March 2017 | 2017 | Vice President and Interim Chief Financial Officer | ||||||||||||||||||||||
| 2016-2017 | Vice President and Treasurer | |||||||||||||||||||||||||
| 2011-2016 | Vice President, Global Finance, Materials Group | |||||||||||||||||||||||||
| Deena Baker-Nel Senior Vice President and Chief Human Resources Officer | 53 | September 2020 | 2020-2022 | Vice President and Chief Human Resources Officer | ||||||||||||||||||||||
| 2018-2020 | Vice President, Human Resources, LGM | |||||||||||||||||||||||||
| 2015-2018 | Vice President, Human Resources, RBIS | |||||||||||||||||||||||||
| Nicholas R. Colisto Senior Vice President and Chief Information Officer | 57 | September 2020 | 2018-2022 | Vice President and Chief Information Officer | ||||||||||||||||||||||
| 2012-2018 | Senior Vice President and Chief Information Officer, Xylem Inc. | |||||||||||||||||||||||||
| Francisco Melo President, Solutions Group | 50 | April 2023 | 2022-2023 | Senior Vice President and General Manager, Avery Dennison Smartrac | ||||||||||||||||||||||
| 2013-2022 | Vice President and General Manager, Avery Dennison Smartrac | |||||||||||||||||||||||||
| 2012-2013 | Vice President Global Inventory Accuracy and Loss Prevention, Information Solutions Market Development | |||||||||||||||||||||||||
| Divina F. Santiago Vice President, Controller | 54 | September 2023 | 2022-2023 | Vice President Finance | ||||||||||||||||||||||
| 2008-2022 | Senior Director, Finance | |||||||||||||||||||||||||
| Ignacio J. Walker Senior Vice President and Chief Legal Officer | 47 | September 2020 | 2020-2022 | Vice President and Chief Legal Officer | ||||||||||||||||||||||
| 2020 | Vice President and Assistant General Counsel, Americas | |||||||||||||||||||||||||
| 2018-2019 | Vice President and Assistant General Counsel | |||||||||||||||||||||||||
| 2013-2017 | Vice President and Assistant General Counsel, RBIS |
(1)Executive officers are generally elected on the date of our annual stockholder meeting to serve a one-year term and until their successors are duly elected and qualified.
Item 11. EXECUTIVE COMPENSATION
The information required by this Item is incorporated by reference from our 2024 Proxy Statement.
Item 12. SECURITY OWNERSHIP OF CERTAIN BENEFICIAL OWNERS AND MANAGEMENT AND RELATED STOCKHOLDER MATTERS
The information required by this Item is incorporated by reference from our 2024 Proxy Statement.
Item 13. CERTAIN RELATIONSHIPS AND RELATED TRANSACTIONS, AND DIRECTOR INDEPENDENCE
The information required by this Item is incorporated by reference from our 2024 Proxy Statement.
Item 14. PRINCIPAL ACCOUNTANT FEES AND SERVICES
The information required by this Item is incorporated by reference from our 2024 Proxy Statement.
PART IV
Item 15. EXHIBIT AND FINANCIAL STATEMENT SCHEDULES
(a)Financial Statements, Financial Statement Schedule and Exhibits
(1)Financial statements filed as part of this report are listed on the accompanying Index to Financial Statements.
(2) All financial statement schedules are omitted since the required information is not present or is not present in amounts sufficient to require submission of the schedule, or because the information required is included in the consolidated financial statements and notes thereto.
(3)Exhibits filed as a part of this report are listed on the accompanying Exhibit Index. Each management contract or compensatory plan or arrangement required to be filed as an exhibit to this Form 10-K is identified as such on the Exhibit Index.
(b)The exhibits required to be filed by Item 601 of Regulation S-K are set forth on the accompanying Exhibit Index.
AVERY DENNISON CORPORATION
EXHIBIT INDEX
For the Year Ended December 30, 2023
| Exhibit No. | Exhibit Name | Originally Filed as Exhibit No. | Filing**(1)** | |||||||||||||||||
| 2.1 | Agreement and Plan of Merger, dated as of July 27, 2021, by and among Registrant, CB Velocity Holdings, LLC, Lobo Merger Sub, LLC and Charlesbank Equity Fund VIII, Limited Partnership, as unitholder representative | 2.1 | Current Report on Form 8-K, filed July 30, 2021 | |||||||||||||||||
| 3.1(i) | Amended and Restated Certificate of Incorporation, as filed on April 28, 2011 with the Office of Delaware Secretary of State | 3.1 | Current Report on Form 8-K, filed April 29, 2011 | |||||||||||||||||
| 3.1(ii) | Amended and Restated Bylaws, effective as of February 23, 2023 | 3.1 | Current Report on Form 8-K, filed February 27, 2023 | |||||||||||||||||
| 4.1 | Indenture, dated as of March 15, 1991, between Registrant and Security Pacific National Bank, as Trustee (the “1991 Indenture”) | 4.1 | Registration Statement on Form S-3 (File No. 33-39491), filed March 19, 1991 | |||||||||||||||||
| 4.2 | First Supplemental Indenture, dated as of March 16, 1993, between Registrant and BankAmerica National Trust Company, as successor Trustee (the “Supplemental Indenture”) | 4.4 | Registration Statement on Form S-3 (File No. 33-59642), filed March 17, 1993 | |||||||||||||||||
| 4.3 | Officers’ Certificate establishing a series of Securities entitled “Medium-Term Notes, Series C” under the 1991 Indenture, as amended by the Supplemental Indenture | 4.1 | Current Report on Form 8-K, filed May 12, 1995 | |||||||||||||||||
| 4.4 | Indenture, dated as of July 3, 2001, between Registrant and Chase Manhattan Bank and Trust Company, National Association, as trustee (the “2001 Indenture”) | 4.1 | Registration Statement on Form S-3 (File No. 333-64558), filed July 3, 2001 | |||||||||||||||||
| 4.5 | Officers’ Certificate establishing Securities entitled “6.000% Notes due 2033” under the 2001 Indenture | 4.2 | Current Report on Form 8-K, filed January 16, 2003 | |||||||||||||||||
| 4.6 | 6.000% Notes Due 2033 | 4.4 | Current Report on Form 8-K, filed January 16, 2003 |
| Exhibit No. | Exhibit Name | Originally Filed as Exhibit No. | Filing**(1)** | |||||||||||||||||
| 10.4* | Amendment No. 1 to EVDCP | 10.16.1 | 1999 Annual Report on Form 10-K, filed March 30, 2000 | |||||||||||||||||
| 10.5* | Amended and Restated 2005 Directors Variable Deferred Compensation Plan | 10.18.2 | Quarterly Report on Form 10-Q, filed May 10, 2011 | |||||||||||||||||
| 10.6* | Amended and Restated Stock Option and Incentive Plan (“Equity Plan”) | A | 2012 Proxy Statement on Schedule 14A, filed March 9, 2012 | |||||||||||||||||
| 10.7* | First Amendment to Equity Plan | 10.20 | 2014 Annual Report on Form 10-K, filed February 25, 2015 | |||||||||||||||||
| 10.8* | 2017 Incentive Award Plan (“2017 Plan”) | B | 2017 Proxy Statement on Schedule 14A, filed March 10, 2017 | |||||||||||||||||
| 10.9* | Amended and Restated Annual Incentive Plan | 10.1 | Quarterly Report on Form 10-Q, filed May 1, 2020 | |||||||||||||||||
| 10.10* | Complete Restatement and Amendment of Executive Deferred Retirement Plan (“EDRP”) | 10.28 | 1994 Annual Report on Form 10-K, filed March 30, 1995 | |||||||||||||||||
| 10.11* | Amendment No. 1 to EDRP | 10.28.1 | 1999 Annual Report on Form 10-K, filed March 30, 2000 | |||||||||||||||||
| 10.12* | Amendment No. 2 to EDRP | 10.28.2 | 2001 Annual Report on Form 10-K, filed March 4, 2002 | |||||||||||||||||
| 10.13* | 2005 Executive Variable Deferred Retirement Plan, amended and restated | 10.1 | Quarterly Report on Form 10-Q, filed May 7, 2013 | |||||||||||||||||
| 10.14* | Amended and Restated Key Executive Change of Control Severance Plan | 10.4 | Quarterly Report on Form 10-Q, filed May 1, 2020 | |||||||||||||||||
| 10.15* | Amended and Restated Executive Severance Plan | 10.3 | Quarterly Report on Form 10-Q, filed May 1, 2020 | |||||||||||||||||
| 10.16* | Form of Executive Severance Agreement | 10.19 | 2020 Annual Report on Form 10-K, filed February 25, 2021 | |||||||||||||||||
| 10.17* | Amended and Restated Long-Term Incentive Unit Plan (“LTI Unit Plan”) | 10.2 | Quarterly Report on Form 10-Q, filed May 1, 2020 | |||||||||||||||||
| 10.18* | Form of Restricted Stock Unit Agreement under Equity Plan | 10.38 | 2013 Annual Report on Form 10-K, filed February 26, 2014 | |||||||||||||||||
| 10.19* | Form of Performance Unit Agreement under Equity Plan | 10.39 | 2013 Annual Report on Form 10-K, filed February 26, 2014 | |||||||||||||||||
| 10.20* | Form of Market-Leveraged Stock Unit Agreement under Equity Plan | 10.40 | 2013 Annual Report on Form 10-K, filed February 26, 2014 |
| Exhibit No. | Exhibit Name | Originally Filed as Exhibit No. | Filing**(1)** | |||||||||||||||||
| 10.21* | Form of Long-Term Incentive Unit Agreement under LTI Unit Plan | 10.41 | 2013 Annual Report on Form 10-K, filed February 26, 2014 | |||||||||||||||||
| 10.22* | Form of Director Restricted Stock Unit Agreement under 2017 Plan | 10.2 | Quarterly Report on Form 10-Q, filed August 1, 2017 | |||||||||||||||||
| 10.23* | Form of Employee Market-Leveraged Stock Unit Agreement under 2017 Plan | 10.3 | Quarterly Report on Form 10-Q, filed August 1, 2017 | |||||||||||||||||
| 10.24* | Form of Employee Performance Unit Agreement under 2017 Plan | 10.4 | Quarterly Report on Form 10-Q, filed August 1, 2017 | |||||||||||||||||
| 10.25* | Form of Employee Restricted Stock Unit Agreement under 2017 Plan | 10.5 | Quarterly Report on Form 10-Q, filed August 1, 2017 | |||||||||||||||||
| 10.26* | Form of Employee Non-Qualified Stock Option Agreement under 2017 Plan | 10.6 | Quarterly Report on Form 10-Q, filed August 1, 2017 | |||||||||||||||||
| 10.27* | Offer Letter to Mitchell Butier, dated February 25, 2016 | 10.2 | Quarterly Report on Form 10-Q, filed May 3, 2016 | |||||||||||||||||
| 10.28* | Offer Letter to Mitchell Butier, dated May 25, 2023 | 10.1 | Quarterly Report on Form 10-Q, filed August 1, 2023 | |||||||||||||||||
| 10.29* | Offer Letter to Gregory Lovins, dated July 10, 2017 | 10.1 | Quarterly Report on Form 10-Q, filed August 1, 2017 | |||||||||||||||||
| 10.30* | Offer Letter to Deena Baker-Nel, dated August 26, 2020 | 10.1 | Quarterly Report on Form 10-Q, filed May 3, 2022 | |||||||||||||||||
| 10.31* | Offer Letter to Ignacio Walker, dated August 25, 2020 | 10.2 | Quarterly Report on Form 10-Q, filed May 3, 2022 | |||||||||||||||||
| 10.32* | Offer Letter to Deon Stander, dated March 1, 2022 | 10.3 | Quarterly Report on Form 10-Q, filed May 3, 2022 | |||||||||||||||||
| 10.33* | Offer Letter to Deon Stander, dated May 25, 2023 | 10.2 | Quarterly Report on Form 10-Q, filed August 1, 2023 | |||||||||||||||||
| 10.34* | Offer Letter to Hassan Rmaile, dated February 27, 2023 | 10.1 | Quarterly Report on Form 10-Q, filed May 2, 2023 | |||||||||||||||||
| 10.35* | Offer Letter to Francisco Melo, dated February 27, 2023 | 10.2 | Quarterly Report on Form 10-Q, filed May 2, 2023 | |||||||||||||||||
| 21† | List of Subsidiaries | N/A | N/A | |||||||||||||||||
| 23† | Consent of PricewaterhouseCoopers LLP, Independent Registered Public Accounting Firm | N/A | N/A | |||||||||||||||||
| Exhibit No. | Exhibit Name | Originally Filed as Exhibit No. | Filing**(1)** | |||||||||||||||||
| 24† | Power of Attorney (see Signatures – Power of Attorney) | N/A | N/A | |||||||||||||||||
| 31.1† | Certification of Chief Executive Officer pursuant to Section 302 of the Sarbanes-Oxley Act of 2002 | N/A | N/A | |||||||||||||||||
| 31.2† | Certification of Chief Financial Officer pursuant to Section 302 of the Sarbanes-Oxley Act of 2002 | N/A | N/A | |||||||||||||||||
| 32.1†† | Certification of Chief Executive Officer pursuant to Section 906 of the Sarbanes-Oxley Act of 2002 | N/A | N/A | |||||||||||||||||
| 32.2†† | Certification of Chief Financial Officer pursuant to Section 906 of the Sarbanes-Oxley Act of 2002 | N/A | N/A | |||||||||||||||||
| 97† | Policy for Recovery of Erroneously Awarded Compensation | N/A | N/A | |||||||||||||||||
| 101.INS††† | Inline XBRL Instance Filing – the instance document does not appear in the Interactive Data File because its XBRL tags are embedded within the Inline XBRL document | N/A | N/A | |||||||||||||||||
| 101.SCH††† | Inline XBRL Extension Schema Filing | N/A | N/A | |||||||||||||||||
| 101.CAL††† | Inline XBRL Extension Calculation Linkbase Filing | N/A | N/A | |||||||||||||||||
| 101.DEF††† | Inline XBRL Extension Definition Linkbase Filing | N/A | N/A | |||||||||||||||||
| 101.LAB††† | Inline XBRL Extension Label Linkbase Filing | N/A | N/A | |||||||||||||||||
| 101.PRE††† | Inline XBRL Extension Presentation Linkbase Filing | N/A | N/A | |||||||||||||||||
| 104††† | Inline XBRL for the cover page of this Annual Report on Form 10-K, included as part of the Exhibit 101 inline XBRL document set |
| (1) | Unless otherwise noted, the File Number for all filings is File No. 1-7685. | ||||
| * | Management contract or compensatory plan or arrangement required to be filed as an exhibit to this Form 10-K pursuant to Item 15(b) of Form 10-K. | ||||
| † | Filed herewith. | ||||
| †† | This certification is being furnished solely to accompany this report pursuant to 18 U.S.C. 1350, and is not being filed for purposes of Section 18 of the Exchange Act and is not to be incorporated by reference into any filing of the registrant, whether made before or after the date hereof, regardless of any general incorporation language in such filing. | ||||
| ††† | Furnished herewith. Pursuant to Rule 406T of Regulation S-T, the Interactive Data Files on Exhibit 101 hereto are deemed not filed or part of a registration statement or prospectus for purposes of Sections 11 or 12 of the Securities Act, are deemed not filed for purposes of Section 18 of the Exchange Act and otherwise are not subject to liability under those sections. |
Item 16. FORM 10-K SUMMARY
Not applicable.
SIGNATURES
Pursuant to the requirements of Section 13 or 15(d) of the Securities Exchange Act of 1934, the registrant has duly caused this report to be signed on its behalf by the undersigned, thereunto duly authorized.
| AVERY DENNISON CORPORATION | ||||||||
| By: | /s/ Gregory S. Lovins | |||||||
| Gregory S. Lovins | ||||||||
| Senior Vice President and Chief Financial Officer |
Dated: February 21, 2024
POWER OF ATTORNEY
Each person whose signature appears below does hereby constitute and appoint Gregory S. Lovins and Ignacio J. Walker, and each of them, with full power of substitution, his or her true and lawful attorney-in-fact to act for him or her in any and all capacities, to sign this Annual Report on Form 10-K and any or all amendments or supplements thereto, and to file each of the same, with all exhibits thereto, and other documents in connection therewith, with the Securities and Exchange Commission, granting unto said attorneys-in-fact, and each of them, full power and authority to do and perform each and every act and thing requisite and necessary to be done in order to effectuate the same as fully, to all intents and purposes, as he or she could do in person, hereby ratifying and confirming all that said attorneys-in-fact or substitutes, or any of them, may lawfully do or cause to be done by virtue hereof.
Pursuant to the requirements of the Securities Exchange Act of 1934, this report has been signed below by the following persons on behalf of the Registrant and in the capacities and as of the dates indicated.
| Signature | Title | Date | ||||||||||||
| /s/ Deon M. Stander | President, Chief Executive Officer and Director (Principal Executive Officer) | February 21, 2024 | ||||||||||||
| Deon M. Stander | ||||||||||||||
| /s/ Gregory S. Lovins | Senior Vice President and Chief Financial Officer (Principal Financial Officer) | February 21, 2024 | ||||||||||||
| Gregory S. Lovins | ||||||||||||||
| /s/ Divina F. Santiago | Vice President, Controller (Principal Accounting Officer) | February 21, 2024 | ||||||||||||
| Divina F. Santiago | ||||||||||||||
| /s/ Mitchell R. Butier | Executive Chairman | February 21, 2024 | ||||||||||||
| Mitchell R. Butier | ||||||||||||||
| /s/ Bradley A. Alford | Director | February 21, 2024 | ||||||||||||
| Bradley A. Alford | ||||||||||||||
| /s/ Ken C. Hicks | Director | February 21, 2024 | ||||||||||||
| Ken C. Hicks | ||||||||||||||
| /s/ Andres A. Lopez | Director | February 21, 2024 | ||||||||||||
| Andres A. Lopez | ||||||||||||||
| /s/ Francesca Reverberi | Director | February 21, 2024 | ||||||||||||
| Francesca Reverberi | ||||||||||||||
| /s/ Patrick T. Siewert | Director | February 21, 2024 | ||||||||||||
| Patrick T. Siewert | ||||||||||||||
| /s/ Julia A. Stewart | Director | February 21, 2024 | ||||||||||||
| Julia A. Stewart | ||||||||||||||
| /s/ Martha N. Sullivan | Director | February 21, 2024 | ||||||||||||
| Martha N. Sullivan | ||||||||||||||
| /s/ William R. Wagner | Director | February 21, 2024 | ||||||||||||
| William R. Wagner |