 filings.tools
AutoZone 10-K 2019-08-31
Filed 2019-10-28. 22 sections, 321K characters. Original on sec.gov · Markdown · JSON
Cover and table of contents
10-K 1 d771460d10k.htm FORM 10-K
Table of Contents
UNITED STATES
SECURITIES AND EXCHANGE COMMISSION
Washington, D.C. 20549
FORM 10-K
(Mark One)
| ☒ | Annual Report pursuant to section 13 or 15(d) of the Securities Exchange Act of 1934 |
|---|
For the fiscal year ended August 31, 2019.
OR
| ☐ | Transition report pursuant to section 13 or 15(d) of the Securities Exchange Act of 1934 |
|---|
For the transition period from to .
Commission file number 1-10714

AUTOZONE, INC.
(Exact name of registrant as specified in its charter)
| Nevada | 62-1482048 | |
| (State or other jurisdiction of | (I.R.S. Employer Identification No.) | |
| incorporation or organization) | ||
| 123 South Front Street, Memphis, Tennessee | 38103 | |
| (Address of principal executive offices) | (Zip Code) |
Registrant’s telephone number, including area code : (901) 495-6500
Securities registered pursuant to Section 12(b) of the Act:
| Title of Each Class | Trading Symbol(s) | Name of Each Exchange on which Registered | ||
| Common Stock ($0.01 par value) | AZO | New York Stock Exchange |
Securities registered pursuant to Section 12(g) of the Act: None
Indicate by checkmark if the registrant is a well-known seasoned issuer, as defined in Rule 405 of the Securities Act. Yes ☒ No ☐
Indicate by check mark if the registrant is not required to file reports pursuant to Section 13 or Section 15(d) of the Act. Yes ☐ No ☒
Indicate by check mark whether the registrant (1) has filed all reports required to be filed by Section 13 or 15(d) of the Securities Exchange Act of 1934 during the preceding 12 months (or for such shorter periods that the registrant was required to file such reports), and (2) has been subject to such filing requirements for the past 90 days. Yes ☒ No ☐
Indicate by check mark whether the registrant has submitted electronically every Interactive Data File required to be submitted pursuant to Rule 405 of Regulation S-T (§232.405 of this chapter) during the preceding 12 months (or for such shorter period that the registrant was required to submit such files). Yes ☒ No ☐
Indicate by check mark whether the registrant is a large accelerated filer, an accelerated filer, a non-accelerated filer, a smaller reporting company or an emerging growth company. See the definitions of “large accelerated filer,” “accelerated filer,” “smaller reporting company,” and “emerging growth company” in Rule 12b-2 of the Exchange Act.
| Large accelerated filer | ☒ | Accelerated filer | ☐ | |||
| Non-accelerated filer | ☐ | Smaller reporting company | ☐ | |||
| Emerging growth company | ☐ |
If an emerging growth company, indicate by check mark if the registrant has elected not to use the extended transition period for complying with any new or revised financial accounting standards provided pursuant to Section 13(a) of the Exchange Act. ☐
Indicate by check mark whether the registrant is a shell company (as defined in Rule 12b-2 of the Exchange Act). Yes ☐ No ☒
The aggregate market value of the voting and non-voting common equity held by non-affiliates computed by reference to the price at which the common equity was last sold, or the average bid and asked price of such common equity, as of the last business day of the registrant’s most recently completed second fiscal quarter was $21,723,299,587.
The number of shares of Common Stock outstanding as of October 21, 2019, was 23,827,496.
Documents Incorporated By Reference
Portions of the definitive Proxy Statement to be filed within 120 days of August 31, 2019, pursuant to Regulation 14A under the Securities Exchange Act of 1934 for the Annual Meeting of Stockholders to be held December 18, 2019, are incorporated by reference into Part III.
Table of Contents
TABLE OF CONTENTS
Table of Contents
Forward-Looking Statements
Certain statements contained in this annual report constitute forward-looking statements that are subject to the safe harbor provisions of the Private Securities Litigation Reform Act of 1995. Forward-looking statements typically use words such as “believe,” “anticipate,” “should,” “intend,” “plan,” “will,” “expect,” “estimate,” “project,” “positioned,” “strategy,” “seek,” “may,” “could” and similar expressions. These are based on assumptions and assessments made by our management in light of experience and perception of historical trends, current conditions, expected future developments and other factors that we believe to be appropriate. These forward-looking statements are subject to a number of risks and uncertainties, including without limitation: product demand; energy prices; weather; competition; credit market conditions; cash flows; access to available and feasible financing; future stock repurchases; the impact of recessionary conditions; consumer debt levels; changes in laws or regulations; war and the prospect of war, including terrorist activity; inflation; the ability to hire, train and retain qualified employees; construction delays; the compromising of confidentiality, availability or integrity of information, including cyber-attacks; historic growth rate sustainability; downgrade of our credit ratings; damages to our reputation; challenges in international markets; failure or interruption of our information technology systems; origin and raw material costs of suppliers; impact of tariffs; anticipated impact of new accounting standards; and business interruptions. Certain of these risks and uncertainties are discussed in more detail in the “Risk Factors” section contained in Item 1A under Part 1 of this Annual Report on Form 10-K for the year ended August 31, 2019, and these Risk Factors should be read carefully. Forward-looking statements are not guarantees of future performance and actual results, developments and business decisions may differ from those contemplated by such forward-looking statements, and events described above and in the “Risk Factors” could materially and adversely affect our business. Forward-looking statements speak only as of the date made. Except as required by applicable law, we undertake no obligation to update publicly any forward-looking statements, whether as a result of new information, future events or otherwise. Actual results may materially differ from anticipated results.
Table of Contents
PART I
Item 1. Business
Introduction
AutoZone, Inc. (“AutoZone,” the “Company,” “we,” “our” or “us”) is the leading retailer, and a leading distributor, of automotive replacement parts and accessories in the Americas. We began operations in 1979 and at August 31, 2019, operated 5,772 stores in the United States (U.S.), including Puerto Rico and Saint Thomas; 604 stores in Mexico; and 35 stores in Brazil. Each store carries an extensive product line for cars, sport utility vehicles, vans and light trucks, including new and remanufactured automotive hard parts, maintenance items, accessories and non-automotive products. At August 31, 2019, in 4,893 of our domestic stores, we also had a commercial sales program that provides commercial credit and prompt delivery of parts and other products to local, regional and national repair garages, dealers, service stations and public sector accounts. We also have commercial programs in stores in Mexico and Brazil. We also sell the ALLDATA brand automotive diagnostic and repair software through www.alldata.com and www.alldatadiy.com. Additionally, we sell automotive hard parts, maintenance items, accessories and non-automotive products through www.autozone.com, and our commercial customers can make purchases through www.autozonepro.com. Additionally, on www.duralastparts.com we provide product information on our Duralast branded product. We do not derive revenue from automotive repair or installation services.
At August 31, 2019, our stores were in the following locations:
| Store Count | ||||
| Alabama | 116 | |||
| Alaska | 8 | |||
| Arizona | 150 | |||
| Arkansas | 66 | |||
| California | 624 | |||
| Colorado | 91 | |||
| Connecticut | 49 | |||
| Delaware | 16 | |||
| Florida | 362 | |||
| Georgia | 202 | |||
| Hawaii | 11 | |||
| Idaho | 30 | |||
| Illinois | 240 | |||
| Indiana | 156 | |||
| Iowa | 32 | |||
| Kansas | 54 | |||
| Kentucky | 98 | |||
| Louisiana | 126 | |||
| Maine | 14 | |||
| Maryland | 80 | |||
| Massachusetts | 82 | |||
| Michigan | 198 | |||
| Minnesota | 57 | |||
| Mississippi | 95 | |||
| Missouri | 116 | |||
| Montana | 14 | |||
| Nebraska | 23 | |||
| Nevada | 65 | |||
| New Hampshire | 23 | |||
| New Jersey | 108 | |||
| New Mexico | 62 | |||
| New York | 201 |
Table of Contents
| North Carolina | 221 | |||
| North Dakota | 7 | |||
| Ohio | 270 | |||
| Oklahoma | 78 | |||
| Oregon | 48 | |||
| Pennsylvania | 198 | |||
| Puerto Rico | 48 | |||
| Rhode Island | 17 | |||
| Saint Thomas | 1 | |||
| South Carolina | 90 | |||
| South Dakota | 8 | |||
| Tennessee | 166 | |||
| Texas | 630 | |||
| Utah | 61 | |||
| Vermont | 2 | |||
| Virginia | 134 | |||
| Washington | 94 | |||
| Washington, DC | 5 | |||
| West Virginia | 44 | |||
| Wisconsin | 72 | |||
| Wyoming | 9 | |||
| Total Domestic stores | 5,772 | |||
| Mexico | 604 | |||
| Brazil | 35 | |||
| Total stores | 6,411 | |||
Marketing and Merchandising Strategy
We are dedicated to providing customers with superior service and trustworthy advice as well as quality automotive parts and products at a great value in conveniently located, well-designed stores. Key elements of this strategy are:
Customer Service
Customer service is the most important element in our marketing and merchandising strategy, which is based upon consumer marketing research. We emphasize that our AutoZoners (employees) should always put customers first by providing prompt, courteous service and trustworthy advice. Our electronic parts catalog assists in the selection of parts as well as identifying any associated warranties that are offered by us or our vendors. We sell automotive hard parts, maintenance items, accessories and non-automotive parts through www.autozone.com for pick-up in store or to be shipped directly to a customer’s home or business, with next day delivery covering approximately 85% of the U.S. population. Additionally, we offer a smartphone application that provides customers with store locations, driving directions, operating hours, product availability and ability to purchase products.
We also provide specialty tools through our Loan-A-Tool program. Customers can borrow a specialty tool, such as a steering wheel puller, for which a do-it-yourself (“DIY”) customer or a repair shop would have little or no use other than for a single job. AutoZoners also provide free services, including check engine light readings where allowed by law, battery charging, the collection of used oil for recycling and the testing of starters, alternators and batteries.
Table of Contents
Merchandising
The following tables show some of the types of products that we sell by major category of items:
| Failure | Maintenance | Discretionary | ||
| A/C Compressors Batteries & Accessories Bearings Belts & Hoses Calipers Carburetors Chassis Clutches CV Axles Engines Fuel Pumps Fuses Ignition Lighting Mufflers Radiators Starters & Alternators Thermostats Tire Repair Water Pumps | Antifreeze & Windshield Washer Fluid Brake Drums, Rotors, Shoes & Pads Chemicals, including Brake & Power Steering Fluid, Oil & Fuel Additives Oil & Transmission Fluid Oil, Air, Fuel & Transmission Filters Oxygen Sensors Paint & Accessories Refrigerant & Accessories Shock Absorbers & Struts Spark Plugs & Wires Windshield Wipers | Air Fresheners Cell Phone Accessories Drinks & Snacks Floor Mats & Seat Covers Interior & Exterior Accessories Mirrors Performance Products Protectants & Cleaners Sealants & Adhesives Steering Wheel Covers Stereos & Radios Tools Towing Wash & Wax |
We believe that the satisfaction of our customers is often impacted by our ability to provide specific automotive products as requested. Each store carries the same basic products, but we tailor our hard parts inventory to the makes and models of the vehicles in each store’s trade area, and our sales floor products are tailored to the local store’s demographics. Our hub stores (including mega hubs, which carry an even broader assortment) carry a larger assortment of products that are delivered to local satellite stores. We are constantly updating the products we offer to ensure that our inventory matches the products our customers need or desire.
Pricing
We want to be the value leader in our industry, by consistently providing quality merchandise at the right price, backed by a satisfactory warranty and outstanding customer service. For many of our products, we offer multiple value choices in a good/better/best assortment, with appropriate price and quality differences from the “good” products to the “better” and “best” products. A key differentiating component versus our competitors is our exclusive line of in-house brands, which includes AutoZone, Duralast, Duralast Max, Duralast Gold, Duralast Platinum, Duralast ProPower, Duralast GT, Valucraft, SureBilt, ProElite and TruGrade. We believe that our overall value compares favorably to that of our competitors.
Brand Marketing: Advertising and Promotions
We believe that targeted advertising and promotions play important roles in succeeding in today’s environment. We are constantly working to understand our customers’ wants and needs so that we can build long-lasting, loyal relationships. We utilize promotions, advertising and loyalty programs primarily to highlight our great value and the availability of high quality parts. Broadcast and internet media are our primary advertising methods of driving retail traffic to our stores, while we leverage a dedicated sales force and our ProVantage loyalty program to drive commercial sales. In the stores, we utilize in-store signage, in-store circulars, and creative product placement and promotions to help educate customers about products that they need.
Store Design and Visual Merchandising
We design and build stores for high visual impact. The typical store utilizes colorful exterior and interior signage, exposed beams and ductwork and brightly lit interiors. Maintenance products, accessories and non-automotive items are attractively displayed for easy browsing by customers. In-store signage and special displays promote products on floor displays, end caps and shelves.
Table of Contents
Commercial
Our commercial sales program operates in a highly fragmented market, and we are a leading distributor of automotive parts and other products to local, regional and national repair garages, dealers, service stations and public sector accounts in the Americas. As a part of the domestic store program, we offer credit and delivery to our customers, as well as online ordering through www.autozonepro.com. Through our hub stores, we offer a greater range of parts and products desired by professional technicians. We have dedicated sales teams focused on independent repair shops as well as national, regional and public sector commercial accounts.
Store Operations
Store Formats
Substantially all stores are based on standard store formats, resulting in generally consistent appearance, merchandising and product mix. Approximately 85% to 90% of each store’s square footage is selling space. In our satellite stores, approximately 40% to 45% of our space is dedicated to hard parts inventory, while our hub stores and mega hubs have 75% to 85% of their space utilized for hard parts. The hard parts inventory area is generally fronted by counters or pods that run the depth or length of the store, dividing the hard parts area from the remainder of the store. The remaining selling space contains displays of maintenance, accessories and non-automotive items.
We believe that our stores are “destination stores,” generating their own traffic rather than relying on traffic created by adjacent stores. Therefore, we situate most stores on major thoroughfares with easy access and good parking.
Store Personnel and Training
We provide on-the-job training as well as formal training programs, including an annual national sales meeting with related cascading meetings at our distribution centers, regional offices and stores; store meetings on specific sales and product topics; standardized computer-based training to support culture, safety, salesmanship, compliance and product and job knowledge; and several specialist, vendor and third-party programs to support learning and development in areas requiring technical expertise and specific job knowledge. All domestic AutoZoners are encouraged to complete our in-house product knowledge program and Parts Expert certification, which is developed in partnership with our key suppliers. Training is supplemented with frequent store visits by management. Advanced leadership training is an additional area of investment that is used to deepen bench strength and support succession planning.
Store managers, commercial sales managers and managers at various levels across the organization receive financial incentives through performance-based bonuses. In addition, our growth has provided opportunities for the promotion of qualified AutoZoners. We believe these opportunities are important to attract, motivate and retain high quality AutoZoners.
All store support functions are centralized in our store support centers located in Memphis, Tennessee; Monterrey, Mexico; Chihuahua, Mexico and Sao Paulo, Brazil. We believe that this centralization enhances consistent execution of our merchandising and marketing strategies at the store level, while reducing expenses and cost of sales.
Store Automation
All of our stores have Z-net, our proprietary electronic catalog that enables our AutoZoners to efficiently look up the parts that our customers need and to provide complete job solutions, advice and information for customer vehicles. Z-net provides parts information based on the year, make, model and engine type of a vehicle and also tracks inventory availability at the store, at other nearby stores and through special order. The Z-net display screens are placed on the hard parts counter or pods, where both the AutoZoner and customer can view the screen.
Our stores utilize our computerized proprietary Store Management System, which includes bar code scanning and point-of-sale data collection terminals. The Store Management System provides administrative assistance, as well as enhanced merchandising information and improved inventory control. We believe the Store Management System also enhances customer service through faster processing of transactions and simplified warranty and product return procedures.
Table of Contents
Store Development
The following table reflects our location development during the past five fiscal years:
| Fiscal Year | ||||||||||||||||||||
| 2019 | 2018 | 2017 | 2016 | 2015 | ||||||||||||||||
| Locations: | ||||||||||||||||||||
| Beginning | 6,202 | 6,029 | 5,814 | 5,609 | 5,391 | |||||||||||||||
| Acquired(1) | — | — | — | — | 17 | |||||||||||||||
| Sold(2) | — | 26 | — | — | — | |||||||||||||||
| New | 209 | 201 | 215 | 205 | 202 | |||||||||||||||
| Closed | — | 2 | — | — | 1 | |||||||||||||||
| Net new | 209 | 199 | 215 | 205 | 201 | |||||||||||||||
| Relocated | 2 | 7 | 5 | 6 | 5 | |||||||||||||||
| Ending | 6,411 | 6,202 | 6,029 | 5,814 | 5,609 | |||||||||||||||
| (1) | 17 Interamerican Motor Corporation (“IMC”) branches acquired on September 27, 2014. |
|---|
| (2) | 26 IMC branches sold on April 4, 2018. See “Note M – Sale of Assets” for more information. |
|---|
We believe that expansion opportunities exist in markets that we do not currently serve, as well as in markets where we can achieve a larger presence. We undertake substantial research prior to entering new markets. The most important criteria for opening a new store is the projected future profitability and the ability to achieve our required investment hurdle rate. Key factors in selecting new site and market locations for stores include population, demographics, vehicle profile, customer buying trends, commercial businesses, number and strength of competitors’ stores and the cost of real estate. In reviewing the vehicle profile, we also consider the number of vehicles that are seven years old and older, or “our kind of vehicles”; these vehicles are generally no longer under the original manufacturers’ warranties and require more maintenance and repair than newer vehicles. We seek to open new stores in high visibility sites in high traffic locations within or contiguous to existing market areas and attempt to cluster development in markets in a relatively short period of time. In addition to continuing to lease or develop our own locations, we evaluate and may make strategic acquisitions.
Purchasing and Supply Chain
Merchandise is selected and purchased for all stores through our store support centers located in Memphis, Tennessee; Monterrey, Mexico and Sao Paulo, Brazil. Additionally, we have an office in Shanghai, China to support our sourcing efforts in Asia. In fiscal 2019, one class of similar products accounted for approximately 13 percent of our total sales, and one vendor supplied approximately 12 percent of our purchases. No other class of similar products accounted for 10 percent or more of our total sales, and no other individual vendor provided more than 10 percent of our total purchases. We believe that alternative sources of supply exist, at similar costs, for most types of product sold. Most of our merchandise flows through our distribution centers to our stores by our fleet of tractors and trailers or by third-party trucking firms. The distribution centers replenish all stores up to multiple times per week depending on store sales volumes.
We ended fiscal 2019 with 205 total domestic hub stores, which have a larger assortment of products as well as regular replenishment items that can be delivered to a store in its network within 24 hours. Hub stores are generally replenished from distribution centers multiple times per week. Hub stores have increased our ability to distribute products on a timely basis to many of our stores and to expand our product assortment.
As a subset, we ended fiscal 2019 with 35 domestic mega hubs, an increase of 11 since fiscal 2018. Mega hubs work in concert with our hubs to drive customer satisfaction through improved local parts availability and expanded product assortments. A mega hub store carries inventory of 70,000 to 110,000 unique SKUs, approximately twice what a hub store carries. Mega hubs provide coverage to both surrounding stores and other hub stores multiple times a day or on an overnight basis. Currently, we have over 5,500 domestic stores with access to mega hub inventory. A majority of these 5,500 stores currently receive their service on an overnight basis, but as we expand our mega hubs, more of them will receive this service same day and many will receive it multiple times per day.
Table of Contents
Competition
The sale of automotive parts, accessories and maintenance items is highly competitive in many areas, including name recognition, product availability, customer service, store location and price. AutoZone competes in the aftermarket auto parts industry, which includes both the retail DIY and commercial do-it-for-me (“DIFM”) auto parts and products markets.
Our competitors include national, regional and local auto parts chains, independently owned parts stores, online automotive parts stores or marketplaces, wholesale distributors, jobbers, repair shops, car washes and auto dealers, in addition to discount and mass merchandise stores, hardware stores, supermarkets, drugstores, convenience stores, home stores and other retailers that sell aftermarket vehicle parts and supplies, chemicals, accessories, tools and maintenance parts. AutoZone competes on the basis of customer service, including the knowledge and expertise of our AutoZoners; merchandise quality, selection and availability; product warranty; store layouts, location and convenience; price; and the strength of our AutoZone brand name, trademarks and service marks.
Trademarks and Patents
We have registered several service marks and trademarks in the United States Patent and Trademark Office as well as in certain other countries, including our service marks: “AutoZone,” “AutoZone Rewards,” “Get in the Zone,” “Parts Are Just Part of What We Do,” “ProVantage,” “The Best Parts in Auto Parts,” “Zone” and trademarks: “ALLDATA Collision,” “ALLDATA Manage,” “ALLDATA Mobile,” “ALLDATA Repair,” “ALLDATA Tech-Assist,” “AutoZone,” “AutoZone & Design,” “Duralast,” “Duralast Aero Blade,” “Duralast Flex Blade,” “Duralast Gold,” “Duralast Gold Cmax,” “Duralast GT,” “Duralast Platinum,” “Duralast ProPower,” “Duralast ProPower Plus,” “Duralast ProPower Ultra,” “Duralast ProPower AGM,” “Duralast Max,” “Econocraft,” “Loan-A-Tool,” “ProElite,” “ProElite & Design,” “SureBilt,” “TruGrade,” “Valucraft,” “V & Design,” and “Z-net.” We believe that these service marks and trademarks are important components of our marketing and merchandising strategies.
Employees
As of August 31, 2019, we employed approximately 96,000 persons, approximately 58 percent of whom were employed full-time. About 90 percent of our AutoZoners were employed in stores or in direct field supervision, approximately 5 percent in distribution centers and approximately 5 percent in store support and other functions. Included in the above numbers are approximately 10,000 persons employed in our Mexico and Brazil operations.
We have never experienced any material labor disruption and believe that relations with our AutoZoners are good.
Seasonality
Our business is somewhat seasonal in nature, with the highest sales typically occurring in the spring and summer months of February through September, in which average weekly per-store sales historically have been about 10% to 20% higher than in the slower months of December and January. During short periods of time, a store’s sales can be affected by weather conditions. Extremely hot or extremely cold weather may enhance sales by causing parts to fail; thereby increasing sales of seasonal products. Mild or rainy weather tends to soften sales, as parts failure rates are lower in mild weather and elective maintenance is deferred during periods of rainy weather. Over the longer term, the effects of weather balance out, as we have locations throughout the Americas.
AutoZone Websites
AutoZone’s primary website is at www.autozone.com. We make available, free of charge, at www.autozone.com, by clicking “Investor Relations” located at the bottom of the page, our Annual Reports on Form 10-K, Quarterly Reports on Form 10-Q, Current Reports on Form 8-K, proxy statements, registration statements and amendments to those reports filed or furnished pursuant to Section 13(a) or 15(d) of the Securities and Exchange Act of 1934, as amended, as soon as reasonably feasible after we electronically file such material with, or furnish it to, the Securities and Exchange Commission (“the SEC”). Our website and the information contained therein or linked thereto are not intended to be incorporated into this Annual Report on Form 10-K.
Table of Contents
Information about our Executive Officers
The following list describes our executive officers, which are elected by and serve at the discretion of the Board of Directors. The title of each executive officer includes the words “Customer Satisfaction” which reflects our commitment to customer service.
William C. Rhodes, III, 54—Chairman, President and Chief Executive Officer, Customer Satisfaction
William C. Rhodes, III, was named Chairman of AutoZone during fiscal 2007 and has been President, Chief Executive Officer and a director since March 2005. Prior to his appointment as President and Chief Executive Officer, Mr. Rhodes was Executive Vice President – Store Operations and Commercial. Previously, he held several key management positions with the Company. Prior to 1994, Mr. Rhodes was a manager with Ernst & Young LLP. Mr. Rhodes is a member of the Board of Directors for Dollar General Corporation.
William T. Giles, 60—Chief Financial Officer and Executive Vice President – Finance, Information Technology and Store Development, Customer Satisfaction
William T. Giles was named Chief Financial Officer during May 2006. He has also held other responsibilities at various times including Executive Vice President of Finance, Information Technology, ALLDATA and Store Development. From 1991 to May 2006, he held several positions with Linens N’ Things, Inc., most recently as the Executive Vice President and Chief Financial Officer. Prior to 1991, he was with Melville, Inc. and PricewaterhouseCoopers. Mr. Giles is a member of the Board of Directors for Brinker International.
Mark A. Finestone, 58—Executive Vice President – Merchandising, Supply Chain and Marketing, Customer Satisfaction
Mark A. Finestone was named Executive Vice President – Merchandising, Supply Chain and Marketing during October 2015. Previously, he was Senior Vice President – Merchandising and Store Development since 2014, Senior Vice President – Merchandising from 2008 to 2014, and Vice President – Merchandising from 2002 to 2008. Prior to joining AutoZone in 2002, Mr. Finestone worked for May Department Stores for 19 years where he held a variety of leadership roles which included Divisional Vice President, Merchandising. Mr. Finestone also serves as Chairman of the Auto Care Association.
Thomas B. Newbern, 57—Executive Vice President – Store Operations, Commercial, Loss Prevention and ALLDATA, Customer Satisfaction
Thomas B. Newbern was named Executive Vice President – Store Operations, Commercial, Loss Prevention and ALLDATA during February 2017. Prior to that, he was Executive Vice President – Store Operations, Commercial and Loss Prevention since October 2015. Previously, he held the titles Senior Vice President – Store Operations and Loss Prevention from 2014 to 2015, Senior Vice President – Store Operations and Store Development from 2012 to 2014, Senior Vice President – Store Operations from 2007 to 2012 and Vice President – Store Operations from 1998 to 2007. Prior thereto, he served in various capacities within the Company.
Philip B. Daniele, 50—Senior Vice President – Commercial, Customer Satisfaction
Philip B. Daniele was elected Senior Vice President – Commercial during November 2015. Prior to that, he was Vice President – Commercial since 2013 and Vice President – Merchandising from 2008 to 2013. Previously, he was Vice President – Store Operations from 2005 to 2008. From 1993 until 2008, Mr. Daniele served in various capacities within the Company.
Preston B. Frazer, 43—Senior Vice President – Store Operations, Customer Satisfaction
Preston B. Frazer was named Senior Vice President, Store Operations in October 2019. Prior to that he was Vice President, Stores and Store Operations Support since 2018 and Vice President, Loss Prevention from 2015 to 2018. Previously, he was Vice President, Internal Audit from 2010 to 2015. From 2006 to 2010, Mr. Frazer served in various capacities within the Company. Prior to joining AutoZone, Mr. Frazer was a senior manager with KPMG, LLP.
Table of Contents
Ronald B. Griffin, 65—Senior Vice President and Chief Information Officer, Customer Satisfaction
Ronald B. Griffin was elected Senior Vice President and Chief Information Officer during June 2012. Prior to that, he was Senior Vice President, Global Information Technology at Hewlett-Packard Company. During his tenure at Hewlett-Packard Company, he also served as the Chief Information Officer for the Enterprise Business Division. Prior to that, Mr. Griffin was Executive Vice President and Chief Information Officer for Fleming Companies, Inc. He also spent over 12 years with The Home Depot, Inc., with the last eight years in the role of Chief Information Officer. Mr. Griffin also served at Deloitte & Touche LLP and Delta Air Lines, Inc.
William R. Hackney, 54—Senior Vice President – Merchandising, Customer Satisfaction
William R. Hackney was named Senior Vice President, Merchandising in October 2015. His career with AutoZone began in 1983, and he has held several key management roles within the Company, including Vice President – Store Operations Support and Vice President – Merchandising.
Domingo J. Hurtado, 58—Senior Vice President – International, Customer Satisfaction
Domingo José Hurtado Rodríguez was named Senior Vice President, International in September 2018. Prior to that, he was President, AutoZone de México. Mr. Hurtado has served in various capacities within the Company since 2001, which included leading the Company’s expansion into Mexico. Prior to 2001, he held different positions with RadioShack including Director General in Mexico and General Manager in Venezuela.
Mitchell C. Major, 50—Senior Vice President – Supply Chain, Customer Satisfaction
Mitchell C. Major was named Senior Vice President – Supply Chain in November 2018. Previously, he served as Vice President – Commercial Support since September 2016 and prior to that he held the title of President, ALLDATA. Mr. Major joined AutoZone in 2005. Prior to AutoZone, Mr. Major worked for Family Dollar, Inc.
Charlie Pleas, III, 54—Senior Vice President and Controller, Customer Satisfaction
Charlie Pleas, III, was elected Senior Vice President and Controller during 2007. Prior to that, he was Vice President and Controller since 2003. Previously, he was Vice President – Accounting since 2000, and Director of General Accounting since 1996. Prior to joining AutoZone, Mr. Pleas was a Division Controller with Fleming Companies, Inc. where he served in various capacities since 1988. Mr. Pleas is a member of the Board of Directors for Kirkland’s Inc.
Albert Saltiel, 55—Senior Vice President – Marketing and E-Commerce, Customer Satisfaction
Albert Saltiel was named Senior Vice President – Marketing and E-Commerce during October 2014. Previously, he was elected Senior Vice President – Marketing since 2013. Prior to that, he was Chief Marketing Officer and a key member of the leadership team at Navistar International Corporation. Mr. Saltiel has also been with Sony Electronics as General Manager, Marketing, and Ford Motor Company where he held multiple marketing roles.
Richard C. Smith, 55—Senior Vice President – Human Resources, Customer Satisfaction
Richard C. Smith was elected Senior Vice President – Human Resources in December 2015. He has been an AutoZoner since 1985, previously holding the position of Vice President of Stores since 1997. Prior thereto, he served in various capacities within the Company.
Kristen C. Wright, 43—Senior Vice President – General Counsel & Secretary, Customer Satisfaction
Kristen C. Wright was named Senior Vice President – General Counsel & Secretary effective January 2014. She previously held the title of Vice President – Assistant General Counsel & Assistant Secretary since January 2012. Before joining AutoZone, she was a partner with the law firm of Bass, Berry & Sims PLC.
Table of Contents
Item 1A. Risk Factors
Our business is subject to a variety of risks and uncertainties. The risks and uncertainties described below could materially and adversely affect our business, financial condition, operating results, cash flows and stock price. The following information should be read in conjunction with the other information contained in this report and other filings that we make with the SEC. These risks and uncertainties are not the only ones we face. Our business could also be affected by additional factors that are presently unknown to us or that we currently believe to be immaterial to our business.
If demand for our products slows, then our business may be materially adversely affected.
Demand for the products we sell may be affected by a number of factors we cannot control, including:
| • | the number of older vehicles in service. Vehicles seven years old or older are generally no longer under the original vehicle manufacturers’ warranties and tend to need more maintenance and repair than newer vehicles. |
|---|
| • | rising energy prices. Increases in energy prices may cause our customers to defer purchases of certain of our products as they use a higher percentage of their income to pay for gasoline and other energy costs and may drive their vehicles less, resulting in less wear and tear and lower demand for repairs and maintenance. |
|---|
| • | the economy. In periods of declining economic conditions, consumers may reduce their discretionary spending by deferring vehicle maintenance or repair. Additionally, such conditions may affect our customers’ ability to obtain credit. During periods of expansionary economic conditions, more of our DIY customers may pay others to repair and maintain their vehicles instead of working on their own vehicles, or they may purchase new vehicles. |
|---|
| • | the weather. Milder weather conditions may lower the failure rates of automotive parts, while extended periods of rain and winter precipitation may cause our customers to defer maintenance and repair on their vehicles. Extremely hot or cold conditions may enhance demand for our products due to increased failure rates of our customers’ automotive parts. |
|---|
| • | technological advances. Advances in automotive technology, such as electric vehicles, and parts design can result in cars needing maintenance less frequently and parts lasting longer. |
|---|
| • | the number of miles vehicles are driven annually. Higher vehicle mileage increases the need for maintenance and repair. Mileage levels may be affected by gas prices, ride sharing and other factors. |
|---|
| • | the quality of the vehicles manufactured by the original vehicle manufacturers and the length of the warranties or maintenance offered on new vehicles. |
|---|
| • | restrictions on access to telematics and diagnostic tools and repair information imposed by the original vehicle manufacturers or by governmental regulation. These restrictions may cause vehicle owners to rely on dealers to perform maintenance and repairs. |
|---|
These factors could result in a decline in the demand for our products, which could adversely affect our business and overall financial condition.
If we are unable to compete successfully against other businesses that sell the products that we sell, we could lose customers and our sales and profits may decline.
The sale of automotive parts, accessories and maintenance items is highly competitive, and sales volumes are dependent on many factors, including name recognition, product availability, customer service, store location and price. Competitors are opening locations near our existing locations. AutoZone competes as a provider in both the DIY and DIFM auto parts and accessories markets.
Table of Contents
Our competitors include national, regional and local auto parts chains, independently owned parts stores, online automotive parts stores or marketplaces, wholesale distributors, jobbers, repair shops, car washes and auto dealers, in addition to discount and mass merchandise stores, hardware stores, supermarkets, drugstores, convenience stores, home stores, and other retailers that sell aftermarket vehicle parts and supplies, chemicals, accessories, tools and maintenance parts. Although we believe we compete effectively on the basis of customer service, including the knowledge and expertise of our AutoZoners; merchandise quality, selection and availability; product warranty; store layout, location and convenience; price; and the strength of our AutoZone brand name, trademarks and service marks, some of our competitors may gain competitive advantages, such as greater financial and marketing resources allowing them to sell automotive products at lower prices, larger stores with more merchandise, longer operating histories, more frequent customer visits and more effective advertising. Online and multi-channel retailers often focus on delivery services, offering customers faster, guaranteed delivery times and low-price or free shipping. Some online businesses have lower operating costs than we do. In addition, because our business strategy is based on offering superior levels of customer service to complement the products we offer, our cost structure is higher than some of our competitors, which also puts pressure on our margins.
Consumers are embracing shopping online and through mobile commerce applications. With the increasing use of digital tools and social media, and our competitors’ increased focus on optimizing customers’ online experience, our customers are quickly able to compare prices, product assortment and feedback from other customers before purchasing our products either online, in the physical stores or through a combination of both offerings. We believe that we compete effectively on the basis of merchandise availability as a result of investments in inventory available for immediate sale, the development of a robust hub and mega hub distribution network providing efficient access to obtain products required on-demand, options to order products online or by telephone and pick them up in stores and options for special orders directly from our vendors. We also offer hassle-free returns to our customers. In addition, we believe that customers value the personal interaction with a salesperson that is qualified to offer trustworthy advice and provide other free services such as parts testing.
We also utilize promotions, advertising and our loyalty programs to drive customer traffic and compete more effectively, and we must regularly assess and adjust our efforts to address changes in the competitive marketplace. If we are unable to continue to manage readily-available inventory demand and competitive delivery options as well as develop successful competitive strategies, including the maintenance of effective promotions, advertising and loyalty card programs, or if our competitors develop more effective strategies, we could lose customers and our sales and profits may decline.
We may not be able to sustain our historic rate of sales growth.
We have increased our store count in the past five fiscal years, growing from 5,391 stores at August 30, 2014, to 6,411 stores at August 31, 2019, an average store increase per year of 4%. Additionally, we have increased annual revenues in the past five fiscal years from $9.475 billion in fiscal 2014 to $11.864 billion in fiscal 2019, an average increase per year of 5%. Annual revenue growth is driven by the opening of new stores, the development of new commercial programs and increases in same store sales. We open new stores only after evaluating customer buying trends and market demand/needs, all of which could be adversely affected by persistent unemployment, wage cuts, small business failures and microeconomic conditions unique to the automotive industry. Same store sales are impacted both by customer demand levels and by the prices we are able to charge for our products, which can also be negatively impacted by economic pressures. We cannot provide any assurance that we will continue to open stores at historical rates or continue to achieve increases in same store sales.
Consolidation among our competitors may negatively impact our business.
Historically some of our competitors have merged. Consolidation among our competitors could enhance their market share and financial position, provide them with the ability to achieve better purchasing terms and provide more competitive prices to customers for whom we compete, and allow them to utilize merger synergies and cost savings to increase advertising and marketing budgets to more effectively compete for customers. Consolidation by our competitors could also increase their access to local market parts assortment.
Table of Contents
These consolidated competitors could take sales volume away from us in certain markets, could achieve greater market penetration, could cause us to change our pricing with a negative impact on our margins or could cause us to spend more money to maintain customers or seek new customers, all of which could negatively impact our business.
If we cannot profitably increase our market share in the commercial auto parts business, our sales growth may be limited.
Although we are one of the largest sellers of auto parts in the commercial market, we must effectively compete against national and regional auto parts chains, independently owned parts stores, wholesalers and jobbers in order to increase our commercial market share. Although we believe we compete effectively in the commercial market on the basis of customer service, merchandise quality, selection and availability, price, product warranty, distribution locations and the strength of our AutoZone brand name, trademarks and service marks, some automotive aftermarket participants have been in business for substantially longer periods of time than we have, and as a result have developed long-term customer relationships and have large available inventories. If we are unable to profitably develop new commercial customers, our sales growth may be limited.
A downgrade in our credit ratings or a general disruption in the credit markets could make it more difficult for us to access funds, refinance our debt, obtain new funding or issue debt securities.
Our short-term and long-term debt is rated investment grade by the major rating agencies. These investment-grade credit ratings have historically allowed us to take advantage of lower interest rates and other favorable terms on our short-term credit lines, in our senior debt offerings and in the commercial paper markets. To maintain our investment-grade ratings, we are required to meet certain financial performance ratios. A change by the rating agencies in these ratios, an increase in our debt, and/or a decline in our earnings could result in downgrades in our credit ratings. A downgrade in our credit ratings could limit our access to public debt markets, limit the institutions willing to provide credit facilities to us, result in more restrictive financial and other covenants in our public and private debt and would likely significantly increase our overall borrowing costs and adversely affect our earnings.
Moreover, significant deterioration in the financial condition of large financial institutions during the Great Recession resulted in a severe loss of liquidity and availability of credit in global credit markets and in more stringent borrowing terms. During brief time intervals, there was limited liquidity in the commercial paper markets, resulting in an absence of commercial paper buyers and extraordinarily high interest rates. We can provide no assurance that such similar events that occurred during the Great Recession will not occur again in the foreseeable future. Conditions and events in the global credit markets could have a material adverse effect on our access to short-term and long-term debt and the terms and cost of that debt.
Significant changes in macroeconomic and geo-political factors could adversely affect our financial condition and results of operations.
Macroeconomic conditions impact both our customers and our suppliers. Job growth in the U.S. was stagnated and unemployment was at historically high levels during the Great Recession; however, in recent years, the unemployment rate has improved to below pre-recession levels. Moreover, the U.S. government continues to operate under historically large deficits and debt burden. Continued distress in global credit markets, business failures, inflation, foreign exchange rate fluctuations, significant geo-political conflicts, proposed or additional tariffs, continued volatility in energy prices and other factors continue to affect the global economy. Moreover, rising energy prices could impact our merchandise distribution, commercial delivery, utility and product costs. Over the short-term, such factors could positively impact our business. Over a longer period of time, these macroeconomic and geo-political conditions could adversely affect our sales growth, margins and overhead. These could adversely affect our financial condition and operations.
Table of Contents
Our business depends upon hiring, training and retaining qualified employees.
We believe that much of our brand value lies in the quality of the approximately 96,000 AutoZoners employed in our stores, distribution centers, store support centers and ALLDATA. Our workforce costs represent our largest operating expense, and our business is subject to employment laws and regulations, including requirements related to minimum wage and benefits. In addition, the implementation of potential regulatory changes relating to overtime exemptions and benefits for certain employees under federal and state laws could result in increased labor costs to our business and negatively impact our operating results. We cannot be assured that we can continue to hire, train and retain qualified employees at current wage rates since we operate in a competitive labor market and there is a risk of market increases in compensation.
If we are unable to hire, properly train and retain qualified employees, we could experience higher employment costs, reduced sales, regulatory noncompliance, losses of customers and diminution of our brand, which could adversely affect our earnings. If we do not maintain competitive wages, our customer service could suffer due to a declining quality of our workforce or, alternatively, our earnings could decrease if we increase our wage rates. A violation or change in employment and labor laws (including changes in existing employment benefit programs such as health insurance) could have a material adverse effect on our results of operations, financial condition and cash flows.
Inability to acquire and provide quality merchandise at competitive prices could adversely affect our sales and results of operations.
We are dependent upon our domestic and international vendors continuing to supply us with quality merchandise at favorable prices and payment terms. If our merchandise offerings do not meet our customers’ expectations regarding quality and safety, we could experience lost sales, increased costs and exposure to legal and reputational risk. All of our vendors must comply with applicable product safety laws, and we are dependent on them to ensure that the products we buy comply with all safety and quality standards. Events that give rise to actual, potential or perceived product safety concerns could expose us to government enforcement action or private litigation and result in costly product recalls and other liabilities. To the extent our suppliers are subject to added government regulation of their product design and/or manufacturing processes, the cost of the merchandise we purchase may rise. In addition, negative customer perceptions regarding the safety or quality of the products we sell could cause our customers to seek alternative sources for their needs, resulting in lost sales. In those circumstances, it may be difficult and costly for us to rebuild our reputation and regain the confidence of our customers. Moreover, our vendors are impacted by global economic conditions. Credit market and other macroeconomic conditions could have a material adverse effect on the ability of our suppliers to finance and operate their businesses, resulting in increased product costs and difficulties in meeting our inventory demands. If we experience transitions or changeover with any of our significant vendors, or if they experience financial difficulties or otherwise are unable to deliver merchandise to us on a timely basis, or at all, we could have product shortages in our stores that could adversely affect customers’ perceptions of us and cause us to lose customers and sales.
Risks associated with products sourced outside the U.S.
We directly imported approximately 14% of our purchases in fiscal 2019, but many of our domestic vendors directly import their products or components of their products. Changes to the price or flow of these goods for any reason, such as political unrest or acts of war, currency fluctuations, disruptions in maritime lanes, port labor disputes and economic conditions and instability in the countries in which foreign suppliers are located, the financial instability of suppliers, failure to meet our standards, issues with labor practices of our suppliers or labor problems they may experience (such as strikes, stoppages or slowdowns, which could also increase labor costs during and following the disruption), the availability and cost of raw materials to suppliers, increased import duties or tariffs, merchandise quality or safety issues, transport availability and cost, increases in wage rates and taxes, transport security, inflation and other factors relating to the suppliers and the countries in which they are located or from which they import, often are beyond our control and could adversely affect our operations and profitability. In addition, the foreign trade policies, tariffs and other impositions on imported goods, trade sanctions imposed on certain countries, import limitations on certain types of goods or of goods containing certain materials from other countries and other factors relating to foreign trade and port labor agreements are beyond our control. These and other factors affecting our suppliers and our access to products could adversely affect our business and financial performance. As we or our domestic vendors increase our imports of merchandise from foreign vendors, the risks associated with these imports will also increase.
Table of Contents
Our ability to grow depends in part on new location openings, existing location remodels and expansions and effective utilization of our existing supply chain and hub network.
Our continued growth and success will depend in part on our ability to open and operate new locations and expand and remodel existing locations to meet customers’ needs on a timely and profitable basis. Accomplishing our new and existing location expansion goals will depend upon a number of factors, including the ability to partner with developers and landlords to obtain suitable sites for new and expanded locations at acceptable costs, the hiring and training of qualified personnel and the integration of new locations into existing operations. There can be no assurance we will be able to achieve our location expansion goals, manage our growth effectively, successfully integrate the planned new locations into our operations or operate our new, remodeled and expanded locations profitably.
In addition, we extensively utilize our hub network, our supply chain and logistics management techniques to efficiently stock our locations. We have made, and plan to continue to make, significant investments in our supply chain to improve our ability to provide the best parts at the right price and to meet consumer product needs. If we fail to effectively utilize our existing hubs and/or supply chains or if our investments in our supply chain initiatives, including directly sourcing some products from outside the U.S., do not provide the anticipated benefits, we could experience sub-optimal inventory levels in our locations or increases in our operating costs, which could adversely affect our sales volume and/or our margins.
Our failure to protect our reputation could have a material adverse effect on our brand name and profitability.
We believe our continued strong sales growth is driven in significant part by our brand name. The value in our brand name and its continued effectiveness in driving our sales growth are dependent to a significant degree on our ability to maintain our reputation for safety, high product quality, friendliness, service, trustworthy advice, integrity and business ethics. Any negative publicity about these areas could damage our reputation and may result in reduced demand for our merchandise. The increasing use of technology also poses a risk as customers are able to quickly compare products and prices and use social media to provide feedback in a manner that is rapidly and broadly dispersed. Our reputation could be impacted if customers have a bad experience and share it over social media.
Failure to comply with ethical, social, product, labor, environmental and anti-corruption standards could also jeopardize our reputation and potentially lead to various adverse actions by consumer or environmental groups, employees or regulatory bodies. Failure to comply with applicable laws and regulations, to maintain an effective system of internal controls or to provide accurate and timely financial statement information could also hurt our reputation. If we fail to comply with existing or future laws or regulations, we may be subject to governmental or judicial fines or sanctions, while incurring substantial legal fees and costs. In addition, our capital and operating expenses could increase due to implementation of and compliance with existing and future laws and regulations or remediation measures that may be required if we are found to be noncompliant with any existing or future laws or regulations. The inability to pass through any increased expenses through higher prices would have an adverse effect on our results of operations.
Damage to our reputation or loss of consumer confidence for any of these or other reasons could have a material adverse effect on our results of operations and financial condition, as well as require additional resources to rebuild our reputation.
Table of Contents
Our success in international operations is dependent on our ability to manage the unique challenges presented by international markets.
The various risks we face in our U.S. operations generally also exist when conducting operations in and sourcing products and materials from outside of the U.S., in addition to the unique costs, risks and difficulties of managing international operations. Our expansion into international markets may be adversely affected by local laws and customs, U.S. laws applicable to foreign operations, and political and socio-economic conditions.
Risks inherent in international operations also include potential adverse tax consequences, potential changes to trade policies and trade agreements, compliance with the Foreign Corrupt Practices Act and local anti-bribery and anti-corruption laws, greater difficulty in enforcing intellectual property rights, challenges to identify and gain access to local suppliers, and possibly misjudging the response of consumers in foreign countries to our product assortment and marketing strategy.
In addition, our operations in international markets are conducted primarily in the local currency of those countries. Since our Consolidated Financial Statements are denominated in U.S. dollars, amounts of assets, liabilities, net sales, and other revenues and expenses denominated in local currencies must be translated into U.S. dollars using exchange rates for the current period. As a result, foreign currency exchange rates and fluctuations in those rates may adversely impact our financial performance.
Failure to protect or effectively respond to a breach of the privacy and security of customers’, suppliers’, AutoZoners’ or Company information could damage our reputation, subject us to litigation, and cause us to incur substantial costs.
Our business, like that of most retailers and distributors, involves the receipt, storage and transmission of personal information about our customers, suppliers and AutoZoners, some of which is entrusted to third-party service providers and vendors. Failure to protect the security of our customers’, suppliers’, employees’ and Company information could subject us to costly regulatory enforcement actions, expose us to litigation and impair our reputation, which may have a negative impact on our sales. We consider information security to be a top priority and undertake cyber-security planning and activities throughout the Company. Senior management and the Board of Directors are actively engaged in cyber-security risk management. While we and our third-party service providers and vendors take significant steps to protect customer, supplier, employee and other confidential information, including maintaining compliance with payment card industry standards and a security program that includes updating technology and security policies, employee training and monitoring and routine testing of our systems, these security measures may be breached in the future due to cyber-attack, employee error, system compromises, fraud, trickery, hacking or other intentional or unintentional acts, and unauthorized parties may obtain access to this data. We believe that our preventative actions provide adequate measures of protection against security breaches and generally reduce our cyber-security risks. However, our business or our third party providers, with which we share sensitive information, may not discover a security breach or loss of information for a significant period after the security breach occurs. Failure to effectively respond to system compromises may undermine our security measures. The methods used to obtain unauthorized access are constantly evolving, and may be difficult to anticipate or detect for long periods of time. To date, we have not experienced a material breach of cyber-security; however, our computer systems have been, and will likely continue to be, subjected to unauthorized access or phishing attempts, computer viruses, malware, ransomware or other malicious codes. As the regulatory environment related to information security, data collection and use, and privacy becomes increasingly rigorous, compliance with these requirements could also result in significant additional costs. There can be no assurance that our security measures will prevent or limit the impact of a future incident. The cost to remediate damages to our systems suffered as a result of a cyber-attack could be significant.
We accept payments using a variety of methods, including cash, checks, credit, debit, electronic payments (such as PayPal, Apple Pay, etc.) and gift cards, and we may offer new payment options over time, which may have information security risk implications. As a retailer accepting debit and credit cards for payment, we are subject to various industry data protection standards and protocols, such as the American National Standards Institute encryption standards and payment network security operating guidelines and Payment Card Industry Data Security Standard. Even though we comply with these standards and protocols and other information security measures, we cannot be certain that the security measures we maintain to protect all of our information technology systems are able to prevent, contain or detect any cyber-attacks, cyber terrorism, or security breaches from known cyber-attacks or malware that may be developed in the future.
Table of Contents
To the extent that any cyber-attack or intrusion in our or one of our third-party service provider’s information systems results in the loss, damage or misappropriation of information, we may be materially adversely affected by claims from customers, financial institutions, regulatory authorities, payment card networks and others. In certain circumstances, payment card association rules and obligations to which we are subject under our contracts with payment card processors make us liable to payment card issuers if information in connection with payment cards and payment card transactions that we hold is compromised, which liabilities could be substantial. In addition, the cost of complying with stricter and more complex data privacy, data collection and information security laws and standards could be significant to us.
We have invested in information-technology risk management and disaster recovery plans. Although these plans are in place, we must provide ongoing monitoring and consistently revise our plans as technologies change rapidly and our efforts to overcome security risks continue to become increasingly more complex and concentrated.
Our business, results of operations, financial condition and cash flows may be affected by environmental, tax and employment laws or other governmental actions.
We are subject to various laws and governmental regulations which may impact our business. We could be impacted by environmental laws and regulations, including initiatives to limit greenhouse gas emissions and bills related to climate change. Although we are not certain that these initiatives will become regulations, if the regulations become enacted, they could adversely impact our costs.
Our business is subject to changes in tax laws and regulations which could impact our overall tax liability. Governments may issue guidance or enact tax laws which could result in changes to our tax position and adversely impact our results of operations, financial condition and cash flows.
Our business, financial condition, results of operations and cash flows may be affected by litigation.
We are involved in lawsuits, regulatory investigations, governmental and other legal procedures, arising out of the ordinary course of business. Legal action may be material and may adversely affect our business, results of operations, financial condition and cash flows.
We rely heavily on our information technology systems for our key business processes. Any failure or interruption in these systems could have a material adverse impact on our business.
We rely extensively on our information technology systems, some of which are managed or provided by third-party service providers, to manage inventory, communicate with customers, process transactions and summarize results. Our systems and the third-party systems we rely on are subject to damage or interruption from power outages, telecommunications failures, computer viruses, security breaches, malicious cyber-attacks, catastrophic events, and design or usage errors by our AutoZoners, contractors or third-party service providers. Although we and our third-party service providers work diligently to maintain our respective systems, we may not be successful in doing so.
If our systems are damaged or fail to function properly, we may incur substantial costs to repair or replace them, and may experience loss of critical data and interruptions or delays in our ability to manage inventories or process transactions, which could result in lost sales, inability to process purchase orders and/or a potential loss of customer loyalty, which could adversely affect our results of operations.
Our business is in the process of developing and implementing various information systems, as well as modifying existing systems. These technological changes will require significant investment of human and financial resources, and our business may experience significant delays, costs increases and other obstacles with these projects. Although we have invested significant resources during our planning, project management and training, implementation issues may arise which may disrupt our operations and negatively impact our business operations, financial condition and cash flows.
Table of Contents
Business interruptions may negatively impact our location hours, operability of our computer and other systems, availability of merchandise and otherwise have a material negative effect on our sales and our business.
War or acts of terrorism, political unrest, unusual weather conditions, hurricanes, tornadoes, windstorms, fires, earthquakes, floods and other natural or other disasters or the threat of any of them, may result in certain of our locations being closed for a period of time or permanently or have a negative impact on our ability to obtain merchandise available for sale in our locations. Some of our merchandise is imported from other countries. If imported goods become difficult or impossible to bring into the U.S., and if we cannot obtain such merchandise from other sources at similar costs, our sales and profit margins may be negatively affected.
In the event that commercial transportation is curtailed or substantially delayed, our business may be adversely impacted, as we may have difficulty transporting merchandise to our distribution centers and locations resulting in lost sales and/or a potential loss of customer loyalty. Transportation issues could also cause us to cancel purchase orders if we are unable to receive merchandise in our distribution centers.
Item 1B. Unresolved Staff Comments
None.
Item 2. Properties
The following table reflects the square footage and number of leased and owned properties for our stores as of August 31, 2019:
| No. of Stores | Store Square Footage | |||||||
| Leased | 3,398 | 22,160,926 | ||||||
| Owned | 3,013 | 20,365,525 | ||||||
| Total | 6,411 | 42,526,451 | ||||||
We have approximately 5.7 million square feet in distribution centers servicing our stores, of which approximately 1.8 million square feet is leased and the remainder is owned. Our 12 distribution centers are located in Arizona, California, Florida, Georgia, Illinois, Ohio, Pennsylvania, Tennessee, Texas, Washington and two in Mexico. Our primary store support center is located in Memphis, Tennessee, and consists of approximately 320,000 square feet. We also have three additional store support centers located in Monterrey, Mexico; Chihuahua, Mexico and Sao Paulo, Brazil. Our Internal Sourcing Office is located in Shanghai, China. The ALLDATA headquarters in Elk Grove, California is leased, and we also own or lease other properties that are not material in the aggregate.
Item 3. Legal Proceedings
In 2004, we acquired a store site in Mount Ephraim, New Jersey that had previously been the site of a gasoline service station and contained evidence of groundwater contamination. Upon acquisition, we voluntarily reported the groundwater contamination issue to the New Jersey Department of Environmental Protection (“NJDEP”) and entered into a Voluntary Remediation Agreement providing for the remediation of the contamination associated with the property. We have conducted and paid for (at an immaterial cost to us) remediation of contamination on the property.
We have also voluntarily investigated and addressed potential vapor intrusion impacts in downgradient residences and businesses. The NJDEP has asserted, in a Directive and Notice to Insurers dated February 19, 2013 and again in an Amended Directive and Notice to Insurers dated January 13, 2014 (collectively the “Directives”), that we are liable for the downgradient impacts under a joint and severable liability theory. By letter dated April 23, 2015, NJDEP has demanded payment from us, and other parties, in the amount of approximately $296 thousand for costs incurred by NJDEP in connection with contamination downgradient of the property. By letter dated January 29, 2016, we were informed that NJDEP has filed a lien against the property in connection with approximately $355 thousand in costs incurred by NJDEP in connection with contamination downgradient of the property. We have contested, and will continue to contest, any such assertions due to the existence of other entities/sources of contamination, some of which are named in the Directives and the April 23, 2015 Demand, in the area of the property.
Table of Contents
Pursuant to the Voluntary Remediation Agreement, upon completion of all remediation required by the agreement, we believe we should be eligible to be reimbursed up to 75% of qualified remediation costs by the State of New Jersey. We have asked the state for clarification that the agreement applies to off-site work. Although the aggregate amount of additional costs that we may incur pursuant to the remediation cannot currently be ascertained, we do not currently believe that fulfillment of our obligations under the agreement or otherwise will result in costs that are material to our financial condition, results of operations or cash flows.
In July 2014, we received a subpoena from the District Attorney of the County of Alameda, along with other environmental prosecutorial offices in the State of California, seeking documents and information related to the handling, storage and disposal of hazardous waste; a Complaint regarding the matter was subsequently filed by the District Attorney and the State Attorney General’s Office. The Company cooperated fully with the District Attorney and the State Attorney General’s Office to resolve the matter in fiscal 2019 without a finding of liability on the part of the Company. The amount the Company agreed to pay was within the amount previously accrued by the Company for the matter.
Arising out of an April 2016 letter from the California Air Resources Board (“CARB”), one of our formerly-owned subsidiaries was sued in March 2018 by CARB and the State of California seeking penalties, among other relief, for alleged violations of the California Health and Safety Code, Title 13 of the California Code of Regulations and the California Vehicle Code related to the sale and advertisement of certain aftermarket motor vehicle pollution control parts in the State of California. On February 26, 2018, we completed our transaction to sell substantially all the assets, net of assumed liabilities related to our AutoAnything operations. As part of the sale, we retained the liability related to this lawsuit. The Company cooperated fully with CARB and the State Attorney General’s Office to resolve the matter in fiscal 2019 without a finding of liability on the part of the Company. The amount the Company agreed to pay was within the amount previously accrued by the Company for the matter.
We are involved in various other legal proceedings incidental to the conduct of our business, including, but not limited to, several lawsuits containing class-action allegations in which the plaintiffs are current and former hourly and salaried employees who allege various wage and hour violations and unlawful termination practices. We do not currently believe that, either individually or in the aggregate, these matters will result in liabilities material to our financial condition, results of operations or cash flows.
Item 4. Mine Safety Disclosures
Item 5. Market for Registrant’s Common Equity, Related Stockholder Matters and Issuer Purchases of Equity Securities
Our common stock is listed on the New York Stock Exchange under the symbol “AZO.” On October 21, 2019, there were 2,112 stockholders of record, which does not include the number of beneficial owners whose shares were represented by security position listings.
We currently do not pay a dividend on our common stock. Our ability to pay dividends is subject to limitations imposed by Nevada law. Any future payment of dividends would be dependent upon our financial condition, capital requirements, earnings and cash flow.
During 1998, the Company announced a program permitting the Company to repurchase a portion of its outstanding shares not to exceed a dollar maximum established by the Company’s Board of Directors. The program was most recently amended on October 7, 2019, to increase the repurchase authorization by $1.250 billion, bringing total value of authorized share repurchases to $23.2 billion.
Shares of common stock repurchased by the Company during the quarter ended August 31, 2019, were as follows:
| Period | Total Number of Shares Purchased | Average Price Paid per Share | Total Number of Shares Purchased as Part of Publicly Announced Plans or Programs | Maximum Dollar Value that May Yet Be Purchased Under the Plans or Programs | ||||||||||||
| May 5, 2019, to June 1, 2019 | 108,418 | $ | 1,014.58 | 108,418 | $ | 1,058,574,234 | ||||||||||
| June 2, 2019, to June 29, 2019 | 103,332 | 1,093.45 | 103,332 | 945,586,095 | ||||||||||||
| June 30, 2019, to July 27, 2019 | 136,426 | 1,147.37 | 136,426 | 789,054,681 | ||||||||||||
| July 28, 2019, to August 31, 2019 | 285,688 | 1,093.02 | 285,688 | 476,792,875 | ||||||||||||
| Total | 633,864 | $ | 1,091.37 | 633,864 | $ | 476,792,875 | ||||||||||
The Company also repurchased, at market value, an additional 17,201, 11,816 and 12,455 shares in fiscal years 2019, 2018 and 2017, respectively, from employees electing to sell their stock under the Company’s Sixth Amended and Restated Employee Stock Purchase Plan (the “Employee Plan”), qualified under Section 423 of the Internal Revenue Code, under which all eligible employees may purchase AutoZone’s common stock at 85% of the lower of the market price of the common stock on the first day or last day of each calendar quarter through payroll deductions. Maximum permitted annual purchases are $15,000 per employee or 10 percent of compensation, whichever is less. Under the Employee Plan, 11,011, 14,523 and 14,205 shares were sold to employees in fiscal 2019, 2018 and 2017, respectively. At August 31, 2019, 152,766 shares of common stock were reserved for future issuance under the Employee Plan.
Once executives have reached the maximum purchases under the Employee Plan, the Sixth Amended and Restated Executive Stock Purchase Plan (the “Executive Plan”) permits all eligible executives to purchase AutoZone’s common stock up to 25 percent of his or her annual salary and bonus. Purchases by executives under the Executive Plan were 1,483, 1,840 and 1,865 shares in fiscal 2019, 2018 and 2017, respectively. At August 31, 2019, 236,565 shares of common stock were reserved for future issuance under the Executive Plan.
Table of Contents
Stock Performance Graph
The graph below presents changes in the value of AutoZone’s stock as compared to Standard & Poor’s 500 Composite Index (“S&P 500”) and to Standard & Poor’s Retail Index (“S&P Retail Index”) for the five-year period beginning August 30, 2014 and ending August 31, 2019.
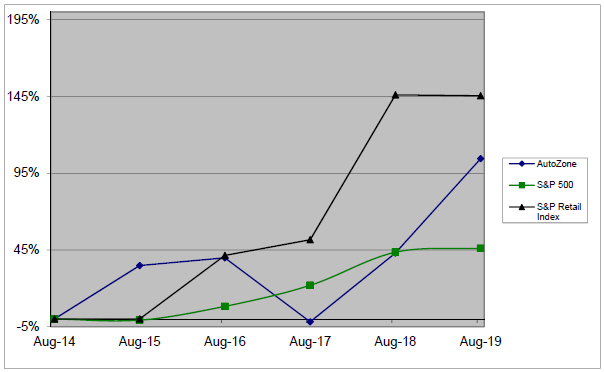
Table of Contents
Item 6. Selected Financial Data
| (in thousands, except per share data, same store sales and selected operating data) | Fiscal Year Ended August | |||||||||||||||||||
| 2019(1) | 2018(2) | 2017 | 2016 | 2015 | ||||||||||||||||
| Income Statement Data | ||||||||||||||||||||
| Net sales | $ | 11,863,743 | $ | 11,221,077 | $ | 10,888,676 | $ | 10,635,676 | $ | 10,187,340 | ||||||||||
| Cost of sales, including warehouse and delivery expenses | 5,498,742 | 5,247,331 | 5,149,056 | 5,026,940 | 4,860,309 | |||||||||||||||
| Gross profit | 6,365,001 | 5,973,746 | 5,739,620 | 5,608,736 | 5,327,031 | |||||||||||||||
| Operating, selling, general and administrative expenses | 4,148,864 | 4,162,890 | 3,659,551 | 3,548,341 | 3,373,980 | |||||||||||||||
| Operating profit | 2,216,137 | 1,810,856 | 2,080,069 | 2,060,395 | 1,953,051 | |||||||||||||||
| Interest expense, net | 184,804 | 174,527 | 154,580 | 147,681 | 150,439 | |||||||||||||||
| Income before income taxes | 2,031,333 | 1,636,329 | 1,925,489 | 1,912,714 | 1,802,612 | |||||||||||||||
| Income tax expense(3) | 414,112 | 298,793 | 644,620 | 671,707 | 642,371 | |||||||||||||||
| Net income(3) | $ | 1,617,221 | $ | 1,337,536 | $ | 1,280,869 | $ | 1,241,007 | $ | 1,160,241 | ||||||||||
| Diluted earnings per share(3) | $ | 63.43 | $ | 48.77 | $ | 44.07 | $ | 40.70 | $ | 36.03 | ||||||||||
| Weighted average shares for diluted earnings per share(3) | 25,498 | 27,424 | 29,065 | 30,488 | 32,206 | |||||||||||||||
| Same Store Sales | ||||||||||||||||||||
| Increase in domestic comparable store net sales(4) | 3.0 | % | 1.8 | % | 0.5 | % | 2.4 | % | 3.8 | % | ||||||||||
| Balance Sheet Data | ||||||||||||||||||||
| Current assets | $ | 5,028,685 | $ | 4,635,869 | $ | 4,611,255 | $ | 4,239,573 | $ | 3,970,294 | ||||||||||
| Working capital (deficit) | (483,456 | ) | (392,812 | ) | (155,046 | ) | (450,747 | ) | (742,579 | ) | ||||||||||
| Total assets | 9,895,913 | 9,346,980 | 9,259,781 | 8,599,787 | 8,102,349 | |||||||||||||||
| Current liabilities | 5,512,141 | 5,028,681 | 4,766,301 | 4,690,320 | 4,712,873 | |||||||||||||||
| Debt | 5,206,344 | 5,005,930 | 5,081,238 | 4,924,119 | 4,624,876 | |||||||||||||||
| Long-term capital leases | 123,659 | 102,013 | 102,322 | 102,451 | 87,639 | |||||||||||||||
| Stockholders’ (deficit) | (1,713,851 | ) | (1,520,355 | ) | (1,428,377 | ) | (1,787,538 | ) | (1,701,390 | ) | ||||||||||
| Selected Operating Data | ||||||||||||||||||||
| Number of locations at beginning of year | 6,202 | 6,029 | 5,814 | 5,609 | 5,391 | |||||||||||||||
| Acquired locations(5) | — | — | — | — | 17 | |||||||||||||||
| Sold locations(6) | — | 26 | — | — | — | |||||||||||||||
| New locations | 209 | 201 | 215 | 205 | 202 | |||||||||||||||
| Closed locations | — | 2 | — | — | 1 | |||||||||||||||
| Net new locations | 209 | 199 | 215 | 205 | 201 | |||||||||||||||
| Relocated locations | 2 | 7 | 5 | 6 | 5 | |||||||||||||||
| Number of locations at end of year | 6,411 | 6,202 | 6,029 | 5,814 | 5,609 | |||||||||||||||
| AutoZone domestic commercial programs | 4,893 | 4,741 | 4,592 | 4,390 | 4,141 | |||||||||||||||
| Inventory per location (in thousands) | $ | 674 | $ | 636 | $ | 644 | $ | 625 | $ | 610 | ||||||||||
| Total AutoZone store square footage (in thousands) | 42,526 | 41,066 | 39,684 | 38,198 | 36,815 | |||||||||||||||
| Average square footage per AutoZone store | 6,633 | 6,621 | 6,611 | 6,600 | 6,587 | |||||||||||||||
| Increase in AutoZone store square footage | 3.6 | % | 3.5 | % | 3.9 | % | 3.8 | % | 3.9 | % | ||||||||||
| Average net sales per AutoZone store (in thousands) | $ | 1,847 | $ | 1,778 | $ | 1,756 | $ | 1,773 | $ | 1,761 | ||||||||||
| Net sales per AutoZone store average square foot | $ | 279 | $ | 269 | $ | 266 | $ | 269 | $ | 268 | ||||||||||
| Total employees at end of year (in thousands) | 96 | 89 | 87 | 84 | 81 | |||||||||||||||
| Inventory turnover(7) | 1.3 | x | 1.3 | x | 1.4 | x | 1.4 | x | 1.4 | x | ||||||||||
| Accounts payable to inventory ratio | 112.6 | % | 111.8 | % | 107.4 | % | 112.8 | % | 112.9 | % | ||||||||||
| After-tax return on invested capital(8) | 35.7 | % | 32.1 | % | 29.9 | % | 31.3 | % | 31.2 | % | ||||||||||
| Adjusted debt to EBITDAR(9) | 2.5 | 2.5 | 2.6 | 2.5 | 2.5 | |||||||||||||||
| Net cash provided by operating activities (in thousands)(3) | $ | 2,128,513 | $ | 2,080,292 | $ | 1,570,612 | $ | 1,641,060 | $ | 1,573,018 | ||||||||||
| Cash flow before share repurchases and changes in debt (in thousands)(10) | $ | 1,758,672 | $ | 1,596,367 | $ | 1,017,585 | $ | 1,166,987 | $ | 1,018,440 | ||||||||||
| Share repurchases (in thousands) | $ | 2,004,896 | $ | 1,592,013 | $ | 1,071,649 | $ | 1,452,462 | $ | 1,271,416 | ||||||||||
| Number of shares repurchased (in thousands) | 2,182 | 2,398 | 1,495 | 1,903 | 2,010 |
| (1) | The fiscal year ended August 31, 2019 consisted of 53 weeks. |
|---|
| (2) | Fiscal 2018 was negatively impacted by pension termination charges of $130.3 million (pre-tax) recognized in the fourth quarter and asset impairments of $193.2 million (pre-tax) recognized in the second quarter of fiscal 2018. See “Note L – Pension and Savings Plans” and “Note M – Sale of Assets” of the Notes to Consolidated Financial Statements for more information. Fiscal 2018 also includes a benefit to net income related to the Tax Cuts and Jobs Act (“Tax Reform”). See “Note D- Income Taxes” of the Notes to Consolidated Financial Statements for more information. |
|---|
Table of Contents
| (3) | Fiscal 2019, 2018 and 2017 include excess tax benefits from stock option exercises of $46.0 million, $31.3 million and $31.2 million, respectively, related to the adoption of Accounting Standards Update (“ASU”) 2016-09, Compensation – Stock Compensation (Topic 718): Improvement to Employee Share-based Payment Accounting. The Company adopted ASU 2016-09 effective August 28, 2016 and applied the recognition of excess tax deficiencies and tax benefits in the income statement on a prospective basis. Income tax expense, net income and diluted earnings per share amounts presented for prior periods were not restated. The Company applied ASU 2016-09 relating to the presentation of the excess tax benefits on the Consolidated Statements of Cash Flows retrospectively. Prior period amounts for net cash provided by operating activities for all years presented above were restated to conform to the current period presentation. |
|---|
| (4) | The domestic comparable sales increases are based on sales for all AutoZone domestic stores open at least one year. Same store sales are computed on a 52-week basis. Relocated stores are included in the same store sales computation based on the year the original store was opened. Closed store sales are included in the same store sales computation up to the week it closes, and excluded from the computation for all periods subsequent to closing. All sales through our www.autozone.com website, including consumer direct ship-to-home sales, are also included in the computation. |
|---|
| (5) | 17 IMC branches were acquired on September 27, 2014. |
|---|
| (6) | 26 IMC branches were sold on April 4, 2018. See “Note M – Sale of Assets” of the Notes to Consolidated Financial Statements for more information. |
|---|
| (7) | Inventory turnover is calculated as cost of sales divided by the average merchandise inventory balance over the trailing 5 quarters. |
|---|
| (8) | After-tax return on invested capital is defined as after-tax operating profit (excluding rent charges) divided by invested capital (which includes a factor to capitalize operating leases). For fiscal 2019, after-tax operating profit was adjusted for the impact of the revaluation of deferred tax liabilities, net of repatriation tax. For fiscal 2018, after-tax operating profit was adjusted for impairment charges, pension termination charges and the impact of the revaluation of deferred tax liabilities, net of repatriation tax. See Reconciliation of Non-GAAP Financial Measures in Management’s Discussion and Analysis of Financial Condition and Results of Operations. |
|---|
| (9) | Adjusted debt to EBITDAR is defined as the sum of total debt, capital lease obligations and annual rents times six; divided by net income plus interest, taxes, depreciation, amortization, rent and share-based compensation expense. For fiscal 2018, net income was adjusted for impairment charges and pension termination charges before tax impact. See Reconciliation of Non-GAAP Financial Measures in Management’s Discussion and Analysis of Financial Condition and Results of Operations. |
|---|
| (10) | Cash flow before share repurchases and changes in debt is defined as the change in cash and cash equivalents less the change in debt plus treasury stock purchases. See Reconciliation of Non-GAAP Financial Measures in Management’s Discussion and Analysis of Financial Condition and Results of Operations. |
|---|
Item 7. Management’s Discussion and Analysis of Financial Condition and Results of Operations
We are the leading retailer, and a leading distributor, of automotive replacement parts and accessories in the Americas. We began operations in 1979 and at August 31, 2019, operated 5,772 stores in the U.S., including Puerto Rico and Saint Thomas; 604 stores in Mexico; and 35 stores in Brazil. Each store carries an extensive product line for cars, sport utility vehicles, vans and light trucks, including new and remanufactured automotive hard parts, maintenance items, accessories and non-automotive products. At August 31, 2019, in 4,893 of our domestic stores, we also had a commercial sales program that provides commercial credit and prompt delivery of parts and other products to local, regional and national repair garages, dealers, service stations and public sector accounts. We also have commercial programs in stores in Mexico and Brazil. We also sell the ALLDATA brand automotive diagnostic and repair software through www.alldata.com and www.alldatadiy.com. Additionally, we sell automotive hard parts, maintenance items, accessories and non-automotive products through www.autozone.com, and our commercial customers can make purchases through www.autozonepro.com. We do not derive revenue from automotive repair or installation services.
Executive Summary
For fiscal 2019, we achieved record net income of $1.617 billion, a 20.9% increase over the prior year, and sales growth of $642.7 million, a 5.7% increase over the prior year. Both our retail sales and commercial sales grew this past year, as we continue to make progress on our initiatives that are aimed at improving our ability to say yes to our customers more frequently, drive traffic to our stores and accelerate our commercial growth.
Table of Contents
Our business is impacted by various factors within the economy that affect both our consumer and our industry, including but not limited to fuel costs, wage rates and other economic conditions. Given the nature of these macroeconomic factors, we cannot predict whether or for how long certain trends will continue, nor can we predict to what degree these trends will impact us in the future.
One macroeconomic factor affecting our customers and our industry during fiscal 2019 was gas prices. During fiscal 2019, the average price per gallon of unleaded gasoline in the U.S. was $2.63 per gallon, compared to $2.67 per gallon during fiscal 2018. We believe fluctuations in gas prices impact our customers’ level of disposable income. With approximately 12 billion gallons of unleaded gas consumption each month across the U.S., each $1 decrease at the pump contributes approximately $12 billion of additional spending capacity to consumers each month. Given the unpredictability of gas prices, we cannot predict whether gas prices will increase or decrease, nor can we predict how any future changes in gas prices will impact our sales in future periods.
We have also experienced accelerated pressure on wages in the U.S. during fiscal 2019. Some of this is attributed to regulatory changes in certain states and municipalities, while the larger portion is being driven by general market pressures with lower unemployment rates and some specific actions taken in recent years by other retailers. The regulatory changes are going to continue, as evidenced by the areas that have passed legislation to increase their wages substantially over the next few years, but we are still assessing to what degree these changes will impact our earnings growth in future periods.
During fiscal 2019, failure and maintenance related categories represented the largest portion of our sales mix, at approximately 85% of total sales, with failure related categories continuing to comprise our largest set of categories. While we have not experienced any fundamental shifts in our category sales mix as compared to previous years, in our domestic stores we did experience a slight increase in mix of sales of the failure category as compared to last year. We believe the improvement in this sales category was driven by differences in regional weather patterns and improved merchandise assortments due to the products we have added over the last year. Our sales mix can be impacted by severe or unusual weather over a short term period. Over the long term, we believe the impact of the weather on our sales mix is not significant.
The two statistics we believe have the closest correlation to our market growth over the long-term are miles driven and the number of seven year old or older vehicles on the road.
Miles Driven
We believe that as the number of miles driven increases, consumers’ vehicles are more likely to need service and maintenance, resulting in an increase in the need for automotive hard parts and maintenance items. While over the long-term we have seen a close correlation between our net sales and the number of miles driven, we have also seen certain time frames of minimal correlation in sales performance and miles driven. During the periods of minimal correlation between net sales and miles driven, we believe net sales have been positively impacted by other factors, including the number of seven year old or older vehicles on the road. Since the beginning of the fiscal year and through July 2019 (latest publicly available information), miles driven in the U.S. increased by 0.8% compared to the same period in the prior year.
Seven Year Old or Older Vehicles
New vehicles sales increased 0.2% during 2019 as compared to the prior calendar year. We estimate vehicles are driven an average of approximately 12,500 miles each year. In seven years, the average miles driven equates to approximately 87,500 miles. Our experience is that at this point in a vehicle’s life, most vehicles are not covered by warranties and increased maintenance is needed to keep the vehicle operating.
According to the latest data provided by the Auto Care Association, as of January 1, 2019, the average age of vehicles on the road was 11.8 years. For the eighth consecutive year, the average age of vehicles has exceeded 11 years.
We expect the aging vehicle population to continue to increase as consumers keep their cars longer in an effort to save money. As the number of seven year old or older vehicles on the road increases, we expect an increase in demand for the products we sell.
Table of Contents
Results of Operations
Fiscal 2019 Compared with Fiscal 2018
For the fiscal year ended August 31, 2019, we reported net sales of $11.864 billion compared with $11.221 billion for the year ended August 25, 2018, a 5.7% increase from fiscal 2018. This growth was driven primarily by net sales of $410.5 million from new domestic stores, the additional 53rd week sales of $238.6 million and a domestic same store sales increase of 3.0% partially offset by the impact of the sale of two businesses in the prior year. Same store sales are computed on a 52-week basis. Domestic commercial sales increased $348.6 million, or 15.7%, over domestic commercial sales for fiscal 2018 which benefited $51.3 million from the additional week of sales.
At August 31, 2019, we operated 5,772 domestic stores, 604 in Mexico and 35 in Brazil, compared with 5,618 domestic stores, 564 in Mexico and 20 in Brazil at August 25, 2018. We reported a total auto parts segment (domestic, Mexico, Brazil and IMC through April 4, 2018) sales increase of 6.3% for fiscal 2019.
Gross profit for fiscal 2019 was $6.365 billion, or 53.7% of net sales, a 41 basis point increase compared with $5.974 billion, or 53.2% of net sales for fiscal 2018. The increase in gross margin was primarily attributable to the favorable impact of the sale of two businesses completed in the prior year (+37 basis points).
Operating, selling, general and administrative expenses for fiscal 2019 decreased to $4.149 billion, or 35.0% of net sales, from $4.163 billion, or 37.1% of net sales for fiscal 2018. The decrease in operating expenses, as a percentage of sales, was primarily due to last year’s impairment charges of $193.2 million related to the sale of two businesses and pension plan termination charges of $130.3 million, partially offset by increased domestic store payroll (-66 basis points) in 2019. See “Note L – Pension and Savings Plan” and “Note M – Sale of Assets” in the Notes to Consolidated Financial Statements.
Interest expense, net for fiscal 2019 was $184.8 million compared with $174.5 million during fiscal 2018. This increase was primarily due to higher debt levels and an additional week of interest incurred due to the 53rd week. Average borrowings for fiscal 2019 were $5.097 billion, compared with $4.997 billion for fiscal 2018, and weighted average borrowing rates were 3.2% for fiscal 2019 and fiscal 2018.
Our effective income tax rate was 20.4% of pre-tax income for fiscal 2019 compared to 18.3% for fiscal 2018. The higher tax rate resulted primarily from net impacts of the enactment of Tax Reform (see “Note D - Income Taxes” in the Notes to Consolidated Financial Statements).
Net income for fiscal 2019 increased by 20.9% to $1.617 billion, and diluted earnings per share increased 30.1% to $63.43 from $48.77 in fiscal 2018. The impact on the fiscal 2019 diluted earnings per share from stock repurchases was an increase of $1.83.
Fiscal 2018 Compared with Fiscal 2017
A discussion of changes in our results of operations from fiscal 2017 to fiscal 2018 has been omitted from this Form 10-K, but may be found in “Item 7. Management’s Discussion and Analysis of Financial Condition and Results of Operations” of our Form 10-K for the fiscal year ended August 25, 2018, filed with the SEC on October 24, 2018, which is available free of charge on the SECs website at www.sec.gov and at www.autozone.com, by clicking “Investor Relations” located at the bottom of the page.
Quarterly Periods
Each of the first three quarters of our fiscal year consists of 12 weeks, and the fourth quarter consisted of 17 weeks in 2019 and 16 weeks in 2018 and 2017. Because the fourth quarter contains seasonally high sales volume and consists of 16 or 17 weeks, compared with 12 weeks for each of the first three quarters, our fourth quarter represents a disproportionate share of the annual net sales and net income. The fourth quarter of fiscal year 2019 represented 33.6% of annual sales and 35.0% of net income; and the fourth quarter of fiscal year 2018 represented 31.7% of annual sales and 29.9% of net income; and the fourth quarter of fiscal year 2017 represented 32.3% of annual sales and 33.9% of net income.
Table of Contents
Income Taxes
On December 22, 2017, the U.S. government enacted Tax Reform into law. Tax Reform significantly revises the U.S. federal corporate income tax by, among other things, lowering the statutory federal corporate rate from 35% to 21%, eliminating certain deductions, imposing a mandatory one-time transition tax on accumulated earnings of foreign subsidiaries, and changing how foreign earnings are subject to U.S. federal tax. Also in December 2017, the SEC issued Staff Accounting Bulletin No. 118 (“SAB 118”) to address the application of GAAP in situations when the registrant does not have the necessary information available, prepared and analyzed in reasonable detail to complete the accounting for certain income tax effects of Tax Reform.
During the year ended August 25, 2018, we recorded provisional tax benefit of $131.5 million related to Tax Reform, comprised of a $157.3 million remeasurement of our net Deferred Tax Asset (“DTA”), offset by $25.8 million of transition tax. During the year ended August 31, 2019, the Company completed its analysis of Tax Reform and recorded adjustments to the previously-recorded provisional amounts, resulting in an $8.8 million tax benefit, primarily related to transition tax on accumulated earnings of foreign subsidiaries.
Beginning with the year ending August 31, 2019, we are subject to a new tax on global intangible low-taxed income (“GILTI”) that is imposed on foreign earnings. We have made the election to record this tax as a period cost, thus we have not adjusted the deferred tax assets or liabilities of our foreign subsidiaries for the new tax. Net impacts for GILTI were immaterial and are included in the provision for income taxes for the year ending August 31, 2019.
Liquidity and Capital Resources
The primary source of our liquidity is our cash flows realized through the sale of automotive parts, products and accessories. Net cash provided by operating activities was $2.129 billion in 2019, $2.080 billion in 2018 and $1.571 in 2017. Cash flows from operations are favorable compared to last year primarily due to the timing of payment of accounts payable and growth in net income partially due to the additional week of sales in the current year.
Our primary capital requirement has been the funding of our continued new-location development program and the building of new distribution centers. Net cash flows used in investing activities were $491.8 million in fiscal 2019, compared to $521.9 million in fiscal 2018 and $553.6 million in fiscal 2017. We invested $496.1 million in capital assets in fiscal 2019, compared to $521.8 million in fiscal 2018 and $553.8 million in fiscal 2017. We had new location openings of 209 for fiscal 2019, 201 for fiscal 2018 and 215 for fiscal 2017. The decrease in capital expenditures from fiscal 2018 to fiscal 2019 was attributable to one distribution center opening in fiscal 2018 and none constructed in fiscal 2019. We opened two distribution centers in fiscal 2017. We invest a portion of our assets held by our wholly owned insurance captive in marketable debt securities. We purchased $55.5 million in marketable debt securities in fiscal 2019, $104.5 million in fiscal 2018 and $85.7 million in fiscal 2017. We had proceeds from the sale of marketable debt securities of $53.1 million in fiscal 2019, $69.6 million in fiscal 2018 and $83.0 million in fiscal 2017.
Net cash used in financing activities was $1.674 billion in 2019, $1.632 billion in 2018 and $914.3 million in 2017. The net cash used in financing activities reflected purchases of treasury stock which totaled $2.005 billion for fiscal 2019, $1.592 billion for fiscal 2018 and $1.072 billion for fiscal 2017. The treasury stock purchases in fiscal 2019, 2018 and 2017 were primarily funded by cash flows from operations. The Company issued $750 million of new debt in fiscal 2019 compared to none in fiscal 2018 and $600 million for fiscal 2017. In fiscal 2019 the proceeds from the issuance of debt were used to repay a portion of our outstanding commercial paper borrowings and our $250 million Senior Notes due in April 2019 and for other general corporate purposes. In fiscal 2018, we used commercial paper borrowings to repay our $250 million Senior Notes due in August 2018. In fiscal 2017, the proceeds from the issuance of debt were used for the repayment of a portion of our outstanding commercial paper borrowings, which were used to repay the $400 million Senior Notes due in January 2017.
In fiscal 2019, we made net repayments of commercial paper and short term borrowings in the amount of $295.3 million. Net proceeds from the issuance of commercial paper and short-term borrowings for fiscal 2018 were $170.2 million and net repayments of commercial paper and short-term borrowings for fiscal 2017 were $42.4 million.
Table of Contents
During fiscal 2020, we expect to increase the investment in our business as compared to fiscal 2019. Our investments are expected to be directed primarily to new locations, supply chain infrastructure, enhancements to existing locations and investments in technology. The amount of investments in our new locations is impacted by different factors, including such factors as whether the building and land are purchased (requiring higher investment) or leased (generally lower investment), located in the United States, Mexico or Brazil, or located in urban or rural areas. During fiscal 2019 and 2018, our capital expenditures decreased by approximately 5% and 6%, respectively, compared to the prior year period. In fiscal 2017, our capital expenditures increased by approximately 13% as compared to the prior year.
In addition to the building and land costs, our new locations require working capital, predominantly for inventories. Historically, we have negotiated extended payment terms from suppliers, reducing the working capital required and resulting in a high accounts payable to inventory ratio. We plan to continue leveraging our inventory purchases; however, our ability to do so may be limited by our vendors’ capacity to factor their receivables from us. Certain vendors participate in financing arrangements with financial institutions whereby they factor their receivables from us, allowing them to receive payment on our invoices at a discounted rate. In recent years, we initiated a variety of strategic tests focused on increasing inventory availability, which increased our inventory per location. Many of our vendors have supported our initiative to update our product assortments by providing extended payment terms. These extended payment terms have allowed us to continue our high accounts payable to inventory ratio. We had an accounts payable to inventory ratio of 112.6% at August 31, 2019 and 111.8% at August 25, 2018. The increase from fiscal 2018 to fiscal 2019 was primarily due to more favorable vendor terms.
Depending on the timing and magnitude of our future investments (either in the form of leased or purchased properties or acquisitions), we anticipate that we will rely primarily on internally generated funds and available borrowing capacity to support a majority of our capital expenditures, working capital requirements and stock repurchases. The balance may be funded through new borrowings. We anticipate that we will be able to obtain such financing in view of our credit ratings and favorable experiences in the debt markets in the past.
Our cash balances are held in various locations around the world. As of August 31, 2019, and August 25, 2018, cash and cash equivalents of $49.9 million and $98.8 million, respectively, were held outside of the U.S. and were generally utilized to support the liquidity needs in our foreign operations.
For the fiscal year ended August 31, 2019, our after-tax return on invested capital (“ROIC”) was 35.7% as compared to 32.1% for the comparable prior year period. ROIC is calculated as after-tax operating profit (excluding rent charges) divided by invested capital (which includes a factor to capitalize operating leases). For fiscal 2019, after-tax operating profit was adjusted for the Tax Reform’s impact on the revaluation of deferred tax liabilities, net of the repatriation tax. For fiscal 2018, after-tax operating profit was adjusted for impairment charges, pension termination charges and Tax Reform’s impact on the revaluation of deferred tax liabilities, net of the repatriation tax. The increase in ROIC in fiscal 2019 is primarily due to the increase in net income due to the additional week of operations. We use ROIC to evaluate whether we are effectively using our capital resources and believe it is an important indicator of our overall operating performance. Refer to the “Reconciliation of Non-GAAP Financial Measures” section for further details of our calculation.
Debt Facilities
We entered into a Master Extension, New Commitment and Amendment Agreement dated as of November 18, 2017 (the “Extension Amendment”) to the Third Amended and Restated Credit Agreement dated as of November 18, 2016, as amended, modified, extended or restated from time to time (the “Revolving Credit Agreement”). Under the Extension Amendment: (i) our borrowing capacity under the Revolving Credit Agreement was increased from $1.6 billion to $2.0 billion; (ii) our option to increase the borrowing capacity under the Revolving Credit Agreement was “refreshed” and the amount of such option remained at $400 million; (iii) the maximum borrowing under the Revolving Credit Agreement may, at our option, subject to lenders approval, be increased from $2.0 billion to $2.4 billion; (iv) the termination date of the Revolving Credit Agreement was extended from November 18, 2021 until November 18, 2022; and (v) we have the option to make one additional written request of the lenders to extend the termination date then in effect for an additional year. Under the Revolving Credit Agreement, we may borrow funds consisting of Eurodollar loans, base rate loans or a combination of both.
Table of Contents
Interest accrues on Eurodollar loans at a defined Eurodollar rate, defined as LIBOR plus the applicable percentage, as defined in the Revolving Credit Agreement, depending upon our senior, unsecured, (non-credit enhanced) long-term debt ratings. Interest accrues on base rate loans as defined in the Revolving Credit Agreement. As of August 31, 2019, we had $3.3 million of outstanding letters of credit under the Revolving Credit Agreement.
The Revolving Credit Agreement requires that our consolidated interest coverage ratio as of the last day of each quarter shall be no less than 2.5:1. This ratio is defined as the ratio of (i) consolidated earnings before interest, taxes and rents to (ii) consolidated interest expense plus consolidated rents. Our consolidated interest coverage ratio as of August 31, 2019 was 5.7:1.
As of August 31, 2019, our $1.030 billion of commercial paper borrowings were classified as long-term in the Consolidated Balance Sheets as we have the ability and intent to refinance them on a long-term basis through available capacity in our revolving credit facilities. As of August 31, 2019, we had $1.997 billion of availability under our $2.0 billion revolving credit facility, which would allow us to replace these short-term obligations with long-term financing facilities.
We also maintain a letter of credit facility that allows us to request the participating bank to issue letters of credit on our behalf up to an aggregate amount of $25 million. The letter of credit facility is in addition to the letters of credit that may be issued under the Revolving Credit Agreement. In fiscal 2019, we amended our existing letter of credit facility to decrease the amount that can be requested in letters of credit from $75 million to $25 million effective June 2019. This amendment also extended the maturity date from June 2019 to June 2022. As of August 31, 2019, we had $25.0 million in letters of credit outstanding under the letter of credit facility.
In addition to the outstanding letters of credit issued under the committed facilities discussed above, we had $72.9 million in letters of credit outstanding as of August 31, 2019. These letters of credit have various maturity dates and were issued on an uncommitted basis.
On April 18, 2019, we issued $300 million in 3.125% Senior Notes due April 2024 and $450 million in 3.750% Senior Notes due April 2029 under our automatic shelf registration statement on Form S-3, filed with the SEC on April 4, 2019 (File No. 333-230719) (the “2019 Shelf Registration”). Proceeds from the debt issuance were used to repay a portion of our outstanding commercial paper borrowings, the $250 million in 1.625% Senior Notes due in April 2019 and for other general corporate purposes.
On April 18, 2017, we issued $600 million in 3.750% Senior Notes due June 2027 under our shelf registration statement filed with the SEC on April 15, 2015 (the “2015 Shelf Registration”). Proceeds from the debt issuance were used for general corporate purposes.
The senior notes contain a provision that repayment of the senior notes may be accelerated if we experience a change in control (as defined in the agreements). Our borrowings under our senior notes contain minimal covenants, primarily restrictions on liens, sale and leaseback transactions and consolidations, mergers and the sale of assets. Under our revolving credit facility, covenants include restrictions on liens, a maximum debt to earnings ratio, a minimum fixed charge coverage ratio and a change of control provision that may require acceleration of the repayment obligations under certain circumstances. All of the repayment obligations under our borrowing arrangements may be accelerated and come due prior to the applicable scheduled payment date if covenants are breached or an event of default occurs.
As of August 31, 2019, we were in compliance with all covenants and expect to remain in compliance with all covenants under our borrowing arrangements.
For the fiscal years ended August 31, 2019 and August 26, 2018, our adjusted debt to earnings before interest, taxes, depreciation, amortization, rent and share-based compensation expense (“EBITDAR”) ratio was 2.5:1. We calculate adjusted debt as the sum of total debt, capital lease obligations and rent times six; and we calculate EBITDAR by adding interest, taxes, depreciation, amortization, rent and share-based compensation expense to net income. For fiscal 2018, net income was adjusted to exclude impairment charges and pension termination charges before tax impact as these charges are not reflective of ongoing operations. We target our debt levels to a specified ratio of adjusted debt to EBITDAR in order to maintain our investment grade credit ratings and believe this is important information for the management of our debt levels.
Table of Contents
To the extent EBITDAR continues to grow in future years, we expect our debt levels to increase; conversely, if EBITDAR declines, we would expect our debt levels to decrease. Refer to the “Reconciliation of Non-GAAP Financial Measures” section for further details of our calculation.
Stock Repurchases
During 1998, we announced a program permitting us to repurchase a portion of our outstanding shares not to exceed a dollar maximum established by our Board of Directors (the “Board”). On September 26, 2018, the Board voted to increase the authorization by $1.25 billion. On March 20, 2019, the Board voted to increase the authorization by $1.0 billion. This raised the total value of shares authorized to be repurchased to $21.9 billion. From January 1998 to August 31, 2019, we have repurchased a total of 146.9 million shares at an aggregate cost of $21.423 billion. We repurchased 2.2 million shares of common stock at an aggregate cost of $2.005 billion during fiscal 2019, 2.4 million shares of common stock at an aggregate cost of $1.592 billion during fiscal 2018 and 1.5 million shares of common stock at an aggregate cost of $1.072 billion during fiscal 2017. Considering cumulative repurchases as of August 31, 2019, we had $476.8 million remaining under the Board’s authorization to repurchase our common stock.
For the fiscal year ended August 31, 2019, cash flow before share repurchases and changes in debt was $1.759 billion as compared to $1.596 billion during the comparable prior year period. Cash flow before share repurchases and changes in debt is calculated as the net increase or decrease in cash and cash equivalents less net increases or decreases in debt plus share repurchases. We use cash flow before share repurchases and changes in debt to calculate the cash flows remaining and available in an effort to increase shareholder value in the form of share repurchases. We believe this is important information regarding our allocation of available capital where we prioritize investments in the business and utilize the remaining funds to repurchase shares, while maintaining debt levels that support our investment grade credit ratings. If we allowed these funds to accumulate on our balance sheet instead of repurchasing our shares, we believe our earnings per share and stock price would be negatively impacted. Refer to the “Reconciliation of Non-GAAP Financial Measures” section for further details of our calculation.
On October 7, 2019, the Board voted to authorize the repurchase of an additional $1.25 billion of our common stock in connection with our ongoing share repurchase program. Since the inception of the repurchase program in 1998, the Board has authorized $23.2 billion in share repurchases. Subsequent to August 31, 2019, we have repurchased 259,384 shares of common stock at an aggregate cost of $284.6 million. Considering the cumulative repurchases and the increase in authorization subsequent to August 31, 2019, we have $1.44 billion remaining under the Board’s authorization to repurchase its common stock.
Table of Contents
Financial Commitments
The following table shows our significant contractual obligations as of August 31, 2019:
| (in thousands) | Total Contractual Obligations | Payment Due by Period | ||||||||||||||||||
| Less than 1 year | Between 1-3 years | Between 3-5 years | Over 5 years | |||||||||||||||||
| Debt(1) | $ | 5,230,000 | $ | 1,030,000 | $ | 1,250,000 | $ | 1,100,000 | $ | 1,850,000 | ||||||||||
| Interest payments(2) | 751,813 | 143,250 | 250,250 | 168,438 | 189,875 | |||||||||||||||
| Operating leases(3) | 2,197,092 | 315,424 | 583,343 | 474,081 | 824,244 | |||||||||||||||
| Capital leases(4) | 182,720 | 56,246 | 90,773 | 35,701 | — | |||||||||||||||
| Self-insurance reserves(5) | 242,991 | 89,250 | 77,508 | 34,393 | 41,840 | |||||||||||||||
| Construction commitments | 37,969 | 37,969 | — | — | — | |||||||||||||||
| $ | 8,642,585 | $ | 1,672,139 | $ | 2,251,874 | $ | 1,812,613 | $ | 2,905,959 | |||||||||||
| (1) | Debt balances represent principal maturities, excluding interest, discounts, and debt issuance costs. |
|---|
| (2) | Represents obligations for interest payments on long-term debt. |
|---|
| (3) | Operating lease obligations are inclusive of amounts accrued within deferred rent and closed store obligations reflected in our Consolidated Balance Sheets. |
|---|
| (4) | Capital lease obligations include related interest. |
|---|
| (5) | Self-insurance reserves reflect estimates based on actuarial calculations. Although these obligations do not have scheduled maturities, the timing of future payments are predictable based upon historical patterns. Accordingly, we reflect the net present value of these obligations in our Consolidated Balance Sheets. |
|---|
Our tax liability for uncertain tax positions, including interest and penalties, was $20.5 million at August 31, 2019. Approximately $1.8 million is classified as current liabilities and $18.7 million is classified as long-term liabilities. We did not reflect these obligations in the table above as we are unable to make an estimate of the timing of payments of the long-term liabilities due to uncertainties in the timing and amounts of the settlement of these tax positions.
Off-Balance Sheet Arrangements
The following table reflects outstanding letters of credit and surety bonds as of August 31, 2019:
| (in thousands) | Total Other Commitments | |||
| Standby letters of credit | $ | 101,172 | ||
| Surety bonds | 36,685 | |||
| $ | 137,857 | |||
A substantial portion of the outstanding standby letters of credit (which are primarily renewed on an annual basis) and surety bonds are used to cover reimbursement obligations to our workers’ compensation carriers.
There are no additional contingent liabilities associated with these instruments as the underlying liabilities are already reflected in our Consolidated Balance Sheets. The standby letters of credit and surety bond arrangements expire within one year, but have automatic renewal clauses.
Reconciliation of Non-GAAP Financial Measures
“Selected Financial Data” and “Management’s Discussion and Analysis of Financial Condition and Results of Operations” include certain financial measures not derived in accordance with generally accepted accounting principles (“GAAP”). These non-GAAP financial measures provide additional information for determining our optimum capital structure and are used to assist management in evaluating performance and in making appropriate business decisions to maximize stockholders’ value.
Table of Contents
Non-GAAP financial measures should not be used as a substitute for GAAP financial measures, or considered in isolation, for the purpose of analyzing our operating performance, financial position or cash flows. However, we have presented the non-GAAP financial measures, as we believe they provide additional information that is useful to investors as it indicates more clearly our comparative year-to-year operating results. Furthermore, our management and Compensation Committee of the Board use the above-mentioned non-GAAP financial measures to analyze and compare our underlying operating results and use select measurements to determine payments of performance-based compensation. We have included a reconciliation of this information to the most comparable GAAP measures in the following reconciliation tables.
Reconciliation of Non-GAAP Financial Measure: Cash Flow Before Share Repurchases and Changes in Debt
The following table reconciles net increase (decrease) in cash and cash equivalents to cash flow before share repurchases and changes in debt, which is presented in “Selected Financial Data” and “Management’s Discussion and Analysis of Financial Condition and Results of Operations”:
| Fiscal Year Ended August | ||||||||||||||||||||
| (in thousands) | 2019 | 2018 | 2017 | 2016 | 2015 | |||||||||||||||
| Net cash provided by/(used in): | ||||||||||||||||||||
| Operating activities(1) | $ | 2,128,513 | $ | 2,080,292 | $ | 1,570,612 | $ | 1,641,060 | $ | 1,573,018 | ||||||||||
| Investing activities | (491,846 | ) | (521,860 | ) | (553,599 | ) | (505,835 | ) | (567,911 | ) | ||||||||||
| Financing activities(1) | (1,674,088 | ) | (1,632,154 | ) | (914,329 | ) | (1,116,528 | ) | (944,597 | ) | ||||||||||
| Effect of exchange rate changes on cash | (4,103 | ) | (1,724 | ) | 852 | (4,272 | ) | (9,686 | ) | |||||||||||
| Net (decrease)/increase in cash and cash equivalents | (41,524 | ) | (75,446 | ) | 103,536 | 14,425 | 50,824 | |||||||||||||
| Less: (Decrease)/increase in debt, excluding deferred financing costs | 204,700 | (79,800 | ) | 157,600 | 299,900 | 303,800 | ||||||||||||||
| Plus: Share repurchases | 2,004,896 | 1,592,013 | 1,071,649 | 1,452,462 | 1,271,416 | |||||||||||||||
| Cash flow before share repurchases and changes in debt | $ | 1,758,672 | $ | 1,596,367 | $ | 1,017,585 | $ | 1,166,987 | $ | 1,018,440 | ||||||||||
| (1) | The Company adopted the provisions of ASU 2016-09, Compensation – Stock Compensation (Topic 718): Improvement to Employee Share-based Payment Accounting, as of August 28, 2016. We have applied ASU 2016-09 relating to the presentation of the excess tax benefits on the Consolidated Statements of Cash Flows retrospectively. Prior period amounts for net cash provided by operating and financing activities for fiscal 2015 presented above were restated to conform to the current period presentation. |
|---|
Table of Contents
Reconciliation of Non-GAAP Financial Measure: After-tax ROIC
The following table calculates the percentage of ROIC. ROIC is calculated as after-tax operating profit (excluding rent) divided by invested capital (which includes a factor to capitalize operating leases). The ROIC percentages are presented in “Selected Financial Data” and “Management’s Discussion and Analysis of Financial Condition and Results of Operations”:
| Fiscal Year Ended August | ||||||||||||||||||||
| (in thousands, except percentages) | 2019(1) | 2018(2) | 2017 | 2016 | 2015 | |||||||||||||||
| Net income | $ | 1,617,221 | $ | 1,337,536 | $ | 1,280,869 | $ | 1,241,007 | $ | 1,160,241 | ||||||||||
| Adjustments: | ||||||||||||||||||||
| Impairment before tax | — | 193,162 | — | — | — | |||||||||||||||
| Pension termination charges before tax | — | 130,263 | — | — | — | |||||||||||||||
| Interest expense | 184,804 | 174,527 | 154,580 | 147,681 | 150,439 | |||||||||||||||
| Rent expense | 332,726 | 315,580 | 302,928 | 280,490 | 269,458 | |||||||||||||||
| Tax effect(3) | (105,576 | ) | (211,806 | ) | (153,265 | ) | (150,288 | ) | (149,483 | ) | ||||||||||
| Deferred tax liabilities, net of repatriation tax(4) | (6,340 | ) | (132,113 | ) | — | — | — | |||||||||||||
| After-tax return | $ | 2,022,835 | $ | 1,807,149 | $ | 1,585,112 | $ | 1,518,890 | $ | 1,430,655 | ||||||||||
| Average debt(5) | $ | 5,126,286 | $ | 5,013,678 | $ | 5,061,502 | $ | 4,820,402 | $ | 4,458,114 | ||||||||||
| Average stockholders’ (deficit)(5) | (1,615,339 | ) | (1,433,196 | ) | (1,730,559 | ) | (1,774,329 | ) | (1,619,596 | ) | ||||||||||
| Rent x 6(6) | 1,996,358 | 1,893,480 | 1,817,568 | 1,682,940 | 1,616,748 | |||||||||||||||
| Average capital lease obligations(5) | 162,591 | 156,198 | 150,066 | 131,008 | 126,096 | |||||||||||||||
| Invested capital | $ | 5,669,896 | $ | 5,630,160 | $ | 5,298,577 | $ | 4,860,021 | $ | 4,581,362 | ||||||||||
| ROIC | 35.7 | % | 32.1 | % | 29.9 | % | 31.3 | % | 31.2 | % | ||||||||||
| (1) | The fiscal year ended August 31, 2019 consisted of 53 weeks. |
|---|
| (2) | For fiscal 2018, after-tax operating profit was adjusted for impairment charges and pension settlement charges. |
|---|
| (3) | For fiscal 2019, the effective tax rate was 20.4%. The effective tax rate during fiscal 2018 was 24.2% for impairment, 28.1% for pension termination and 26.2% for interest and rent expense. For fiscal 2017, 2016, and 2015 the effective tax rate was 33.5%, 35.1% and 35.6%, respectively. |
|---|
| (4) | For fiscal 2018 and 2019, after-tax operating profit was adjusted for the impact of the revaluation of deferred tax liabilities, net of repatriation tax. |
|---|
| (5) | All averages are computed based on trailing five quarters. |
|---|
| (6) | Rent is multiplied by a factor of six to capitalize operating leases in the determination of pre-tax invested capital. |
|---|
Table of Contents
Reconciliation of Non-GAAP Financial Measure: Adjusted Debt to EBITDAR
The following table calculates the ratio of adjusted debt to EBITDAR. Adjusted debt to EBITDAR is calculated as the sum of total debt, capital lease obligations and annual rents times six; divided by net income plus interest, taxes, depreciation, amortization, rent and share-based compensation expense. The adjusted debt to EBITDAR ratios are presented in “Selected Financial Data” and “Management’s Discussion and Analysis of Financial Condition and Results of Operations”:
| Fiscal Year Ended August | ||||||||||||||||||||
| (in thousands, except ratios) | 2019(1) | 2018(2) | 2017 | 2016 | 2015 | |||||||||||||||
| Net income | $ | 1,617,221 | $ | 1,337,536 | $ | 1,280,869 | $ | 1,241,007 | $ | 1,160,241 | ||||||||||
| Add: Impairment before tax | — | 193,162 | — | — | — | |||||||||||||||
| Pension termination charges before tax | — | 130,263 | — | — | — | |||||||||||||||
| Interest expense | 184,804 | 174,527 | 154,580 | 147,681 | 150,439 | |||||||||||||||
| Income tax expense | 414,112 | 298,793 | 644,620 | 671,707 | 642,371 | |||||||||||||||
| EBIT | 2,216,137 | 2,134,281 | 2,080,069 | 2,060,395 | 1,953,051 | |||||||||||||||
| Add: Depreciation and amortization expense | 369,957 | 345,084 | 323,051 | 297,397 | 269,919 | |||||||||||||||
| Rent expense | 332,726 | 315,580 | 302,928 | 280,490 | 269,458 | |||||||||||||||
| Share-based expense | 43,255 | 43,674 | 38,244 | 39,825 | 40,995 | |||||||||||||||
| EBITDAR | $ | 2,962,075 | $ | 2,838,619 | $ | 2,744,292 | $ | 2,678,107 | $ | 2,533,423 | ||||||||||
| Debt | $ | 5,206,344 | $ | 5,005,930 | $ | 5,081,238 | $ | 4,924,119 | $ | 4,624,876 | ||||||||||
| Capital lease obligations | 179,905 | 154,303 | 150,456 | 147,285 | 128,167 | |||||||||||||||
| Rent x 6 | 1,996,358 | 1,893,480 | 1,817,568 | 1,682,940 | 1,616,748 | |||||||||||||||
| Adjusted debt | $ | 7,382,607 | $ | 7,053,713 | $ | 7,049,262 | $ | 6,754,344 | $ | 6,369,791 | ||||||||||
| Adjusted debt to EBITDAR | 2.5 | 2.5 | 2.6 | 2.5 | 2.5 | |||||||||||||||
| (1) | The fiscal year ended August 31, 2019 consisted of 53 weeks. |
|---|
| (2) | For fiscal 2018, net income was adjusted to exclude impairment charges and pension termination charges before tax. |
|---|
Recent Accounting Pronouncements
See Note A of the Notes to Consolidated Financial Statements for a discussion on recent accounting pronouncements.
Critical Accounting Policies and Estimates
Preparation of our Consolidated Financial Statements requires us to make estimates and assumptions affecting the reported amounts of assets and liabilities at the date of the financial statements, reported amounts of revenues and expenses during the reporting period and related disclosures of contingent liabilities. In the Notes to our Consolidated Financial Statements, we describe our significant accounting policies used in preparing the Consolidated Financial Statements. Our policies are evaluated on an ongoing basis and are drawn from historical experience and other assumptions that we believe to be reasonable under the circumstances. Actual results could differ under different assumptions or conditions. Our senior management has identified the critical accounting policies for the areas that are materially impacted by estimates and assumptions and have discussed such policies with the Audit Committee of our Board. The following items in our Consolidated Financial Statements represent our critical accounting policies that require significant estimation or judgment by management:
Self-Insurance Reserves
We retain a significant portion of the risks associated with workers’ compensation, general, products liability, property and vehicle liability; and we obtain third party insurance to limit the exposure related to certain of these risks. Our self-insurance reserve estimates totaled $207.0 million at August 31, 2019, and $203.1 million at August 25, 2018. This change is primarily reflective of our growing operations, including inflation, increases in healthcare costs, the number of vehicles and the number of hours worked, as well as our historical claims experience.
Table of Contents
The assumptions made by management in estimating our self-insurance reserves include consideration of historical cost experience, judgments about the present and expected levels of cost per claim and retention levels. We utilize various methods, including analyses of historical trends and use of a specialist, to estimate the cost to settle reported claims and claims incurred but not yet reported. The actuarial methods develop estimates of the future ultimate claim costs based on the claims incurred as of the balance sheet date. When estimating these liabilities, we consider factors, such as the severity, duration and frequency of claims, legal costs associated with claims, healthcare trends and projected inflation of related factors. In recent history, our methods for determining our exposure have remained consistent, and our historical trends have been appropriately factored into our reserve estimates. As we obtain additional information and refine our methods regarding the assumptions and estimates we use to recognize liabilities incurred, we will adjust our reserves accordingly.
Management believes that the various assumptions developed and actuarial methods used to determine our self- insurance reserves are reasonable and provide meaningful data and information that management uses to make its best estimate of our exposure to these risks. Arriving at these estimates, however, requires a significant amount of subjective judgment by management, and as a result these estimates are uncertain and our actual exposure may be different from our estimates. For example, changes in our assumptions about healthcare costs, the severity of accidents and the incidence of illness, the average size of claims and other factors could cause actual claim costs to vary materially from our assumptions and estimates, causing our reserves to be overstated or understated. For instance, a 10% change in our self-insurance liability would have affected net income by approximately $16.3 million for fiscal 2019.
Our liabilities for workers’ compensation, general and product liability, property and vehicle claims do not have scheduled maturities; however, the timing of future payments is predictable based on historical patterns and is relied upon in determining the current portion of these liabilities. Accordingly, we reflect the net present value of the obligations we determine to be long-term using the risk-free interest rate as of the balance sheet date.
If the discount rate used to calculate the present value of these reserves changed by 25 basis points, net income would have been affected by approximately $1.3 million for fiscal 2019. Our liability for health benefits is classified as current, as the historical average duration of claims is approximately six weeks.
Income Taxes
Our income tax returns are audited by state, federal and foreign tax authorities, and we are typically engaged in various tax examinations at any given time. Tax contingencies often arise due to uncertainty or differing interpretations of the application of tax rules throughout the various jurisdictions in which we operate. The contingencies are influenced by items such as tax audits, changes in tax laws, litigation, appeals and prior experience with similar tax positions.
We regularly review our tax reserves for these items and assess the adequacy of the amount we have recorded. As of August 31, 2019, we had approximately $20.5 million reserved for uncertain tax positions.
We evaluate exposures associated with our various tax filings by estimating a liability for uncertain tax positions based on a two-step process. The first step is to evaluate the tax position for recognition by determining if the weight of available evidence indicates that it is more likely than not that the position will be sustained on audit, including resolution of related appeals or litigation processes, if any. The second step requires us to estimate and measure the tax benefit as the largest amount that is more than 50% likely to be realized upon ultimate settlement.
We believe our estimates to be reasonable and have not experienced material adjustments to our reserves in the previous three years; however, actual results could differ from our estimates, and we may be exposed to gains or losses that could be material. Specifically, management has used judgment and made assumptions to estimate the likely outcome of uncertain tax positions. Additionally, to the extent we prevail in matters for which a liability has been established, or must pay in excess of recognized reserves, our effective tax rate in any particular period could be materially affected.
Table of Contents
Vendor Allowances
We receive various payments and allowances from our vendors through a variety of programs and arrangements, including allowances for warranties, advertising and general promotion of vendor products. Vendor allowances are treated as a reduction of the cost of inventory, unless they are provided as a reimbursement of specific, incremental, identifiable costs incurred by the Company in selling the vendor’s products. Approximately 87% of the vendor funds received are recorded as a reduction of the cost of inventories and recognized as a reduction to cost of sales as these inventories are sold.
Based on our vendor agreements, a significant portion of vendor funding we receive is earned as we purchase inventory. Therefore, we record receivables for funding earned but not yet received as we purchase inventory. During the year, we regularly review the receivables from vendors to ensure vendors are able to meet their obligations. We generally have not recorded a reserve against these receivables as we have not experienced significant losses and typically have a legal right of offset with our vendors for payments owed them. Historically, we have had write-offs less than $1 million in each of the last three years.
Item 7A. Quantitative and Qualitative Disclosures about Market Risk
We are exposed to market risk from, among other things, changes in interest rates, foreign exchange rates and fuel prices. From time to time, we use various derivative instruments to reduce interest rate and fuel price risks. To date, based upon our current level of foreign operations, no derivative instruments have been utilized to reduce foreign exchange rate risk. All of our hedging activities are governed by guidelines that are authorized by the Board. Further, we do not buy or sell derivative instruments for trading purposes.
Interest Rate Risk
Our financial market risk results primarily from changes in interest rates. At times, we reduce our exposure to changes in interest rates by entering into various interest rate hedge instruments such as interest rate swap contracts, treasury lock agreements and forward-starting interest rate swaps.
We have historically utilized interest rate swaps to convert variable rate debt to fixed rate debt and to lock in fixed rates on future debt issuances. We reflect the current fair value of all interest rate hedge instruments as a component of either other current assets or accrued expenses and other. Our interest rate hedge instruments are designated as cash flow hedges.
Unrealized gains and losses on interest rate hedges are deferred in stockholders’ deficit as a component of Accumulated Other Comprehensive Loss. These deferred gains and losses are recognized in income as a decrease or increase to interest expense in the period in which the related cash flows being hedged are recognized in expense. However, to the extent that the change in value of an interest rate hedge instrument does not perfectly offset the change in the value of the cash flow being hedged, that ineffective portion is immediately recognized in earnings.
The fair value of our debt was estimated at $5.419 billion as of August 31, 2019, and $4.948 billion as of August 25, 2018, based on the quoted market prices for the same or similar debt issues or on the current rates available to us for debt having the same remaining maturities. Such fair value is greater than the carrying value of debt by $212.7 million at August 31, 2019, which reflects its face amount, adjusted for any unamortized debt issuance costs and discounts. At August 25, 2018, the fair value was less than the carrying value of debt by $57.5 million.
We had $1.030 billion of variable rate debt outstanding at August 31, 2019, and $1.325 billion of variable rate debt outstanding at August 25, 2018. In fiscal 2019, at this borrowing level for variable rate debt, a one percentage point increase in interest rates would have had an unfavorable impact on our pre-tax earnings and cash flows of approximately $10.3 million. The primary interest rate exposure on variable rate debt is based on LIBOR.
We had outstanding fixed rate debt of $4.176 billion, net of unamortized debt issuance costs of $23.7 million, at August 31, 2019, and $3.681 billion, net of unamortized debt issuance costs of $19.4 million, at August 25, 2018. A one percentage point increase in interest rates would have reduced the fair value of our fixed rate debt by approximately $190.3 million at August 31, 2019.
Table of Contents
Foreign Currency Risk
Foreign currency exposures arising from transactions include firm commitments and anticipated transactions denominated in a currency other than our entities’ functional currencies. To minimize our risk, we generally enter into transactions denominated in the respective functional currencies. We are exposed to Brazilian reals, Canadian dollars, euros, Chinese yuan renminbi and British pounds, but our primary foreign currency exposure arises from Mexican peso-denominated revenues and profits and their translation into U.S. dollars. Foreign currency exposures arising from transactions denominated in currencies other than the functional currency are not material.
We view our investments in Mexican subsidiaries as long-term. As a result, we generally do not hedge these net investments. The net asset exposure in the Mexican subsidiaries translated into U.S. dollars using the year-end exchange rates was $328.8 million at August 31, 2019 and $590.7 million at August 25, 2018. The year-end exchange rates with respect to the Mexican peso decreased by approximately 7% and approximately 6% with respect to the U.S. dollar during fiscal 2019 and fiscal 2018. The loss in value of our net assets in the Mexican subsidiaries resulting from a hypothetical 10 percent adverse change in quoted foreign currency exchange rates at August 31, 2019 and August 25, 2018, would have been approximately $29.9 million and approximately $53.7 million, respectively. Any changes in our net assets in the Mexican subsidiaries relating to foreign currency exchange rates would be reflected in the foreign currency translation component of Accumulated Other Comprehensive Loss, unless the Mexican subsidiaries are sold or otherwise disposed.
A hypothetical 10 percent adverse change in average exchange rates would not have a material impact on our results of operations.
Table of Contents
Item 8. Financial Statements and Supplementary Data
Index
Table of Contents
Management’s Report on Internal Control Over Financial Reporting
Our management is responsible for establishing and maintaining adequate internal control over financial reporting (as defined in Rules 13a-15(f) and 15d-15(f) under the Securities Exchange Act of 1934, as amended). Our internal control over financial reporting includes, among other things, defined policies and procedures for conducting and governing our business, sophisticated information systems for processing transactions and properly trained staff. Mechanisms are in place to monitor the effectiveness of our internal control over financial reporting, including regular testing performed by the Company’s internal audit team. Actions are taken to correct deficiencies as they are identified. Our procedures for financial reporting include the active involvement of senior management, our Audit Committee and a staff of highly qualified financial and legal professionals.
Management, with the participation of our principal executive and financial officers, assessed our internal control over financial reporting as of August 31, 2019, the end of our fiscal year. Management based its assessment on criteria established in Internal Control—Integrated Framework issued by the Committee of Sponsoring Organizations of the Treadway Commission 2013 framework.
Based on this assessment, management has concluded that our internal control over financial reporting was effective as of August 31, 2019.
Our independent registered public accounting firm, Ernst & Young LLP, audited the effectiveness of our internal control over financial reporting. Ernst & Young LLP’s attestation report on the Company’s internal control over financial reporting as of August 31, 2019 is included in this Annual Report on Form 10-K.
| /s/ WILLIAM C. RHODES, III |
| William C. Rhodes, III |
| Chairman, President and |
| Chief Executive Officer |
| (Principal Executive Officer) |
| /s/ WILLIAM T. GILES |
| William T. Giles |
| Chief Financial Officer and Executive |
| Vice President – Finance, Information |
| Technology and Store Development |
| (Principal Financial Officer) |
Certifications
Compliance with NYSE Corporate Governance Listing Standards
On December 20, 2018, the Company submitted to the New York Stock Exchange the Annual CEO Certification required pursuant to Section 303A.12(a) of the New York Stock Exchange Listed Company Manual.
Rule 13a-14(a) Certifications of Principal Executive Officer and Principal Financial Officer
The Company has filed, as exhibits to its Annual Report on Form 10-K for the fiscal year ended August 31, 2019, the certifications of its Principal Executive Officer and Principal Financial Officer required pursuant to Section 302 of the Sarbanes-Oxley Act of 2002.
Table of Contents
Report of Independent Registered Public Accounting Firm
To the Board of Directors and Stockholders of AutoZone, Inc.
Opinion on Internal Control Over Financial Reporting
We have audited AutoZone Inc.’s internal control over financial reporting as of August 31, 2019, based on criteria established in Internal Control-Integrated Framework issued by the Committee of Sponsoring Organizations of the Treadway Commission (2013 framework) (the COSO criteria). In our opinion, AutoZone, Inc. (the Company) maintained, in all material respects, effective internal control over financial reporting as of August 31, 2019, based on the COSO criteria.
We also have audited, in accordance with the standards of the Public Company Accounting Oversight Board (United States) (PCAOB), the consolidated balance sheets of AutoZone, Inc. as of August 31, 2019 and August 25, 2018, and the related consolidated statements of income, comprehensive income, stockholders’ deficit, and cash flows for each of the three years in the period ended August 31, 2019, and the related notes and our report dated October 28, 2019, expressed an unqualified opinion thereon.
Basis for Opinion
The Company’s management is responsible for maintaining effective internal control over financial reporting, and for its assessment of the effectiveness of internal control over financial reporting included in the accompanying Management’s Report on Internal Control Over Financial Reporting. Our responsibility is to express an opinion on the Company’s internal control over financial reporting based on our audit. We are a public accounting firm registered with the PCAOB and are required to be independent with respect to the Company in accordance with the U.S. federal securities laws and the applicable rules and regulations of the Securities and Exchange Commission and the PCAOB.
We conducted our audit in accordance with the standards of the PCAOB. Those standards require that we plan and perform the audit to obtain reasonable assurance about whether effective internal control over financial reporting was maintained in all material respects.
Our audit included obtaining an understanding of internal control over financial reporting, assessing the risk that a material weakness exists, testing and evaluating the design and operating effectiveness of internal control based on the assessed risk, and performing such other procedures as we considered necessary in the circumstances. We believe that our audit provides a reasonable basis for our opinion.
Definition and Limitations of Internal Control Over Financial Reporting
A company’s internal control over financial reporting is a process designed to provide reasonable assurance regarding the reliability of financial reporting and the preparation of financial statements for external purposes in accordance with generally accepted accounting principles. A company’s internal control over financial reporting includes those policies and procedures that (1) pertain to the maintenance of records that, in reasonable detail, accurately and fairly reflect the transactions and dispositions of the assets of the company; (2) provide reasonable assurance that transactions are recorded as necessary to permit preparation of financial statements in accordance with generally accepted accounting principles, and that receipts and expenditures of the company are being made only in accordance with authorizations of management and directors of the company; and (3) provide reasonable assurance regarding prevention or timely detection of unauthorized acquisition, use, or disposition of the company’s assets that could have a material effect on the financial statements.
Table of Contents
Because of its inherent limitations, internal control over financial reporting may not prevent or detect misstatements. Also, projections of any evaluation of effectiveness to future periods are subject to the risk that controls may become inadequate because of changes in conditions, or that the degree of compliance with the policies or procedures may deteriorate.
| /s/ Ernst & Young LLP |
Memphis, Tennessee
October 28, 2019
Table of Contents
Report of Independent Registered Public Accounting Firm
To the Board of Directors and Stockholders of AutoZone, Inc.
**Opinion on the Financial Statements
Showing the first 8K of 140K characters. Open the full section
Item 9. Changes In and Disagreements with Accountants on Accounting and Financial Disclosure
Not applicable.
Item 9A. Controls and Procedures
As of August 31, 2019, an evaluation was performed under the supervision and with the participation of AutoZone’s management, including the Chief Executive Officer and the Chief Financial Officer, of the effectiveness of the design and operation of our disclosure controls and procedures, as defined in Rules 13a-15(e) and 15d-15(e) under the Exchange Act, as amended. Based on that evaluation, our management, including the Chief Executive Officer and the Chief Financial Officer, concluded that our disclosure controls and procedures were effective as of August 31, 2019.
Changes in Internal Controls
There were no changes in our internal control over financial reporting that occurred during the quarter ended August 31, 2019 that have materially affected, or are reasonably likely to materially affect, our internal control over financial reporting.
Item 9B. Other Information
Item 10. Directors, Executive Officers and Corporate Governance
The information set forth in Part I of this document in the section entitled “Information about our Executive Officers,” is incorporated herein by reference in response to this item. Additionally, the information contained in AutoZone, Inc.’s Proxy Statement dated October 28, 2019, in the sections entitled “Proposal 1 – Election of Directors” and “Delinquent Section 16(a) Reports,” is incorporated herein by reference in response to this item.
The Company has adopted a Code of Ethical Conduct for Financial Executives that applies to its chief executive officer, chief financial officer, chief accounting officer and other financial executives. The Company has made the Code of Ethical Conduct available at www.autozone.com, by clicking “Investor Relations” located at the bottom of the page.
Item 11. Executive Compensation
The information contained in AutoZone, Inc.’s Proxy Statement dated October 28, 2019, in the section entitled “Executive Compensation,” is incorporated herein by reference in response to this item.
Item 12. Security Ownership of Certain Beneficial Owners and Management and Related Stockholder Matters
The information contained in AutoZone, Inc.’s Proxy Statement dated October 28, 2019, in the sections entitled “Security Ownership of Management and Board of Directors,” “Security Ownership of Certain Beneficial Owners” and “Equity Compensation Plans – Summary Table” is incorporated herein by reference in response to this item.
Item 13. Certain Relationships and Related Transactions, and Director Independence
Not applicable.
Item 14. Principal Accounting Fees and Services
The information contained in AutoZone, Inc.’s Proxy Statement dated October 28, 2019, in the section entitled “Proposal 2 – Ratification of Independent Registered Public Accounting Firm,” is incorporated herein by reference in response to this item.
Table of Contents
PART IV
Item 15. Exhibits and Financial Statement Schedules
The following information required under this item is filed as part of this report.
(a) Financial Statements
The following financial statements, related notes and reports of independent registered public accounting firm are filed with this Annual Report on Form 10-K in Part II, Item 8:
| Reports of Independent Registered Public Accounting Firm |
| Consolidated Statements of Income for the fiscal years ended August 31, 2019, August 25, 2018, and August 26, 2017 |
| Consolidated Statements of Comprehensive Income for the fiscal years ended August 31, 2019, August 25, 2018, and August 26, 2017 |
| Consolidated Balance Sheets as of August 31, 2019, and August 25, 2018 |
| Consolidated Statements of Cash Flows for the fiscal years ended August 31, 2019, August 25, 2018, and August 26, 2017 |
| Consolidated Statements of Stockholders’ Deficit for the fiscal years ended August 31, 2019, August 25, 2018, and August 26, 2017 |
| Notes to Consolidated Financial Statements |
(b) Exhibits
The following exhibits are being filed herewith:
Table of Contents
Table of Contents
Table of Contents
Table of Contents
| * | Management contract or compensatory plan or arrangement. |
|---|
(c) Financial Statement Schedules
Schedules are omitted because the information is not required or because the information required is included in the financial statements or notes thereto.
Table of Contents
Item 16. Form 10-K Summary
None.
Table of Contents
SIGNATURES
Pursuant to the requirements of Section 13 or 15(d) of the Securities Exchange Act of 1934, the Registrant has duly caused this report to be signed on its behalf by the undersigned, thereunto duly authorized.
| AUTOZONE, INC. | ||
| By: | /s/ WILLIAM C. RHODES, III | |
| William C. Rhodes, III | ||
| Chairman, President and | ||
| Chief Executive Officer | ||
| (Principal Executive Officer) |
Dated: October 28, 2019
Table of Contents
Pursuant to the requirements of the Securities Exchange Act of 1934, this report has been signed below by the following persons on behalf of the Registrant and in the capacities and on the dates indicated:
| SIGNATURE | TITLE | DATE | ||
| /s/ WILLIAM C. RHODES, III | Chairman, President and Chief Executive Officer | October 28, 2019 | ||
| William C. Rhodes, III | (Principal Executive Officer) | |||
| /s/ WILLIAM T. GILES | Chief Financial Officer and Executive Vice | October 28, 2019 | ||
| William T. Giles | President – Finance, Information Technology and | |||
| Store Development (Principal Financial Officer) | ||||
| /s/ CHARLIE PLEAS, III | Senior Vice President and Controller | October 28, 2019 | ||
| Charlie Pleas, III | (Principal Accounting Officer) | |||
| /s/ DOUGLAS H. BROOKS | Director | October 28, 2019 | ||
| Douglas H. Brooks | ||||
| /s/ MICHAEL M. CALBERT | Director | October 28, 2019 | ||
| Michael M. Calbert | ||||
| /s/ LINDA A. GOODSPEED | Director | October 28, 2019 | ||
| Linda A. Goodspeed | ||||
| /s/ EARL G. GRAVES, JR. | Director | October 28, 2019 | ||
| Earl, G. Graves, Jr. | ||||
| /s/ ENDERSON GUIMARAES | Director | October 28, 2019 | ||
| Enderson Guimaraes | ||||
| /s/ D. BRYAN JORDAN | Director | October 28, 2019 | ||
| D. Bryan Jordan | ||||
| /s/ GALE V. KING | Director | October 28, 2019 | ||
| Gale V. King | ||||
| /s/ W. ANDREW MCKENNA | Director | October 28, 2019 | ||
| W. Andrew McKenna | ||||
| /s/ GEORGE R. MRKONIC, JR. | Director | October 28, 2019 | ||
| George R. Mrkonic, Jr. | ||||
| /s/ LUIS P. NIETO | Director | October 28, 2019 | ||
| Luis P. Nieto | ||||
| /s/ JILL A. SOLTAU | Director | October 28, 2019 | ||
| Jill A. Soltau |