 filings.tools
Item 5. Market for Registrant’s Common Equity, Related Stockholder Matters and Issuer Purchases of Equity Securities.
3K characters. Original on sec.gov · Markdown
Item 5. Market for Registrant’s Common Equity, Related Stockholder Matters and Issuer Purchases of Equity Securities.
Ball Corporation common stock (BLL) is listed for trading on the New York Stock Exchange. There were 6,330 common shareholders of record on February 14, 2022. We intend to change the company’s ticker symbol from BLL to BALL immediately following our annual shareholders’ meeting in April 2022. A public press release will be issued 10 days prior to the actual change date.
Common Stock Repurchases
The following table summarizes the company’s repurchases of its common stock during the quarter ended December 31, 2021.
| | | | | | | | | | |
|---|---|---|---|---|---|---|---|---|---|
| Purchases of Securities | |||||||||
| ($ in millions) | Total Number of Shares Purchased (a) | AveragePricePaid per****Share | Total Number ofShares Purchased asPart of PubliclyAnnounced Plans orPrograms (a) | Maximum Number ofShares that May YetBe Purchased Underthe Plans or Programs(b) | |||||
| | | | | | | | | | |
| October 1 to October 31, 2021 | | 1,163,215 | | $ | 90.93 | | 1,163,215 | | 31,183,521 |
| November 1 to November 30, 2021 | | 1,683,252 | | | 93.32 | | 1,683,252 | | 29,500,269 |
| December 1 to December 31, 2021 | | 1,459,760 | | | 92.81 | | 1,459,760 | | 28,040,509 |
| Total | | 4,306,227 | | | 92.50 | | 4,306,227 | | |
| (a) | Includes any open market purchases (on a trade-date basis), share repurchase agreements and/or shares retained by the company to settle employee withholding tax liabilities. |
|---|
| (b) | The company has an ongoing repurchase program for which 50 million shares were authorized for repurchase by Ball’s Board of Directors. |
|---|
Shareholder Return Performance
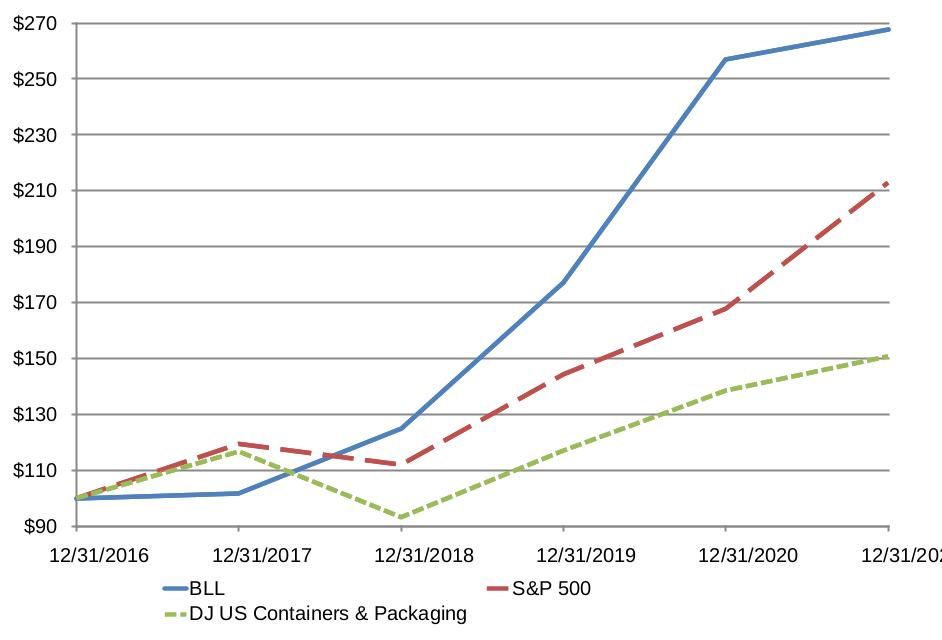
The line graph below compares the annual percentage change in Ball Corporation’s cumulative total shareholder return on its common stock with the cumulative total return of the Dow Jones Containers & Packaging Index and the S&P Composite 500 Stock Index for the five-year period ended December 31, 2021. The graph assumes $100 was invested on December 31, 2016, and that all dividends were reinvested. The Dow Jones Containers & Packaging Index total return has been weighted by market capitalization.
TOTAL RETURN TO STOCKHOLDERS
(Assumes $100 investment on 12/31/16)
Total Return Analysis
| | | | | | | | | | | | | | | | | | | |
|---|---|---|---|---|---|---|---|---|---|---|---|---|---|---|---|---|---|---|
| | | 12/31/2016 | | 12/31/2017 | | 12/31/2018 | | 12/31/2019 | | 12/31/2020 | | 12/31/2021 | ||||||
| BLL | | $ | 100.00 | | $ | 101.78 | | $ | 124.83 | | $ | 177.05 | | $ | 257.07 | | $ | 267.67 |
| S&P 500 | | | 100.00 | | | 119.42 | | | 111.97 | | | 144.31 | | | 167.77 | | | 212.89 |
| DJ US Containers & Packaging | | | 100.00 | | | 116.71 | | | 93.19 | | | 117.03 | | | 138.49 | | | 150.75 |
Source: Bloomberg L.P.® Charts
Previous: Item 4. Mine Safety Disclosures · Next: Item 6. [Reserved]