 filings.tools
Baxter International 10-K 2019-12-31
Filed 2020-03-17. 21 sections, 805K characters. Original on sec.gov · Markdown · JSON
Cover and table of contents
UNITED STATES
SECURITIES AND EXCHANGE COMMISSION
Washington, D.C. 20549
_____________________________________________________________________________________________
FORM 10-K
_____________________________________________________________________________________________
(Mark One)
| ☑ | ANNUAL REPORT PURSUANT TO SECTION 13 OR 15(d) OF THE SECURITIES EXCHANGE ACT OF 1934 |
For the fiscal year ended December 31, 2019
OR
| ☐ | TRANSITION REPORT PURSUANT TO SECTION 13 OR 15(d) OF THE SECURITIES EXCHANGE ACT OF 1934 |
For the transition period from __________ to __________
Commission file number 1-4448
_____________________________________________________________________________________________

Baxter International Inc.
(Exact Name of Registrant as Specified in its Charter)
_____________________________________________________________________________________________
| Delaware | 36-0781620 | |||||||||||||||||||
| (State or Other Jurisdiction of Incorporation or Organization) | (I.R.S. Employer Identification No.) | |||||||||||||||||||
| One Baxter Parkway, | Deerfield, | Illinois | 60015 | |||||||||||||||||
| (Address of Principal Executive Offices) | (Zip Code) |
Registrant’s telephone number, including area code 224.948.2000
Securities registered pursuant to Section 12(b) of the Act:
| Title of Each Class | Trading Symbol(s) | Name of Each Exchange on Which Registered | ||||||||||||
| Common stock, $1.00 par value | BAX (NYSE) | New York Stock Exchange | ||||||||||||
| Chicago Stock Exchange | ||||||||||||||
| 0.4% Global Notes due 2024 | BAX 24 | New York Stock Exchange | ||||||||||||
| 1.3% Global Notes due 2025 | BAX 25 | New York Stock Exchange | ||||||||||||
| 1.3% Global Notes due 2029 | BAX 29 | New York Stock Exchange |
Securities registered pursuant to Section 12(g) of the Act: None
_____________________________________________________________________________________________
Indicate by check mark if the registrant is a well-known seasoned issuer, as defined in Rule 405 of the Securities Act. Yes ☐ No ☑
Indicate by check mark if the registrant is not required to file reports pursuant to Section 13 or 15(d) of the Act. Yes ☐ No ☑
Indicate by check mark whether the registrant (1) has filed all reports required to be filed by Section 13 or 15(d) of the Securities Exchange Act of 1934 during the preceding 12 months (or for such shorter period that the registrant was required to file such reports), and (2) has been subject to such filing requirements for the past 90 days. Yes ☑ No ☐
Indicate by check mark whether registrant has submitted electronically every Interactive Data File required to be submitted and pursuant to Rule 405 of Regulation S-T during the preceding 12 months (or for such shorter period that the registrant was required to submit such files) Yes ☑ No ☐
Indicate by check mark whether the registrant is a large accelerated filer, an accelerated filer, a non-accelerated filer, a smaller reporting company or an emerging growth company. See the definitions of “large accelerated filer,” “accelerated filer,” “smaller reporting company” and “emerging growth company” in Rule 12b-2 of the Exchange Act.
| Large accelerated filer | ☑ | Accelerated filer | ☐ | |||||||||||
| Non-accelerated filer | ☐ | Smaller reporting company | ☐ | |||||||||||
| Emerging growth company | ☐ |
If an emerging growth company, indicate by check mark if the registrant has elected not to use the extended transition period for complying with any new or revised financial accounting standards provided pursuant to Section 13(a) of the Exchange Act. ☐
Indicate by check mark whether the registrant is a shell company (as defined in Rule 12b-2 of the Exchange Act). Yes ☐ No ☑
The aggregate market value of the voting common equity held by non-affiliates of the registrant as of June 28, 2019 (the last business day of the registrant’s most recently completed second fiscal quarter), based on the per share closing sale price of $81.90 on that date and the assumption for the purpose of this computation only that all of the registrant’s directors and executive officers are affiliates, was approximately $42 billion. The number of shares of the registrant’s common stock, $1.00 par value, outstanding as of February 29, 2020 was 507,263,731.
DOCUMENTS INCORPORATED BY REFERENCE
Portions of the registrant’s definitive 2020 proxy statement for use in connection with its Annual Meeting of Stockholders expected to be held on May 5, 2020 are incorporated by reference into Part III of this report.
TABLE OF CONTENTS
Explanatory Note
General
On February 13, 2020, we concluded, in consultation with the Audit Committee of our Board of Directors, that our consolidated financial statements as of December 31, 2018 and 2017, for the years ended December 31, 2018, 2017 and 2016, as of and for the interim periods within the years ended December 31, 2018 and 2017 and the interim periods ended June 30 and March 31, 2019 should no longer be relied upon because of misstatements to our previously reported foreign exchange gains and losses as described below.
Restatement
This Annual Report on Form 10-K for the year ended December 31, 2019 includes the following restated financial information:
-
audited consolidated financial statements as of December 31, 2018 and for the years ended December 31, 2018 and 2017;
-
unaudited interim financial information as of and for the quarterly periods ended June 30, 2019, March 31, 2019, June 30, 2018, and March 31, 2018, for the quarterly period ended December 31, 2018, for the six months ended June 30, 2019 and 2018, and as of September 30, 2018; and
-
unaudited selected financial data as of December 31, 2017 and as of and for the years ended December 31, 2016 and 2015. Selected financial data as of December 31, 2018 and for the years ended December 31, 2018 and 2017 is derived from our audited consolidated financial statements included in this Annual Report on Form 10-K.
Refer to our Quarterly Report on Form 10-Q for the quarterly period ended September 30, 2019, filed on March 17, 2020, for our unaudited restated interim financial statements for the three and nine months ended September 30, 2018 and related information.
Restatement Background
On October 24, 2019, we reported that we had commenced an internal investigation into certain intra-company transactions that impacted our previously reported non-operating foreign exchange gains and losses. Our internal investigation, as it pertains to the evaluation of related financial statement impacts, is complete.
We previously had applied a longstanding convention for the initial measurement of foreign exchange transactions and the subsequent remeasurement of foreign currency denominated monetary assets and liabilities that was not consistent with U.S. Generally Accepted Accounting Principles (U.S. GAAP). Beginning years after the adoption of that convention, certain intra-company transactions were undertaken, after the related exchange rates were already known, solely for the purpose of generating non-operating foreign exchange gains or avoiding foreign exchange losses. We believe that the use of our previous exchange rate convention to generate non-operating foreign exchange gains and avoid losses had occurred for at least ten years. The cumulative impact of correcting misstatements of non-operating foreign exchange gains and losses in periods prior to 2017 has been recorded as a reduction to our opening retained earnings in the consolidated financial statements included herein.
As previously disclosed, we voluntarily advised the staff of the Securities and Exchange Commission (SEC) of our internal investigation and are continuing to cooperate with the staff of the SEC.
Restatement of Previously Issued Consolidated Financial Statements
As described above, this Annual Report on Form 10-K includes audited restated financial statements as of December 31, 2018 and for the years ended December 31, 2018 and 2017. In addition to the correction of misstatements related to non-operating foreign exchange gains and losses, we corrected additional misstatements that were immaterial, individually and in the aggregate, to our previously issued financial statements. Those other immaterial misstatements relate to (i) equipment leased to customers under operating leases, (ii) classification of foreign exchange gains and losses on cash balances and intra-company receivables and payables in our consolidated statements of cash flows, (iii) translation of the financial position and results of operations of our foreign operations into U.S. dollars, (iv) statement of income classification of transition services income related to the separation of Baxalta Incorporated in 2015 and (v) other miscellaneous adjustments. See Note 2, Restatement of Previously Issued Consolidated Financial Statements, in Item 8, Financial Statements and Supplementary Data, for additional information.
Unaudited interim financial information as of and for the quarterly periods ended June 30, 2019, March 31, 2019, June 30, 2018, and March 31, 2018, for the quarterly period ended December 31, 2018, for the six months ended June 30, 2019 and 2018, and as of September 30, 2018 has also been restated. See Note 19, Quarterly Financial Data (Unaudited), in Item 8, Financial Statements and Supplementary Data, for additional information.
The restatement resulted in the following decreases to our previously reported income from continuing operations and diluted earnings per share from continuing operations (in millions, except per share data):
| Six months ended June 30, 2019 | Year ended December 31, 2018 | Year ended December 31, 2017 | |||||||||||||||
| Income from continuing operations | $ | (35) | $ | (78) | $ | (115) | |||||||||||
| Diluted earnings per share from continuing operations | $ | (0.07) | $ | (0.15) | $ | (0.20) |
Control Considerations
In connection with the restatement, management has reassessed its conclusions regarding the effectiveness of our internal control over financial reporting as of December 31, 2018 and has determined that a material weakness in our internal control over financial reporting existed as of that date. As a result of the material weakness, our disclosure controls and procedures were not effective as of December 31, 2018 and throughout 2019. Management has been implementing changes to strengthen our internal controls and remediate the material weakness, which continued to exist as of December 31, 2019. See Item 9A, Controls and Procedures, for additional information related to the material weakness in internal control over financial reporting and our related remediation activities.
PART I
Item 1. Business.
Company Overview
Baxter International Inc., through its subsidiaries, provides a broad portfolio of essential healthcare products, including acute and chronic dialysis therapies; sterile intravenous (IV) solutions; infusion systems and devices; parenteral nutrition therapies; inhaled anesthetics; generic injectable pharmaceuticals; and surgical hemostat and sealant products. Our global footprint and the critical nature of our products and services play a key role in expanding access to healthcare in emerging and developed countries. These products are used by hospitals, kidney dialysis centers, nursing homes, rehabilitation centers, doctors’ offices and by patients at home under physician supervision. As of December 31, 2019, we manufactured products in over 20 countries and sold them in over 100 countries.
Baxter International Inc. was incorporated under Delaware law in 1931. As used in this report, “Baxter International” means Baxter International Inc. and “we", "our” or "us" means Baxter International and its consolidated subsidiaries (after giving effect to the separation and distribution of Baxalta Incorporated (Baxalta), as further described below), unless the context otherwise requires.
Business Segments and Products
We manage our business based on three geographic segments: Americas (North and South America), EMEA (Europe, Middle East and Africa) and APAC (Asia-Pacific).
Each of our segments provides a broad portfolio of essential healthcare products, including acute and chronic dialysis therapies; sterile IV solutions; infusion systems and devices; parenteral nutrition therapies; inhaled anesthetics; generic injectable pharmaceuticals; and surgical hemostat and sealant products.
For financial information about our segments, see Note 18 in Item 8 of this Annual Report on Form 10-K.
Sales and Distribution
We have our own direct sales force and also make sales to and through independent distributors, drug wholesalers acting as sales agents and specialty pharmacy or other alternate site providers. In the United States, third parties, such as Cardinal Health, Inc., warehouse and ship a significant portion of our products through their distribution centers. These centers are generally stocked with adequate inventories to facilitate prompt customer service. Sales and distribution methods include frequent contact by sales and customer service representatives, automated communications via various electronic purchasing systems, circulation of catalogs and merchandising bulletins, direct-mail campaigns, trade publication presence and advertising.
Sales are made and products are distributed on a direct basis or through independent distributors or sales agents in more than 100 countries as of December 31, 2019.
International Operations
The majority of our revenues are generated outside of the United States and geographic expansion remains a component of our strategy. Our presence includes operations in Europe, the Middle East, Africa, Asia-Pacific, Latin America and Canada. We are subject to certain risks inherent in conducting business outside the United States. For more information on these risks, see the information under the captions “Risks Related to Baxter’s Business —We are subject to risks associated with doing business globally” and “— Changes in foreign currency exchange rates and interest rates could have a material adverse effect on our operating results and liquidity” in Item 1A of this Annual Report on Form 10-K.
For financial information about foreign and domestic operations and geographic information, see Note 18 in Item 8 of this Annual Report on Form 10-K. For more information regarding foreign currency exchange risk, refer to the discussion under the caption entitled “Financial Instrument Market Risk” in Item 7 of this Annual Report on Form 10-K.
Contractual Arrangements
Our products are sold through contracts with customers, both within and outside the United States. Some of these contracts have terms of more than one year and place limits on our ability to increase prices. In the case of hospitals, governments and other facilities, these contracts may specify minimum quantities of a particular product or categories of products to be purchased by the customer.
In keeping with the increased emphasis on cost-effectiveness in healthcare delivery, many hospitals and other customers of medical products in the United States have joined group purchasing organizations (GPOs), or formed integrated delivery networks (IDNs), to enhance purchasing power. GPOs and IDNs negotiate pricing arrangements with manufacturers and distributors and the negotiated prices are made available to members. We have purchasing agreements with several of the major GPOs in the United States. GPOs may have agreements with more than one supplier for certain products. Accordingly, in these cases, we face competition from other suppliers even where a customer is a member of a GPO under contract with us. Purchasing power is similarly consolidated in many other countries. For example, public contracting authorities act as the purchasing entities for the hospitals and other customers of medical products in their region and many hospitals and other customers have joined joint procurement entities and buying consortia. The result is that demand for healthcare products is increasingly concentrated across our markets globally.
Raw Materials
Raw materials essential to our business are purchased from numerous suppliers worldwide in the ordinary course of business. Although most of these materials are generally available, we at times may experience shortages of supply. In an effort to manage risk associated with raw materials supply, we work closely with our suppliers to help ensure availability and continuity of supply while maintaining high quality and reliability. We also seek to develop new and alternative sources of supply where beneficial to our overall raw materials procurement strategy.
We are not always able to recover cost increases for raw materials through customer pricing due to contractual limits and market forces. Accordingly, we utilize long-term supply contracts with some suppliers to help maintain continuity of supply and manage the risk of price increases.
In connection with the separation and distribution of Baxalta, we entered into a long-term manufacturing and supply agreement with Baxalta. Baxalta manufactures and supplies us with ARTISS, TISSEEL, FLOSEAL and stand-alone thrombin, on a cost-plus basis, under that manufacturing and supply agreement.
Competition and Healthcare Cost Containment
Our businesses benefit from a number of competitive advantages, including the breadth and depth of our product offerings, our strong relationships with customers, including hospitals and clinics, GPOs, physicians, and patients, many of whom self-administer home-based therapies that we supply. We also benefit from efficiencies and cost advantages resulting from shared manufacturing facilities and the technological advantages of our products.
Although no single company competes with us in all of our businesses, we face substantial competition in each of our segments from international and domestic healthcare and pharmaceutical companies and providers of all sizes, and these competitors often differ across our businesses. In addition, global and regional competitors continue to expand their manufacturing capacity and sales and marketing channels. Competition is primarily focused on cost-effectiveness, price, service, product performance, and technological innovation. There has been increasing consolidation in our customer base and by our competitors, which continues to result in pricing and market pressures.
Global efforts toward healthcare cost containment continue to exert pressure on product pricing. Governments around the world use various mechanisms to control healthcare expenditures, such as price controls, the formation of public contracting authorities, product formularies (lists of recommended or approved products), and competitive tenders which require the submission of a bid to sell products. Sales of our products are dependent, in part, on the availability of reimbursement by government agencies and healthcare programs, as well as insurance companies and other private payers. In the United States, the federal and many state governments have adopted or proposed initiatives relating to Medicaid and other health programs that may limit reimbursement or increase rebates that we and other providers are required to pay to the state. In addition to government regulation, managed care organizations in the United States, which include medical insurance companies, medical plan administrators, health-maintenance organizations, hospital and physician alliances and pharmacy benefit managers, continue to put pressure on the price and usage of healthcare products. Managed care organizations seek to contain healthcare expenditures, and their purchasing strength has been increasing due to their consolidation into fewer, larger organizations and a growing number of enrolled patients. We face similar issues outside of the United States. In Europe and Latin America, for example, the government provides healthcare at low cost to patients, and controls its expenditures by purchasing products through public tenders, collective purchasing, regulating prices, setting reference prices in public tenders or limiting reimbursement or patient access to certain products.
Intellectual Property
Patents and other proprietary rights are essential to our business. We rely on patents, trademarks, copyrights, trade secrets, know-how and confidentiality agreements to develop, maintain and strengthen our competitive position. We own a number of patents and trademarks throughout the world and have entered into license arrangements relating to various third-party patents and technologies. Products manufactured by us are sold primarily under our own trademarks and trade names. Some products distributed by us are sold under our trade names, while others are sold under trade names owned by our suppliers or partners. Trade secret protection of unpatented confidential and proprietary information is also important to us. We maintain certain details about our processes, products and technology as trade secrets and generally require employees, consultants, and business partners to enter into confidentiality agreements. These agreements may be breached and we may not have adequate remedies for any breach. In addition, our trade secrets may otherwise become known or be independently discovered by competitors. To the extent that our employees, consultants, and business partners use intellectual property owned by others in their work for us, disputes may arise as to the rights in related or resulting know-how and inventions.
Our policy is to protect our products and technology through patents and trademarks on a worldwide basis. This protection is sought in a manner that balances the cost of such protection against obtaining the greatest value for us. We also recognize the need to promote the enforcement of our patents and trademarks and take commercially reasonable steps to enforce our patents and trademarks around the world against potential infringers, including judicial or administrative action where appropriate.
We operate in an industry susceptible to significant patent litigation. At any given time, we are involved as either a plaintiff or defendant in a number of patent infringement and other intellectual property-related actions. Such litigation can result in significant royalty or other payments or result in injunctions that can prevent the sale of products. For more information on patent and other litigation, see Note 9 in Item 8 of this Annual Report on Form 10-K.
Research and Development
Our investment in research and development (R&D), consistent with our portfolio optimization and capital allocation strategies, helps fuel our future growth and our ability to remain competitive in each of our product categories. Accordingly, we continue to focus our investment on select R&D programs to enhance future growth through clinical differentiation. Expenditures for our R&D activities were $595 million in 2019, $654 million in 2018, and $615 million in 2017. These expenditures include costs associated with R&D activities performed at our R&D centers located
around the world, which include facilities in Belgium, Sweden, India, Italy, Germany, China, Japan and the United States, as well as in-licensing, milestone and reimbursement payments made to partners for R&D work performed at non-Baxter locations.
For more information on our R&D activities, refer to the discussion under the caption entitled “Strategic Objectives” in Item 7 of this Annual Report on Form 10-K.
Quality Management
Our continued success depends upon the quality of our products. Quality management plays an essential role in determining and meeting customer requirements, preventing defects, facilitating continuous improvement of our processes, products and services, and assuring the safety and efficacy of our products. Our quality system enables the design, development, manufacturing, packaging, sterilization, handling, distribution and labeling of our products to ensure that they conform to customer requirements. In order to continually improve the effectiveness and efficiency of our quality system, various measurement, monitoring and analysis methods, such as management reviews and internal, external and vendor audits, are employed at local and central levels.
Each product that we market is required to meet specific quality standards, both in packaging and in product integrity and quality. If any of those is determined to be compromised at any time, we endeavor to take corrective and preventive actions designed to ensure compliance with regulatory requirements and to meet customer expectations. For more information on corrective actions taken by us, refer to the discussion under the caption entitled “Certain Regulatory Matters” in Item 7 of this Annual Report on Form 10-K.
Government Regulation
Our operations and many of the products manufactured or sold by us are subject to extensive regulation by numerous government agencies, both within and outside the United States. The Food and Drug Administration (FDA) in the United States, the European Medicines Agency (EMA) in Europe, the China Food and Drug Administration (CFDA) in China and other government agencies, inside and outside of the United States, administer requirements covering the testing, safety, effectiveness, manufacturing, labeling, promotion and advertising, distribution and post-market surveillance of our products. We must obtain specific approval from FDA and non-U.S. regulatory authorities before we can market and sell most of our products in a particular country. Even after we obtain regulatory approval to market a product, the product and our manufacturing processes and quality systems are subject to continued review by FDA and other regulatory authorities globally, including additional 510(k) and other regulatory submissions, and approvals or the time needed to secure approvals are not certain. State agencies in the United States also regulate our facilities, operations, employees, products and services within their respective states. We, along with our facilities, are subject to periodic inspections and possible administrative and legal actions by FDA and other regulatory agencies inside and outside the United States. Such actions may include warning letters, product recalls or seizures, monetary sanctions, injunctions to halt the manufacture and distribution of products, civil or criminal sanctions, refusal of a government to grant approvals or licenses, restrictions on operations or withdrawal of existing approvals and licenses. As situations require, we take steps to ensure safety and efficacy of our products, such as removing products found not to meet applicable requirements from the market and improving the effectiveness of quality systems. For more information on compliance actions taken by us, refer to the discussion under the caption entitled “Certain Regulatory Matters” in Item 7 of this Annual Report on Form 10-K.
We are also subject to various laws inside and outside the United States concerning our relationships with healthcare professionals and government officials, price reporting and regulation, the promotion, sales and marketing of our products and services, the importation and exportation of products, the operation of our facilities and distribution of products. In the United States, we are subject to the oversight of FDA, Office of the Inspector General within the Department of Health and Human Services (OIG), the Center for Medicare/Medicaid Services (CMS), the Department of Justice (DOJ), Environmental Protection Agency, Department of Defense and Customs and Border Protection in addition to others. We supply products and services to healthcare providers that are reimbursed by federally funded programs such as Medicare. As a result, our activities are subject to regulation by CMS and enforcement by OIG and DOJ. In each jurisdiction outside the United States, our activities are subject to regulation by government agencies including the EMA in Europe, CFDA in China and other agencies in other jurisdictions. Many of the agencies enforcing these laws have increased their enforcement activities with respect to healthcare companies in recent years. These actions appear to be part of a general trend toward increased enforcement activity globally.
Our operations involve the use of substances regulated under environmental laws, primarily in manufacturing and sterilization processes. Our environmental policies require compliance with all applicable environmental regulations and contemplate, among other things, appropriate capital expenditures for environmental protection.
Separation of Baxalta
On July 1, 2015, we completed the distribution of approximately 80.5% of the outstanding common stock of Baxalta to our stockholders (the Distribution). The Distribution was made to our stockholders of record as of the close of business on June 17, 2015 (the Record Date), who received one share of Baxalta common stock for each of our shares held as of the Record Date. As a result of the distribution, Baxalta became an independent public company.
In 2016, we disposed of our remaining 19.5% interest in Baxalta through a series of transactions, including debt-for-equity exchanges, an equity-for-equity exchange and a contribution to our U.S. pension plan. As a result of these transactions, we extinguished approximately $3.65 billion of our indebtedness, repurchased 11,526,638 of our shares and contributed 17,145,570 Baxalta shares to our U.S. pension plan. On June 3, 2016, Baxalta became a wholly-owned subsidiary of Shire plc (Shire). In January 2019, Takeda Pharmaceutical Company Limited (Takeda) acquired Shire.
As a result of the separation, the consolidated statements of income, consolidated balance sheets, consolidated statements of cash flow, and related financial information reflect Baxalta’s operations, assets and liabilities, and cash flows as discontinued operations for all periods presented.
Refer to Note 3 in Item 8 of this Annual Report on Form 10-K for additional information regarding the separation of Baxalta.
Employees
As of December 31, 2019, Baxter employed approximately 50,000 people.
Available Information
We make available free of charge on our website at www.baxter.com our Annual Reports on Form 10-K, Quarterly Reports on Form 10-Q, Current Reports on Form 8-K, and amendments to those reports filed or furnished pursuant to Section 13(a) or 15(d) of the Securities Exchange Act of 1934, as amended (Exchange Act), as soon as reasonably practicable after electronically filing or furnishing such material with the Securities and Exchange Commission. These reports are also available free of charge via EDGAR through the Securities and Exchange Commission website (www.sec.gov). In addition, our Corporate Governance Guidelines, Code of Conduct, and the charters for the committees of our Board of Directors are available on our website at www.baxter.com under “About Baxter—About us — Governance.” All the foregoing materials will be made available to stockholders in print upon request by writing to: Corporate Secretary, Baxter International Inc., One Baxter Parkway, Deerfield, Illinois 60015. Information contained on our website shall not be deemed incorporated into, or to be a part of, this Annual Report on Form 10-K.
Item 1A. Risk Factors.
In addition to the other information in this Annual Report on Form 10-K, stockholders or prospective investors should carefully consider the following risk factors. If any of the events described below occurs, our business, financial condition, results of operations, future growth prospects and stock price could suffer.
If we are unable to successfully introduce new products or fail to keep pace with advances in technology, our business, financial condition and results of operations could be adversely affected.
We need to successfully introduce new products to achieve our strategic business objectives. Product development requires substantial investment and there is inherent risk in the R&D process. A successful product development process depends on many factors, including our ability to properly anticipate and satisfy customer needs, adapt to new technologies, obtain regulatory approvals on a timely basis, demonstrate satisfactory clinical results, manufacture products in an economical and timely manner and differentiate our products from those of our competitors. If we cannot successfully introduce new products or adapt to changing technologies, our products may become obsolete and our revenue and profitability could suffer.
Issues with product supply or quality could have an adverse effect on our business, subject us to regulatory actions, or cause a loss of customer confidence in us or our products, among other negative consequences.
Our success depends upon the availability and quality of our products. The pharmaceutical and medical products industries are competitive and subject to complex market dynamics and varying demand levels. These levels vary in response to macro-economic conditions, regulatory requirements (including the availability of private or public reimbursement), seasonality, natural disasters, epidemics and other matters. Additionally, the development of new or enhanced products involves a lengthy regulatory process and is capital intensive. As a result, our ability to match our production levels and capacity to market demand is imprecise and may result in a failure to meet market demand or satisfy customer requirements for our products or, alternatively, an oversupply of inventory. Failure to meet market demand may result in customers transitioning to available competitive products, loss of market share, negative publicity, reputational damage, loss of customer confidence or other negative consequences (including a decline in stock price). In the event of an oversupply, we may be forced to lower our prices, record asset impairment charges or take other actions, which may adversely affect our business, financial condition and results of operations.
Additionally, quality management plays an essential role in determining and meeting customer requirements, preventing defects, improving our products and services and assuring the safety and efficacy of our products. Our future success depends on our ability to maintain and continuously improve our quality management program. While we have a quality system that covers the lifecycle of our products, quality and safety issues have and may in the future occur with respect to our products. A quality or safety issue may result in adverse inspection reports, voluntary or official action indicated, warning letters, import bans, product recalls (either voluntary or required by FDA or similar governmental authorities in other countries) or seizures, monetary sanctions, injunctions to halt manufacture and distribution of products, civil or criminal sanctions, costly litigation, refusal of a government to grant approvals and licenses, restrictions on operations or withdrawal of existing approvals and licenses. An inability to address a quality or safety issue in an effective and timely manner may also cause negative publicity, a loss of customer confidence in us or our current or future products, which may result in the loss of sales and difficulty in successfully launching new products. Additionally, Baxter has made and continues to make significant investments in assets, including inventory and property, plant and equipment, which relate to potential new products or modifications to existing products. Product quality or safety issues may restrict us from being able to realize the expected returns from these investments, potentially resulting in asset impairments in the future.
Unaffiliated third party suppliers provide a number of goods and services to our R&D, clinical and manufacturing organizations. Third party suppliers are required to comply with our quality standards. Failure of a third party supplier to provide compliant raw materials or supplies could result in delays, service interruptions or other quality related issues that may negatively impact our business results.
For more information on regulatory matters currently affecting us, including quality-related matters, refer to the discussion under the caption entitled “Certain Regulatory Matters” in Item 7 of this Annual Report on Form 10-K.
If we are unable to obtain sufficient components or raw materials on a timely basis or for a cost-effective price or if we experience other manufacturing, sterilization or supply difficulties, our business and results of operations may be adversely affected.
The manufacture of our products requires, among other things, the timely supply or delivery of sufficient amounts of quality components and materials. We manufacture our products in approximately 50 manufacturing facilities around the world. We acquire our components, materials and other requirements for manufacturing from many suppliers and vendors in various countries, including sometimes from ourselves for self-supplied requirements. We endeavor, either alone or working closely with our suppliers, to ensure the continuity of our inputs and supplies but we cannot guarantee these efforts will always be successful. Further, while efforts are made to diversify certain of our sources of components and materials, in certain instances there is only a sole source or supplier with no alternatives yet identified. For most of our components and materials for which a single source or supplier is used, alternative sources or suppliers may exist, but we have made a strategic determination to use the single source or supplier. Although we do carry strategic inventory and maintain insurance to help mitigate the potential risk related to any related supply disruption, there can be no assurance that such measures will be sufficient or effective. A reduction or interruption in supply and an inability to quickly develop acceptable alternative sources for such supply, could adversely affect our ability to manufacture and distribute our products in a timely or cost-effective manner, and our ability to make product sales. Additionally, volatility in our costs of energy, transportation/freight, components, raw materials and other supply, manufacturing and distribution costs could adversely affect our results of operations. Climate change (including laws or regulations passed in response thereto) could increase our costs, in particular our
costs of supply, energy and transportation/freight. Material or sustained increases in the price of oil could have an adverse impact on the cost of many of the plastic materials we use to make and package our products, as well as our transportation/freight costs. These outcomes may in turn result in customers transitioning to available competitive products, loss of market share, negative publicity, reputational damage, loss of customer confidence or other negative consequences (including a decline in stock price).
Many of our products are difficult to manufacture. This is due to the complex nature of manufacturing pharmaceuticals, including biologics, and devices, as well as the strict regulatory regime governing our manufacturing operations. Variations in the manufacturing process may result in product
Showing the first 8K of 69K characters. Open the full section
Item 1B. Unresolved Staff Comments.
None.
Item 2. Properties.
Our corporate offices are owned and located at One Baxter Parkway, Deerfield, Illinois 60015.
We own or have long-term leases on all of our manufacturing facilities. The location of the principal manufacturing facilities of each of our geographic segments are listed below:
| Region | Location | Owned/Leased | ||||||
| Americas | ||||||||
| Aibonito, Puerto Rico | Leased | |||||||
| Alliston, Canada | Owned | |||||||
| Cali, Colombia | Owned | |||||||
| Cartago, Costa Rica | Owned | |||||||
| Cuernavaca, Mexico | Owned | |||||||
| Guayama, Puerto Rico | Owned | |||||||
| Haina, Dominican Republic | Leased | |||||||
| Hayward, California | Leased | |||||||
| Round Lake, Illinois | Owned | |||||||
| Bloomington, Indiana | Owned/Leased(1) | |||||||
| Cleveland, Mississippi | Leased | |||||||
| Medina, New York | Leased | |||||||
| Jayuya, Puerto Rico | Leased | |||||||
| Opelika, Alabama | Owned | |||||||
| Brooklyn Park, Minnesota | Leased | |||||||
| Pesa, Mexico | Leased | |||||||
| Sao Paulo, Brazil | Owned | |||||||
| Tijuana, Mexico | Owned | |||||||
| Mountain Home, Arkansas | Owned/Leased(1) | |||||||
| North Cove, North Carolina | Owned | |||||||
| St. Paul, Minnesota | Leased | |||||||
| Irvine, California | Owned | |||||||
| Mountain View, California | Leased | |||||||
| APAC | ||||||||
| Ahmedabad, India | Owned | |||||||
| Guangzhou, China | Owned | |||||||
| Shanghai, China | Owned | |||||||
| Suzhou, China | Owned | |||||||
| Toongabbie, Australia | Owned | |||||||
| Woodlands, Singapore | Owned/Leased(2) | |||||||
| Canlubang, Philippines | Leased | |||||||
| Amata, Thailand | Owned | |||||||
| Tianjin, China | Owned | |||||||
| Miyazaki, Japan | Owned | |||||||
| EMEA | ||||||||
| Castlebar, Ireland | Owned | |||||||
| Grosotto, Italy | Owned | |||||||
| Halle, Germany | Owned | |||||||
| Hechingen, Germany | Leased | |||||||
| Lessines, Belgium | Owned | |||||||
| Liverpool, United Kingdom | Leased | |||||||
| Lund, Sweden | Leased | |||||||
| Marsa, Malta | Owned | |||||||
| Medolla, Italy | Owned | |||||||
| Meyzieu, France | Owned | |||||||
| Rostock, Germany | Leased | |||||||
| Sabinanigo, Spain | Owned | |||||||
| San Vittore, Switzerland | Owned | |||||||
| Sondalo, Italy | Owned | |||||||
| Swinford, Ireland | Owned | |||||||
| Thetford, United Kingdom | Owned | |||||||
| Elstree, United Kingdom | Leased | |||||||
| Tunis, Tunisia | Owned | |||||||
| Dammam, Saudi Arabia | Owned |
(1)Includes both owned and leased facilities.
(2)We own the facility located at Woodlands, Singapore and lease the property upon which it rests.
We also own or operate shared distribution facilities throughout the world. In the United States and Puerto Rico, there are six shared distribution facilities with the principal facilities located in Memphis, Tennessee; Cataño, Puerto Rico; North Cove, North Carolina; and Round Lake, Illinois. Internationally, we have more than 100 shared distribution facilities located in Argentina, Australia, Austria, Belgium, Brazil, Canada, Chile, China, Colombia, Costa Rica, the Czech Republic, Ecuador, France, Germany, Greece, Guatemala, Hong Kong, India, Ireland, Italy, Japan, Korea, Mexico, New Zealand, Panama, the Philippines, Poland, Portugal, Russia, Singapore, Spain, Sweden, Switzerland, Thailand, Turkey, the United Arab Emirates, and the United Kingdom.
We continually evaluate our plants and production lines and believe that our current facilities plus any planned expansions are generally sufficient to meet our expected needs and expected near-term growth. Expansion projects and facility closings will be undertaken as necessary in response to market needs.
Item 3. Legal Proceedings.
Incorporated by reference to Note 9 in Item 8 of this Annual Report on Form 10-K.
Item 4. Mine Safety Disclosures.
Not Applicable.
Executive Officers of the Registrant
As of March 17, 2020, the following serve as Baxter’s executive officers:
José E. Almeida, age 57, is Chairman, President and Chief Executive Officer, having served in that capacity since January 2016. He began serving as an executive officer of the company in October 2015. He served as Senior Advisor with The Carlyle Group from May 2015 until October 2015. Previously, he served as the Chairman, President and Chief Executive Officer of Covidien plc (Covidien) from March 2012 to January 2015, prior to Medtronic plc’s (Medtronic) acquisition of Covidien, and President and Chief Executive Officer of Covidien from July 2011 to March 2012. Mr. Almeida served in other executive roles with Covidien (formerly Tyco Healthcare (Tyco)) between April 2004 and June 2011. Mr. Almeida is a member of the Board of Directors of Walgreens Boots Alliance, Inc.
Giuseppe Accogli, age 49, is Senior Vice President and President, Americas. Prior to his current role, Mr. Accogli served as Senior Vice President and President, Global Businesses, from 2017 to 2019. He also served as Corporate Vice President and President, Renal from 2016 to 2017 and as Head of the U.S. region for Baxter’s Renal business from 2015 to 2016. Mr. Accogli joined Baxter in 2007 as Renal business unit Director in Italy, and assumed positions of increasing responsibility with the Renal business in Europe, including Head of the EMEA region for Renal from 2013 to 2015. Previously he worked as a Business Unit Manager and Sales and Marketing Manager for Medtronic plc in Italy, and in several sales, product and marketing roles for Tyco and then Covidien in Italy and EMEA. Mr. Accogli has served as a director to AdvaMed, an American medical device trade association, since September 25, 2019.
Cristiano Franzi, age 57, is Senior Vice President and President, EMEA. Mr. Franzi joined Baxter in September 2017 from Medtronic, where he served as Vice President and President, Minimally Invasive Therapies Group EMEA from 2015 to August 2017. He served as President EMEA at Covidien prior to Medtronic’s acquisition of Covidien. He joined Covidien in 2009 and held roles of increasing responsibility during his tenure. He held a number of commercial and functional roles across Europe, the Middle East and Africa at ev3 Endovascular, Inc., Boston Scientific Corporation and Becton, Dickinson & Co. earlier in his career. He served as a member of the board of Eucomed Medical Technology from 2013 to 2015 and again from 2018 to 2019.
Andrew Frye, age 54, is Senior Vice President and President, APAC. Mr. Frye joined Baxter in 2017 from DKSH Holdings Ltd., where he served as Global Head of Healthcare from 2015 to 2017. In that role, he oversaw a portfolio of pharmaceuticals, over-the-counter and device products across 13 countries. Previously, he served as Vice President of Business Development from 2011 to 2014 for DKSH Healthcare. Earlier in his career, he held a number of commercial roles with increasing responsibility at Abbott Laboratories’ Pharmaceutical and Nutrition divisions.
Jacqueline Kunzler, age 54, is Senior Vice President and Chief Quality Officer. Ms. Kunzler joined Baxter in 1993 and has served in roles of increasing responsibility across Baxter’s research & development, international marketing, and quality organizations, most recently as Senior Vice President, Chief Quality Officer.
Sean Martin, age 57, is Senior Vice President and General Counsel. Mr. Martin joined Baxter in 2017 from Apollo Education Group, Inc., where he served as Senior Vice President, General Counsel and Secretary from 2010 to 2017. Previously, he served as Assistant Secretary (2010), Vice President of Corporate Law (2009 to 2010) and Vice President of Commercial Law (2005 to 2009) for Amgen Inc. He also served as Vice President and Deputy General Counsel at Fresenius Medical Care North America from 2000 to 2005. Mr. Martin was a Partner at the law firm Foley & Lardner LLP from 1998 to 2000 and served eight years as Assistant U.S. Attorney for the Northern District of Illinois.
Jeanne K. Mason, Ph.D., age 64, is Senior Vice President, Human Resources. Ms. Mason joined Baxter in 2006 from GE Insurance Solutions, a primary insurance and reinsurance business, where she was responsible for global human resource functions. Ms. Mason began her career with General Electric (GE) in 1988 after serving with the U.S. General Accounting Office in Washington, D.C. Her GE experience included leadership roles in Europe for GE Information Services and GE Capital Real Estate. She is a member of the Board of Directors of Family Service of Lake County and is a member of the Executive Advisory Council for the Chicago Chapter of National Association of African Americans in Human Resources.
James K. Saccaro, age 47, is Executive Vice President and Chief Financial Officer. Mr. Saccaro was Senior Vice President and Chief Financial Officer at Hill-Rom Corporation prior to rejoining Baxter in 2014. He originally joined the company in 2002 as Manager of Strategy for the company’s BioScience business, and over the years assumed positions of increasing responsibility, including Vice President of Financial Planning, Vice President of Finance for the company’s operations in Europe, the Middle East and Africa and Corporate Vice President and Treasurer. He previously held strategy and business development positions at Clear Channel Communications and the Walt Disney Company.
All executive officers hold office until the next annual election of officers and until their respective successors are elected and qualified.
PART II
Item 5. Market for Registrant’s Common Equity, Related Stockholder Matters and Issuer Purchases of Equity Securities.
The following table includes information about our common stock repurchases during the three-month period ended December 31, 2019.
| Period | Total Number of Shares Purchased(1) | Average Price Paid per Share | Total Number of Shares Purchased as Part of Publicly Announced Programs(1) | Approximate Dollar Value of Shares that may yet be Purchased Under the Program(1) | |||||||||||||||||||
| October 1, 2019 through October 31, 2019 | 2,369,658 | $ | 86.02 | 2,369,658 | |||||||||||||||||||
| November 1, 2019 through November 30, 2019 | — | $ | — | — | |||||||||||||||||||
| December 1, 2019 through December 31, 2019 | — | $ | — | — | |||||||||||||||||||
| Total | 2,369,658 | $ | 86.02 | 2,369,658 | $ | 897,396,644 |
(1)On July 25, 2012, we announced that our Board of Directors authorized us to repurchase up to $2.0 billion of our common stock on the open market or in private transactions. The Board of Directors increased this authority by $1.5 billion in each of November 2016 and February 2018 and by an additional $2.0 billion in November 2018. During the fourth quarter of 2019, we repurchased approximately 2.4 million shares for $204 million in cash pursuant to this authority through Rule 10b5-1 purchase plans. The remaining authorization under this program totaled approximately $897 million at December 31, 2019. This program does not have an expiration date.
Our common stock is listed on the New York, Chicago and SIX Swiss stock exchanges. The New York Stock Exchange is the principal market on which our common stock is traded under the symbol “BAX”. At February 29, 2020, there were 22,818 holders of record of our common stock.
Performance Graph
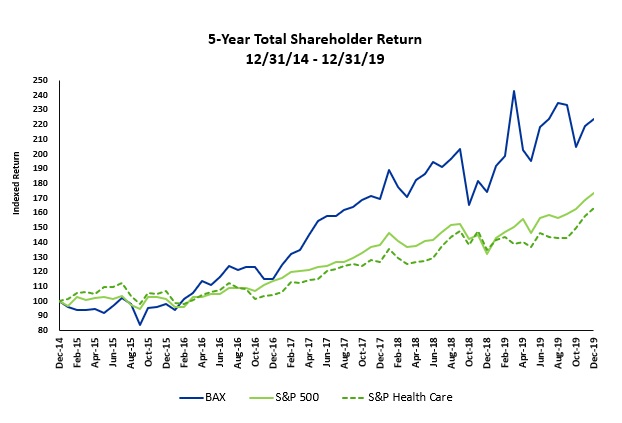
The following graph compares the change in our cumulative total stockholder return (including reinvested dividends) on our common stock with the Standard & Poor’s 500 Composite Index and the Standard & Poor’s 500 Health Care Index over the past five years. Performance through June 30, 2015 has been adjusted for the Baxalta separation which occurred on July 1, 2015.
Item 6. Selected Financial Data.
The following selected consolidated financial data should be read in conjunction with our consolidated financial statements and the accompanying notes thereto in Item 8 of this Annual Report on Form 10-K, and the information contained in Item 7, Management's Discussion and Analysis of Financial Condition and Results of Operations of this Annual Report on Form 10-K.
| As Restated 1 | |||||||||||||||||||||||||||||
| Unaudited | |||||||||||||||||||||||||||||
| as of or for the years ended December 31 | 2019 2 | 2018 | 2017 3 | 2016 3,4,5 | 2015 6 | ||||||||||||||||||||||||
| Operating Results | Net sales | $ | 11,362 | 11,099 | 10,584 | 10,133 | 9,918 | ||||||||||||||||||||||
| (in millions) | Income from continuing operations | $ | 1,011 | 1,552 | 609 | 4,936 | 254 | ||||||||||||||||||||||
| (Loss) income from discontinued operations, net of tax | $ | — | (6) | (7) | (1) | 571 | |||||||||||||||||||||||
| Net income attributable to Baxter stockholders | $ | 1,001 | 1,546 | 602 | 4,935 | 825 | |||||||||||||||||||||||
| Earnings per share from continuing operations | |||||||||||||||||||||||||||||
| Basic | $ | 1.97 | 2.91 | 1.12 | 9.04 | 0.47 | |||||||||||||||||||||||
| Diluted | $ | 1.93 | 2.84 | 1.10 | 8.96 | 0.46 | |||||||||||||||||||||||
| (Loss) earnings per share from discontinued operations | |||||||||||||||||||||||||||||
| Basic | $ | — | (0.01) | (0.01) | — | 1.04 | |||||||||||||||||||||||
| Diluted | $ | — | (0.01) | (0.02) | — | 1.04 | |||||||||||||||||||||||
| Earnings per share | |||||||||||||||||||||||||||||
| Basic | $ | 1.97 | 2.90 | 1.11 | 9.04 | 1.51 | |||||||||||||||||||||||
| Diluted | $ | 1.93 | 2.83 | 1.08 | 8.96 | 1.50 | |||||||||||||||||||||||
| Weighted-average number of shares outstanding | |||||||||||||||||||||||||||||
| Basic | 509 | 534 | 543 | 546 | 545 | ||||||||||||||||||||||||
| Diluted | 519 | 546 | 555 | 551 | 549 | ||||||||||||||||||||||||
| Balance Sheet Information | Total assets | $ | 18,193 | 15,720 | 17,102 | 15,459 | 20,941 | ||||||||||||||||||||||
| (in millions) | Total liabilities | $ | 10,281 | 7,854 | 7,993 | 7,238 | 12,089 | ||||||||||||||||||||||
| Total equity | $ | 7,912 | 7,866 | 9,109 | 8,221 | 8,852 | |||||||||||||||||||||||
| Long-term debt and finance lease obligations | $ | 4,809 | 3,481 | 3,512 | 2,774 | 3,923 | |||||||||||||||||||||||
| Cash Flow Information | Cash flows from operations - continuing operations | $ | 2,110 | 2,017 | 1,730 | 1,588 | 1,211 | ||||||||||||||||||||||
| (in millions) | Cash flows from investing activities - continuing operations | $ | (1,100) | (916) | (1,292) | (716) | (855) | ||||||||||||||||||||||
| Cash flows from financing activities | $ | 498 | (2,603) | 93 | (324) | (481) | |||||||||||||||||||||||
| Capital expenditures - continuing operations | $ | (696) | (659) | (616) | (705) | (905) | |||||||||||||||||||||||
| Common Stock Information | Cash dividends declared per share | $ | 0.850 | $ | 0.730 | $ | 0.610 | $ | 0.505 | $ | 1.270 |
1.We have restated in this Annual Report on Form 10-K our previously issued audited financial statements as of December 31, 2018 and for the years ended December 31, 2018 and 2017 and selected previously reported financial information as of December 31, 2017, 2016 and 2015 and for the years ended December 31, 2016 and 2015. In addition to the correction of misstatements related to non-operating foreign exchange gains and losses, we also corrected other misstatements that were immaterial, individually and in the aggregate, to our previously issued financial statements. See Note 2, Restatement of Previously Issued Consolidated Financial Statements, in Item 8, Financial Statements and Supplementary Data, for additional information.
2.Income from continuing operations for the year ended December 31, 2019 included a charge of $755 million related to the annuitization of a portion of our U.S. pension plan.
3.As of December 31, 2017, total assets have changed from $17,111 million as originally reported to $17,102 million as restated, total liabilities have changed from $7,995 million as originally reported to $7,993 million as restated, total equity has changed from $9,116 million as originally reported to $9,109 million as restated, and long-term debt and finance lease obligations have changed from $3,509 million as originally reported to $3,512 million as restated. See Note 2, Restatement of Previously Issued Consolidated Financial Statements, in Item 8, Financial Statements and Supplementary Data, for information related to the restatement impacts on operating results and cash flow information for the year ended December 31, 2017. Balance sheet information as of December 31, 2017 is unaudited.
4.As of and for the year ended December 31, 2016, net sales have changed from $10,163 million as originally reported to $10,133 million as restated, income from continuing operations has changed from $4,966 million as originally reported to $4,936 million as restated, net income attributable to Baxter stockholders has changed from $4,965 million as originally reported to $4,935 million as restated, basic earnings per share from continuing operations has changed from $9.10 as originally reported to $9.04 as restated, diluted earnings per share from continuing operations has changed from $9.01 as originally reported to $8.96 as restated, basic loss per share from discontinued operations has changed from $(0.01) as originally reported to $0.00 as restated, basic earnings per share has changed from $9.09 as originally reported to $9.04 as restated, diluted earnings per share has changed from $9.01 as originally reported to $8.96 as restated, total assets have changed from $15,546 million as originally reported to $15,459 million as restated, total liabilities have changed from $7,266 million as originally reported to $7,238 million as restated, total equity has changed from $8,280 million as originally reported to $8,221 million as restated, long-term debt and finance lease obligations have changed from $2,779 million as originally reported to $2,774 million as restated, cash inflows from operations - continuing operations has changed from $1,624 million as originally reported to $1,588 million as restated, cash outflows from investing activities - continuing operations has changed from $730 million as originally reported to $716 million as restated, and capital expenditures - continuing operations has changed from $719 million as originally reported to $705 million as restated.
5.For the year ended December 31, 2016, income from continuing operations included net realized gains of $4.4 billion related to the disposition of our formerly retained shares in Baxalta (Baxalta Retained Shares).
6.As of and for the year ended December 31, 2015, net sales have changed from $9,968 million as originally reported to $9,918 million as restated, income from continuing operations has changed from $393 million as originally reported to $254 million as restated, net income attributable to Baxter stockholders has changed from $968 million as originally reported to $825 million as restated, basic earnings per share from continuing operations has changed from $0.72 as originally reported to $0.47 as restated, diluted earnings per share from continuing operations has changed from $0.72 as originally reported to $0.46 as restated, basic earnings per share from discontinued operations has changed from $1.06 as originally reported to $1.04 as restated, basic earnings per share has changed from $1.78 as originally reported to $1.51 as restated, diluted earnings per share has changed from $1.76 as originally reported to $1.50 as restated, total assets have changed from $20,962 million as originally reported to $20,941 million as restated, total liabilities have changed from $12,097 million as originally reported to $12,089 million as restated, total equity has changed from $8,865 million as originally reported to $8,852 million as restated, long-term debt and finance lease obligations have changed from $3,922 million as originally reported to $3,923 million as restated, cash inflows from operations - continuing operations has changed from $1,253 million as originally reported to $1,211 million as restated, cash outflows from investing activities - continuing operations has changed from $861 million as originally reported to $855 million as restated, and capital expenditures - continuing operations has changed from $911 million as originally reported to $905 million as restated.
Item 7. Management’s Discussion and Analysis of Financial Condition and Results of Operations.
The following commentary should be read in conjunction with the consolidated financial statements and accompanying notes.
EXECUTIVE OVERVIEW
Restatement of Previously Issued Consolidated Financial Statements
We have restated our previously issued consolidated financial statements contained in this Annual Report on Form 10-K. Refer to the “Explanatory Note” preceding Item 1, Business, for background on the restatement, the periods impacted, control considerations, and other information. In addition, we have restated certain previously reported financial information as of December 31, 2018 and for the fiscal years ended December 31, 2018 and December 31, 2017 in this Item 7, Management’s Discussion and Analysis of Financial Condition and Results of Operations, including but not limited to information within the Results of Operations section. See Note 2, Restatement of Previously Issued Consolidated Financial Statements, in Item 8, Financial Statements and Supplementary Data, for additional information related to the restatement, including descriptions of the misstatements and the impacts on our consolidated financial statements.
Description of the Company and Business Segments
We manage our business based on three geographic segments: Americas (North and South America), EMEA (Europe, Middle East and Africa) and APAC (Asia-Pacific). Each of our segments provides a broad portfolio of essential healthcare products including acute and chronic dialysis therapies; sterile IV solutions; infusion systems and devices; parenteral nutrition therapies; inhaled anesthetics; generic injectable pharmaceuticals; and surgical hemostat and sealant products. Our global footprint and the critical nature of our products and services play a key role in expanding access to healthcare in emerging and developed countries. These products are used by hospitals, kidney dialysis centers, nursing homes, rehabilitation centers, doctors’ offices and patients at home under physician supervision.
For financial information about our segments, see Note 18 in Item 8 of this Annual Report on Form 10-K.
Recent Business Combinations and Asset Acquisitions
Cheetah Medical
In October 2019, we acquired 100 percent of Cheetah Medical, Inc. (Cheetah) for total upfront cash consideration of $195 million, net of cash acquired, with the potential for additional cash consideration, up to $40 million, based on clinical and commercial milestones for which the acquisition date fair value was $18 million. Cheetah is a leading provider of hemodynamic monitoring technologies. Refer to Note 4 in Item 8 of this Annual Report on Form 10-K for additional information regarding the acquisition of Cheetah.
Recothrom and Preveleak
In March 2018, we acquired two hemostat and sealant products from Mallinckrodt plc: RECOTHROM Thrombin topical (Recombinant), the first and only stand-alone recombinant thrombin, and PREVELEAK Surgical Sealant, which is used in vascular reconstruction. The purchase price included an upfront payment of approximately $163 million and potential contingent payments in the future. Refer to Note 4 in Item 8 of this Annual Report on Form 10-K for additional information regarding the acquisition of the RECOTHROM and PREVELEAK products.
Claris Injectables Limited
In July 2017, we acquired 100 percent of Claris Injectables Limited (Claris), a wholly owned subsidiary of Claris Lifesciences Limited, for total cash consideration of approximately $629 million, net of cash acquired. Through the acquisition, we added capabilities in production of essential generic injectable medicines, such as anesthesia and analgesics, renal, anti-infectives and critical care in a variety of presentations including bags, vials and ampoules. Refer to Note 4 in Item 8 of this Annual Report on Form 10-K for additional information regarding the acquisition of Claris.
Seprafilm Adhesion Barrier
In December 2019, we entered into a definitive agreement to acquire Seprafilm Adhesion Barrier (Seprafilm) from Sanofi. The transaction closed in February 2020 and we paid approximately $345 million for the acquired assets, subject to a post-close adjustment. Seprafilm is indicated for use in patients undergoing abdominal or pelvic laparotomy as an adjunct intended to reduce the incidence, extent and severity of postoperative adhesions between the abdominal wall and the underlying viscera such as omentum, small bowel, bladder, and stomach, and between the uterus and surrounding structures such as tubes and ovaries, large bowel, and bladder. As the acquisition was completed after December 31, 2019, our consolidated financial statements do not include the financial condition or results of operations of Seprafilm in any of the periods presented herein.
Financial Results
Our global net sales totaled $11.4 billion in 2019, an increase of 2% over 2018 on a reported basis and 5% on a constant currency basis. International sales totaled $6.5 billion in 2019, an increase of 3% compared to 2018 on a reported basis and 7% on a constant currency basis. Sales in the United States totaled $4.8 billion in 2019, an increase of 2% compared to 2018. Refer to the Net Sales discussion in the Results of Operations section below for more information related to changes in net sales on a constant currency basis.
Our income from continuing operations totaled $1.0 billion, or $1.93 per diluted share, in 2019. Income from continuing operations in 2019 included special items which resulted in a net decrease to income from continuing operations of $716 million, or $1.38 per diluted share. Our special items are discussed in the Results of Operations section below.
Our financial results included R&D expenses totaling $595 million in 2019, which reflects our focus on balancing increased investments to support our new product pipeline with efforts to optimize overall R&D spending.
Our financial position remains strong, with operating cash flows from continuing operations totaling $2.1 billion in 2019. We have continued to execute on our disciplined capital allocation framework, which is designed to optimize stockholder value creation through reinvestment in our businesses, dividends and share repurchases, as well as acquisitions and other business development initiatives as discussed in the Strategic Objectives section below.
Capital expenditures totaled $696 million in 2019 as we continue to invest across our businesses to support future growth, including additional investments in support of new and existing product capacity expansions. Our investments in capital expenditures in 2019 were focused on projects that improve production efficiency and enhance manufacturing capabilities to support our strategy of geographic expansion with select investments in growing markets.
We also continued to return value to our stockholders in the form of dividends. During 2019, we paid cash dividends to our stockholders totaling $423 million. Additionally, in 2019 we repurchased 16.5 million shares through cash repurchases pursuant to Rule 10b5-1 repurchase plans, an accelerated share repurchase plan and otherwise. For information on our share repurchase plans, see Note 10 in Item 8 of this Annual Report on Form 10-K.
Strategic Objectives
We continue to focus on several key objectives to successfully execute our long-term strategy to achieve sustainable growth and deliver enhanced stockholder value. Our diversified and broad portfolio of medical products that treat life-threatening acute or chronic conditions and our global presence are core components of our strategy to achieve these objectives. We are focused on three strategic factors as part of our pursuit of industry leading performance: optimizing our core portfolio globally; operational excellence focused on streamlining our cost structure and enhancing operational efficiency; and maintaining a disciplined and balanced approach to capital allocation.
Optimizing the Core Por
Showing the first 8K of 110K characters. Open the full section
Item 7A. Quantitative and Qualitative Disclosures About Market Risk.
Incorporated by reference to the section entitled “Financial Instrument Market Risk” in “Management’s Discussion and Analysis of Financial Condition and Results of Operations” in Item 7 of this Annual Report on Form 10-K.
Item 8. Financial Statements and Supplementary Data.
CONSOLIDATED BALANCE SHEETS
| As Restated | |||||||||||
| as of December 31 (in millions, except share information) | 2019 | 2018 | |||||||||
| Current assets: | |||||||||||
| Cash and cash equivalents | $ | 3,335 | $ | 1,838 | |||||||
| Accounts receivable, net | 1,896 | 1,840 | |||||||||
| Inventories | 1,653 | 1,667 | |||||||||
| Prepaid expenses and other current assets | 619 | 614 | |||||||||
| Total current assets | 7,503 | 5,959 | |||||||||
| Property, plant and equipment, net | 4,512 | 4,530 | |||||||||
| Goodwill | 3,030 | 3,002 | |||||||||
| Other intangible assets, net | 1,471 | 1,410 | |||||||||
| Operating lease right-of-use assets | 608 | — | |||||||||
| Other non-current assets | 1,069 | 819 | |||||||||
| Total assets | $ | 18,193 | $ | 15,720 | |||||||
| Current liabilities: | |||||||||||
| Short-term debt | $ | 226 | $ | 2 | |||||||
| Current maturities of long-term debt and finance lease obligations | 315 | 2 | |||||||||
| Accounts payable and accrued liabilities | 2,689 | 2,810 | |||||||||
| Total current liabilities | 3,230 | 2,814 | |||||||||
| Long-term debt and finance lease obligations | 4,809 | 3,481 | |||||||||
| Operating lease liabilities | 510 | — | |||||||||
| Other non-current liabilities | 1,732 | 1,559 | |||||||||
| Total liabilities | 10,281 | 7,854 | |||||||||
| Commitments and contingencies | |||||||||||
| Equity: | |||||||||||
| Common stock, $1 par value, authorized 2,000,000,000 shares, issued 683,494,944 shares in 2019 and 2018 | 683 | 683 | |||||||||
| Common stock in treasury, at cost, 177,340,358 shares in 2019 and 170,495,859 shares in 2018 | (10,764) | (9,989) | |||||||||
| Additional contributed capital | 5,955 | 5,898 | |||||||||
| Retained earnings | 15,718 | 15,075 | |||||||||
| Accumulated other comprehensive (loss) income | (3,710) | (3,823) | |||||||||
| Total Baxter stockholders’ equity | 7,882 | 7,844 | |||||||||
| Noncontrolling interests | 30 | 22 | |||||||||
| Total equity | 7,912 | 7,866 | |||||||||
| Total liabilities and equity | $ | 18,193 | $ | 15,720 |
The accompanying notes are an integral part of these consolidated financial statements.
CONSOLIDATED STATEMENTS OF INCOME
| As Restated | |||||||||||||||||
| years ended December 31 (in millions, except per share data) | 2019 | 2018 | 2017 | ||||||||||||||
| Net sales | $ | 11,362 | $ | 11,099 | $ | 10,584 | |||||||||||
| Cost of sales | 6,601 | 6,340 | 6,110 | ||||||||||||||
| Gross margin | 4,761 | 4,759 | 4,474 | ||||||||||||||
| Selling, general and administrative expenses | 2,535 | 2,620 | 2,627 | ||||||||||||||
| Research and development expenses | 595 | 654 | 615 | ||||||||||||||
| Other operating income, net | (141) | (99) | (56) | ||||||||||||||
| Operating income | 1,772 | 1,584 | 1,288 | ||||||||||||||
| Interest expense, net | 71 | 45 | 55 | ||||||||||||||
| Other (income) expense, net | 731 | (78) | 133 | ||||||||||||||
| Income from continuing operations before income taxes | 970 | 1,617 | 1,100 | ||||||||||||||
| Income tax expense (benefit) | (41) | 65 | 491 | ||||||||||||||
| Income from continuing operations | 1,011 | 1,552 | 609 | ||||||||||||||
| Loss from discontinued operations, net of tax | — | (6) | (7) | ||||||||||||||
| Net income | 1,011 | 1,546 | 602 | ||||||||||||||
| Less: Net income attributable to noncontrolling interests | 10 | — | — | ||||||||||||||
| Net income attributable to Baxter stockholders | $ | 1,001 | $ | 1,546 | $ | 602 | |||||||||||
| Earnings per share from continuing operations | |||||||||||||||||
| Basic | $ | 1.97 | $ | 2.91 | $ | 1.12 | |||||||||||
| Diluted | $ | 1.93 | $ | 2.84 | $ | 1.10 | |||||||||||
| Loss per share from discontinued operations | |||||||||||||||||
| Basic | $ | — | $ | (0.01) | $ | (0.01) | |||||||||||
| Diluted | $ | — | $ | (0.01) | $ | (0.02) | |||||||||||
| Earnings per share | |||||||||||||||||
| Basic | $ | 1.97 | $ | 2.90 | $ | 1.11 | |||||||||||
| Diluted | $ | 1.93 | $ | 2.83 | $ | 1.08 | |||||||||||
| Weighted-average number of shares outstanding | |||||||||||||||||
| Basic | 509 | 534 | 543 | ||||||||||||||
| Diluted | 519 | 546 | 555 |
The accompanying notes are an integral part of these consolidated financial statements.
CONSOLIDATED STATEMENTS OF COMPREHENSIVE INCOME
| As Restated | ||||||||||||||
| years ended December 31 (in millions) | 2019 | 2018 | 2017 | |||||||||||
| Net income | $ | 1,011 | $ | 1,546 | $ | 602 | ||||||||
| Other comprehensive (loss) income, net of tax: | ||||||||||||||
| Currency translation adjustments, net of tax expense (benefit) of ($5) in 2019, ($52) in 2018 and $89 in 2017 | (95) | (323) | 599 | |||||||||||
| Pension and other postretirement benefit plans, net of tax expense of $130 in 2019, $10 in 2018, and $60 in 2017 | 408 | 33 | 134 | |||||||||||
| Hedging activities, net of tax expense (benefit) of ($11) in 2019, $3 in 2018, and ($6) in 2017 | (39) | 9 | (13) | |||||||||||
| Available-for-sale securities, net of tax expense of zero in 2019, 2018 and 2017, respectively | — | — | 2 | |||||||||||
| Total other comprehensive (loss) income, net of tax | 274 | (281) | 722 | |||||||||||
| Comprehensive income | 1,285 | 1,265 | 1,324 | |||||||||||
| Less: Comprehensive income attributable to noncontrolling interests | 10 | — | — | |||||||||||
| Comprehensive income attributable to Baxter stockholders | $ | 1,275 | $ | 1,265 | $ | 1,324 |
The accompanying notes are an integral part of these consolidated financial statements.
CONSOLIDATED STATEMENTS OF CHANGES IN EQUITY
| | | | | | | | | | | | | | | | | | | | | | | | | | | | | | | | | | | | | | | | |
Showing the first 8K of 520K characters. Open the full section
Item 9. Changes in and Disagreements with Accountants on Accounting and Financial Disclosure.
None.
Item 9A. Controls and Procedures.
Evaluation of Disclosure Controls and Procedures
Our management, with the participation of our Chief Executive Officer and our Chief Financial Officer, has evaluated the effectiveness of our disclosure controls and procedures (as defined in Rules 13a-15(e) and 15d-15(e) under the Securities Exchange Act of 1934, as amended (the Exchange Act)) as of December 31, 2019.
Based on that evaluation, Chief Executive Officer and our Chief Financial Officer concluded that, as of December 31, 2019, due to the material weakness in our internal control over financial reporting described below, our disclosure controls and procedures were not effective to provide reasonable assurance that the information we are required to disclose in the reports that we file or submit under the Exchange Act is recorded, processed, summarized, and reported within the time periods specified in the SEC’s rules and forms, and that such information is accumulated and communicated to our management, including our Chief Executive Officer and Chief Financial Officer, as appropriate, to allow timely decisions regarding required disclosure.
Management’s Assessment of Internal Control Over Financial Reporting
Our management is responsible for establishing and maintaining adequate internal control over financial reporting, as defined in Rule 13a-15(f) of the Exchange Act. Our internal control over financial reporting is designed to provide reasonable assurance regarding the reliability of financial reporting and the preparation of financial statements for external purposes in accordance with accounting principles generally accepted in the United States of America (U.S. GAAP).
Because of its inherent limitations, internal control over financial reporting may not prevent or detect misstatements. Also, projections of any evaluation of effectiveness to future periods are subject to the risk that controls may become inadequate because of changes in conditions, or that the degree of compliance with policies may deteriorate.
Management performed an assessment of the effectiveness of our internal control over financial reporting as of December 31, 2019. In making this assessment, management used the framework in Internal Control-Integrated Framework (2013) issued by the Committee of Sponsoring Organizations of the Treadway Commission. Based on that assessment under the framework in Internal Control-Integrated Framework (2013), management concluded that our internal control over financial reporting was not effective as of December 31, 2019.
A material weakness is a deficiency, or a combination of deficiencies, in internal control over financial reporting, such that there is a reasonable possibility that a material misstatement of our annual or interim financial statements would not be prevented or detected on a timely basis.
We did not maintain effective controls over the accounting for certain foreign exchange gains and losses. Specifically, we did not have controls in place to monitor and quantify the difference between the foreign exchange gains and losses that we reported and the foreign exchange gains and losses that we would have reported using exchange rates determined in accordance with U.S. GAAP. Additionally, our policies and controls related to approvals and monitoring of intra-company transactions were insufficient to prevent or detect intra-company transactions undertaken solely for the purpose of generating foreign exchange gains or avoiding losses under our historical exchange rate convention. This material weakness resulted in the restatement of our consolidated financial statements as of December 31, 2018 and for the years ended December 31, 2018 and 2017 and each of the quarterly and year-to-date periods in the year ended December 31, 2018 and the first two quarters and related year-to-date interim period in the year ended December 31, 2019. Additionally, this material weakness could result in a misstatement of the aforementioned account balances or disclosures that would result in a material misstatement to the annual or interim consolidated financial statements that would not be prevented or detected.
Because of this material weakness, management concluded that we did not maintain effective internal control over financial reporting as of December 31, 2019.
The effectiveness of our internal control over financial reporting as of December 31, 2019 has been audited by PricewaterhouseCoopers LLP, an independent registered public accounting firm, as stated in their report which appears herein.
Remediation of the Material Weakness
Management has been implementing changes to strengthen our internal controls over the accounting for foreign exchange gains and losses. These changes are intended to address the identified material weakness and enhance our overall control environment and include the ongoing activities described below.
-
Exchange Rate Policy – We have discontinued the use of our historical exchange rate convention and are using the exchange rates determined in accordance with U.S. GAAP for purposes of measuring foreign currency transactions and remeasuring monetary assets and liabilities denominated in a foreign currency.
-
Automated Feed – We have implemented an automated feed that extracts foreign exchange rates on a daily basis from a recognized third-party exchange rate source.
-
Daily Rate Comparison – We have implemented a daily rate comparison control that extracts foreign exchange rates from (a) a third-party exchange rate source, (b) our treasury application, and (c) our enterprise resource planning (ERP) system and compares those rates in order to identify any potential differences and provide assurance that the correct rates were captured and are being used in our financial systems.
-
Intra-company Transaction Approvals – We have updated our policies to require additional approvals of intra-company transactions and implemented a requirement that such transactions be supported by a documented business purpose.
-
Personnel - We have made personnel changes including hiring a new treasurer from outside Baxter with more than thirty years of treasury experience and responsibility, including at four publicly traded companies. We have also hired another experienced treasury professional in a newly created director role responsible for treasury governance and controls. Additionally, we have created a treasury controller role within our accounting function and are continuing to add resources as appropriate to improve our financial reporting controls related to treasury activities.
While we believe that the above actions will ultimately remediate the material weakness, we intend to continue to refine those controls and monitor their effectiveness for a sufficient period of time prior to reaching any determination as to whether the material weakness has been remediated.
Notwithstanding the identified material weakness, management believes that the consolidated financial statements included in this Annual Report on Form 10-K present fairly, in all material respects, our financial position, results of operations, and cash flows as of and for the periods presented in accordance with U.S. GAAP.
Changes in Internal Control over Financial Reporting
As previously disclosed, we are currently implementing an upgrade to our ERP software. In connection with the ERP upgrade, we are updating the processes that constitute our internal control over financial reporting, as necessary. This normal course of business ERP upgrade is being implemented to remain current with the latest release of the software.
As previously disclosed, since 2017, we have been implementing a long-term business transformation project within the finance, human resources, purchasing and information technology functions which will further centralize and standardize business processes and systems across the company. We are transitioning some processes to our shared services centers while others have been moved to outsourced providers. This multi-year initiative will be conducted in phases and include modifications to the design and operation of controls over financial reporting.
Other than as described in the two preceding paragraphs and in the Remediation of Material Weakness section above, there have been no changes in our internal control over financial reporting (as such term is defined in Rules 13a-15(f) and 15d-15(f) under the Exchange Act) during the quarter ended December 31, 2019 that have materially affected, or are reasonably likely to materially affect, our internal control over financial reporting.
I****tem 9B. Other Information.
New Almeida Offer Letter
On March 12, 2020, Baxter entered into a new offer letter with Mr. Almeida that replaced his prior offer letter. The terms of the new offer letter will be effective until December 31, 2023. Under the new letter, Mr. Almeida will continue to serve as Chairman of the Board and President and Chief Executive Officer of the Company. Mr. Almeida’s base salary will remain $1,300,000 per annum. His target bonus and target long-term incentive opportunity were increased starting in 2020 commensurate with such compensation elements for Chief Executive Officers in Baxter’s peer group. Specifically, Mr. Almeida’s target bonus opportunity was increased from 145% of base salary to 165% of base salary, and his long-term incentive opportunity was increased from $10,000,000 to $11,000,000. Mr. Almeida remains eligible to receive benefits to the same extent and on the same terms as those benefits provided to other senior executives. The offer letter also continues to provide Mr. Almeida with the right to receive cash severance equal to two years’ base salary and target bonus in the event of an involuntary termination without cause or termination with good reason prior to December 31, 2023. In addition, beginning with Mr. Almeida’s 2020 equity award grants and for all future annual equity awards granted through the end of 2023, Mr. Almeida will be eligible to receive Baxter’s equity award retirement treatment when he attains 60 years of age (as opposed to 65 years of age), which will provide for continued vesting of his stock option and PSU awards and a longer period of time to exercise his outstanding stock options upon his retirement.
In addition to these benefits, in accordance with the terms of his change of control agreement, Mr. Almeida remains eligible for certain payments in the event of his termination for good reason or termination without cause following a change in control. Mr. Almeida is also subject to certain restrictive covenants, including non-competition, non-solicitation of customers, suppliers and employees and non-disparagement.
The foregoing summary does not purport to be complete and is qualified in its entirety by reference to the full text of the offer letter, which is filed as Exhibit 10.23 to this Annual Report on Form 10-K and is incorporated into this filing by reference.
PART III
Item 10. Directors, Executive Officers and Corporate Governance.
Refer to information under the captions entitled “Corporate Governance at Baxter International Inc. — Proposal 1 — Election of Directors,” “— Directors Continuing in Office,” “— Board of Directors — Nomination of Directors,” “— Committees of the Board — Audit Committee,” “— Board Responsibilities — Code of Conduct,” and “Ownership of Our Stock — Section 16(a) Beneficial Ownership Reporting Compliance” in Baxter’s definitive proxy statement to be filed with the Securities and Exchange Commission and delivered to stockholders in connection with the Annual Meeting of Stockholders expected to be held on May 5, 2020 (the Proxy Statement), all of which information is incorporated herein by reference. Also refer to information regarding executive officers of Baxter under the caption entitled “Executive Officers of the Registrant” in Part I of this Annual Report on Form 10-K.
Item 11. Executive Compensation.
Refer to information under the captions entitled “Executive Compensation,” and “Corporate Governance at Baxter International—Director Compensation” in the Proxy Statement, all of which information is incorporated herein by reference.
Item 12. Security Ownership of Certain Beneficial Owners and Management and Related Stockholder Matters.
The following table provides information relating to shares of common stock that may be issued under our existing equity compensation plans as of December 31, 2019.
| Plan Category | Number of Shares to be Issued upon Exercise of Outstanding Options, Warrants and Rights(a) | Weighted-Average Exercise Price of Outstanding Options, Warrants and Rights(b) | Number of Shares Remaining Available for Future Issuance Under Equity Compensation Plans (Excluding Shares Reflected in Column(a)(b)) | ||||||||||||||||||||||||||||||||
| Equity Compensation Plans Approved by Stockholders | 22,507,640 | (1) | $ | 51.08 | (2) | 23,664,836 | (3) | ||||||||||||||||||||||||||||
| Equity Compensation Plans Not Approved by Stockholders | 86,227 | (4) | $ | 28.97 | — | ||||||||||||||||||||||||||||||
| Total | 22,593,867 | (5) | $ | 50.99 | (2) | 23,664,836 |
(1)Excludes purchase rights under the Employee Stock Purchase Plan. Under the Employee Stock Purchase Plan, eligible employees may purchase shares of common stock through payroll deductions of up to 15 percent of base pay at a purchase price equal to 85 percent of the closing market price on the purchase date (as defined by the Employee Stock Purchase Plan). A participating employee may not purchase more than $25,000 in fair market value of common stock under the Employee Stock Purchase Plan in any calendar year and may withdraw from the Employee Stock Purchase Plan at any time.
(2)Restricted stock units and performance share units are excluded when determining the weighted-average exercise price of outstanding options.
(3)Includes (i) 2,702,381 shares of common stock available for purchase under the Employee Stock Purchase Plan; (ii) 427,682 shares of common stock available under the 2007 Incentive Plan; (iii) 8,597,492 shares of common stock available under the 2011 Incentive Plan; and (iv) 11,937,281 shares of common stock available under the 2015 Incentive Plan.
(4)Includes shares of common stock issuable upon exercise of options granted under the 2001 Incentive Compensation Program. These shares were made available pursuant to an amendment thereto not approved by stockholders. These additional shares were approved by our Board of Directors, not our stockholders, although our stockholders have approved the 2001 Incentive Compensation Program.
(5)Includes outstanding awards of 20,343,699 stock options, which have a weighted-average exercise price of $50.99 and a weighted-average remaining term of 6.1 years, 1,274,436 shares of common stock issuable upon vesting of restricted stock units, and 929,665 shares of common stock reserved for issuance in connection with performance share unit grants.
Refer to information under the captions entitled “Ownership of Our Stock — Security Ownership by Directors and Executive Officers” and “— Security Ownership by Certain Beneficial Owners” in the Proxy Statement, all of which information is incorporated herein by reference.
Item 13. Certain Relationships and Related Transactions, and Director Independence.
Refer to the information under the first paragraph of the caption entitled “Corporate Governance—at Baxter International Inc.—Board of Directors” and the captions entitled “Corporate Governance at Baxter International Inc.—Board of Directors—Director Independence” and “Corporate Governance at Baxter International Inc.—Other Corporate Governance Information—Certain Relationships and Related Person Transactions” in the Proxy Statement, all of which information is incorporated herein by reference.
Item 14. Principal Accountant Fees and Services.
Refer to the information under the caption entitled “Audit Matters — Audit and Non-Audit Fees” and “—Pre-Approval of Audit and Permissible Non-Audit Fees” in the Proxy Statement, all of which information is incorporated herein by reference.
PART IV
Item 15. Exhibits and Financial Statement Schedules.
The following documents are filed as a part of this report:
| Page Number | ||||||||
| (1) | Financial Statements: | |||||||
| Consolidated Balance Sheets | 49 | |||||||
| Consolidated Statements of Income | 50 | |||||||
| Consolidated Statements of Comprehensive Income | 51 | |||||||
| Consolidated Statements of Changes in Equity | 52 | |||||||
| Consolidated Statements of Cash Flows | 53 | |||||||
| Notes to Consolidated Financial Statements | 54 | |||||||
| Report of Independent Registered Public Accounting Firm | 173 | |||||||
| (2) | Schedules required by Article 12 of Regulation S-X: | |||||||
| Schedule II — Qualifying and Valuation accounts for each of the three years in the period ended December 31, 2019 | 188 | |||||||
| All other schedules have been omitted because they are not applicable or not required. | ||||||||
| (3) | Exhibits required by Item 601 of Regulation S-K are listed in the Exhibit Index, which is incorporated herein by reference. Exhibits in the Exhibit Index marked with a “C” in the left margin constitute management contracts or compensatory plans or arrangements contemplated by Item 15(b) of Form 10-K. |
Item 16. Form 10-K Summary.
Not applicable.
EXHIBIT INDEX
| Number and Description of Exhibit | |||||
| 32.1* | Certification of Chief Executive Officer pursuant to 18 U.S.C. Section 1350, as adopted pursuant to Section 906 of the Sarbanes-Oxley Act of 2002. | ||||
| 32.2* | Certification of Chief Financial Officer pursuant to 18 U.S.C. Section 1350, as adopted pursuant to Section 906 of the Sarbanes-Oxley Act of 2002. | ||||
| 101.INS* | XBRL Instance Document | ||||
| 101.SCH* | XBRL Taxonomy Extension Schema Document | ||||
| 101.CAL* | XBRL Taxonomy Extension Calculation Linkbase Document | ||||
| 101.LAB* | XBRL Taxonomy Extension Label Linkbase Document | ||||
| 101.PRE* | XBRL Taxonomy Extension Presentation Linkbase Document | ||||
| 101.DEF* | XBRL Taxonomy Extension Definition Linkbase Document |
- Filed herewith.
*R Filed herewith with redactions.
C Management contract or compensatory plan or arrangement.
(P)Paper exhibit
SIGNATURES
Pursuant to the requirements of Section 13 or 15(d) of the Securities Exchange Act of 1934, the registrant has duly caused this report to be signed on its behalf by the undersigned, thereunto duly authorized.
| BAXTER INTERNATIONAL INC. | |||||||||||
| By: | /s/ José E. Almeida | ||||||||||
| José E. Almeida | |||||||||||
| Chairman and Chief Executive Officer |
DATE: March 17, 2020
Pursuant to the requirements of the Securities Exchange Act of 1934, this report has been signed below by the following persons on behalf of the registrant and in the capacities indicated on March 17, 2020.
| Signature | Title | ||||||||||
| /s/ José E. Almeida | Chairman and Chief Executive Officer | ||||||||||
| José E. Almeida | (principal executive officer) | ||||||||||
| /s/ James K. Saccaro | Executive Vice President and Chief Financial Officer | ||||||||||
| James K. Saccaro | (principal financial officer) | ||||||||||
| /s/ Brian C. Stevens | Senior Vice President, Chief Accounting Officer and Controller | ||||||||||
| Brian C. Stevens | (principal accounting officer) | ||||||||||
| /s/ Thomas F. Chen | Director | ||||||||||
| Thomas F. Chen | |||||||||||
| /s/ John D. Forsyth | Director | ||||||||||
| John D. Forsyth | |||||||||||
| /s/ James R. Gavin III, M.D., Ph.D. | Director | ||||||||||
| James R. Gavin III, M.D., Ph.D. | |||||||||||
| /s/ Peter S. Hellman | Director | ||||||||||
| Peter S. Hellman | |||||||||||
| /s/ Michael F. Mahoney | Director | ||||||||||
| Michael F. Mahoney | |||||||||||
| /s/ Patricia B. Morrison | Director | ||||||||||
| Patricia B. Morrison | |||||||||||
| /s/ Stephen N. Oesterle, M.D. | Director | ||||||||||
| Stephen N. Oesterle, M.D. | |||||||||||
| /s/ Cathy R. Smith | Director | ||||||||||
| Cathy R. Smith | |||||||||||
| /s/ Thomas T. Stallkamp | Director | ||||||||||
| Thomas T. Stallkamp | |||||||||||
| /s/ Albert P. L. Stroucken | Director | ||||||||||
| Albert P. L. Stroucken | |||||||||||
| /s/ Amy A. Wendell | Director | ||||||||||
| Amy A. Wendell |
SCHEDULE II – Qualifying and Valuation accounts for each of the three years in the period ended December 31, 2019
| Additions | |||||||||||||||||||||||||||||
| Valuation and Qualifying Accounts (in millions) | Balance at beginning of period | Charged to costs and expenses | (Credited) charged to other accounts (1) | Deductions | Balance at end of period | ||||||||||||||||||||||||
| Year ended December 31, 2019: | |||||||||||||||||||||||||||||
| Allowance for doubtful accounts | $ | 110 | 18 | (8) | (8) | $ | 112 | ||||||||||||||||||||||
| Deferred tax asset valuation allowance | $ | 310 | 117 | — | (7) | $ | 420 | ||||||||||||||||||||||
| Year ended December 31, 2018: | |||||||||||||||||||||||||||||
| Allowance for doubtful accounts | $ | 120 | 4 | (7) | (7) | $ | 110 | ||||||||||||||||||||||
| Deferred tax asset valuation allowance (as restated) | $ | 483 | 20 | (4) | (189) | $ | 310 | ||||||||||||||||||||||
| Year ended December 31, 2017: | |||||||||||||||||||||||||||||
| Allowance for doubtful accounts | $ | 127 | 4 | 8 | (19) | $ | 120 | ||||||||||||||||||||||
| Deferred tax asset valuation allowance | $ | 150 | 350 | — | (17) | $ | 483 |
(1)Valuation accounts of acquired or divested companies and foreign currency translation adjustments.
Reserves are deducted from assets to which they apply.