 filings.tools
Best Buy (BBY) 10-K risk factor changes: FY2019 vs FY2018
The 2019-02-02 10-K against the 2018-02-03 one, compared heading by heading and sentence by sentence. One of these filings carries no fiscal year tag, so its year is the calendar year of the period end.
Item 1A69 rewritten27 added51 removed333 unchanged
All filing items1,134 rewritten696 added589 removed1,894 unchanged
Summary
counted, not written
- Item 1A headings could not be compared: only 0 carried over between the two years, which usually means one filing was read wrongly, so none is reported as new or removed.
- Sentence by sentence, 696 added, 589 removed, 1,134 rewritten and 1,894 unchanged across 15 items that differ.
Sentences by item
22 items, with every count and a link to each item that changed
Underlined words on a shaded ground are new in FY2019; struck-through words were in FY2018. Sentences that are wholly new or wholly gone are labelled rather than marked.
Item 1A. Risk Factors.
69 rewritten, 27 added, 51 removed, 333 unchanged
We face strong competition from multi-channel retailers, e-commerce businesses, technology service providers, traditional store-based [removed: retailers and] [added: retailers,] vendors and mobile network [removed: carriers that offer their products and services directly to customers,] [added: carriers,] which directly affects our revenue and profitability.
[removed: The] [added: While we constantly strive to offer consumers the best value, the] retail sector is highly competitive.
We compete with many other local, regional, national and international retailers and technology service providers, as well as [removed: certain] [added: some] of our vendors and mobile network carriers that [removed: offer] [added: market their] products directly to consumers.
Competition may also result from new entrants [removed: in] [added: into] the markets we serve, offering products and/or services that compete with us.
The retail sector continues to experience a trend towards an increase in sales initiated online and using mobile applications, and some online-only businesses have lower operating [removed: costs than us and are not generally required to collect sales taxes in certain U.S. states, which can negatively impact the ability of multi-channel retailers to be price competitive on a tax-included basis.][added: costs.]
[removed: Our ability to be] competitive on delivery times and delivery costs depends on many factors, and our failure to successfully manage these factors and offer competitive delivery options could negatively impact the demand for our products and our profit margins.
Because our business strategy is based on offering superior levels of customer service and a full range of services to complement the products we offer, our cost structure [removed: is] [added: might be] higher than some of our competitors, and this, in conjunction with price transparency, [removed: puts] [added: could put] pressure on our margins.
In fiscal [removed: 2018,] [added: 2019,] our 20 largest suppliers accounted for approximately [removed: 70%] [added: 64%] of the merchandise we purchased [removed: (77%] [added: (70%] in fiscal [removed: 2017),] [added: 2018),] with [removed: 5] [added: five] suppliers [removed: –] [added: -] Apple, Samsung, Hewlett-Packard, Sony and [removed: Lenovo –] [added: LG -] representing approximately [removed: 56%] [added: 51%] of total merchandise purchased [removed: (53%] [added: (56%] in fiscal [removed: 2017).][added: 2018).]
[removed: To] [added: and depend upon, to] varying degrees, our vendors may be able to leverage their competitive advantages [removed: —] [added: -] for example, their financial strength, the strength of their [removed: brand] [added: brands] with customers, their own stores or online channels or their relationships with other retailers [removed: —] [added: -] to our commercial disadvantage.
Generally, our ability to negotiate favorable terms with our vendors is more difficult with vendors where our purchases represent a smaller proportion of their total [removed: revenues, consequently impacting our profitability from such vendor relationships.][added: revenues and/or when there is less competition.]
The competitive strategies utilized by mobile network carriers can have a material impact on our [removed: business.][added: business, especially with ongoing consolidation in the mobile industry.]
[removed: Carriers] [added: In addition, vendors] may decide to cease allowing us to offer [removed: their contracts or] certain [removed: categories of their contracts,] [added: categories,] focus their marketing efforts on alternative [added: channels or make unfavorable changes to our commissions or other terms.]
[removed: Each of these factors] [added: These and other related issues] could have a material adverse impact on our [removed: revenue and profitability.][added: financial results.]
Our ability to find qualified vendors who can supply products in a timely and efficient manner that meet our [added: internal] standards of quality and safety can be difficult, especially with respect to goods sourced from outside the U.S. [removed: Political] [added: Risks such as political] or [removed: financial] [added: economic] instability, [added: cross-border trade restrictions or tariffs,] merchandise quality issues, product safety concerns, [removed: cross-border trade restrictions or tariffs,] work stoppages, port delays, foreign currency exchange rate fluctuations, transportation capacity and costs, inflation, civil unrest, natural disasters, outbreaks of pandemics and other factors relating to foreign trade are beyond our control.
Vendors may also fail to invest adequately in design, production or distribution facilities, [added: and] may reduce their customer incentives, advertising and promotional activities or change their pricing policies.
Failure to take appropriate actions in relation to product recalls could lead to breaches [removed: in] [added: of] laws and regulations and leave us susceptible to government enforcement actions or private litigation.
We offer a full range of services that complement our product offerings, including consultation, [removed: design,] delivery, [added: design,] installation, [removed: set-up,] [added: memberships,] protection plans, repair, [added: set-up,] technical [removed: support] [added: support,] and [removed: educational classes.][added: health, safety and caregiving monitoring and support.]
| • | unpredictable [added: extended] warranty failure rates and related expenses; |
| • | employees having access to customer devices, including the information held on those devices, which may increase our responsibility for the security of those devices and the data they hold; [removed: and] |
| • | the engagement of third parties to assist with some aspects of construction and installation, and the potential responsibility for the actions they [removed: take,] [added: withtake,] and for compliance with building codes and related [removed: regulations.] [added: regulations; and] |
Real GDP growth, consumer confidence, inflation, employment levels, oil prices, interest rates, tax rates, availability of consumer financing, housing market conditions, foreign currency exchange rate fluctuations, costs for items such as fuel and [added: food and other macroeconomic trends can adversely affect consumer demand for the products and services that we offer.]
We depend on our vendors' [removed: ability] [added: abilities] to deliver products to us at the right location, right time and in the right quantities.
| • | disruptions to our systems and [removed: implementation of] [added: the need to implement] new systems; |
It is important that we [removed: be able to] maintain optimal levels of inventory in each store and distribution center and respond rapidly to shifting demands.
The continuing growth of [removed: e-commerce] [added: online purchases for delivery] increases our exposure to these risks.
Our strategy of offering [removed: high quality] [added: high-quality] services and assistance for our customers requires a highly trained and engaged workforce.
Factors that affect our ability to maintain sufficient numbers of qualified employees include employee morale, our reputation, unemployment rates, competition from other employers, availability of qualified personnel and our ability to offer appropriate compensation [added: and benefit] packages.
As we introduce new products and services, using new technologies and applications, we may have limited experience in these newer market [removed: segments,] [added: segments] and our customers may not like our new value propositions.
These offerings may present new and difficult technology challenges, and we may be subject to claims if customers of these offerings experience service [removed: disruptions or] [added: disruptions,] failures or other issues.
[removed: In addition, this expansion] [added: This expanded risk] increases the complexity of our business and places significant [removed: strain] [added: responsibility] on our management, [removed: personnel,] [added: employees,] operations, systems, technical [removed: performance,] [added: expertise,] financial resources, and internal financial and regulatory control and reporting functions.
We believe that recognition and the reputation of our [added: company and our] brands are key to our success.
Damage to the perception or reputation of our brands could result in, among other things, declines in [added: revenues and] customer loyalty, decreases in gift card and service plan sales, lower employee retention and productivity and vendor relationship issues, all of which could materially [added: adversely] affect our revenue and profitability.
Failure to identify and [removed: lease] [added: secure] suitable locations for our stores and other facilities could impair our ability to compete successfully and our profitability.
Most of our properties are [added: leased, of which some are] subject to long-term leases.
| • | the [added: location and] appropriate number of stores in our portfolio; |
| • | the [removed: formats] [added: interior layout, format] and [removed: sizes] [added: size] of our stores; |
| • | the [added: local competitive positioning,] trade area demographics and economic factors for each of our stores; |
| • | the primary term lease commitment [added: and long-term lease option coverage] for each store; |
| • | the occupancy cost of our stores relative to market rents; [added: and] |
| • | our supply chain [added: service location] network [removed: strategy; and] [added: strategy.] |
Our ability to be
For example, as our value proposition evolves to support the healthcare industry with technology, we may be subject to privacy and information security rules, such as the Health Insurance Portability and Accountability Act, and/or subject to increased potential liability risk.
As a part of our strategy to enrich lives through technology, we are entering the health area, growing organically as well as inorganically.
In fiscal 2019 we acquired GreatCall, which provides emergency concierge and monitoring services to subscribed customers.
Such services might expose us to liability risk resulting from failures in the fulfillment of our services.
In addition, the services and systems used could expose us to customer data information security as well as business or system interruption risks.
| • | increased risk of non-compliance with new laws and regulations applicable to these services. |
While we believe we offer capabilities that these vendors value
Market increases to field employee hourly wage rates, along with our ability to implement corresponding adjustments within our labor model and wage rates, could have a material impact to the profitability of our business.
| • | the financial, operational and business impact of new regulations governing data privacy and security, such as the California Consumer Privacy Act ("CCPA"). When it goes into effect on January 1, 2020, the regulation will provide new consumer data privacy rights for California residents and will require companies to provide new disclosures to California consumers, allowing them to opt-out of certain uses of their personal information. However, legislators have stated that they intend to propose amendments to the CCPA, and it remains unclear what, if any, modifications will be made to the CCPA or how it will be interpreted. We cannot yet predict the impact of the CCPA on our business or operations, but it may require us to modify our data processing practices and policies and incur incremental expenses in an effort to comply. |
services; and/or other as yet unknown legislation that could affect how we operate and execute our strategies as well as alter our expense structure;
Geopolitical issues around the world and how our markets are positioned might also impact the macroeconomic conditions and could have a material adverse impact on our financial results.
Disruptions to these services, such as those caused by unforeseen traffic levels, malicious attacks, other technical difficulties or
Additionally, new laws, like the General Data Protection Regulation and CCPA, are expanding company obligations to protect the privacy of customer data, requiring additional resources and creating incremental risk of potential breach.
difficult to forecast and react to these factors quickly.
We operate in a highly and increasingly dynamic industry sector fueled by constant technology innovation and disruption.
This manifests itself in a variety of ways: emergence of new products and categories, rapid maturation of categories, cannibalization of categories, declining price points and product replacement and upgrade cycles.
This rapid pace of change can be hard to predict and manage, and there is no guarantee we can effectively do this all the time.
If we fail to interpret, predict and react to these changes in a timely and effective manner, the consequences can include: failure to offer the products and services that our customers want; having excess inventory, which may require heavy discounting or liquidation; inability to secure adequate access to brands or products for which consumer demand exceeds supply; delays in adapting our merchandising, marketing or supply chain capabilities to accommodate changes in product trends; and damage to our brand and reputation.
| • | increasing transportation costs. |
In recent years, we have observed an increase in the number and severity of certain events in many of our markets.
In addition, although as of February 2, 2019, none of our U.S. operations had employees represented by labor unions or working under collective bargaining agreements, any future organizing activity could adversely affect our costs and our results of operations.
We utilize third-party vendors for certain aspects of our operations, and any material disruption in our relationship or their services might have an impact to our business.
| • | we may be subject to a greater risk of inventory obsolescence as we do not generally have return to vendor rights; |
| • | our operations may be disrupted by trade disputes or excessive tariffs and we may not be able to source alternatives quickly enough to avoid interruptions in product supply; |
We are subject to risks associated with vendors that source products outside of the U.S.
In addition, most of our exclusive brand products are manufactured by contract manufacturers based in southeast Asia.
Some of our competitors have greater financial resources than us, have greater brand recognition and may be able to offer lower prices than us for a sustained period of time.
They may also be able to secure better terms from vendors and devote more resources to technology, fulfillment and marketing.
In general, consumer electronics product life cycles (which begin with initial market launch and conclude with maturity or obsolescence) have become shorter and less predictable.
This is largely due to rapid technological advancement and innovation and generally faster adoption by consumers.
Consumer preferences have also become susceptible to rapid change, and this adds to the unpredictability of our business.
These factors affect us in a number of ways, for example:
| | |
| --- | --- |
| • | the emergence of new products and categories (for example, voice assistants); |
| • | the rapid maturity and decline of relatively new categories (for example, tablets); |
| • | cannibalization of categories (for example, the effect of smartphones on demand for GPS, mobile audio, digital imaging devices, etc.); |
| • | increasing demand for internet-based services that may replace physical products such as hard drives, media and entertainment software products; |
| • | intense consumer interest in high-profile product updates (for example, smartphone model updates), which concentrates purchasing activity around new launch dates and can often lead to shortages of merchandise; |
| • | unpredictable consumer adoption rates (for example, contrasting adoption rates of 3D and Ultra-HD televisions); |
| • | rapidly declining price-points in many categories (for example, digital imaging, Ultra-HD televisions, etc.); and |
| • | availability of content (for example, Ultra-HD programming, online streaming services, sporting events or other broadcast programming). |
The effects of these factors can also be exacerbated by the competitive environment and the ease with which customers can research and compare product features and prices.
If we fail to interpret, predict and react to these factors in a timely and effective manner, the consequences can include:
| • | failure to offer the products and services that our customers want; |
| • | having excess inventory, which may require heavy discounting or liquidation; |
| • | inability to secure adequate access to brands or products for which consumer demand exceeds supply; |
| • | delays in adapting our merchandising, marketing or supply chain capabilities to accommodate changes in product trends; and |
| • | damage to our brand and reputation. |
channels or make unfavorable changes to our commissions or other terms.
We have internal standards that we require all of our vendors to meet.
In addition, as customers increasingly migrate to websites and mobile applications to initiate transactions, it is inherently more difficult to demonstrate and explain the features and benefits of our service offerings, which can lead to a lower revenue mix of these services.
If, for these or other reasons, we fail to design and market services effectively to our customers or fail to meet our customers’ expectations in the execution of these services, our reputation, revenue and profitability could be adversely affected.
food and other macroeconomic trends can adversely affect consumers' demand for the products and services that we offer.
Our future results could be significantly adversely impacted by these factors.
| • | costs that are excessive. |
| • | the locations of our stores; |
| • | the interior layouts of our stores; |
| • | the local competitive positioning in and around our stores; |
| • | the long-term lease option coverage for each store; |
| • | our ongoing network of service locations. |
to pursue business opportunities.
Our credit ratings and outlooks at March 29, 2018, are summarized below.
In fiscal 2018, Fitch Ratings Limited affirmed its long-term credit rating of BBB- and changed its outlook from Stable to Positive.
In fiscal 2019, Standard & Poor's Rating Services upgraded its long-term credit rating of BBB- to BBB and changed its outlook from Positive to Stable, and Moody's Investors Service, Inc. affirmed its long-term credit rating of Baa1 with a Stable outlook.
| | | | |
An excerpt. Shown here: 40 of 69 rewritten, all 27 added and 40 of 51 removed. The counts are complete. For every sentence, read Item 1A. Risk Factors. in the FY2019 filing and the FY2018 filing.
Item 7. Management's Discussion and Analysis of Financial Condition and Results of Operations.
272 rewritten, 139 added, 195 removed, 441 unchanged
We [removed: operate] [added: have] two reportable segments: Domestic and International.
The Domestic segment is comprised of the operations in all states, districts and territories of the [removed: U.S. The International segment is comprised of all operations in Canada and Mexico.][added: U.S., including GreatCall.]
Fiscal [added: 2019 and fiscal 2017 included 52 weeks and fiscal] 2018 included 53 [removed: weeks] [added: weeks,] with the additional week [removed: included] [added: occurring] in the fourth quarter.
A [removed: higher] [added: large] proportion of our revenue and earnings is generated in the fiscal fourth quarter, which includes the majority of the holiday shopping season in the U.S., Canada and [removed: Mexico ("Holiday").][added: Mexico.]
Our comparable sales calculation compares revenue from stores, websites and call centers operating for at least 14 full months, as well as revenue related to certain other comparable sales [added: channels for a particular period to the corresponding period in the prior year.]
Beginning in the fourth quarter of fiscal 2017, we resumed reporting International comparable sales as revenue [removed: in] [added: and] the International segment was once again deemed to be comparable and, as such, Consolidated comparable sales are once again equal to the aggregation of Domestic and International comparable sales.
This MD&A includes financial information prepared in accordance with accounting principles generally accepted in the United States ("GAAP"), as well as certain adjusted or non-GAAP financial [removed: measures] [added: measures,] such as constant currency, non-GAAP operating income, non-GAAP effective tax [removed: rate, non-GAAP net earnings from continuing operations,] [added: rate and] non-GAAP diluted earnings per share ("EPS") from continuing [removed: operations and non-GAAP debt to earnings before interest, income taxes, depreciation, amortization and rent ("EBITDAR") ratio.][added: operations.]
Generally, our non-GAAP financial measures include adjustments for items such as restructuring charges, goodwill [removed: impairments and] [added: impairments,] gains [removed: or] [added: and] losses on [removed: investments.][added: investments, certain acquisition-related costs and the tax effect of all such items.]
In addition, certain other items may be excluded from non-GAAP financial measures when we believe [removed: this] [added: doing so] provides greater clarity to management and our investors.
We also [added: may] use the term "constant currency," which represents results adjusted to exclude foreign currency impacts.
Now that Renew Blue has ended and Best Buy [removed: 2020: Building The New Blue] [added: 2020] has officially launched, we believe it is no longer necessary to adjust for non-restructuring property and equipment impairments in our non-GAAP reporting.
Refer to the Non-GAAP Financial Measures section below for the detailed reconciliation of items that impacted [removed: the] non-GAAP operating income, non-GAAP effective tax [removed: rate, non-GAAP net earnings from continuing operations] [added: rate] and non-GAAP diluted EPS from continuing operations in the presented periods.
[removed: The results] [added: Discontinued operations are primarily comprised] of [added: activity related to] Jiangsu Five Star Appliance Co., Limited ("Five [removed: Star"), in] [added: Star") within] our International [removed: segment, are] [added: segment and is] presented as discontinued operations on our Consolidated Statements of Earnings.
| Consolidated Performance Summary | [removed: 2018] [added: 2019] | | | | [removed: 2017] [added: 2018] | | | | [removed: 2016] [added: 2017] | | |
| Revenue | $ | [removed: 42,151] [added: 42,879] | | | $ | [removed: 39,403] [added: 42,151] | | | $ | [removed: 39,528] [added: 39,403] | |
| Comparable sales [removed: % gain (1)] [added: growth(1)] | [removed: 5.6] [added: 4.8] | | % | | [removed: 0.3] [added: 5.6] | | % | | [removed: 0.5] [added: 0.3] | | % |
| Restructuring charges [removed: - cost of goods sold] | $ | [removed: —] [added: 46] | | | $ | [removed: —] [added: 10] | | | $ | [removed: 3] [added: 39] | |
| Gross profit | $ | [removed: 9,876] [added: 9,961] | | | $ | [removed: 9,440] [added: 9,876] | | | $ | [removed: 9,191] [added: 9,440] | |
| Gross profit as a % of [removed: revenue(3)] [added: revenue(2)] | [removed: 23.4] [added: 23.2] | | % | | [removed: 24.0] [added: 23.4] | | % | | [removed: 23.3] [added: 24.0] | | % |
| SG&A | $ | [removed: 8,023] [added: 8,015] | | | $ | [removed: 7,547] [added: 8,023] | | | $ | [removed: 7,618] [added: 7,547] | |
| SG&A as a % of revenue | [removed: 19.0] [added: 18.7] | | % | | [removed: 19.2] [added: 19.0] | | % | | [removed: 19.3] [added: 19.2] | | % |
| Restructuring charges | $ | [removed: 10] [added: 47] | | | $ | [removed: 39] [added: 9] | | | $ | [removed: 198] [added: 31] | |
| Operating income | $ | [removed: 1,843] [added: 1,900] | | | $ | [removed: 1,854] [added: 1,843] | | | $ | [removed: 1,375] [added: 1,854] | |
| Operating income as a % of revenue | 4.4 | | % | | [removed: 4.7] [added: 4.4] | | % | | [removed: 3.5] [added: 4.7] | | % |
| Net earnings from continuing operations | $ | [removed: 999] [added: 1,464] | | | $ | [removed: 1,207] [added: 999] | | | $ | [removed: 807] [added: 1,207] | |
| Gain from discontinued [removed: operations(4)] [added: operations(3)] | $ | [removed: 1] [added: —] | | | $ | [removed: 21] [added: 1] | | | $ | [removed: 90] [added: 21] | |
| Net earnings | $ | [removed: 1,000] [added: 1,464] | | | $ | [removed: 1,228] [added: 1,000] | | | $ | [removed: 897] [added: 1,228] | |
| Diluted earnings per share from continuing operations | $ | [removed: 3.26] [added: 5.20] | | | $ | [removed: 3.74] [added: 3.26] | | | $ | [removed: 2.30] [added: 3.74] | |
| Diluted earnings per share | $ | [removed: 3.26] [added: 5.20] | | | $ | [removed: 3.81] [added: 3.26] | | | $ | [removed: 2.56] [added: 3.81] | |
| (1) | The Canadian brand [removed: consolidation that was initiated in] [added: consolidation, which included] the [removed: first quarter] [added: permanent closure] of [removed: fiscal 2016] [added: 66 Future Shop stores, the conversion of 65 Future Shop stores to Best Buy stores and the elimination of the Future Shop website,] had a material impact on a year-over-year basis on the [added: remaining] Canadian retail stores and [added: the] website. As such, beginning in the first quarter of fiscal 2016 through the third quarter of fiscal 2017, all store and website revenue was removed from the comparable sales base, and an International segment (comprised of Canada and Mexico) comparable sales metric [removed: has not been provided. Therefore, Consolidated comparable sales] for [removed: fiscal 2017 include revenue from continuing operations in] the [removed: Domestic segment for the] full year [removed: and the International segment for] [added: was not provided. Beginning in] the fourth quarter [removed: only, and Consolidated] [added: of fiscal 2017, we resumed reporting International] comparable sales [removed: for fiscal 2016 equal] [added: as revenue in] the [removed: Domestic] [added: International] segment [removed: comparable sales.] [added: was once again determined to be comparable.] Comparable sales also exclude the impact of the extra week in fiscal 2018. |
| [removed: (3)] [added: (2)] | Because retailers vary in how they record costs of operating their supply chain between cost of goods sold and SG&A, our gross profit rate and SG&A rate may not be comparable to other retailers' corresponding rates. For additional information regarding costs classified in cost of goods sold and SG&A, refer to Note 1, Summary of Significant Accounting Policies, of the Notes to Consolidated Financial Statements, included in Item 8, Financial Statements and Supplementary Data, of this Annual Report on Form 10-K. |
| [removed: (4)] [added: (3)] | Includes both gain from discontinued operations and net earnings from discontinued operations. |
| Non-comparable [removed: sales(1)] [added: sales impact(1)] | 1.5 | % |
| (1) | Non-comparable sales [removed: reflects] [added: reflect] the impact of net store opening and closing activity, the impact of the extra week in fiscal 2018, as well as the impact of revenue streams not included within our comparable sales calculation, such as profit-share revenue, certain credit card revenue, gift card [removed: breakage] [added: breakage, commercial sales] and sales of merchandise to wholesalers and dealers, as applicable. |
For further discussion of each segment's [removed: gross profit] rate [removed: changes,] [added: changes and restructuring charges,] see Segment Performance Summary, below.
Fiscal [removed: 2017] [added: 2019] Results Compared With Fiscal [removed: 2016][added: 2018]
The components of the [removed: 0.3%] [added: 1.7%] revenue [removed: decrease] [added: increase] in fiscal [removed: 2017] [added: 2019] were as follows:
| Comparable sales impact | [removed: 0.2] [added: 4.4] | % |
| Non-comparable [removed: sales(1)] [added: sales impact(1)] | [removed: (0.3] [added: (2.5] | )% |
| [removed: Total revenue decrease] [added: Revenue % increase (decrease)] | [added: 1.7 | | % | | 7.0 | | % | |] (0.3 | [added: |] )% |
We strive to enrich the lives of consumers through technology, whether they connect with us online, visit our stores or invite us into their homes.
We do this by solving technology problems and addressing key human needs across a range of areas, including entertainment, productivity, communication, food preparation, security and health and wellness.
The International segment is comprised of all operations in Canada and Mexico.
Fiscal 2019 and fiscal 2017 included 52 weeks, while fiscal 2018 included 53 weeks with the additional week occurring in the fiscal fourth quarter.
On March 1, 2018, we announced our intent to close all of our 257 remaining Best Buy Mobile stand-alone stores in the U.S. As a result, all revenue related to these stores has been excluded from the comparable sales calculation beginning in March 2018.
On October 1, 2018, we acquired all outstanding shares of GreatCall.
Consistent with our comparable sales policy, the results of GreatCall are excluded from our comparable sales calculation for fiscal 2019.
We believe the disclosure of revenue changes in constant currency provides useful supplementary information to investors in light of significant fluctuations in currency rates.
On a full-year basis in fiscal 2019, we grew our Enterprise comparable sales by 4.8% on top of 5.6% in fiscal 2018, increased GAAP diluted EPS by 59.5% to $5.20 and increased our non-GAAP diluted EPS by 20.4% to $5.32.
In addition, we recorded annual revenue of $42.9 billion, GAAP operating income of $1.9 billion and non-GAAP operating income of $2.0 billion in fiscal 2019.
From a capital allocation standpoint, we returned $2.0 billion to our shareholders through share repurchases and dividends.
Strategically, we made significant progress in implementing our Best Buy 2020 strategy to enrich lives through technology and further develop our competitive differentiation by expanding what we do for our customers and how we interact with them.
The first example is the launch of our Total Tech Support program.
Having a service that provides members unlimited Geek Squad support for all their technology no matter where or when they bought it, is a compelling value proposition for our members.
We also expanded our In-Home Advisor program from 300 advisors to approximately 530 advisors and provided more than 175,000 free, in-home consultations to customers across the nation.
In health, we acquired a leading connected health services provider for aging consumers, GreatCall, and took a tangible step forward in our strategy to help seniors live longer in their homes with the help of technology.
We continued to elevate the customer experience around product fulfillment, enabled by the advancement of our supply chain transformation.
In parallel to the customer experience work, we continued to drive efficiencies and reduce costs in order to fund investments and offset pressures.
During fiscal 2019, we achieved $265 million in annualized cost reductions and efficiencies, bringing the cumulative total to $500 million towards our current goal set in the second quarter of fiscal 2018 to reach $600 million by the end of fiscal 2021.
In addition to these accomplishments, we are proud of our progress in advancing our Corporate Social Responsibility and Sustainability efforts.
In fact, we were just named number one on Barron’s annual “100 Most Sustainable Companies” list.
Looking ahead, we are focused on pursuing the opportunities in front of us to enrich lives through technology and provide services and solutions that solve real customer needs and build deeper customer relationships, and the related value creation opportunities that this entails.
In fiscal 2020, our priorities include increasing our Total Tech Support member base, growing our Health business and continuing to expand our In-Home Advisor program.
We will also continue to innovate and design multi-channel experiences that solve customer needs across our website, app and other channels in ways that enhance the experience across online and physical shopping and continue with our supply chain transformation, including using automation and process improvements to expand fulfillment options, increase delivery speed and improve delivery and installation.
In addition, as has been our brand over the last several years, we will endeavor to keep driving cost reductions and efficiencies throughout the business.
Consolidated revenue of $42.9 billion in fiscal 2019 increased 1.7% compared to fiscal 2018.
| Total revenue increase | 1.7 | % |
Our gross profit rate and SG&A rate changes in fiscal 2019 were primarily driven by our Domestic segment.
Restructuring charges increased from $10 million in fiscal 2018 to $46 million in fiscal 2019, primarily related to our Domestic segment.
Our operating income increased $57 million and our operating income as a percent of revenue remained flat in fiscal 2019 compared to fiscal 2018, primarily due to a decrease in gross profit rate offset by a lower SG&A rate.
Fiscal 2018 includes approximately $760 million of revenue from the extra week.
| Revenue % increase (decrease) | 1.7 | | % | | 6.7 | | % | | (0.3 | | )% |
| Total online revenue | $ | 6,528 | | | $ | 5,991 | | | $ | 4,843 | |
| Outlet centers | 6 | | | — | | | (1 | ) | | 5 | | | 3 | | | — | | | 8 | |
| Total Domestic segment stores | 1,369 | | | — | | | (71 | ) | | 1,298 | | | 4 | | | (276 | ) | | 1,026 | |
On March 1, 2018, we announced our intent to close all of our 257 remaining Best Buy Mobile stand-alone stores in the U.S., and all remaining stores were closed during the second quarter of fiscal 2019.
Fiscal 2019 Results Compared With Fiscal 2018
Domestic segment revenue of $39.3 billion in fiscal 2019 increased 1.7% compared to fiscal 2018.
Fiscal 2018 includes approximately $715 million of revenue from the extra week.
| Total revenue increase | 1.7 | % |
| | |
| --- | --- |
We are a leading provider of technology products, services and solutions.
We offer these products and services to customers who visit our stores, engage with Geek Squad agents or use our websites or mobile applications.
Fiscal 2017 and 2016 each included 52 weeks.
channels for a particular period to the corresponding period in the prior year.
We believe the disclosure of revenue changes in constant currency can provide useful supplementary information to investors in light of significant fluctuations in currency rates and our inability to report comparable store sales for the International segment from the first quarter of fiscal 2016 through the third quarter of fiscal 2017 as a result of the Canadian brand consolidation.
Refer to the Other Financial Measures section below for the detailed reconciliation of items that impacted the non-GAAP debt to EBITDAR ratio.
Management believes this ratio is an important indicator of our creditworthiness.
Furthermore, we believe that our non-GAAP debt to EBITDAR ratio is important for understanding our financial position and provides meaningful additional information about our ability to service our long-term debt and other fixed obligations and to fund our future growth.
We also believe our non-GAAP debt to EBITDAR ratio is relevant because it enables investors to compare our indebtedness to that of retailers who own, rather than lease, their stores.
Our decision to own or lease real estate is based on an assessment of our financial liquidity, our capital structure, our desire to own or to lease the location, the owner’s desire to own or to lease the location and the alternative that results in the highest return to our shareholders.
In November 2012, we introduced our transformation strategy called Renew Blue.
Since then we have stabilized comparable sales and increased our profitability.
In fiscal 2018, we declared Renew Blue complete and unveiled a new strategy: Best Buy 2020: Building the New Blue.
Customers are at the core of Best Buy 2020.
Technology continues to evolve, opening an increasing range of possibilities for our customers.
It is also creating more complexity and we believe many of our customers need our help.
The purpose of our strategy is to help our customers enrich their lives through technology.
We believe we can do this by focusing on customers’ underlying needs, such as entertainment, communications, security and health.
We continue to believe we have a material opportunity to grow the company.
Technology innovations continue to be vibrant and exciting and we believe our market offers room for differentiation.
Against this backdrop, we intend to fulfill our purpose and grow the company by expanding what we sell, evolving how we sell and building key enablers, all while continuing to reduce costs.
To these ends, in fiscal 2018, we expanded our In-Home Advisor program, introduced our Total Tech Support offering, continued to enhance associate proficiency, and continued to improve and simplify the online buying process for our customers.
We invested in enterprise customer relationship management capabilities and continued to develop our services platform.
We also began investing in the transformation of our supply chain, while continuing to make progress on our productivity goals.
Based on early results, as outlined in the Results of Operations section below, we believe our strategy is working.
Fiscal 2018 included 53 weeks, and fiscal 2017 and 2016 included 52 weeks.
| Revenue % gain (decline) | 7.0 | | % | | (0.3 | | )% | | (2.0 | | )% |
| Comparable sales % decline, excluding estimated impact of installment billing(1)(2) | n/a | | | | n/a | | | | (0.1 | | )% |
| (2) | Represents comparable sales, excluding the estimated revenue benefit from installment billing. In fiscal 2015, we began selling installment billing plans offered by mobile carriers to our customers to complement the more traditional two-year plans. While the two types of contracts have broadly similar overall economics, installment billing plans typically generate higher revenues due to higher proceeds for devices and higher cost of sales due to lower device subsidies. As we increased our mix of installment billing plans, we had an associated increase in revenue and cost of goods sold and a decrease in gross profit rate, with gross profit dollars relatively unaffected. This change in plan offer did not impact our International segment. Beginning in fiscal 2017, we no longer reported comparable sales, excluding the estimated revenue benefit from installment billing, as the mix of installment billing plans became comparable on a year-over-year basis. |
| | | |
| --- | --- | --- |
For further discussion of each segment's SG&A rate changes, see Segment Performance Summary, below.
For further discussion of each segment's restructuring charges, see Segment Performance Summary, below.
Consolidated revenue of $39.4 billion in fiscal 2017 decreased 0.3% compared to fiscal 2016.
Our gross profit rate increased 0.7% of revenue in fiscal 2017.
Our Domestic segment contributed a rate increase of 0.5% of revenue, while our International segment contributed 0.2%.
The SG&A rate remained flat on a year-over-year basis with both Domestic and International segments contributing flat year-over-year SG&A as a percentage of revenue.
Restructuring charges decreased from $198 million in fiscal 2016 to $39 million in fiscal 2017.
An excerpt. Shown here: 40 of 272 rewritten, 40 of 139 added and 40 of 195 removed. The counts are complete. For every sentence, read Item 7. Management's Discussion and Analysis of Financial Condition and Results of Operations. in the FY2019 filing and the FY2018 filing.
Item 7A. Quantitative and Qualitative Disclosures About Market Risk.
9 rewritten, 0 added, 1 removed, 9 unchanged
In addition, we have swapped [removed: all of] our fixed-rate debt to floating-rate such that the interest expense on this debt will vary with short-term interest rates.
Refer to Note 5, [removed: Debt,] [added: Derivative Instruments,] and Note 6, [removed: Derivative Instruments,] [added: Debt,] of the Notes to Consolidated Financial Statements, included in Item 8, Financial Statements and Supplementary Data, of this Annual Report on Form 10-K for further information regarding our interest rate swaps.
As of February [removed: 3, 2018,] [added: 2, 2019,] we had [removed: $3.1] [added: $2.0] billion of cash and [removed: short-term investments] [added: cash equivalents] and $1.2 billion of debt that has been swapped to floating rate.
Therefore, we had net cash and [removed: short-term investments] [added: cash equivalents] of [removed: $2.0] [added: $0.8] billion generating income that is exposed to interest rate changes.
As of February [removed: 3, 2018,] [added: 2, 2019,] a [removed: 50 basis] [added: 50-basis] point increase in short-term interest rates would have led to an estimated [removed: $10] [added: $4] million reduction in net interest expense, and conversely a [removed: 50 basis] [added: 50-basis] point decrease in short-term interest rates would have led to an estimated [removed: $10] [added: $4] million increase in net interest expense.
Refer to Note [removed: 6,] [added: 5,] Derivative Instruments, of the Notes to Consolidated Financial Statements, included in Item 8, Financial Statements and Supplementary Data, of this Annual Report on Form 10-K for further information regarding these instruments.
The [removed: weakening] [added: strengthening] of the U.S. dollar compared to the Canadian dollar [added: and Mexican peso] compared to the prior-year period had a [removed: positive] [added: negative] overall impact on our revenue as these currencies translated into [removed: more] [added: fewer] U.S. dollars.
[removed: We estimate that] [added: In fiscal 2018, the impact of] foreign currency exchange rate fluctuations had a net favorable impact on our revenue [removed: in fiscal 2018] of approximately $85 million and a net favorable impact on earnings of [added: approximately] $4 million.
[removed: In fiscal 2017, the impact of foreign] [added: Foreign] currency exchange rate fluctuations had a net unfavorable impact on our revenue [added: in fiscal 2019] of approximately [removed: $76] [added: $68] million and a net [removed: favorable] [added: unfavorable] impact on earnings of [added: approximately] $4 million.
Exchange rate fluctuations in the U.S. dollar compared to the Mexican peso compared to the prior-year period had an immaterial impact in the current year.
Item 1. Business.
29 rewritten, 21 added, 15 removed, 69 unchanged
We have [removed: retail] operations in the U.S., Canada and Mexico.
The Domestic segment is comprised of the operations in all states, districts and territories of the [removed: U.S.,] [added: U.S.] under various brand names including Best Buy, bestbuy.com, Best Buy [removed: Mobile, Best Buy] Direct, Best Buy Express, [added: Best Buy Mobile,] Geek Squad, [added: GreatCall,] Magnolia [removed: Home Theater] and Pacific Kitchen and Home.
On March 1, 2018, we announced our intent to close all of our 257 remaining Best Buy Mobile stand-alone stores in the [removed: U.S. We expect the majority of these] [added: U.S., and all remaining] stores [removed: to close] [added: were closed] during the [removed: half] [added: second quarter] of fiscal 2019.
Additional information on these changes is included in Item 7, Management's Discussion and Analysis of Financial Condition and Results of Operations, and Note [removed: 4,] [added: 2, Acquisition, and Note 9,] Restructuring Charges, of the Notes to Consolidated Financial Statements, included in Item 8, Financial Statements and Supplementary Data, of this Annual Report on Form 10-K.
We also have field operations that support [removed: retail] [added: retail, services and in-home] teams from our corporate headquarters and regional locations.
Our retail stores have procedures for inventory management, asset protection, transaction processing, customer relations, store administration, product sales and services, staff training and merchandise display that are largely [removed: standardized within each store brand.][added: standardized.]
All stores [removed: within each store brand] generally operate under standard procedures with a degree of flexibility for store management to address certain local market characteristics.
Our Canada and Mexico [removed: store] operations are similar to those in our Domestic segment.
Our Domestic and International segments have offerings in six revenue categories: [removed: Consumer Electronics,] Computing and Mobile Phones, [removed: Entertainment,] [added: Consumer Electronics,] Appliances, [added: Entertainment,] Services and Other.
| • | Consumer Electronics - digital imaging, health and fitness, home [removed: automation, home theater and] [added: theater,] portable audio (including [removed: headphones,] [added: headphones and] portable [removed: speakers] [added: speakers)] and [removed: voice assistants);] [added: smart home;] |
| • | Entertainment - drones, gaming hardware and software, movies, music, [removed: technology] toys, virtual reality and other software; |
| • | Appliances - major appliances [removed: (for example,] [added: (including] dishwashers, laundry, [removed: ovens, refrigerators, etc.)] [added: ovens] and [added: refrigerators) and] small appliances [removed: (for example,] [added: (including] blenders, coffee [removed: makers, etc.);] [added: makers and vacuums);] |
| • | Services - consultation, delivery, design, [removed: educational classes,] installation, memberships, protection plans, repair, [removed: set-up and] [added: set-up,] technical [removed: support;] [added: support] and [added: GreatCall offerings; and] |
[removed: U.S. Best Buy] [added: Customers who purchase products] online [removed: merchandise sales are typically either picked] [added: have the choice to pick] up [added: product] at U.S. Best Buy stores or [added: have it] delivered directly to [removed: customers] [added: them] from a distribution center or retail store.
Our Canada and Mexico distribution model is similar to [added: that of] our Domestic [removed: segment model.][added: segment.]
In fiscal [removed: 2018,] [added: 2019,] our 20 largest suppliers accounted for approximately [removed: 70%] [added: 64%] of the merchandise we purchased, with five suppliers – Apple, Samsung, Hewlett-Packard, Sony and [removed: Lenovo] [added: LG] – representing approximately [removed: 56%] [added: 51%] of total merchandise purchased.
Key elements to our inventory management process include the following: continuous monitoring of historical and projected consumer demand, continuous monitoring and adjustment of inventory receipt [removed: levels,] [added: levels and pricing,] agreements with vendors relating to reimbursement for the cost of markdowns or sales incentives and agreements with vendors relating to return privileges for certain products.
We had [removed: approximately 1,200] [added: 1,187] large-format and [removed: 300] [added: 51] small-format stores at the end of fiscal [removed: 2018] [added: 2019] throughout our Domestic and International segments.
Beginning in 2013, we opened vendor store-within-a-store concepts to allow closer vendor [removed: partnership] [added: partnerships] and a higher quality customer experience.
In fiscal [removed: 2019] [added: 2020] and beyond, we will continue to look for opportunities to optimize our store space, renegotiate leases and selectively open or close locations to support our [removed: operations, as evidenced by our recent announcement to close all of our remaining Best Buy Mobile stand-alone stores in the U.S.][added: operations.]
We own or have the right to use valuable intellectual property such as trademarks, service marks and tradenames, including, but not limited to, Best Buy, Best Buy [removed: Mobile,] [added: Express,] Best Buy [removed: Express,] [added: Mobile,] Dynex, Geek Squad, [added: GreatCall,] Insignia, [added: Jitterbug, Lively,] Magnolia, Modal, My Best Buy, Pacific Sales, Pacific Kitchen and Home, [added: Platinum,] Rocketfish, [removed: Platinum] [added: 5Star] and our Yellow Tag logo.
Our competitors are primarily multi-channel retailers, [removed: internet-based] [added: e-commerce] businesses, technology service providers, traditional store-based retailers, [removed: and] vendors and mobile network carriers who offer their products and services directly to customers.
In [removed: addition, in] the U.S., online-only [removed: operators are] [added: retailers historically were] not generally required to collect sales taxes in certain states.
We carefully monitor pricing offered by other retailers, [removed: and] [added: as] maintaining price competitiveness is one of our ongoing priorities.
In addition, we have [removed: a] price-matching [removed: policy in the U.S.] [added: policies] that [removed: allows] [added: allow] customers to request that we match a price offered by certain retail [removed: store] [added: stores] and online operators.
We believe our dedicated and knowledgeable people, [added: our] integrated [removed: online and] [added: online,] retail [added: and in-home] assets, [added: our] broad [added: and curated] product assortment, [added: our] strong vendor [removed: relationships, range of focused] [added: partnerships, our] service and support [removed: offerings,] [added: offerings designed to solve real customer needs, our unique ability to showcase technology in] distinct store [removed: formats, brand marketing strategies] [added: formats] and [added: our] supply chain are important ways in which we maintain [removed: this] [added: our competitive] advantage.
Environmental [added: and Social] Matters
[removed: Refer] [added: Please refer] to our Best Buy Corporate Responsibility & Sustainability Report on our website for further information on environmental [added: and social] performance.
At the end of fiscal [removed: 2018,] [added: 2019,] we employed [removed: approximately] [added: nearly] 125,000 full-time, part-time and seasonal employees in the U.S., [removed: Canada, Mexico] [added: Canada] and [removed: our sourcing office in China.][added: Mexico.]
We strive to enrich the lives of consumers through technology, whether they connect with us online, visit our stores or invite us into their homes.
We do this by solving technology problems and addressing key human needs across a range of areas, including entertainment, productivity, communication, food preparation, security and health and wellness.
On October 1, 2018, we acquired all of the outstanding shares of GreatCall, Inc. ("GreatCall"), a leading connected health services provider for aging consumers that offers easy-to-use mobile products and connected devices.
Both segments operate a multi-channel platform that allows customers to connect with us online, visit our stores or invite us into their homes.
These categories provide products and services to our customers that address key human needs across a range of areas, including entertainment, productivity, communication, food preparation, security and health and wellness.
We believe our ability to help customers online, in stores and in their homes and to connect technology product and solutions with customer needs offers us key competitive advantages.
However, a June 2018 Supreme Court decision (South Dakota v.
Wayfair) authorized states to require online-only retailers to collect and remit sales taxes.
As a result, the online-only sales tax advantage of some of our competitors will continue to erode as more states require online-only retailers to collect sales tax.
We are an organization built upon values-driven leadership and focused on our purpose to enrich lives through technology.
We seek to apply our sense of corporate responsibility and focus on sustainable development to our interactions with all our stakeholders, including our customers, our employees, our vendor partners, our stockholders, the community in which we operate and the environment.
Examples of such activities include the following.
For employees, we expanded our benefits to include enhanced mental health coverage, backup childcare, caregiver leave and paid time off for part-time employees.
We reinforced our commitment to diversity and inclusion by signing the CEO Action for Diversity & Inclusion Pledge and the Parity Pledge.
We are committed to supporting teens from underserved communities by building brighter futures through technology training and mentorship.
The primary way we do this is through our network of Best Buy Teen Tech Centers, which help prepare teens for careers in tech by providing them with opportunities to engage with the latest technology, learn core professional skills and connect with Best Buy employee mentors.
We currently have 25 Teen Tech Centers and plan to reach 60 in total over the next few years.
We continuously look for solutions that minimize carbon emissions in our operations and have achieved a significant carbon reduction toward our goal of 60 percent by 2020 (over a 2009 baseline), from both operational reductions and renewable sourcing.
We also help our customers live more sustainably by assorting ENERGY STAR® certified products, which help them
save money on utility bills.
In addition, we collected more than 180 million pounds of consumer electronics and appliances for recycling in fiscal 2019.
Today, we are a leading provider of technology products, services and solutions.
We offer these products and services to customers who visit our stores, engage with Geek Squad agents or use our websites or mobile applications.
In March 2015, we decided to consolidate Future Shop and Best Buy stores and websites in Canada under the Best Buy brand.
This resulted in permanently closing 66 Future Shop stores and converting 65 Future Shop stores to the Best Buy brand.
Financial information about our segments and geographic areas is included in Item 7, Management's Discussion and Analysis of Financial Condition and Results of Operations, and Note 11, Segment and Geographic Information, of the Notes to Consolidated Financial Statements, included in Item 8, Financial Statements and Supplementary Data, of this Annual Report on Form 10-K.
Both segments operate a multi-channel platform that allows customers to shop when and where they want.
We believe our ability to deliver a high-quality customer experience offers us a key competitive advantage.
We believe this advantage will continue to be eroded as sales tax rules are re-evaluated at both the state and federal levels.
We work hard to positively impact the environment and our communities.
We believe that reducing our impact on the environment via realistic yet assertive sustainability goals and advancing energy-efficient consumer solutions helps create long-term value for all of our stakeholders.
We continuously look for cost-effective solutions to minimize carbon emissions in our operations.
In fiscal 2018, we set a new goal to reduce our own carbon emissions by 60 percent by 2020 (over a 2009 baseline), from both operational reductions and renewable sourcing, and we currently expect to meet or exceed this goal.
We consider our employee relations to be good.
In addition, the public may read and copy any materials we file with the SEC at the SEC’s Public Reference Room at 100 F Street, NE, Washington, DC 20549.
The public may obtain information on the operation of the Public Reference Room by calling the SEC at 1-800-SEC-0330.
Item 3. Legal Proceedings.
1 rewritten, 0 added, 0 removed, 0 unchanged
For a description of our legal proceedings, see Note [removed: 12,] [added: 13,] Contingencies and Commitments, of the Notes to Consolidated Financial Statements, included in Item 8, Financial Statements and Supplementary Data, of this Annual Report on Form 10-K.
Cover and table of contents
32 rewritten, 6 added, 6 removed, 70 unchanged
For the fiscal year ended February [removed: 3, 2018][added: 2, 2019]
[removed: ][added: ]
[removed: x Yes] o [added: Yes x] No
Indicate by check mark whether the registrant is a large accelerated filer, an accelerated filer, a non-accelerated filer, [removed: or] a smaller reporting [added: company, or an emergency growth] company.
See the definitions of "large accelerated filer," "accelerated [removed: filer" and] [added: filer,"] "smaller reporting [added: company," and "emerging growth] company" in Rule 12b-2 of the Exchange Act.
The aggregate market value of the voting and non-voting common equity held by non-affiliates of the registrant as of [removed: July 28, 2017,] [added: August 3, 2018,] was approximately [removed: $13.0] [added: $15.7] billion, computed by reference to the price of [removed: $57.64] [added: $76.08] per share, the price at which the common equity was last sold on [removed: July 28, 2017,] [added: August 3, 2018,] as reported on the New York Stock Exchange-Composite Index.
As of March [removed: 29, 2018,] [added: 26, 2019,] the registrant had [removed: 282,713,593] [added: 267,804,388] shares of its Common Stock issued and outstanding.
Portions of the registrant's definitive Proxy Statement relating to its [removed: 2018] [added: 2019] Regular Meeting of Shareholders ("Proxy Statement") are incorporated by reference into Part III.
BEST BUY FISCAL [removed: 2018] [added: 2019] FORM 10-K
| [Item [removed: 1.](#sD5C91F5D80350D7929C008173F57EC5D)] [added: 1.](#sBE2188ACAB1E5B258F997F5A1684A2D4)] | [removed: [Business.](#sD5C91F5D80350D7929C008173F57EC5D)] [added: [Business.](#sBE2188ACAB1E5B258F997F5A1684A2D4)] | [removed: [4](#sD5C91F5D80350D7929C008173F57EC5D)] [added: [4](#sBE2188ACAB1E5B258F997F5A1684A2D4)] |
| [Item [removed: 1A.](#s5CF4EE5814AD26C5636F08173F7781E5)] [added: 1A.](#sFA0E75B180B059F7B480A160DC002033)] | [Risk [removed: Factors.](#s5CF4EE5814AD26C5636F08173F7781E5)] [added: Factors.](#sFA0E75B180B059F7B480A160DC002033)] | [removed: [7](#s5CF4EE5814AD26C5636F08173F7781E5)] [added: [7](#sFA0E75B180B059F7B480A160DC002033)] |
| [Item [removed: 1B.](#sBFF443467A23A7AC006308173FAAED22)] [added: 1B.](#s4349CED83E305B8CA6B9D695B044083A)] | [Unresolved Staff [removed: Comments.](#sBFF443467A23A7AC006308173FAAED22)] [added: Comments.](#s4349CED83E305B8CA6B9D695B044083A)] | [removed: [16](#sBFF443467A23A7AC006308173FAAED22)] [added: [16](#s4349CED83E305B8CA6B9D695B044083A)] |
| [Item [removed: 2.](#s8A8D8417760DD6D633AD08173AF031BF)] [added: 2.](#s16070EB64C965094A66C67F06E0FD4F7)] | [removed: [Properties.](#s8A8D8417760DD6D633AD08173AF031BF)] [added: [Properties.](#s16070EB64C965094A66C67F06E0FD4F7)] | [removed: [17](#s8A8D8417760DD6D633AD08173AF031BF)] [added: [17](#s16070EB64C965094A66C67F06E0FD4F7)] |
| [Item [removed: 3.](#s7853CC1F987E3B52E19108174008629B)] [added: 3.](#s5018EB8980765E61A349BF36BABC075D)] | [Legal [removed: Proceedings.](#s7853CC1F987E3B52E19108174008629B)] [added: Proceedings.](#s5018EB8980765E61A349BF36BABC075D)] | [removed: [20](#s7853CC1F987E3B52E19108174008629B)] [added: [19](#s5018EB8980765E61A349BF36BABC075D)] |
| [Item [removed: 4.](#s07199074ED1178AE3D200817401E92BD)] [added: 4.](#s37135CA914A050F3AAD1B4C050647D5A)] | [Mine Safety [removed: Disclosures.](#s07199074ED1178AE3D200817401E92BD)] [added: Disclosures.](#s37135CA914A050F3AAD1B4C050647D5A)] | [removed: [20](#s07199074ED1178AE3D200817401E92BD)] [added: [19](#s37135CA914A050F3AAD1B4C050647D5A)] |
| | [Executive Officers of the [removed: Registrant](#s916D1E41626BAEF752F2081740515B1C)] [added: Registrant](#s6A2C317CE6A35C6D855932AF45992943)] | [removed: [21](#s916D1E41626BAEF752F2081740515B1C)] [added: [20](#s6A2C317CE6A35C6D855932AF45992943)] |
| [Item [removed: 5.](#s682001FFF6DF9BD4D1AD0817394D2BF2)] [added: 5.](#s335BE015B4425819AA60A82158467AA9)] | [Market for Registrant's Common Equity, Related Stockholder Matters and Issuer Purchases of Equity [removed: Securities.](#s682001FFF6DF9BD4D1AD0817394D2BF2)] [added: Securities.](#s335BE015B4425819AA60A82158467AA9)] | [removed: [23](#s682001FFF6DF9BD4D1AD0817394D2BF2)] [added: [22](#s335BE015B4425819AA60A82158467AA9)] |
| [Item [removed: 6.](#sB15795ECC7681818DE22081736B9FBE5)] [added: 6.](#s33BCC977367157E19669DCA5C336FB2A)] | [Selected Financial [removed: Data.](#sB15795ECC7681818DE22081736B9FBE5)] [added: Data.](#s33BCC977367157E19669DCA5C336FB2A)] | [removed: [25](#sB15795ECC7681818DE22081736B9FBE5)] [added: [24](#s33BCC977367157E19669DCA5C336FB2A)] |
| [Item [removed: 7.](#s7D1E2EC359FA0B71BCF6081740F6A098)] [added: 7.](#s0372F188E8625C9BBFF05574F539A71B)] | [Management's Discussion and Analysis of Financial Condition and Results of [removed: Operations.](#s7D1E2EC359FA0B71BCF6081740F6A098)] [added: Operations.](#s0372F188E8625C9BBFF05574F539A71B)] | [removed: [26](#s7D1E2EC359FA0B71BCF6081740F6A098)] [added: [25](#s0372F188E8625C9BBFF05574F539A71B)] |
| [Item [removed: 7A.](#s1D948C9576797253E440081742EB0617)] [added: 7A.](#s99B5E9B718D35C08B464F10B7844B859)] | [Quantitative and Qualitative Disclosures About Market [removed: Risk.](#s1D948C9576797253E440081742EB0617)] [added: Risk.](#s99B5E9B718D35C08B464F10B7844B859)] | [removed: [49](#s1D948C9576797253E440081742EB0617)] [added: [45](#s99B5E9B718D35C08B464F10B7844B859)] |
| [Item [removed: 8.](#sFB9D91FB6EDE9A319B960817430B3F20)] [added: 8.](#sC3FCF473A9465F89B83018940D7525DD)] | [Financial Statements and Supplementary [removed: Data.](#sFB9D91FB6EDE9A319B960817430B3F20)] [added: Data.](#sC3FCF473A9465F89B83018940D7525DD)] | [removed: [51](#sFB9D91FB6EDE9A319B960817430B3F20)] [added: [47](#sC3FCF473A9465F89B83018940D7525DD)] |
| [Item [removed: 9.](#sA229219E2B0AE891DB7908174840EA03)] [added: 9.](#sEBB85B4E7FE45E88BAB63CD7E23E5051)] | [Changes in and Disagreements With Accountants on Accounting and Financial [removed: Disclosure.](#sA229219E2B0AE891DB7908174840EA03)] [added: Disclosure.](#sEBB85B4E7FE45E88BAB63CD7E23E5051)] | [removed: [91](#sA229219E2B0AE891DB7908174840EA03)] [added: [90](#sEBB85B4E7FE45E88BAB63CD7E23E5051)] |
| [Item [removed: 9A.](#s2029C7C78666A5CA232F0817484DB5C3)] [added: 9A.](#sED468E38AF9953DA9EC8C38441475A9A)] | [Controls and [removed: Procedures.](#s2029C7C78666A5CA232F0817484DB5C3)] [added: Procedures.](#sED468E38AF9953DA9EC8C38441475A9A)] | [removed: [91](#s2029C7C78666A5CA232F0817484DB5C3)] [added: [90](#sED468E38AF9953DA9EC8C38441475A9A)] |
| [Item [removed: 9B.](#sA360ACC9EF3ECB81653808174873EF31)] [added: 9B.](#sFF7C2575419D5FE583875DDC005FFD78)] | [Other [removed: Information.](#sA360ACC9EF3ECB81653808174873EF31)] [added: Information.](#sFF7C2575419D5FE583875DDC005FFD78)] | [removed: [91](#sA360ACC9EF3ECB81653808174873EF31)] [added: [90](#sFF7C2575419D5FE583875DDC005FFD78)] |
| [PART [removed: III](#s9EE12BDC759872B62FA20817489506B6)] [added: III](#sE808E76C7A3A5D7AB560D1E350C1754D)] | | [removed: [92](#s9EE12BDC759872B62FA20817489506B6)] [added: [91](#sE808E76C7A3A5D7AB560D1E350C1754D)] |
| [Item [removed: 10.](#s18F3CEA33F26A5BEC318081748C755CD)] [added: 10.](#sC64697E59F03586298A92D89DC371036)] | [Directors, Executive Officers and Corporate [removed: Governance.](#s18F3CEA33F26A5BEC318081748C755CD)] [added: Governance.](#sC64697E59F03586298A92D89DC371036)] | [removed: [92](#s18F3CEA33F26A5BEC318081748C755CD)] [added: [91](#sC64697E59F03586298A92D89DC371036)] |
| [Item [removed: 11.](#sC19A10E8F217AFA03780081748E9736B)] [added: 11.](#s09E3A1184BDB5E32BED62087E29D3D55)] | [Executive [removed: Compensation.](#sC19A10E8F217AFA03780081748E9736B)] [added: Compensation.](#s09E3A1184BDB5E32BED62087E29D3D55)] | [removed: [92](#sC19A10E8F217AFA03780081748E9736B)] [added: [91](#s09E3A1184BDB5E32BED62087E29D3D55)] |
| [Item [removed: 12.](#s43AC9E0180DA02B9AF750817491A05AA)] [added: 12.](#s57DEA453E3665E118E3F749043E44A69)] | [Security Ownership of Certain Beneficial Owners and Management and Related Stockholder [removed: Matters.](#s43AC9E0180DA02B9AF750817491A05AA)] [added: Matters.](#s57DEA453E3665E118E3F749043E44A69)] | [removed: [93](#s43AC9E0180DA02B9AF750817491A05AA)] [added: [92](#s57DEA453E3665E118E3F749043E44A69)] |
| [Item [removed: 13.](#s5F2F9DBB52C067558A6D0817493B4CBC)] [added: 13.](#s4D93934B42685839AD10BDA2E225A2EF)] | [Certain Relationships and Related Transactions, and Director [removed: Independence.](#s5F2F9DBB52C067558A6D0817493B4CBC)] [added: Independence.](#s4D93934B42685839AD10BDA2E225A2EF)] | [removed: [93](#s5F2F9DBB52C067558A6D0817493B4CBC)] [added: [92](#s4D93934B42685839AD10BDA2E225A2EF)] |
| [Item [removed: 14.](#s572B105A93C4F0E6AC6F0817496FA45A)] [added: 14.](#s83043BE3D7C35C81AD66EA7C924AF93E)] | [Principal [removed: Accounting] [added: Accountant] Fees and [removed: Services.](#s572B105A93C4F0E6AC6F0817496FA45A)] [added: Services.](#s83043BE3D7C35C81AD66EA7C924AF93E)] | [removed: [93](#s572B105A93C4F0E6AC6F0817496FA45A)] [added: [92](#s83043BE3D7C35C81AD66EA7C924AF93E)] |
| [Item [removed: 15.](#s3EF9E625B874D636E1B8081749C1AC3A)] [added: 15.](#s055FD135B6FC5A95A31E4A55F9F92244)] | [Exhibits, Financial Statement [removed: Schedules.](#s3EF9E625B874D636E1B8081749C1AC3A)] [added: Schedules.](#s055FD135B6FC5A95A31E4A55F9F92244)] | [removed: [94](#s3EF9E625B874D636E1B8081749C1AC3A)] [added: [93](#s055FD135B6FC5A95A31E4A55F9F92244)] |
| [Item [removed: 16.](#s8C9514B6292388C64B07081749E2FF5E)] [added: 16.](#s9562FE7DD2825F89810EAA27D6BDAFDD)] | [Form 10-K [removed: Summary.](#s8C9514B6292388C64B07081749E2FF5E)] [added: Summary.](#s9562FE7DD2825F89810EAA27D6BDAFDD)] | [removed: [96](#s8C9514B6292388C64B07081749E2FF5E)] [added: [95](#s9562FE7DD2825F89810EAA27D6BDAFDD)] |
10-K 1 bby-2019x10k.htm 10-K
| [PART I](#sF7ED9E834AE05AAFB04C4BC655A81C07) | | [4](#sF7ED9E834AE05AAFB04C4BC655A81C07) |
| [PART II](#s2D380A2C54D15197B1ACC5401EBFC989) | | [22](#s2D380A2C54D15197B1ACC5401EBFC989) |
| [PART IV](#sF13E6F47832C59B49AF4BD5F5D2B40F8) | | [93](#sF13E6F47832C59B49AF4BD5F5D2B40F8) |
| | [Signatures](#sCB9EB4000560576E846C930BD9A73087) | [96](#sCB9EB4000560576E846C930BD9A73087) |
| | [Schedule II](#sBB7984F6E2E25260AF9567A2D9338106) | [97](#sBB7984F6E2E25260AF9567A2D9338106) |
10-K 1 bby-2018x10k.htm 10-K
| [PART I](#s27ED39B6E5F6419A564308173F244E4B) | | [4](#s27ED39B6E5F6419A564308173F244E4B) |
| [PART II](#s1BC9F3F532AE21387FE808174072C164) | | [23](#s1BC9F3F532AE21387FE808174072C164) |
| [PART IV](#sFD9C9F1FFE889E22062B0817498F5EBE) | | [94](#sFD9C9F1FFE889E22062B0817498F5EBE) |
| | [Signatures](#sE98AD9A9FE6FB1959F7208174A151296) | [97](#sE98AD9A9FE6FB1959F7208174A151296) |
| | [Schedule II](#sF193E0839E45876FB967081730A10C00) | [98](#sF193E0839E45876FB967081730A10C00) |
Item 2. Properties.
73 rewritten, 13 added, 7 removed, 72 unchanged
The following table summarizes the location and total square footage of our Domestic segment stores [added: and outlet centers] at the end of fiscal [removed: 2018:][added: 2019:]
| | | U.S. Best Buy Stores | | | U.S. Best Buy [removed: Mobile Stand-Alone Stores] [added: Outlet Centers] | | | Pacific Sales Stores | |
| Alabama | | 12 | | | [removed: 2] [added: —] | | | — | |
| Arizona | | 22 | | | [removed: 1] [added: —] | | | — | |
| Arkansas | | [removed: 9] [added: 8] | | | [removed: 2] [added: —] | | | — | |
| Colorado | | 21 | | | [removed: 4] [added: —] | | | — | |
| Connecticut | | 12 | | | [removed: 2] [added: —] | | | — | |
| Delaware | | 3 | | | [removed: 1] [added: —] | | | — | |
| District of Columbia | | [removed: 2] [added: 1] | | | — | | | — | |
| Florida | | 64 | | | [removed: 28] [added: —] | | | — | |
| Georgia | | 28 | | | [removed: 8] [added: —] | | | — | |
| Idaho | | 5 | | | [removed: 1] [added: —] | | | — | |
| Illinois | | [removed: 46] [added: 43] | | | [removed: 11] [added: 1] | | | — | |
| Indiana | | 23 | | | [removed: 10] [added: —] | | | — | |
| Iowa | | 11 | | | [removed: 1] [added: —] | | | — | |
| Kansas | | 8 | | | [removed: 2] [added: —] | | | — | |
| Kentucky | | 9 | | | [removed: 7] [added: —] | | | — | |
| Louisiana | | 16 | | | [removed: 4] [added: —] | | | — | |
| Maryland | | 21 | | | [removed: 7] [added: —] | | | — | |
| Massachusetts | | 23 | | | [removed: 7] [added: —] | | | — | |
| Michigan | | 32 | | | [removed: 9] [added: —] | | | — | |
| Minnesota | | [removed: 20] [added: 19] | | | [removed: 11] [added: —] | | | — | |
| Mississippi | | 8 | | | [removed: 1] [added: —] | | | — | |
| Missouri | | 18 | | | [removed: 7] [added: —] | | | — | |
| Nebraska | | 5 | | | [removed: 3] [added: —] | | | — | |
| Nevada | | 10 | | | [removed: 3] [added: —] | | | — | |
| New Hampshire | | 6 | | | [removed: 3] [added: —] | | | — | |
| New Jersey | | [removed: 26] [added: 25] | | | [removed: 7] [added: —] | | | — | |
| New Mexico | | 5 | | | [removed: 2] [added: —] | | | — | |
| New York | | [removed: 53] [added: 52] | | | [removed: 8] [added: —] | | | — | |
| North Carolina | | 32 | | | [removed: 7] [added: 1] | | | — | |
| North Dakota | | 4 | | | [removed: 1] [added: —] | | | — | |
| Ohio | | 35 | | | [removed: 9] [added: —] | | | — | |
| Oklahoma | | 13 | | | [removed: 3] [added: —] | | | — | |
| Oregon | | [removed: 12] [added: 11] | | | [removed: 2] [added: —] | | | — | |
| Pennsylvania | | [removed: 37] [added: 36] | | | [removed: 12] [added: —] | | | — | |
| South Carolina | | 13 | | | [removed: 3] [added: —] | | | — | |
| South Dakota | | 2 | | | [removed: 1] [added: —] | | | — | |
| Tennessee | | 16 | | | [removed: 7] [added: —] | | | — | |
| Texas | | 103 | | | [removed: 22] [added: 2] | | | — | |
| California | | 116 | | | 2 | | | 21 | |
| GreatCall care centers and corporate office space | | 3 locations in 2 states | | 136 | | | — | |
| Total Canada store count | 132 | | | 45 | | | — | |
| --- | --- | --- | --- | --- | --- | --- | --- | --- |
| | Best Buy Stores | | | Best Buy Mobile Stores | | | Best Buy Express Stores | |
| Chihuahua | 1 | | | — | | | — | |
| Ciudad de México | 8 | | | — | | | 4 | |
| Estado de México | 3 | | | — | | | — | |
| Paseo Interlomas | 1 | | | — | | | — | |
| Puebla | 1 | | | — | | | — | |
| Queretaro | 1 | | | — | | | — | |
| | | | | | | | | |
| Total International store count | 161 | | | 45 | | | 6 | |
| California | | 117 | | | 16 | | | 28 | |
| | |
| --- | --- |
| (1) | On March 1, 2018, we announced our intent to close all of our 257 remaining Best Buy Mobile stand-alone stores in the U.S. We expect the majority of these stores to close during the first half of fiscal 2019. Refer to Note 4, Restructuring Charges, of the Notes to Consolidated Financial Statements, included in Item 8, Financial Statements and Supplementary Data, of this Annual Report on Form 10-K for further information about our restructuring activities. |
| Ciudad de Mexico | 8 | | | — | | | 4 | |
| Estado de Mexico | 4 | | | — | | | — | |
Almost all of our stores and a majority of our distribution facilities are leased.
An excerpt. Shown here: 40 of 73 rewritten, all 13 added and all 7 removed. The counts are complete. For every sentence, read Item 2. Properties. in the FY2019 filing and the FY2018 filing.
Item 4. Mine Safety Disclosures.
14 rewritten, 13 added, 29 removed, 45 unchanged
| Hubert Joly | | [removed: 58] [added: 59] | | Chairman and Chief Executive Officer | | [removed: 5] [added: 6] |
| Corie Barry | | [removed: 43] [added: 44] | | Chief Financial Officer [added: & Strategic Transformation Officer] | | [removed: 18] [added: 19] |
| Kamy Scarlett | | [removed: 54] [added: 55] | | Chief Human Resources Officer [added: & President, U.S. Retail Stores] | | [removed: 4] [added: 5] |
| Keith J. Nelsen | | [removed: 54] [added: 55] | | General Counsel and Secretary | | [removed: 12] [added: 13] |
| Mathew R. Watson | | [removed: 47] [added: 48] | | Senior Vice President, Controller and Chief Accounting Officer | | [removed: 12] [added: 13] |
He also serves on the executive committees [removed: for] [added: of] the [added: Business Council, the] Retail Industry Leaders Association and the Minnesota Business Partnership, and on the board of trustees of the Minneapolis Institute of Arts and the Minnesota Orchestra.
Corie Barry was appointed our Chief Financial Officer in June [removed: 2016.][added: 2016 and also our Chief Strategic Transformation Officer in September 2018.]
In this role, she is responsible for overseeing all aspects of [removed: global finance, as well as information technology,] [added: strategic transformation and growth,] digital [added: and] technology, [added: global finance, investor relations,] enterprise risk and compliance, [removed: audit, procurement] [added: integration management,] and [removed: pricing functions.][added: Best Buy Health, which includes GreatCall.]
[removed: She most recently] [added: Prior to her current role she] was the company’s chief strategic growth officer and the interim leader of Best Buy’s services organization from 2015 until 2016.
Kamy Scarlett was appointed our Chief Human Resources Officer in June [removed: 2017.][added: 2017, and also our President, U.S. Retail Stores in January 2019.]
In this role, she oversees talent development and the health and well-being of the [removed: more than] [added: nearly] 125,000 Best Buy employees [removed: worldwide.][added: worldwide, and the execution and operation of all domestic Best Buy store locations.]
She also previously held leadership roles at Loblaw Cos., Hudson’s Bay Co. and Dylex Inc. [added: Ms. Scarlett serves on the board of directors of Greater MSP and The Best Buy Foundation.]
[removed: He is responsible for the] [added: In addition, he leads] category management, merchandising, marketing, supply chain and [removed: Best Buy Direct functions] [added: real estate] for Best Buy’s core U.S. business.
Prior to his current role, he served as [added: senior executive vice president and] chief merchandising [added: and marketing] officer from [added: 2017 until September 2018; chief merchandising officer from] 2014 to 2017; president, home from 2013 to 2014; senior vice president, general manager - home business group [removed: from 2011 to 2013; senior vice president, home theatre from 2008 to 2011; and vice president, home entertainment from 2006 to 2008.]
(As of March 26, 2019)
| R. Michael (Mike) Mohan | | 51 | | Chief Operating Officer, Best Buy U.S. | | 15 |
| Brian Tilzer | | 48 | | Chief Digital and Technology Officer | | 1 |
She also serves on the board of directors of Domino’s Pizza, Inc.
Michael (Mike) Mohan has served as our Chief Operating Officer, Best Buy U.S. since September 2018.
His responsibilities include oversight over all customer channels for Best Buy’s domestic business, including retail, ecommerce and customer experience, services, home and Best Buy Direct.
from 2011 to 2013; senior vice president, home theatre from 2008 to 2011; and vice president, home entertainment from 2006 to 2008.
Brian Tilzer has served as our Chief Digital and Technology Officer since May 2018.
In this role, he is responsible for all aspects of information technology and digital at Best Buy to create a seamless and superior multichannel customer experience in support of the company’s Best Buy 2020 growth strategy.
With more than 25 years of experience in strategic business development, operations and information technology, Mr. Tilzer has deep expertise in understanding, defining and delivering the technology necessary to provide a superior customer experience in a multichannel environment.
Prior to joining Best Buy, he served as chief digital officer at CVS Health, the largest pharmacy healthcare provider in the U.S. He also has served as senior vice president of e-commerce for Staples and senior vice president of strategy and business development for Linens ’n Things.
Before that, he held leadership roles with Accenture, including helping Best Buy with several growth and performance-improvement programs.
Mr. Tilzer serves on the board of directors for Signet Jewelers, the largest retail jewelry chain in the U.S., Canada and United Kingdom.
(As of March 29, 2018)
| Shari L. Ballard | | 51 | | Senior Executive Vice President & President, Multi-channel Retail | | 25 |
| R. Michael (Mike) Mohan | | 50 | | Senior Executive Vice President & Chief Merchandising and Marketing Officer | | 14 |
| Asheesh Saksena | | 53 | | Chief Strategic Growth Officer | | 2 |
| Trish Walker | | 51 | | President, Services | | 2 |
Shari L.
Ballard is our Senior Executive Vice President and President, Multi-channel Retail.
In her role, she is responsible for all U.S. Best Buy stores, e-commerce, Best Buy Mexico and the company’s real estate strategy.
Prior to her current role, she served as president, U.S. retail from 2014 to 2017; chief human resources officer from 2014 to 2016; president, international and chief human resources officer from 2013 to 2014; executive vice president and president, international from 2012 to 2013; executive vice president, president - Americas from March 2010 until 2012; executive vice president - retail channel management from 2007 to 2010; and executive vice president - human resources and legal from 2004 to 2007.
Ms. Ballard joined us in 1993 and has served as senior vice president, vice president, and general and assistant store manager.
Ms. Ballard
serves on the board of directors of the University of Minnesota Foundation.
She previously served on the board of directors of the Delhaize Group, a Belgian-based international food retailer.
Michael (Mike) Mohan is our Senior Executive Vice President and Chief Merchandising and Marketing Officer.
Asheesh Saksena is our Chief Strategic Growth Officer.
In this role, he leads the company’s efforts to refine and implement our growth strategy.
He also is responsible for strategic planning across the company.
A highly strategic leader with more than 20 years of experience in creating and leading strategic growth, Mr. Saksena joined Best Buy in June 2016.
He previously served as the executive vice president of strategy and new business development from 2011 to 2016 at Cox Communications, one of the nation’s leading cable television providers.
Prior to that, he was the deputy chief strategy officer from 2008 until 2011 for Time Warner Cable.
He has also held leadership roles at Accenture and Tata Group.
Trish Walker was appointed our President, Services in April 2016.
In this role, she oversees all services in stores, online and in customers’ homes.
That includes the Geek Squad, a national tech-support organization with more than 20,000 agents dedicated to helping customers learn about and enjoy their technology, as well as the company’s service plan portfolio and customer care.
Before joining us in 2016, Ms. Walker spent 27 years at Accenture, most recently serving as senior managing director and North America retail practice and global client account lead.
Prior to leading the retail practice, she held numerous leadership positions in Accenture’s retail practice, including marketing, operations, SAP and change management.
She has worked with many leading retailers over the years, including Nordstrom, CVS, L.L. Bean, Macy’s and The Limited.
She also led Accenture’s work on the Best Buy account for several years, during which she worked closely with Geek Squad.
Ms. Walker also serves on the advisory board of iOwn, LLC, a computer software development company.
Item 5. Market for Registrant's Common Equity, Related Stockholder Matters and Issuer Purchases of Equity Securities.
12 rewritten, 7 added, 19 removed, 24 unchanged
Our common stock is traded on the New York Stock Exchange [added: ("NYSE")] under the ticker symbol BBY.
On [removed: March 1, 2018,] [added: February 28, 2019,] we announced [removed: a 32%] [added: an] increase in our regular quarterly dividend [removed: to] [added: from] $0.45 per [added: share to $0.50 per] share.
As of March [removed: 29, 2018,] [added: 26, 2019,] there were [removed: 2,566] [added: 267,804,388] holders of record of our common stock.
[removed: In] [added: On] February [removed: 2017,] [added: 23, 2019,] our Board authorized a new [removed: $5.0] [added: $3.0] billion share repurchase program that superseded the previous $5.0 billion authorization from [removed: June 2011.][added: February 2017, which had $1.5 billion remaining as of February 2, 2019.]
There is no expiration date governing the period over which we can repurchase shares under the February [removed: 2017] [added: 2019] authorization.
During fiscal [removed: 2018,] [added: 2019,] we repurchased and retired [removed: 35.1] [added: 21.2] million shares at a cost of [removed: $2.0] [added: $1.5] billion.
Between the end of fiscal [removed: 2018] [added: 2019] and March [removed: 29, 2018,] [added: 26, 2019,] we repurchased an incremental [removed: 3.5] [added: 0.9] million shares of our common stock at a cost of [removed: $249] [added: $62] million.
The following table presents the total number of shares of our common stock that we purchased during the fourth quarter of fiscal [removed: 2018,] [added: 2019,] the average price paid per share, the number of shares that we purchased as part of our publicly announced repurchase program and the approximate dollar value of shares that may yet be purchased at the end of the applicable fiscal period, pursuant to our February 2017 $5.0 billion share repurchase program:
| (1) | At the beginning of the fourth quarter of fiscal [removed: 2018,] [added: 2019,] there was [removed: $3.9] [added: $1.9] billion available for share repurchases under our February 2017 $5.0 billion share repurchase program. The "Approximate Dollar Value of Shares that May Yet Be Purchased Under the Program" [added: column] reflects the [removed: $863] [added: $349] million we purchased in the fourth quarter of fiscal [removed: 2018] [added: 2019] pursuant to such program. For additional information, see Note 7, Shareholders' Equity, of the Notes to the Consolidated Financial Statements included in Item 8, Financial Statements and Supplementary Data, of this Annual Report on Form 10-K. |
The graph assumes an investment of $100 at the close of trading on February [removed: 2, 2013,] [added: 1, 2014,] the last trading day of fiscal [removed: 2013,] [added: 2014,] in our common stock, the S&P 500 and the S&P Retailing Group.
[removed: 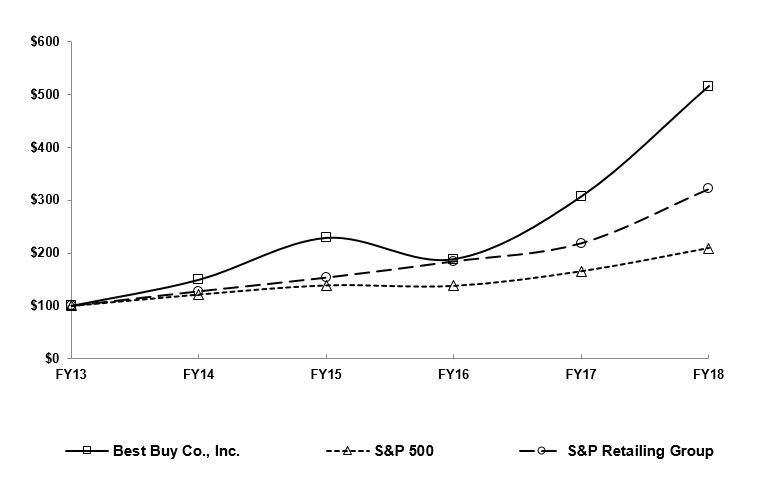][added: 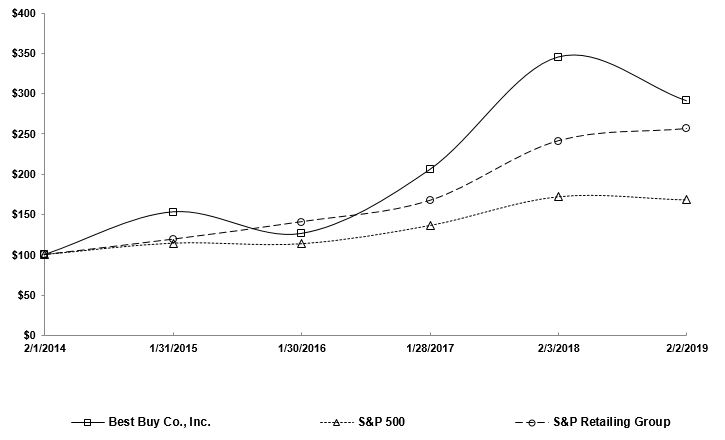]
| Fiscal [removed: Year | 2013 | | |] [added: Years Ended] | [added: February 1,] 2014 | | | | [added: January 31,] 2015 | | | | [added: January 30,] 2016 | | | | [added: January 28,] 2017 | | | | [added: February 3,] 2018 | | | [added: | February 2, 2019 | | |]
| Nov. 4, 2018 through Dec. 1, 2018 | 2,222,495 | | | $ | 65.88 | | | 2,222,495 | | | $ | 1,739,000,000 | |
| Dec. 2, 2018 through Jan. 5, 2019 | 2,393,284 | | | $ | 56.10 | | | 2,393,284 | | | $ | 1,604,000,000 | |
| Jan. 6, 2019 through Feb. 2, 2019 | 1,184,372 | | | $ | 57.43 | | | 1,184,372 | | | $ | 1,536,000,000 | |
| Total fiscal 2019 fourth quarter | 5,800,151 | | | $ | 60.12 | | | 5,800,151 | | | $ | 1,536,000,000 | |
| Best Buy Co., Inc. | $ | 100.00 | | | $ | 153.08 | | | $ | 126.20 | | | $ | 205.59 | | | $ | 345.38 | | | $ | 290.98 | |
| S&P 500 | 100.00 | | | | 114.22 | | | | 113.46 | | | | 136.20 | | | | 172.17 | | | | 168.19 | | |
| S&P Retailing Group | 100.00 | | | | 119.10 | | | | 140.73 | | | | 167.11 | | | | 241.08 | | | | 256.26 | | |
The table below sets forth the high and low sales prices of our common stock as reported on the New York Stock Exchange – Composite Index and the dividends declared and paid during the periods indicated.
| | | | | | | | | | | | | | | | | | | | | | | | |
| --- | --- | --- | --- | --- | --- | --- | --- | --- | --- | --- | --- | --- | --- | --- | --- | --- | --- | --- | --- | --- | --- | --- | --- |
| | Sales Price | | | | | | | | | | | | | | | | Dividends Declared and Paid | | | | | | |
| | Fiscal 2018 | | | | | | | | Fiscal 2017 | | | | | | | | Fiscal Year | | | | | | |
| | High | | | | Low | | | | High | | | | Low | | | | 2018 | | | | 2017 | | |
| First quarter | $ | 52.67 | | | $ | 41.67 | | | $ | 34.95 | | | $ | 26.10 | | | $ | 0.34 | | | $ | 0.73 | |
| Second quarter | 61.95 | | | | 50.29 | | | | 33.63 | | | | 28.76 | | | | 0.34 | | | | 0.28 | | |
| Third quarter | 63.32 | | | | 51.61 | | | | 40.58 | | | | 32.02 | | | | 0.34 | | | | 0.28 | | |
| Fourth quarter | 78.59 | | | | 52.92 | | | | 49.40 | | | | 37.10 | | | | 0.34 | | | | 0.28 | | |
On March 1, 2018, we announced our intent to repurchase $1.5 billion of shares in fiscal 2019, which reflects an updated two-year plan of $3.5 billion compared to the original $3.0 billion two-year plan announced on March 1, 2017.
At February 3, 2018, $3.0 billion of the $5.0 billion of share repurchases authorized by our Board in February 2017 was available for future share repurchases.
| Oct. 29, 2017 through Nov. 25, 2017 | 3,505,721 | | | $ | 56.13 | | | 3,505,721 | | | $ | 3,694,000,000 | |
| Nov. 26, 2017 through Dec. 30, 2017 | 5,070,197 | | | $ | 64.00 | | | 5,070,197 | | | $ | 3,370,000,000 | |
| Dec. 31, 2017 through Feb. 3, 2018 | 4,672,740 | | | $ | 73.06 | | | 4,672,740 | | | $ | 3,029,000,000 | |
| Total fiscal 2018 fourth quarter | 13,248,658 | | | $ | 65.11 | | | 13,248,658 | | | $ | 3,029,000,000 | |
| Best Buy Co., Inc. | $ | 100.00 | | | $ | 149.45 | | | $ | 228.78 | | | $ | 188.60 | | | $ | 307.25 | | | $ | 516.16 | |
| S&P 500 | 100.00 | | | | 121.52 | | | | 138.80 | | | | 137.88 | | | | 165.51 | | | | 209.22 | | |
| S&P Retailing Group | 100.00 | | | | 127.72 | | | | 153.64 | | | | 184.32 | | | | 218.76 | | | | 321.37 | | |
Item 6. Selected Financial Data.
26 rewritten, 8 added, 8 removed, 31 unchanged
| Fiscal Year | [removed: 2018(1)(2)] [added: 2019(1)] | | | | [removed: 2017(3)] [added: 2018(2)(3)] | | | | [removed: 2016(4)] [added: 2017(4)] | | | | [removed: 2015(5)] [added: 2016(5)] | | | | [removed: 2014(6)] [added: 2015(6)] | | |
| Revenue | $ | [removed: 42,151] [added: 42,879] | | | $ | [removed: 39,403] [added: 42,151] | | | $ | [removed: 39,528] [added: 39,403] | | | $ | [removed: 40,339] [added: 39,528] | | | $ | [removed: 40,611] [added: 40,339] | |
| Operating income | [removed: 1,843] [added: 1,900] | | | | [removed: 1,854] [added: 1,843] | | | | [removed: 1,375] [added: 1,854] | | | | [removed: 1,450] [added: 1,375] | | | | [removed: 1,144] [added: 1,450] | | |
| Net earnings from continuing operations | [removed: 999] [added: 1,464] | | | | [removed: 1,207] [added: 999] | | | | [removed: 807] [added: 1,207] | | | | [removed: 1,246] [added: 807] | | | | [removed: 695] [added: 1,246] | | |
| Gain (loss) from discontinued operations | [removed: 1] [added: —] | | | | [removed: 21] [added: 1] | | | | [removed: 90] [added: 21] | | | | [removed: (11] [added: 90] | | [removed: )] | | [removed: (172] [added: (11] | | ) |
| Net earnings including noncontrolling interests | [removed: 1,000] [added: 1,464] | | | | [removed: 1,228] [added: 1,000] | | | | [removed: 897] [added: 1,228] | | | | [removed: 1,235] [added: 897] | | | | [removed: 523] [added: 1,235] | | |
| Net earnings attributable to Best Buy Co., Inc. shareholders | [removed: 1,000] [added: 1,464] | | | | [removed: 1,228] [added: 1,000] | | | | [removed: 897] [added: 1,228] | | | | [removed: 1,233] [added: 897] | | | | [removed: 532] [added: 1,233] | | |
| Net earnings from continuing operations | $ | [removed: 3.26] [added: 5.20] | | | $ | [removed: 3.74] [added: 3.26] | | | $ | [removed: 2.30] [added: 3.74] | | | $ | [removed: 3.53] [added: 2.30] | | | $ | [removed: 2.00] [added: 3.53] | |
| Net gain (loss) from discontinued operations | — | | | | [removed: 0.07] [added: —] | | | | [removed: 0.26] [added: 0.07] | | | | [removed: (0.04] [added: 0.26] | | [removed: )] | | [removed: (0.47] [added: (0.04] | | ) |
| Net earnings | [removed: 3.26] [added: 5.20] | | | | [removed: 3.81] [added: 3.26] | | | | [removed: 2.56] [added: 3.81] | | | | [removed: 3.49] [added: 2.56] | | | | [removed: 1.53] [added: 3.49] | | |
| Cash dividends declared and paid | [removed: 1.36] [added: 1.80] | | | | [removed: 1.57] [added: 1.36] | | | | [removed: 1.43] [added: 1.57] | | | | [removed: 0.72] [added: 1.43] | | | | [removed: 0.68] [added: 0.72] | | |
| Comparable sales [removed: gain (decline)(7)] [added: growth(7)] | [removed: 5.6] [added: 4.8] | | % | | [removed: 0.3] [added: 5.6] | | % | | [removed: 0.5] [added: 0.3] | | % | | 0.5 | | % | | [removed: (1.0] [added: 0.5] | | [removed: )%] [added: %] |
| Gross profit rate | [removed: 23.4] [added: 23.2] | | % | | [removed: 24.0] [added: 23.4] | | % | | [removed: 23.3] [added: 24.0] | | % | | [removed: 22.4] [added: 23.3] | | % | | [removed: 23.1] [added: 22.4] | | % |
| Selling, general and administrative expenses rate | [removed: 19.0] [added: 18.7] | | % | | [removed: 19.2] [added: 19.0] | | % | | [removed: 19.3] [added: 19.2] | | % | | [removed: 18.8] [added: 19.3] | | % | | [removed: 20.0] [added: 18.8] | | % |
| Operating income rate | 4.4 | | % | | [removed: 4.7] [added: 4.4] | | % | | [removed: 3.5] [added: 4.7] | | % | | [removed: 3.6] [added: 3.5] | | % | | [removed: 2.8] [added: 3.6] | | % |
| Current ratio(8) | [removed: 1.3] [added: 1.2] | | | | [removed: 1.5] [added: 1.3] | | | | [removed: 1.4] [added: 1.5] | | | | [removed: 1.5] [added: 1.4] | | | | [removed: 1.4] [added: 1.5] | | |
| Total assets | $ | [removed: 13,049] [added: 12,901] | | | $ | [removed: 13,856] [added: 13,049] | | | $ | [removed: 13,519] [added: 13,856] | | | $ | [removed: 15,245] [added: 13,519] | | | $ | [removed: 13,990] [added: 15,245] | |
| Debt, including current portion | [removed: 1,355] [added: 1,388] | | | | [removed: 1,365] [added: 1,355] | | | | [removed: 1,734] [added: 1,365] | | | | [removed: 1,613] [added: 1,734] | | | | [removed: 1,647] [added: 1,613] | | |
| Total equity | [removed: 3,612] [added: 3,306] | | | | [removed: 4,709] [added: 3,612] | | | | [removed: 4,378] [added: 4,709] | | | | [removed: 5,000] [added: 4,378] | | | | [removed: 3,989] [added: 5,000] | | |
| International | [removed: 216] [added: 212] | | | | [removed: 212] [added: 216] | | | | [removed: 216] [added: 212] | | | | [removed: 283] [added: 216] | | | | [removed: 284] [added: 283] | | |
| International | [removed: 4,602] [added: 4,607] | | | | [removed: 4,511] [added: 4,602] | | | | [removed: 4,543] [added: 4,511] | | | | [removed: 6,470] [added: 4,543] | | | | [removed: 6,636] [added: 6,470] | | |
| [removed: (1)] [added: (3)] | Included within operating income, net earnings from continuing operations and net earnings attributable to Best Buy Co., Inc. shareholders for fiscal 2018 is $80 million ($51 million net of taxes) related to a one-time bonus for certain employees and $20 million ($13 million net of taxes) related to a one-time contribution to the Best Buy Foundation in response to future tax savings created by the Tax [removed: Cuts and Jobs Act ("tax reform" or "Tax Act") enacted into law in fiscal 2018.] [added: Act.] Also included in net earnings from continuing operations and net earnings attributable to Best Buy Co., Inc. shareholders for fiscal 2018 is $283 million of charges resulting from the Tax Act. Refer to Note [removed: 10,] [added: 11,] Income Taxes, in the Notes to the Consolidated Financial Statements, included in Item 8, Financial Statements and Supplementary Data, of this Annual Report on Form 10-K. |
| [removed: (3)] [added: (4)] | Included within net earnings from continuing operations and net earnings attributable to Best Buy Co., Inc. shareholders for fiscal 2017 includes $161 million ($100 million net of taxes) due to cathode ray tube ("CRT") and LCD litigation settlements reached, net of related legal fees and costs. Settlements relate to products purchased and sold in prior fiscal years. [removed: Refer to Note 12, Contingencies and Commitments, in the Notes to the Consolidated Financial Statements, included in Item 8, Financial Statements and Supplementary Data, of this Annual Report on Form 10-K.] |
| [removed: (4)] [added: (5)] | Included within operating income and net earnings from continuing operations for fiscal 2016 is $201 million ($159 million net of taxes) of restructuring charges from continuing operations recorded in fiscal 2016 related to measures we took to restructure our business. Net earnings attributable to Best Buy Co., Inc. shareholders for fiscal 2016 includes restructuring charges (net of tax and noncontrolling interest) from continuing operations. [removed: Refer to Note 4, Restructuring Charges, in the Notes to the Consolidated Financial Statements, included in Item 8, Financial Statements and Supplementary Data, of this Annual Report on Form 10-K.] |
| [removed: (5)] [added: (6)] | Included within net earnings from continuing operations and net earnings attributable to Best Buy Co., Inc. shareholders for fiscal 2015 includes $353 million due to a discrete benefit related to reorganizing certain European legal entities. |
| (7) | Our comparable sales calculation compares revenue from stores, websites and call centers operating for at least 14 full months, as well as revenue related to certain other comparable sales channels for a particular period to the corresponding period in the prior year. Relocated stores, as well as remodeled, expanded and downsized stores closed more than 14 days, are excluded from the comparable sales calculation until at least 14 full months after reopening. Acquisitions are included in the comparable sales calculation beginning with the first full quarter following the first anniversary of the date of the acquisition. The Canadian brand consolidation, which included the permanent closure of 66 Future Shop stores, the conversion of 65 Future Shop stores to Best Buy stores and the elimination of the Future Shop website, had a material impact on a year-over-year basis on the remaining Canadian retail stores and the website. As such, from the first quarter of fiscal 2016 through the third quarter of fiscal 2017, all Canadian store and website revenue was removed from the comparable sales base and the International segment no longer had a comparable metric. Therefore, Consolidated comparable sales equaled the Domestic segment comparable sales. Beginning in the fourth quarter of fiscal 2017, we resumed reporting International comparable sales as revenue [removed: in] [added: and] the International segment was once again deemed to be comparable and, as such, Consolidated comparable sales are once again equal to the aggregation of Domestic and International comparable sales. Comparable sales also exclude the impact of the extra week in fiscal 2018. [added: On March 1, 2018, we announced our intent to close all of our 257 remaining Best Buy Mobile stand-alone stores in the U.S. As a result, all revenue related to these stores has been excluded from the comparable sales calculation beginning in March 2018. On October 1, 2018, we acquired all outstanding shares of GreatCall. Consistent with our comparable sales policy, the results of GreatCall are excluded from our comparable sales calculation for fiscal 2019.] |
| Domestic(9) | 1,026 | | | | 1,298 | | | | 1,369 | | | | 1,416 | | | | 1,449 | | |
| Total | 1,238 | | | | 1,514 | | | | 1,581 | | | | 1,632 | | | | 1,732 | | |
| Domestic(9) | 39,500 | | | | 40,360 | | | | 41,039 | | | | 41,234 | | | | 41,734 | | |
| Total | 44,107 | | | | 44,962 | | | | 45,550 | | | | 45,777 | | | | 48,204 | | |
| (1) | Included within operating income, net earnings from continuing operations and net earnings attributable to Best Buy Co., Inc. shareholders for fiscal 2019 is $46 million ($35 million net of taxes) of restructuring charges from continuing operations related to measures we took to restructure our business; $35 million ($28 million net of taxes) of charges associated with the acquisition of GreatCall, including acquisition-related transaction costs and the non-cash amortization of definite-lived intangible assets; and $7 million ($5 million net of taxes) related to a one-time bonus for certain employees in response to future tax savings created by the Tax Cuts and Jobs Act ("tax reform" or "Tax Act") enacted into law in fiscal 2018. Also included in net earnings from continuing operations and net earnings attributable to Best Buy Co., Inc. shareholders for fiscal 2019 is $25 million of subsequent adjustments resulting from the Tax Act. Refer to Note 9, Restructuring Charges, Note 2, Acquisition, and Note 11, Income Taxes, in the Notes to the Consolidated Financial Statements, included in Item 8, Financial Statements and Supplementary Data, of this Annual Report on Form 10-K. |
| | |
| --- | --- |
| (9) | Includes Best Buy Outlet Centers for all fiscal years presented. |
| Common stock price: | | | | | | | | | | | | | | | | | | | |
| High | 78.59 | | | | 49.40 | | | | 42.00 | | | | 40.03 | | | | 44.66 | | |
| Low | 41.67 | | | | 26.10 | | | | 25.31 | | | | 22.30 | | | | 13.83 | | |
| Domestic | 1,293 | | | | 1,363 | | | | 1,415 | | | | 1,448 | | | | 1,495 | | |
| Total | 1,509 | | | | 1,575 | | | | 1,631 | | | | 1,731 | | | | 1,779 | | |
| Domestic | 40,179 | | | | 40,828 | | | | 41,216 | | | | 41,716 | | | | 42,051 | | |
| Total | 44,781 | | | | 45,339 | | | | 45,759 | | | | 48,186 | | | | 48,687 | | |
| (6) | Included within operating income and net earnings from continuing operations for fiscal 2014 is $149 million ($95 million net of taxes) of restructuring charges from continuing operations recorded in fiscal 2014 related to measures we took to restructure our business. Net earnings attributable to Best Buy Co., Inc. shareholders for fiscal 2014 includes restructuring charges (net of tax) from continuing operations. |
Item 8. Financial Statements and Supplementary Data.
551 rewritten, 447 added, 247 removed, 664 unchanged
Under the supervision and with the participation of our management, including our principal executive officer and principal financial officer, we assessed the effectiveness of our internal control over financial reporting as of February [removed: 3, 2018,] [added: 2, 2019,] using the criteria set forth by the Committee of Sponsoring Organizations of the Treadway Commission (COSO) in Internal Control — Integrated Framework (2013).
Based on our assessment, we have concluded that our internal control over financial reporting was effective as of February [removed: 3, 2018.][added: 2, 2019.]
Deloitte & Touche LLP, the independent registered public accounting firm that audited our consolidated financial statements for the year ended February [removed: 3, 2018,] [added: 2, 2019,] included in Item 8, Financial Statements and Supplementary Data, of this Annual Report on Form 10-K, has issued an unqualified attestation report on our internal control over financial reporting as of February [removed: 3, 2018.][added: 2, 2019.]
| [removed: ] [added: ] | | [removed: ] [added: ] |
We have audited the accompanying consolidated balance sheets of Best Buy Co., Inc. and subsidiaries (the "Company") as of February [removed: 3, 2018] [added: 2, 2019] and [removed: January 28, 2017,] [added: February 3, 2018,] the related consolidated statements of earnings, comprehensive income, cash flows, and changes in shareholders’ equity for each of the three years in the period ended February [removed: 3, 2018,] [added: 2, 2019,] and the related notes and the schedule listed in the Index at Item 15 (collectively referred to as the "financial statements").
In our opinion, the financial statements present fairly, in all material respects, the financial position of the Company as of February [removed: 3, 2018] [added: 2, 2019] and [removed: January 28, 2017,] [added: February 3, 2018,] and the results of its operations and its cash flows for each of the three years in the period ended February [removed: 3, 2018,] [added: 2, 2019,] in conformity with accounting principles generally accepted in the United States of America.
We have also audited, in accordance with the standards of the Public Company Accounting Oversight Board (United States) (PCAOB), the Company's internal control over financial reporting as of February [removed: 3, 2018,] [added: 2, 2019,] based on criteria established in Internal Control - Integrated Framework (2013) issued by the Committee of Sponsoring Organizations of the Treadway Commission and our report dated [removed: April 2, 2018,] [added: March 28, 2019,] expressed an unqualified opinion on the Company's internal control over financial reporting.
We have audited the internal control over financial reporting of Best Buy Co., Inc. and subsidiaries (the “Company”) as of February [removed: 3, 2018,] [added: 2, 2019,] based on criteria established in Internal Control - Integrated Framework (2013) issued by the Committee of Sponsoring Organizations of the Treadway Commission (COSO).
In our opinion, the Company maintained, in all material respects, effective internal control over financial reporting as of February [removed: 3, 2018,] [added: 2, 2019,] based on criteria established in Internal Control - Integrated Framework (2013) issued by COSO.
We have also audited, in accordance with the standards of the Public Company Accounting Oversight Board (United States) (PCAOB), the consolidated financial statements and financial statement schedule as of and for the year ended February [removed: 3, 2018,] [added: 2, 2019,] of the Company and our report dated [removed: April 2, 2018] [added: March 28, 2019,] expressed an unqualified opinion on those financial statements and financial statement schedule.
| | [added: February 2, 2019] | [added: | | |] February 3, 2018 | | | | January 28, 2017 | | |
| Cash and cash equivalents | [added: $] | [added: 1,980 | | |] $ | 1,101 | | | $ | 2,240 | |
| Short-term investments | | [removed: 2,032] [added: —] | | | | [removed: 1,681] [added: 2,032] | | |
| Receivables, net | | [removed: 1,049] [added: 1,015] | | | | [removed: 1,347] [added: 1,049] | | |
| Merchandise inventories | | [removed: 5,209] [added: 5,409] | | | | [removed: 4,864] [added: 5,209] | | |
| Other current assets | | [removed: 438] [added: 466] | | | | [removed: 384] [added: 438] | | |
| Total current assets | | [removed: 9,829] [added: 8,870] | | | | [removed: 10,516] [added: 9,829] | | |
| Land and buildings | | [removed: 623] [added: 637] | | | | [removed: 618] [added: 623] | | |
| Leasehold improvements | | [removed: 2,327] [added: 2,119] | | | | [removed: 2,227] [added: 2,327] | | |
| Fixtures and equipment | | [removed: 5,410] [added: 5,865] | | | | [removed: 4,998] [added: 5,410] | | |
| Property under capital and financing leases | | [removed: 340] [added: 579] | | | | [removed: 300] [added: 340] | | |
| Less accumulated depreciation | | [removed: 6,279] [added: 6,690] | | | | [removed: 5,850] [added: 6,279] | | |
| Net property and equipment | | [removed: 2,421] [added: 2,510] | | | | [removed: 2,293] [added: 2,421] | | |
| Goodwill | | [removed: 425] [added: 915] | | | | 425 | | |
| Other [removed: Assets] [added: assets] | | [removed: 374] [added: 606] | | | | [removed: 622] [added: 374] | | |
| Total [removed: Assets] [added: assets] | [added: $] | [added: 12,901 | | |] $ | 13,049 | | | $ | 13,856 | |
| Accounts payable | | $ | [removed: 4,873] [added: 5,257] | | | $ | [removed: 4,984] [added: 4,873] | |
| Unredeemed gift card liabilities | | [removed: 385] [added: 290] | | | | [removed: 427] [added: 385] | | |
| Deferred revenue | | [removed: 453] [added: 446] | | | | [removed: 418] [added: 453] | | |
| Accrued compensation and related expenses | | [removed: 561] [added: 482] | | | | [removed: 358] [added: 561] | | |
| Accrued liabilities | [removed: | 864] [added: $] | [added: 69] | | | [removed: 865] [added: $] | [added: 67] | |
| Current portion of long-term debt | | [removed: 544] [added: 56] | | | | [removed: 44] [added: 544] | | |
| Total current liabilities | | [removed: 7,817] [added: 7,513] | | | | [removed: 7,122] [added: 7,817] | | |
| [removed: Long-Term Liabilities] [added: Long-term liabilities] | | [removed: 809] [added: 750] | | | | [removed: 704] [added: 809] | | |
| [removed: Long-Term Debt] [added: Long-term debt] | | [removed: 811] [added: 1,332] | | | | [removed: 1,321] [added: 811] | | |
| Contingencies and [removed: Commitments] [added: commitments] (Note [removed: 12)] [added: 13)] | | | | | | | | |
| Common stock, $0.10 par value: Authorized — 1.0 billion shares; Issued and outstanding — [removed: 282,988,000] [added: 265,703,000] and [removed: 311,108,000] [added: 282,988,000] shares, respectively | | [removed: 28] [added: 27] | | | | [removed: 31] [added: 28] | | |
| Retained earnings | | [removed: 3,270] [added: 2,985] | | | | [removed: 4,399] [added: 3,270] | | |
| Accumulated other comprehensive income | | [removed: 314] [added: 294] | | | | [removed: 279] [added: 314] | | |
| Total equity | | [removed: 3,612] [added: 3,306] | | | | [removed: 4,709] [added: 3,612] | | |
March 28, 2019
March 28, 2019
| | | February 2, 2019 | | | | February 3, 2018 | | |
| Gross property and equipment | | 9,200 | | | | 8,700 | | |
| Accrued liabilities | | 982 | | | | 1,001 | | |
| Net earnings | $ | 1,464 | | | $ | 1,000 | | | $ | 1,228 | |
| Depreciation and amortization | 770 | | | | 683 | | | | 654 | | |
| Acquisition of businesses, net of cash acquired | (787 | | ) | | — | | | | — | | |
| Borrowings of debt | 498 | | | | — | | | | — | | |
| | | | | | | | | | | | | | | | | | | | | | | | | | | |
| --- | --- | --- | --- | --- | --- | --- | --- | --- | --- | --- | --- | --- | --- | --- | --- | --- | --- | --- | --- | --- | --- | --- | --- | --- | --- | --- |
| | | | | | | | | | | | | | | | | | | | | | | | | | | |
| Issuance of common stock | 8 | | | 1 | | | | — | | | | 170 | | | | — | | | | — | | | | 171 | | |
| Issuance of common stock | 7 | | | 1 | | | | — | | | | 162 | | | | — | | | | — | | | | 163 | | |
| Adoption of ASU 2014-09 | — | | | — | | | | — | | | | — | | | | 73 | | | | — | | | | 73 | | |
| Net earnings | — | | | — | | | | — | | | | — | | | | 1,464 | | | | — | | | | 1,464 | | |
| Repurchase of common stock | (21 | ) | | (1 | | ) | | — | | | | (167 | | ) | | (1,325 | | ) | | — | | | | (1,493 | | ) |
| Balances at February 2, 2019 | 266 | | | $ | 27 | | | $ | — | | | $ | — | | | $ | 2,985 | | | $ | 294 | | | $ | 3,306 | |
We strive to enrich the lives of consumers through technology, whether they connect with us online, visit our stores or invite us into their homes.
We do this by solving technology problems and addressing key human needs across a range of areas, including entertainment, productivity, communication, food preparation, security and health and wellness.
On October 1, 2018, we acquired all of the outstanding shares of GreatCall, Inc. ("GreatCall").
In February 2016, the Financial Accounting Standards Board ("FASB") issued Accounting Standards Update ("ASU") 2016-02, Leases, which will require the recognition of right-of-use ("ROU") assets and lease liabilities on the balance sheet for operating leases.
Leases will be classified as either finance or operating, with classification affecting the pattern of expense recognition in the income statement.
Under the new standard, disclosures are required to meet the objective of enabling users of financial statements to assess the amount, timing and uncertainty of cash flows arising from leases.
We will be adopting the “Comparatives Under 840 Option” approach to transition.
Under this method, financial information related to periods prior to adoption will be as originally reported under the current standard - Accounting Standards
Codification ("ASC") 840, Leases.
The effects of adopting the new standard (ASC 842, Leases) in fiscal 2020 will be recognized as a cumulative-effect adjustment to retained earnings as of the beginning of the fiscal first quarter.
We will elect the package of practical expedients permitted under the transition guidance within the new standard, which among other things, allows us to carryforward the historical lease classification as operating or capital leases.
The most significant impact of adoption will be the recognition of ROU assets and lease liabilities in the range of approximately $2.6 billion to $3.0 billion for operating leases, while our accounting for existing capital leases remains substantially unchanged.
We do not believe the standard will materially affect our consolidated statements of earnings or cash flows.
As part of our adoption, we have also modified our control procedures and processes.
In January 2017, the FASB issued ASU No. 2017-04, Intangibles-Goodwill and Other (Topic 350): Simplifying the Test for Goodwill Impairment, which eliminates the requirement to calculate the implied fair value of goodwill (i.e., Step 2 of the current goodwill impairment test) to measure a goodwill impairment charge.
Instead, entities will record an impairment charge based on the excess of a reporting unit’s carrying amount over its fair value (i.e., measure the charge based on the current Step 1).
We do not believe the new guidance, which is effective for fiscal years beginning after December 15, 2019, will impact our consolidated financial statements, but are still evaluating the impact it will have on future annual or interim goodwill impairment tests performed.
In August 2018, the FASB issued ASU 2018-13, Fair Value Measurement - Disclosure Framework (Topic 820).
The updated guidance improves the disclosure requirements for fair value measurements.
The updated guidance is effective for fiscal years, and interim periods within those fiscal years, beginning after December 15, 2019.
We are currently evaluating the impact of adopting the updated provisions.
In August 2018, the FASB issued ASU 2018-15, Intangibles-Goodwill and Other - Internal Use Software (Subtopic 350-40): Customer's Accounting for Implementation Costs Incurred in a Cloud Computing Arrangement That is a Service Contract.
April 2, 2018
| | | 8,700 | | | | 8,143 | | |
| Accrued income taxes | | 137 | | | | 26 | | |
| Proceeds from sale of business, net of cash transferred | — | | | | — | | | | (51 | | ) |
| Proceeds from property disposition | 2 | | | | 56 | | | | — | | |
| | | | | | | | | | | | | | | | | | | | | | | | | | | | | | | | | | | |
| --- | --- | --- | --- | --- | --- | --- | --- | --- | --- | --- | --- | --- | --- | --- | --- | --- | --- | --- | --- | --- | --- | --- | --- | --- | --- | --- | --- | --- | --- | --- | --- | --- | --- | --- |
| Balances at January 31, 2015 | 352 | | | $ | 35 | | | $ | — | | | $ | 437 | | | $ | 4,141 | | | $ | 382 | | | $ | 4,995 | | | $ | 5 | | | $ | 5,000 | |
| Sale of noncontrolling interest | — | | | — | | | | — | | | | — | | | | — | | | | — | | | | — | | | | (5 | | ) | | (5 | | ) |
| Restricted stock vested and stock options exercised | 5 | | | — | | | | — | | | | 40 | | | | — | | | | — | | | | 40 | | | | — | | | | 40 | | |
| Repurchase of common stock | (33 | ) | | (3 | | ) | | — | | | | (593 | | ) | | (404 | | ) | | — | | | | (1,000 | | ) | | — | | | | (1,000 | | ) |
| Settlement of accelerated share repurchase | — | | | — | | | | 55 | | | | — | | | | — | | | | — | | | | 55 | | | | — | | | | 55 | | |
| Tax benefits from stock options exercised, restricted stock vesting and employee stock purchase plan | — | | | — | | | | — | | | | 17 | | | | — | | | | — | | | | 17 | | | | — | | | | 17 | | |
| Restricted stock vested and stock options exercised | 8 | | | 1 | | | | — | | | | 163 | | | | — | | | | — | | | | 164 | | | | — | | | | 164 | | |
| Repurchase of common stock | (21 | ) | | (2 | | ) | | — | | | | (295 | | ) | | (454 | | ) | | — | | | | (751 | | ) | | — | | | | (751 | | ) |
| Restricted stock vested and stock options exercised | 7 | | | 1 | | | | — | | | | 155 | | | | — | | | | — | | | | 156 | | | | — | | | | 156 | | |
We are a leading provider of technology products, services and solutions.
We offer these products and services to customers who visit our stores, engage with Geek Squad agents or use our websites or mobile applications.
In May 2014, the Financial Accounting Standards Board ("FASB") issued Accounting Standards Update ("ASU") 2014-09, Revenue from Contracts with Customers.
We will adopt this standard in the first quarter of fiscal 2019 using the modified retrospective method.
Under this method, we will recognize the cumulative effect of the changes in retained earnings at the date of adoption, but will not restate prior periods.
We expect the impact of adoption to be immaterial to net earnings on an ongoing basis.
Our adoption assessment included a detailed review of contracts for each revenue stream and a comparison of historical accounting policies to the new standard.
Based on these procedures, we have determined the impact will be (1) minor changes
to the timing of recognition of revenues related to our gift cards and loyalty programs and certain third-party software licenses where we are the agent, and (2) presentation changes to certain immaterial revenues that are currently reported on a gross or net basis.
In addition, the balance sheet presentation of our sales return reserve will change to present a separate return asset and liability, instead of net presentation used currently.
Additionally, the adoption of ASU 2014-09 will result in increased footnote disclosures, particularly with regard to (1) revenue-related balance sheet accounts and associated activity in the fiscal period, (2) disaggregation of revenue by channel and product category, (3) unsatisfied performance obligations for our service contracts with a duration of over one year, (4) the pro-forma impact of changes to our financial statements in the initial year of adoption, and (5) qualitative disclosures related to the nature and terms of our sales, timing of the transfer of control and judgments used in our application of the five-step process.
In February 2016, the FASB issued ASU 2016-02, Leases, and has since issued additional ASUs to further clarify or add options to the issued guidance.
The new guidance was issued to increase transparency and comparability among companies by requiring most leases to be included on the balance sheet and by expanding disclosure requirements.
Based on the effective dates, we expect to adopt the new guidance in the first quarter of fiscal 2020 using the recently-proposed prospective method and have begun implementing required upgrades to our existing lease systems.
While we expect adoption to lead to a material increase in the assets and liabilities recorded on our balance sheet and an increase to our footnote disclosures related to leases, we are still evaluating the impact on our consolidated statement of earnings.
We also expect that adoption of the new standard will require changes to our internal controls over financial reporting.
The new guidance requires the recognition of the income tax consequences of an intra-entity transfer of an asset, other than inventory, when the transfer occurs.
We will adopt ASU 2016-16 in the first quarter of fiscal 2019.
Based on our preliminary assessment, we believe the impact of adopting the new guidance will be immaterial to our annual and interim financial statements.
The new guidance amends the hedge accounting recognition and presentation requirements.
Based on the effective dates, we will prospectively adopt this standard in the first quarter of fiscal 2019.
We believe the impact will be immaterial to our annual and interim financial statements.
The new guidance allows the reclassification from accumulated other comprehensive income to retained earnings for stranded tax effects resulting from the Tax Cuts and Jobs Act.
The guidance is effective for our fiscal 2020, with early adoption permitted.
An excerpt. Shown here: 40 of 551 rewritten, 40 of 447 added and 40 of 247 removed. The counts are complete. For every sentence, read Item 8. Financial Statements and Supplementary Data. in the FY2019 filing and the FY2018 filing.
Item 9A. Controls and Procedures.
3 rewritten, 1 added, 0 removed, 9 unchanged
Our management, including our Chief Executive Officer and Chief Financial Officer, evaluated the effectiveness of our disclosure controls and procedures (as defined in Rules 13a-15(e) and 15d-15(e) promulgated under the Exchange Act), as of February [removed: 3, 2018.][added: 2, 2019.]
Based on that evaluation, our Chief Executive Officer and Chief Financial Officer concluded that, as of February [removed: 3, 2018,] [added: 2, 2019,] our disclosure controls and procedures were effective.
There were no [added: other] changes in internal control over financial reporting during the fiscal fourth quarter ended February [removed: 3, 2018,] [added: 2, 2019,] that have materially affected, or are reasonably likely to materially affect, our internal control over financial reporting.
During fiscal 2019, we assessed and modified our internal controls in order to facilitate our adoption of the new lease accounting standard on February 3, 2019.
Item 12. Security Ownership of Certain Beneficial Owners and Management and Related Stockholder Matters.
2 rewritten, 1 added, 1 removed, 15 unchanged
The following table provides information about our common stock that may be issued under our equity compensation plans as of February [removed: 3, 2018:][added: 2, 2019:]
| (3) | Includes [removed: 4,003,384] [added: 3,881,751] shares of our common stock which have been reserved for issuance under our 2008 and 2003 Employee Stock Purchase Plans. |
| Equity compensation plans approved by security holders | 5,477,727 | | $ | 33.47 | | | 19,088,197 | |
| Equity compensation plans approved by security holders | 6,390,492 | | $ | 32.32 | | | 23,182,825 | |
Item 15. Exhibits, Financial Statement Schedules.
27 rewritten, 4 added, 8 removed, 35 unchanged
| Exhibit | | | | [added: |] Incorporated by Reference | | | | | | | Filed |
| No. | | [added: |] Exhibit Description | | Form | | Exhibit | | | Filing Date | | Herewith |
| [removed: [3.2](http://www.sec.gov/Archives/edgar/data/764478/000076447813000070/exhibit3192613.htm)] [added: [3.2](http://www.sec.gov/Archives/edgar/data/764478/000076447818000029/exhibit3161418.htm)] | | [Amended and Restated [removed: By-Laws](http://www.sec.gov/Archives/edgar/data/764478/000076447813000070/exhibit3192613.htm)] [added: By-Laws](http://www.sec.gov/Archives/edgar/data/764478/000076447818000029/exhibit3161418.htm)] | | 8-K | | 3.1 | | | [removed: 9/26/2013] [added: 6/14/2018] | | |
| [removed: [10.1](http://www.sec.gov/Archives/edgar/data/764478/000076447816000082/exhibit10163016-rcf.htm)] [added: [10.1](http://www.sec.gov/Archives/edgar/data/764478/000076447818000015/exhibit10142018-rcf.htm)] | | [Five-Year Credit Agreement dated as of [removed: June 27, 2016,] [added: April 17, 2018,] among Best Buy Co., Inc., the Subsidiary Guarantors, the Lenders and JPMorgan Chase Bank, N.A., as administrative [removed: agent](http://www.sec.gov/Archives/edgar/data/764478/000076447816000082/exhibit10163016-rcf.htm)] [added: agent](http://www.sec.gov/Archives/edgar/data/764478/000076447818000015/exhibit10142018-rcf.htm)] | | 8-K | | 10.1 | | | [removed: 6/30/2016] [added: 4/20/2018] | | |
| [removed: [*10.7](http://www.sec.gov/Archives/edgar/data/764478/000076447814000011/bby-2014ex1018.htm)] [added: [*10.7](http://www.sec.gov/Archives/edgar/data/764478/000076447814000011/bby-2014ex1019.htm)] | | [removed: [Best] [added: [Form of Best] Buy [removed: Mobile Performance Award Termination Agreement](http://www.sec.gov/Archives/edgar/data/764478/000076447814000011/bby-2014ex1018.htm)] [added: Co., Inc. Long-Term Incentive Program Award](http://www.sec.gov/Archives/edgar/data/764478/000076447814000011/bby-2014ex1019.htm)] | | 10-K | | [removed: 10.18] [added: 10.19] | | | 3/28/2014 | | |
| [removed: [*10.8](http://www.sec.gov/Archives/edgar/data/764478/000076447814000011/bby-2014ex1019.htm)] [added: [*10.9](http://www.sec.gov/Archives/edgar/data/764478/000076447814000066/bby11114ex101.htm)] | | [added: |] [Form of Best Buy Co., Inc. [removed: Long-Term] [added: Long Term] Incentive Program [removed: Award](http://www.sec.gov/Archives/edgar/data/764478/000076447814000011/bby-2014ex1019.htm)] [added: Award Agreement (2014)](http://www.sec.gov/Archives/edgar/data/764478/000076447814000066/bby11114ex101.htm)] | | [removed: 10-K] [added: 10-Q] | | [removed: 10.19] [added: 10.1] | | | [removed: 3/28/2014] [added: 12/5/2014] | | |
| [removed: [*10.9](http://www.sec.gov/Archives/edgar/data/764478/000076447814000011/bby-2014ex1020.htm)] [added: [*10.8](http://www.sec.gov/Archives/edgar/data/764478/000076447814000011/bby-2014ex1020.htm)] | | [Form of Best Buy Co., Inc. Director Restricted Stock Unit Award Agreement](http://www.sec.gov/Archives/edgar/data/764478/000076447814000011/bby-2014ex1020.htm) | | 10-K | | 10.20 | | | 3/28/2014 | | |
| [removed: [*10.10](http://www.sec.gov/Archives/edgar/data/764478/000076447814000011/bby-2014ex1021.htm)] [added: [*10.11](http://www.sec.gov/Archives/edgar/data/764478/000076447814000051/bby8214ex101.htm)] | | [added: |] [Form of [added: Best Buy Co., Inc.] Director Restricted Stock Unit Award Agreement [removed: for Non-U.S. Directors](http://www.sec.gov/Archives/edgar/data/764478/000076447814000011/bby-2014ex1021.htm)] [added: (2014)](http://www.sec.gov/Archives/edgar/data/764478/000076447814000051/bby8214ex101.htm)] | | [removed: 10-K] [added: 10-Q] | | [removed: 10.21] [added: 10.1] | | | [removed: 3/28/2014] [added: 9/10/2014] | | |
| [removed: [*10.11](http://www.sec.gov/Archives/edgar/data/764478/000076447814000066/bby11114ex101.htm)] [added: [*10.14](http://www.sec.gov/Archives/edgar/data/764478/000076447816000075/bby043016ex101.htm)] | | [added: |] [Form of Best Buy Co., Inc. [removed: Long Term] [added: Long-Term] Incentive Program Award Agreement [removed: (2014)](http://www.sec.gov/Archives/edgar/data/764478/000076447814000066/bby11114ex101.htm)] [added: (2016)](http://www.sec.gov/Archives/edgar/data/764478/000076447816000075/bby043016ex101.htm)] | | 10-Q | | 10.1 | | | [removed: 12/5/2014] [added: 6/9/2016] | | |
| [removed: [*10.12](http://www.sec.gov/Archives/edgar/data/764478/000076447814000035/bbys-861714.htm)] [added: [*10.10](http://www.sec.gov/Archives/edgar/data/764478/000076447814000035/bbys-861714.htm)] | | [added: |] [Best Buy Co., Inc. 2014 Omnibus Incentive Plan](http://www.sec.gov/Archives/edgar/data/764478/000076447814000035/bbys-861714.htm) | | S-8 | | 99 | | | 6/27/2014 | | |
| [removed: [*10.13](http://www.sec.gov/Archives/edgar/data/764478/000076447814000051/bby8214ex101.htm)] [added: [*10.13](http://www.sec.gov/Archives/edgar/data/764478/000076447815000042/bby8115ex101.htm)] | | [added: |] [Form of Best Buy Co., Inc. [removed: Director Restricted Stock Unit] [added: Long-Term Incentive Program] Award Agreement [removed: (2014)](http://www.sec.gov/Archives/edgar/data/764478/000076447814000051/bby8214ex101.htm)] [added: for Directors (2015)](http://www.sec.gov/Archives/edgar/data/764478/000076447815000042/bby8115ex101.htm)] | | 10-Q | | 10.1 | | | [removed: 9/10/2014] [added: 9/4/2015] | | |
| [removed: [*10.15](http://www.sec.gov/Archives/edgar/data/764478/000076447815000014/bby-2015ex1019.htm)] [added: [*10.12](http://www.sec.gov/Archives/edgar/data/764478/000076447815000014/bby-2015ex1019.htm)] | | [added: |] [Best Buy Sixth Amended and Restated Deferred Compensation Plan](http://www.sec.gov/Archives/edgar/data/764478/000076447815000014/bby-2015ex1019.htm) | | 10-K | | 10.19 | | | 3/31/2015 | | |
| [removed: [*10.16](http://www.sec.gov/Archives/edgar/data/764478/000076447815000042/bby8115ex101.htm)] [added: [*10.16](http://www.sec.gov/Archives/edgar/data/764478/000076447817000018/bby42917ex101.htm)] | | [added: |] [Form of Best Buy Co., Inc. Long-Term Incentive Program Award Agreement [removed: for Directors (2015)](http://www.sec.gov/Archives/edgar/data/764478/000076447815000042/bby8115ex101.htm)] [added: (2017) - Restricted Shares](http://www.sec.gov/Archives/edgar/data/764478/000076447817000018/bby42917ex101.htm)] | | 10-Q | | 10.1 | | | [removed: 9/4/2015] [added: 6/5/2017] | | |
| [removed: [*10.17](http://www.sec.gov/Archives/edgar/data/764478/000076447815000042/bby8115ex102.htm)] [added: [*10.19](http://www.sec.gov/Archives/edgar/data/764478/000076447817000032/bby72917ex102.htm)] | | [added: |] [Form of Best Buy Co., Inc. Long-Term Incentive Program Award Agreement for [removed: Non-U.S.] [added: U.S.] Directors [removed: (2015)](http://www.sec.gov/Archives/edgar/data/764478/000076447815000042/bby8115ex102.htm)] [added: (2017)](http://www.sec.gov/Archives/edgar/data/764478/000076447817000032/bby72917ex102.htm)] | | 10-Q | | 10.2 | | | [removed: 9/4/2015] [added: 9/5/2017] | | |
| [removed: [*10.18](http://www.sec.gov/Archives/edgar/data/764478/000076447816000075/bby043016ex101.htm)] [added: [*10.15](http://www.sec.gov/Archives/edgar/data/764478/000076447816000075/bby043016ex102.htm)] | | [added: |] [Form of Best Buy Co., Inc. Long-Term Incentive Program Award Agreement [removed: (2016)](http://www.sec.gov/Archives/edgar/data/764478/000076447816000075/bby043016ex101.htm)] [added: for Directors (2016)](http://www.sec.gov/Archives/edgar/data/764478/000076447816000075/bby043016ex102.htm)] | | 10-Q | | [removed: 10.1] [added: 10.2] | | | 6/9/2016 | | |
| [removed: [*10.19](http://www.sec.gov/Archives/edgar/data/764478/000076447816000075/bby043016ex102.htm)] [added: [*10.22](http://www.sec.gov/Archives/edgar/data/764478/000076447818000043/bby8418ex101-q2fy19.htm)] | | [added: |] [Form of Best Buy Co., Inc. Long-Term Incentive Program Award Agreement [removed: for Directors (2016)](http://www.sec.gov/Archives/edgar/data/764478/000076447816000075/bby043016ex102.htm)] [added: (2018) - Directors](http://www.sec.gov/Archives/edgar/data/764478/000076447818000043/bby8418ex101-q2fy19.htm)] | | 10-Q | | [removed: 10.2] [added: 10.1] | | | [removed: 6/9/2016] [added: 9/10/2018] | | |
| [removed: [*10.20](http://www.sec.gov/Archives/edgar/data/764478/000076447816000088/bby073016ex101.htm)] [added: [*10.20](http://www.sec.gov/Archives/edgar/data/764478/000076447818000024/bby5518ex101-q1fy19.htm)] | | [added: |] [Form of Best Buy Co., Inc. Long-Term Incentive Program Award Agreement [removed: for Non-U.S. Directors (2016)](http://www.sec.gov/Archives/edgar/data/764478/000076447816000088/bby073016ex101.htm)] [added: (2018) - Restricted Shares](http://www.sec.gov/Archives/edgar/data/764478/000076447818000024/bby5518ex101-q1fy19.htm)] | | 10-Q | | 10.1 | | | [removed: 9/30/2016] [added: 6/8/2018] | | |
| [removed: [*10.21](http://www.sec.gov/Archives/edgar/data/764478/000076447817000018/bby42917ex101.htm)] [added: [*10.17](http://www.sec.gov/Archives/edgar/data/764478/000076447817000018/bby42917ex102.htm)] | | [added: |] [Form of Best Buy Co., Inc. Long-Term Incentive Program Award Agreement (2017) - Restricted [removed: Shares](http://www.sec.gov/Archives/edgar/data/764478/000076447817000018/bby42917ex101.htm)] [added: Stock Units](http://www.sec.gov/Archives/edgar/data/764478/000076447817000018/bby42917ex102.htm)] | | 10-Q | | [removed: 10.1] [added: 10.2] | | | 6/5/2017 | | |
| [removed: [*10.22](http://www.sec.gov/Archives/edgar/data/764478/000076447817000018/bby42917ex102.htm)] [added: [*10.21](http://www.sec.gov/Archives/edgar/data/764478/000076447818000024/bby5518ex102-q1fy19.htm)] | | [added: |] [Form of Best Buy Co., Inc. Long-Term Incentive Program Award Agreement [removed: (2017)] [added: (2018)] - Restricted Stock [removed: Units](http://www.sec.gov/Archives/edgar/data/764478/000076447817000018/bby42917ex102.htm)] [added: Units](http://www.sec.gov/Archives/edgar/data/764478/000076447818000024/bby5518ex102-q1fy19.htm)] | | 10-Q | | 10.2 | | | [removed: 6/5/2017] [added: 6/8/2018] | | |
| [removed: [*10.23](http://www.sec.gov/Archives/edgar/data/764478/000076447817000023/bbys-862117.htm)] [added: [*10.18](http://www.sec.gov/Archives/edgar/data/764478/000076447817000023/bbys-862117.htm)] | | [added: |] [Best Buy Co., Inc. Amended & Restated 2014 Omnibus Incentive Plan](http://www.sec.gov/Archives/edgar/data/764478/000076447817000023/bbys-862117.htm) | | S-8 | | 99 | | | 6/21/2017 | | |
| [removed: [21.1](https://www.sec.gov/Archives/edgar/data/764478/000076447818000013/bby-2018ex211.htm)] [added: [21.1](https://www.sec.gov/Archives/edgar/data/764478/000076447819000009/bby-2019ex211.htm)] | | [added: |] [Subsidiaries of the [removed: Registrant](https://www.sec.gov/Archives/edgar/data/764478/000076447818000013/bby-2018ex211.htm)] [added: Registrant](https://www.sec.gov/Archives/edgar/data/764478/000076447819000009/bby-2019ex211.htm)] | | | | | | | | | X |
| [removed: [23.1](https://www.sec.gov/Archives/edgar/data/764478/000076447818000013/bby-2018ex231.htm)] [added: [23.1](https://www.sec.gov/Archives/edgar/data/764478/000076447819000009/bby-2019ex231.htm)] | | [added: |] [Consent of Deloitte & Touche [removed: LLP](https://www.sec.gov/Archives/edgar/data/764478/000076447818000013/bby-2018ex231.htm)] [added: LLP](https://www.sec.gov/Archives/edgar/data/764478/000076447819000009/bby-2019ex231.htm)] | | | | | | | | | X |
| [removed: [31.1](https://www.sec.gov/Archives/edgar/data/764478/000076447818000013/bby-2018ex311.htm)] [added: [31.1](https://www.sec.gov/Archives/edgar/data/764478/000076447819000009/bby-2019ex311.htm)] | | [added: |] [Certification of the Chief Executive Officer pursuant to Rule 13a-14(a), as adopted pursuant to Section 302 of the Sarbanes-Oxley Act of [removed: 2002](https://www.sec.gov/Archives/edgar/data/764478/000076447818000013/bby-2018ex311.htm)] [added: 2002](https://www.sec.gov/Archives/edgar/data/764478/000076447819000009/bby-2019ex311.htm)] | | | | | | | | | X |
| [removed: [31.2](https://www.sec.gov/Archives/edgar/data/764478/000076447818000013/bby-2018ex312.htm)] [added: [31.2](https://www.sec.gov/Archives/edgar/data/764478/000076447819000009/bby-2019ex312.htm)] | | [added: |] [Certification of the Chief Financial Officer pursuant to Rule 13a-14(a), as adopted pursuant to Section 302 of the Sarbanes-Oxley Act of [removed: 2002](https://www.sec.gov/Archives/edgar/data/764478/000076447818000013/bby-2018ex312.htm)] [added: 2002](https://www.sec.gov/Archives/edgar/data/764478/000076447819000009/bby-2019ex312.htm)] | | | | | | | | | X |
| [removed: [32.1](https://www.sec.gov/Archives/edgar/data/764478/000076447818000013/bby-2018ex321.htm)] [added: [32.1](https://www.sec.gov/Archives/edgar/data/764478/000076447819000009/bby-2019ex321.htm)] | | [added: |] [Certification of the Chief Executive Officer pursuant to 18 U.S.C. Section 1350, as adopted pursuant to Section 906 of the Sarbanes-Oxley Act of [removed: 2002](https://www.sec.gov/Archives/edgar/data/764478/000076447818000013/bby-2018ex321.htm)] [added: 2002](https://www.sec.gov/Archives/edgar/data/764478/000076447819000009/bby-2019ex321.htm)] | | | | | | | | | X |
| [removed: [32.2](https://www.sec.gov/Archives/edgar/data/764478/000076447818000013/bby-2018ex322.htm)] [added: [32.2](https://www.sec.gov/Archives/edgar/data/764478/000076447819000009/bby-2019ex322.htm)] | | [added: |] [Certification of the Chief Financial Officer pursuant to 18 U.S.C. Section 1350, as adopted pursuant to Section 906 of the Sarbanes-Oxley Act of [removed: 2002](https://www.sec.gov/Archives/edgar/data/764478/000076447818000013/bby-2018ex322.htm)] [added: 2002](https://www.sec.gov/Archives/edgar/data/764478/000076447819000009/bby-2019ex322.htm)] | | | | | | | | | X |
| 101 | | | The following financial information from our Annual Report on Form 10-K for fiscal [removed: 2018,] [added: 2019,] filed with the SEC on [removed: April 2, 2018,] [added: March 28, 2019,] formatted in Extensible Business Reporting Language (XBRL): (i) the consolidated balance sheets at February [added: 2, 2019, and February] 3, 2018, [removed: and January 28, 2017,] (ii) the consolidated statements of earnings for the years ended February [added: 2, 2019, February] 3, 2018, [added: and] January 28, 2017, [removed: and January 30, 2016,] (iii) the consolidated statements of comprehensive income for the years ended February [added: 2, 2019, February] 3, 2018, [added: and] January 28, 2017, [removed: and January 30, 2016,] (iv) the consolidated statements of cash flows for the years ended February [added: 2, 2019, February] 3, 2018, [added: and] January 28, 2017, [removed: and January 30, 2016,] (v) the consolidated statements of changes in shareholders' equity for the years ended February [added: 2, 2019, February] 3, 2018, [added: and] January 28, 2017, and [removed: January 30, 2016, and] (vi) the Notes to Consolidated Financial Statements. | | | | | | | | | [added: |]
| [4.4](http://www.sec.gov/Archives/edgar/data/764478/000110465918059137/a18-31182_4ex4d1.htm) | | [Third Supplemental Indenture, dated as of September 27, 2018, to the Indenture dated as of March 11, 2011, between Best Buy Co., Inc. and U.S. Bank National Association, as successor](http://www.sec.gov/Archives/edgar/data/764478/000110465918059137/a18-31182_4ex4d1.htm) | | 8-K | | 4.1 | | | 9/27/2018 | | |
| | | | | | | | | | | | | |
| --- | --- | --- | --- | --- | --- | --- | --- | --- | --- | --- | --- | --- |
| | | | | | | | | | | | | |
| | | | | | | | | | | | |
| --- | --- | --- | --- | --- | --- | --- | --- | --- | --- | --- | --- |
| [*10.14](http://www.sec.gov/Archives/edgar/data/764478/000076447814000051/bby8214ex102.htm) | | [Form of Director Restricted Stock Unit Award Agreement for Non-U.S. Directors (2014)](http://www.sec.gov/Archives/edgar/data/764478/000076447814000051/bby8214ex102.htm) | | 10-Q | | 10.2 | | | 9/10/2014 | | |
| [*10.24](http://www.sec.gov/Archives/edgar/data/764478/000076447817000032/bby72917ex102.htm) | | [Form of Best Buy Co., Inc. Long-Term Incentive Program Award Agreement for U.S. Directors (2017)](http://www.sec.gov/Archives/edgar/data/764478/000076447817000032/bby72917ex102.htm) | | 10-Q | | 10.2 | | | 9/5/2017 | | |
| [*10.25](http://www.sec.gov/Archives/edgar/data/764478/000076447817000032/bby72917ex103.htm) | | [Form of Best Buy Co., Inc. Long-Term Incentive Program Award Agreement for Non-U.S. Directors (2017)](http://www.sec.gov/Archives/edgar/data/764478/000076447817000032/bby72917ex103.htm) | | 10-Q | | 10.3 | | | 9/5/2017 | | |
| [12.1](https://www.sec.gov/Archives/edgar/data/764478/000076447818000013/bby-2018ex121.htm) | | [Statements re: Computation of Ratios](https://www.sec.gov/Archives/edgar/data/764478/000076447818000013/bby-2018ex121.htm) | | | | | | | | | X |
| Exhibit | | | | | Incorporated by Reference | | | | | | Filed |
| No. | | | Exhibit Description | | Form | | Exhibit | | Filing Date | | Herewith |
Item 16. Form 10-K Summary.
14 rewritten, 9 added, 2 removed, 51 unchanged
| /s/ Hubert Joly | | Chairman and Chief Executive Officer | | [removed: April 2, 2018] [added: March 28, 2019] |
| /s/ Corie Barry | | Chief Financial Officer | | [removed: April 2, 2018] [added: March 28, 2019] |
| /s/ Mathew R. Watson | | Senior Vice President, Controller and Chief Accounting Officer | | [removed: April 2, 2018] [added: March 28, 2019] |
| /s/ Lisa M. Caputo | | Director | | [removed: April 2, 2018] [added: March 28, 2019] |
| /s/ J. Patrick Doyle | | Director | | [removed: April 2, 2018] [added: March 28, 2019] |
| /s/ Russell P. Fradin | | Director | | [removed: April 2, 2018] [added: March 28, 2019] |
| /s/ Kathy J. Higgins Victor | | Director | | [removed: April 2, 2018] [added: March 28, 2019] |
| /s/ David W. Kenny | | Director | | [removed: April 2, 2018] [added: March 28, 2019] |
| /s/ Karen A. McLoughlin | | Director | | [removed: April 2, 2018] [added: March 28, 2019] |
| /s/ Thomas L. Millner | | Director | | [removed: April 2, 2018] [added: March 28, 2019] |
| /s/ Claudia F. Munce | | Director | | [removed: April 2, 2018] [added: March 28, 2019] |
| /s/ Richelle P. Parham | | Director | | [removed: April 2, 2018] [added: March 28, 2019] |
| Allowance for doubtful accounts | $ | [removed: 59] [added: 37] | | | $ | [removed: 30] [added: 33] | | | $ | [removed: (40] [added: (47] | ) | | $ | [removed: 49] [added: 23] | |
[removed: ][added: ]
| | | March 28, 2019 |
| | | | | |
| /s/ Cindy R. Kent | | Director | | March 28, 2019 |
| Cindy R. Kent | | | | |
| | | | | |
| /s/ Eugene A. Woods | | Director | | March 28, 2019 |
| Eugene A. Woods | | | | |
| | | | | |
| Year ended February 2, 2019 | | | | | | | | | | | | | | | |
| | | April 2, 2018 |
| Year ended January 30, 2016 | | | | | | | | | | | | | | | |