 filings.tools
Item 5. Market for Registrant's Common Equity, Related Stockholder Matters and Issuer Purchases of Equity Securities.
5K characters. Original on sec.gov · Markdown
Item 5. Market for Registrant's Common Equity, Related Stockholder Matters and Issuer Purchases of Equity Securities.
Market Information and Dividends
Our common stock is traded on the New York Stock Exchange (“NYSE”) under the ticker symbol BBY. In fiscal 2004, our Board initiated the payment of a regular quarterly cash dividend with respect to shares of our common stock. A quarterly cash dividend has been paid in each subsequent quarter. On March 2, 2023, we announced an increase in our regular quarterly dividend from $0.88 per share to $0.92 per share. Future dividend payments will depend on our earnings, capital requirements, financial condition and other factors considered relevant by our Board.
Holders
As of March 15, 2023, there were 1,955 holders of record of our common stock.
Purchases of Equity Securities by the Issuer and Affiliated Purchasers
On February 28, 2022, our Board approved a $5.0 billion share repurchase authorization, which replaced the $5.0 billion share repurchase program authorized on February 16, 2021. There is no expiration date governing the period over which we can repurchase shares under this authorization. During fiscal 2023, we repurchased and retired 11.8 million shares at a cost of $1.0 billion. For additional information, see “Share Repurchases and Dividends” in Item 7, Management’s Discussion and Analysis of Financial Condition and Results of Operations, and Note 9, Shareholders’ Equity, of the Notes to Consolidated Financial Statements, included in Item 8, Financial Statements and Supplementary Data, of this Annual Report on Form 10-K.
Information regarding our repurchases of common stock during the fourth quarter of fiscal 2023 was as follows:
| Period | Total Numberof SharesPurchased | Average PricePaid per Share | Total Number of SharesPurchased as Part of PubliclyAnnounced Program | Approximate Dollar Valueof Shares that May Yet BePurchased Under the Program | |||||||||
| Oct. 30, 2022 through Nov. 26, 2022 | 3,558,147 | $ | 71.60 | 3,558,147 | $ | 4,419,000,000 | |||||||
| Nov. 27, 2022 through Dec. 31, 2022 | 3,580,328 | $ | 82.18 | 3,580,328 | $ | 4,125,000,000 | |||||||
| Jan. 1, 2023 through Jan. 28, 2023 | - | $ | - | - | $ | 4,125,000,000 | |||||||
| Total fiscal 2023 fourth quarter | 7,138,475 | $ | 76.91 | 7,138,475 | $ | 4,125,000,000 |
Best Buy Stock Comparative Performance Graph
The information contained in this Best Buy Stock Comparative Performance Graph section shall not be deemed to be “soliciting material” or “filed” or incorporated by reference in future filings with the SEC, or subject to the liabilities of Section 18 of the Exchange Act, except to the extent that we specifically incorporate it by reference into a document filed under the Securities Act or the Exchange Act.
The graph below compares the cumulative total shareholder return on our common stock for the last five fiscal years with the cumulative total return on the Standard & Poor's 500 Index (“S&P 500”), of which we are a component, and the Standard & Poor's Retailing Group Industry Index (“S&P Retailing Group”), of which we are also a component. The S&P Retailing Group is a capitalization-weighted index of domestic equities traded on the NYSE and NASDAQ and includes high-capitalization stocks representing the retail sector of the S&P 500.
The graph assumes an investment of $100 at the close of trading on February 2, 2018, the last trading day of fiscal 2018, in our common stock, the S&P 500 and the S&P Retailing Group.
COMPARISON OF 5 YEAR CUMULATIVE TOTAL RETURN*
Among Best Buy Co., Inc., the S&P 500 and the S&P Retailing Group
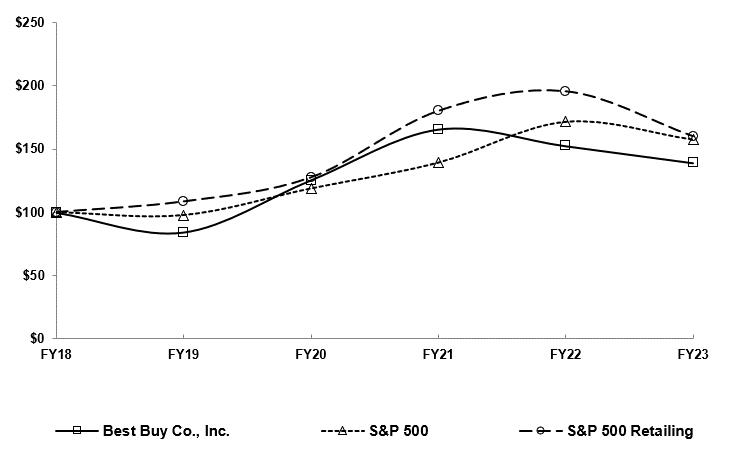
| Fiscal Years Ended | February 3, 2018 | February 2, 2019 | February 1, 2020 | January 30, 2021 | January 29, 2022 | January 28, 2023 | |||||||||||||||||
| Best Buy Co., Inc. | $ | 100.00 | $ | 84.25 | $ | 125.50 | $ | 165.74 | $ | 152.59 | $ | 139.12 | |||||||||||
| S&P 500 | $ | 100.00 | $ | 97.69 | $ | 118.87 | $ | 139.37 | $ | 171.83 | $ | 157.71 | |||||||||||
| S&P Retailing Group | $ | 100.00 | $ | 108.42 | $ | 127.45 | $ | 180.19 | $ | 195.77 | $ | 160.10 |
- Cumulative total return assumes dividend reinvestment.
Source: Research Data Group, Inc.
Previous: Item 4. Mine Safety Disclosures. · Next: Item 6. [Reserved].