 filings.tools
Brown-Forman (BF-B) 10-K risk factor changes: FY2016 vs FY2015
The 2016-04-30 10-K against the 2015-04-30 one, compared heading by heading and sentence by sentence. One of these filings carries no fiscal year tag, so its year is the calendar year of the period end.
Item 1A50 rewritten7 added5 removed147 unchanged
All filing items984 rewritten398 added271 removed1,525 unchanged
Summary
counted, not written
- Item 1A headings could not be compared: only 0 carried over between the two years, which usually means one filing was read wrongly, so none is reported as new or removed.
- Sentence by sentence, 398 added, 271 removed, 984 rewritten and 1,525 unchanged across 16 items that differ.
Sentences by item
21 items, with every count and a link to each item that changed
Underlined words on a shaded ground are new in FY2016; struck-through words were in FY2015. Sentences that are wholly new or wholly gone are labelled rather than marked.
Item 1A. Risk Factors
50 rewritten, 7 added, 5 removed, 147 unchanged
Unfavorable global or regional economic conditions, including uncertainty caused by unstable geopolitical environments in many parts of the world, such as [removed: Russia] [added: Russia, Brazil,] and [removed: Ukraine,] [added: Turkey,] could adversely affect our business and financial results.
While the major economic disruptions of the 2008-2009 financial crisis have largely subsided, many markets where our products are sold still face significant economic challenges resulting from the [added: ensuing] global economic downturn that followed, including low consumer confidence, high unemployment, budget deficits, burdensome governmental debt, austerity measures, increased taxes, and weak financial, credit, and housing markets.
Other potential negative consequences to our business from poor economic conditions include higher interest rates, an increase in the rate of inflation, deflation, exchange rate fluctuations, credit or capital market instability, or lower returns on pension assets or lower discount rates for pension obligations [removed: (requiring] [added: (possibly requiring] higher contributions to our pension plans).
Our products are sold in [removed: more than] [added: approximately] 160 countries; accordingly, we are subject to risks associated with doing business globally, including commercial, political, and financial risks.
In the [removed: long-term,] [added: long term,] we continue to expect our growth rates in non-U.S. markets to surpass our growth rates in the United States.
For example, [removed: Mexico] [added: Europe] is a key commercial and production [removed: country] [added: region] for some of our products, and [removed: an outbreak] [added: further outbreaks] of violence there could disrupt our operations.
For instance, profits from our overseas businesses for [removed: the 2015] fiscal [removed: year] [added: 2016] were adversely [removed: impacted] [added: affected] by the recent strengthening of the U.S. dollar against currencies in our major markets, including the euro, [removed: British pound sterling, Ukrainian hryvnia,] [added: Russian ruble,] and Australian dollar.
We may, from time to time, attempt to hedge foreign currency risk, but, even in those cases, we may not be successful in limiting foreign currency [added: risk through the use of foreign currency derivatives or other means.]
Quantitative and Qualitative Disclosures about Market Risk [removed: -] [added: –] Foreign Exchange.”
[removed: For example, some] [added: Certain] countries [added: historically] have banned all television, newspaper, magazine, and internet advertising for beverage alcohol products.
Increases in regulation of this nature could [removed: cause a substantial decline in] [added: substantially reduce] consumer awareness for our products in the affected markets.
Some countries [removed: in which] [added: where] we do business have a higher risk of corruption than others.
While we are committed to doing business in accordance with applicable anti-corruption and other laws, our Code of [removed: Conduct and] [added: Conduct,] Code of [removed: Ethics,] [added: Ethics for Senior Financial Officers,] and other Company policies, we remain subject to the risk that an employee will violate our policies, or that any of our many affiliates or agents, such as importers, wholesalers, distributors, or other business partners, may take action determined to be in violation of international trade, money laundering, anti-corruption, or other laws, including the U.S. Foreign Corrupt Practices Act of 1977, the U.K. Bribery Act 2010, or equivalent local laws.
Further, our compliance with applicable anti-corruption or other laws, our Code of [removed: Conduct and] [added: Conduct,] Code of [removed: Ethics,] [added: Ethics for Senior Financial Officers,] and our other policies could result in higher operating [removed: costs compared to those of other suppliers.][added: costs.]
Increasing regulation of fuel emissions could increase the cost of energy, including fuel, required to operate our facilities or transport and distribute our products, thereby substantially increasing the [removed: distribution] [added: production, distribution,] and supply chain costs associated with our products.
Increases in or the imposition of new indirect taxes on our operations or products would increase the cost of our products or, to the extent levied directly on consumers, make our products less affordable, which could negatively affect our financial results by reducing purchases of our products and encouraging consumers to switch to lower-priced or lower-taxed product [removed: categories or to drink less.][added: categories.]
For example, certain [removed: jurisdictions] [added: jurisdictions,] such as [removed: Australia] [added: Brazil,] have increased and may continue to increase excise taxes on beverage alcohol products, which could [removed: increase the cost of our products to consumers and could reduce consumer demand in those jurisdictions.]
Jack Daniel’s is an iconic global trademark with a loyal consumer fan base, and we invest much effort and many resources to protect and preserve the brand’s reputation for [added: quality, craftsmanship, and authenticity.]
Management’s Discussion and Analysis of Financial Condition and Results of Operations [removed: -] [added: –] Results of Operations [removed: -] [added: –] Fiscal [removed: 2015] [added: 2016] Brand Highlights.”
In addition, we could experience unfavorable business results if we fail to attract consumers from diverse backgrounds and ethnicities in the United States and in our other [removed: non U.S.] [added: non-U.S.] markets.
Forecasts in the United States for several years after [removed: 2015] [added: 2016] indicate a slight decrease in the population segment aged 21 to 24; fewer potential consumers in this age bracket could have a negative effect on industry growth rates and our business.
In particular, we plan to continue to grow Jack Daniel’s Tennessee Honey sales globally and to launch Jack Daniel’s Tennessee Fire in [removed: the United States this] [added: select international markets in] fiscal [removed: year.][added: 2017.]
Some of our largest brands, including [removed: the] Jack Daniel’s [removed: family of brands] and Finlandia Vodka, are [removed: produced] [added: distilled] at [removed: a] single [removed: location.][added: locations.]
Further, because whiskeys and some tequilas are aged for various periods, we maintain a substantial inventory of aged and maturing products in warehouses at a [removed: handful] [added: number] of different sites.
[removed: The loss of a substantial amount of aged inventory –] through fire, other natural or man-made disaster, contamination, or otherwise – could significantly reduce the supply of the affected product or products.
A consequence of any of these or other supply or supply chain disruptions could [removed: be] [added: result in] our inability to meet consumer demand for the affected products for a period of time.
The forecasting strategies we use to balance product supply with fluctuations [added: in consumer demand may not be effective for particular years or products.]
We cannot be [removed: sure] [added: certain] that we will be successful in using various levers, such as price, to create the desired balance of available supply and consumer demand for particular years or products.
Our products use [removed: a number of] materials and ingredients that we purchase from suppliers.
Changes in weather patterns or intensity can disrupt our supply chain as well, which may affect production operations, insurance costs and coverage, as well as the timely delivery of our [removed: products to customers.][added: products.]
Some [removed: academics and] [added: academics,] public health [removed: officials as well as] [added: officials, and] critics of the alcohol industry in the United States, Europe, and other countries continue to seek governmental measures to make beverage alcohol [removed: products] more expensive, less available, or more difficult to advertise and promote.
We face substantial competition in our industry, [removed: and] [added: including many new entrants into spirits as well as from] consolidation among beverage alcohol producers, wholesalers, or retailers, or changes to our route-to-consumer model, could hinder the marketing, sale, or distribution of our products.
Further, while we [removed: currently] believe we have sufficient scale to succeed relative to our major competitors, we nevertheless face a risk that continuing consolidation of large beverage alcohol companies could put us at a competitive disadvantage.
While we seek to take advantage of the efficiencies and opportunities that large retail customers can offer, [removed: large retail customers] [added: they] often seek lower pricing and purchase volume flexibility, offer competing own-label products, and represent a large number of other competing products.
Acquisitions, investments, or joint ventures could also lead us to incur additional debt and related interest expenses, issue additional shares, [removed: and] become exposed to contingent liabilities, [removed: as well as] [added: and] lead to dilution in our earnings per share and reduction in our return on average invested capital.
[removed: Inadequate] [added: Product counterfeiting or inadequate] protection of our intellectual property rights [removed: or counterfeiting] could adversely affect our business prospects.
Our brand names, trademarks, and related intellectual property rights are critical assets, and our business depends on our protecting them [removed: successfully.][added: in the countries where we do business.]
We may be unsuccessful in protecting our intellectual property rights [removed: around the world] [added: in a given market] or in challenging those who [added: infringe our rights or] imitate [added: or counterfeit] our products.
We may not be able to [removed: secure trademark registrations] [added: register our trademarks] in every country [removed: in which] [added: where] we [removed: wish] [added: want] to sell a particular product, and we may not [removed: get] [added: obtain] favorable [removed: protective] decisions by courts or trademark offices.
While we believe [removed: the] IFSP [removed: generally to be] [added: is] an effective organization, [removed: IFSP] [added: it] is not active in every [removed: market] [added: market,] and its efforts are subject to cooperation with local authorities and courts in the markets where it is active.
Because our foreign currency revenues for each foreign currency exceed the corresponding foreign currency expense, we have a net exposure to changes in the value of the U.S. dollar relative to each of those currencies.
For instance, in fiscal 2016, we experienced disruption of our business in Indonesia due to recent changes in industry regulation and import duties.
increase the cost of our products to consumers and could reduce consumer demand in those jurisdictions.
This includes potential changes in tax rules or the interpretation of tax rules arising out of the Base Erosion & Profit Shifting project initiated by the Organization for Economic Co-operation and Development.
The loss of a substantial amount of aged inventory –
In some developing countries, for example, it may be more difficult to use legal process to stop counterfeiting.
confidential and proprietary research, business plans, and financial information; complying with regulatory, legal, or tax requirements; providing data security; and handling other processes necessary to manage our business.
Since we sell more in local currencies than we purchase, we have a net exposure to changes in the value of the U.S. dollar relative to those currencies.
risk through the use of foreign currency derivatives or other means.
quality, craftsmanship, and responsibility.
in consumer demand may not be effective for particular years or products.
Similarly, a Finnish company distills and bottles Finlandia Vodka for us.
An excerpt. Shown here: 40 of 50 rewritten, all 7 added and all 5 removed. The counts are complete. For every sentence, read Item 1A. Risk Factors in the FY2016 filing and the FY2015 filing.
Item 7. Management’s Discussion and Analysis of Financial Condition and Results of Operations
265 rewritten, 175 added, 134 removed, 288 unchanged
[removed: We define] [added: Depending on the context,] “depletions” [removed: as] [added: means] either (a) our shipments directly to retailers or wholesalers, or (b) shipments from our distributor customers to retailers and wholesalers.
[removed: Because we] [added: We] generally record revenues when we ship our products to our customers, [added: so] our reported sales for a period do not necessarily reflect actual consumer purchases during that period.
Non-GAAP “underlying” measures include changes in (a) underlying net sales, (b) underlying cost of sales, (c) underlying excise taxes, (d) underlying gross profit, (e) underlying advertising expenses, (f) underlying selling, general, and administrative [added: (SG&A)] expenses, and (g) underlying operating income.
To calculate [removed: each of] these measures, we [removed: adjust] [added: adjust, as applicable,] for (a) foreign currency [removed: exchange and] [added: exchange,] (b) [removed: if applicable,] estimated net changes in distributor [removed: inventories.][added: inventories, and (c) the impact of acquisition and divestiture activity.]
| • | “Foreign exchange.” We calculate the percentage change in our income statement [removed: line-items] [added: line items] in accordance with GAAP and adjust to exclude the cost or benefit of currency fluctuations. Adjusting for foreign exchange allows us to understand our business on a [removed: constant dollar] [added: constant-dollar] basis, as fluctuations in exchange rates can distort the underlying trend both positively and negatively. (In this report, “dollar” always means the U.S. dollar unless stated otherwise.) To eliminate the effect of foreign exchange fluctuations when comparing across periods, we translate current year results at prior-year rates. |
| • | “Estimated net change in distributor inventories.” This measure refers to the estimated net effect of changes in distributor inventories on changes in our measures. For each period [removed: being] compared, we estimate the effect of distributor inventory changes on our results using depletion information provided [removed: to us] by our distributors. We believe that this adjustment reduces the effect of varying levels of distributor inventories on changes in our measures and allows us to understand better our underlying results and trends. |
We also use underlying measures [removed: as metrics of] [added: in connection with] management incentive compensation calculations.
[removed: We have provided reconciliations of the non-GAAP measures adjusted to an “underlying” basis to their] nearest GAAP measures in the tables below under “Results of Operations – Year-Over-Year Comparisons” and have consistently applied the adjustments within our reconciliations in arriving at each non-GAAP measure.
We also use the following additional non-GAAP financial [removed: measures:][added: measures in “Item 6.]
| [EXECUTIVE [removed: SUMMARY](#s14EE3C0C4919ABEFEE59D30573FA22D9)] [added: SUMMARY](#s081B0B135ADD9932DC1525E9977C360E)] | | [removed: [24](#s14EE3C0C4919ABEFEE59D30573FA22D9)] [added: [24](#s081B0B135ADD9932DC1525E9977C360E)] |
| [RESULTS OF [removed: OPERATIONS](#s8C5F8200057D68728035D30574787C96)] [added: OPERATIONS](#sF0A70610E52EE7AE6A1525E997C0A942)] | | [removed: [30](#s8C5F8200057D68728035D30574787C96)] [added: [30](#sF0A70610E52EE7AE6A1525E997C0A942)] |
| [LIQUIDITY AND CAPITAL [removed: RESOURCES](#s5BFFF3E96C8EC89BD40DD30574DB4ACC)] [added: RESOURCES](#s8A11C94D22600234EEC425E99812F0DC)] | | [removed: [39](#s5BFFF3E96C8EC89BD40DD30574DB4ACC)] [added: [40](#s8A11C94D22600234EEC425E99812F0DC)] |
| [LONG-TERM [removed: OBLIGATIONS](#s05AE858E261C9A3B57D3D3057552355F)] [added: OBLIGATIONS](#s850E479CAFD2F5849D0725E9977892D8)] | | [removed: [42](#s05AE858E261C9A3B57D3D3057552355F)] [added: [42](#s850E479CAFD2F5849D0725E9977892D8)] |
| [CRITICAL ACCOUNTING POLICIES AND [removed: ESTIMATES](#s4045F1EADB9A58940103D3059C55600F)] [added: ESTIMATES](#s747F2A8EC5F77D82307C25E9A2AD6B21)] | | [removed: [42](#s4045F1EADB9A58940103D3059C55600F)] [added: [43](#s747F2A8EC5F77D82307C25E9A2AD6B21)] |
Over the past several years, including fiscal [removed: 2015,] [added: 2016,] we have made progress toward realizing the ambitions of our long-term strategy, which was first set forth in fiscal 2010 and has evolved along with our business since then.
| • | We have further developed the Jack Daniel’s family of brands through innovations designed to create new demand for products from the world’s foremost maker of American whiskey. These efforts resulted in the successful launch of Jack Daniel’s Tennessee Honey [removed: (JDTH)] [added: (JDTH), Jack Daniel’s Tennessee Fire (JDTF),] and a series of ultra-premium-priced line [removed: extensions. We began testing] [added: extensions including] Jack Daniel’s [added: Sinatra Select, Jack Daniel’s No. 27 Gold] Tennessee [removed: Fire in the United States in April 2014 in three states, expanded] [added: Whiskey, and several additions] to [removed: five additional states during] the [removed: second quarter of fiscal 2015, and, encouraged by the positive consumer reaction, launched the line extension nationwide in the fourth quarter of fiscal 2015.] [added: Jack Daniel’s Single Barrel Collection.] At the same time, we have invested steadily in our core Jack Daniel’s Tennessee Whiskey (JDTW) brand to support its growth [removed: broadly] around the [removed: world and to support our price increases in recent years.] [added: world.] |
We announced a major expansion of our distilling capacity in August 2013, and we [removed: expect to complete] [added: completed] construction of a new distillery on our property in Lynchburg, [removed: Tennessee,] [added: Tennessee] during the first quarter of fiscal 2016.
The next stage of our expansion in Lynchburg will add bottling capacity and finished product [removed: warehousing over a two-year period,] [added: warehousing,] to be completed in [removed: fiscal 2017.][added: the next few years.]
| • | The [removed: recent] [added: continued] growth of the Jack Daniel’s family of brands is the most important measure of our progress toward becoming a global leader in whiskey. Woodford Reserve’s growth has also helped us move forward on this ambition, as this super-premium brand grew volume at a compound annual rate of [removed: more than 22%] [added: approximately 25%] from fiscal [removed: 2010] [added: 2011] to fiscal [removed: 2015] [added: 2016] – more than doubling its [added: annual] volume to [removed: just under 400,000] [added: approximately 500,000] nine-liter cases [removed: in] [added: by the end of] fiscal [removed: 2015.] [added: 2016.] In June 2013, we announced a more than $35 million expansion at our Woodford Reserve Distillery to support our expected growth. During fiscal 2014, we completed a renovation of our visitors’ center at the Woodford Reserve [removed: Distillery] [added: Distillery, as visitors have increased over 20% since fiscal 2014] to [removed: better serve the large and growing number of Woodford Reserve brand lovers who visit annually. As part of the expansion, during] [added: almost 125,000 visitors in] fiscal [removed: 2015,] [added: 2016. During fiscal 2016,] we completed the construction of two new [added: warehouses, and we entered into the second phase of a bottling expansion. In fiscal 2017, we expect to complete two new] warehouses. |
| • | Brown-Forman was founded in 1870 with Old Forester, the world’s first bottled bourbon brand. Old Forester [removed: has remained a favorite among true bourbon aficionados while] [added: is] attracting a new generation of [removed: fans; its underlying] [added: fans, as it has grown] net sales [removed: increased a substantial 35% (38% reported)] [added: by approximately 20% annually since fiscal 2011, including growth of nearly 50%] in fiscal [removed: 2015.] [added: 2016.] We plan to leverage the current momentum of Old Forester and the favorable trends in American [removed: whiskeys] [added: whiskey] to [removed: develop] [added: reestablish] Old Forester as [removed: a national and international] [added: an] iconic bourbon brand. [removed: In] [added: To] support [removed: of this] [added: our] ambition, we announced the construction of the Old Forester Distillery and [removed: urban bourbon experience] [added: visitors’ center] in fiscal 2014, and in May 2015 purchased two historic buildings on Main Street in Louisville for its location. We [removed: expect to open] [added: began construction of] the Old Forester Distillery in [removed: the fall of 2016] [added: February 2016,] and [added: we expect to open late in 2017. We] anticipate investing approximately [removed: $45] [added: $50] million in this project. |
| • | In June 2015 (fiscal 2016), we purchased all of the shares of Slane Castle Irish Whiskey Limited and announced [removed: our] plans to invest [removed: $50] [added: approximately $40] million to build a new distillery, construct warehouses, and develop a consumer [removed: experience,] [added: experience] on the historic Slane Castle Estate [removed: in Ireland. We decided to add an Irish whiskey to our portfolio because it has been one of the fastest-growing components] [added: (in County Meath, about 30 miles north] of [removed: the global whiskey category recently, and we believe that with our expertise in whiskey making, the new whiskeys from the Slane Castle Irish Whiskey Distillery will have a bright future.] [added: Dublin).] We plan to open the Slane Castle Whiskey Distillery [removed: in late 2016] and to introduce new Irish whiskeys in the spring of 2017, [removed: initially] using high-quality whiskey purchased from other Irish distilleries and [removed: then] finished to Slane’s specifications while the whiskey made at the new Slane Distillery matures. |
| • | [removed: Since 2010,] [added: Over the past several decades,] we have pursued international growth both in [removed: our] larger, developed markets and [removed: with increasing focus] in the emerging world. [removed: Our] [added: In recent years, our] most visible progress has been the evolution of our [removed: route-to-consumer] [added: RTC] strategy in several key markets. We set up new distribution companies in three of our current top ten countries (Germany, France, and Turkey) and also in Brazil, a market that we believe is among our most promising long-term growth opportunities. [added: In fiscal 2017, we plan to establish a new distribution company in Spain, which we expect to begin operating in fiscal 2018.] We have added substantially to our employee base outside the United States, mostly in markets where we evolved our [removed: route-to-consumer] [added: RTC] strategy. |
| • | Our capital deployment initiatives have been focused on (1) enabling the expected future growth of our existing businesses through investments in our production [removed: capacity] [added: capacity, innovation,] and [removed: innovation (discussed above) as well as in resources needed to grow] [added: brand-building efforts for] our existing [removed: portfolio (advertising and promotions, and SG&A)] [added: portfolio;] and (2) returning cash to our shareholders. From fiscal 2010 through [removed: 2015,] [added: 2016,] we [removed: have] returned over [removed: $3.2] [added: $4.6] billion to our shareholders through [removed: $1.2] [added: $1.5] billion in regular quarterly dividends, $1.0 billion in two special dividends, and [removed: $1] [added: $2.1] billion [removed: through] [added: in] share repurchases. |
| 2011 | | Introduced Jack Daniel’s Tennessee Honey in [removed: April] [added: Q4] | | Started distribution operations in Germany | | |
| | | Sold Hopland-based wine brands and properties | | [added: Started distribution operations in Brazil] | | |
| | | Introduced Jack Daniel’s Tennessee Rye Whiskey | | | | [added: Opened the Stevenson Mill] |
| 2015 | | Introduced Herradura Ultra in Mexico in [removed: the second quarter] [added: Q2] | | | | Announced plans for the Old Forester Distillery and bourbon experience |
| | | Introduced [removed: Southern Comfort Caramel] [added: Jack Daniel’s Tennessee Fire nationwide] in the United States [removed: (Q3)] [added: in Q4] | | | | Completed new barrel warehouses at Jack Daniel's and Woodford Reserve |
| [removed: |] [added: •] | [removed: Introduced] [added: volume growth from the nationwide launch of] Jack Daniel’s Tennessee Fire [removed: nationwide] in the United States [removed: (Q4) | | | |] [added: in the fourth quarter of fiscal 2015;] |
| 2016 | | [removed: Announced purchase of] [added: Purchased] Slane Castle Irish Whiskey Limited in [removed: the first quarter] [added: Q1] | | | | Announced plans [removed: for the construction of] [added: to construct a] new distillery at Slane Castle in Ireland |
Fiscal [removed: 2015] [added: 2016] Financial Highlights
| Summary of Operating Performance Fiscal [removed: 2013] [added: 2014] - [removed: 2015] [added: 2016] | | | | | | | | | | | | | | | | | | | | | | | |
| Fiscal year ended April 30 | [removed: 2013 | | | |] 2014 | | | | 2015 | | | | [removed: 2014 vs. 2013] [added: 2016] | | | [added: |] 2015 vs. 2014 | | | [removed: 2014] [added: 2016] vs. [removed: 2013] [added: 2015] | | | 2015 vs. 2014 | | [added: | 2016 vs. 2015 | |]
| Net sales | $ | [removed: 3,784] [added: 3,946] | | | $ | [removed: 3,946] [added: 4,096] | | | $ | [removed: 4,096] [added: 4,011] | | | 4 | % | | [removed: 4] [added: (2] | [removed: %] [added: )%] | | 6 | % | | [removed: 6] [added: 5] | % |
| Excise taxes | [removed: 935] [added: 955] | | | | [removed: 955] [added: 962] | | | | [removed: 962] [added: 922] | | | | [removed: 2] [added: 1] | % | | [removed: 1] [added: (4] | [removed: %] [added: )%] | | 5 | % | | [removed: 5] [added: 6] | % |
| Cost of sales | [removed: 894] [added: 913] | | | | [removed: 913] [added: 951] | | | | [removed: 951] [added: 945] | | | | [removed: 2] [added: 4] | % | | [removed: 4] [added: (1] | [removed: %] [added: )%] | | [removed: 3] [added: 7] | % | | [removed: 7] [added: 3] | % |
| Gross profit | [removed: 1,955] [added: 2,078] | | | | [removed: 2,078] [added: 2,183] | | | | [removed: 2,183] [added: 2,144] | | | | [removed: 6] [added: 5] | % | | [removed: 5] [added: (2] | [removed: %] [added: )%] | | [removed: 8] [added: 7] | % | | [removed: 7] [added: 5] | % |
| Advertising | [removed: 408] [added: 436] | | | | [removed: 436] [added: 437] | | | | [removed: 437] [added: 417] | | | | [removed: 7] [added: —] | % | | [removed: —] [added: (4] | [removed: %] [added: )%] | | [removed: 8] [added: 4] | % | | [removed: 5] [added: 2] | % |
| SG&A | [removed: 650] [added: 686] | | | | [removed: 686] [added: 697] | | | | [removed: 697] [added: 688] | | | | [removed: 6] [added: 2] | % | | [removed: 2] [added: (1] | [removed: %] [added: )%] | | [removed: 6] [added: 4] | % | | [removed: 4] [added: 2] | % |
| Operating income | $ | [removed: 898] [added: 971] | | | $ | [removed: 971] [added: 1,027] | | | $ | [removed: 1,027] [added: 1,533] | | | [removed: 8] [added: 6] | % | | [removed: 6] [added: 49] | % | | [removed: 11] [added: 9] | % | | [removed: 9] [added: 8] | % |
| • | “Sale of Southern Comfort and Tuaca.” On January 14, 2016, we reached an agreement to sell our Southern Comfort and Tuaca brands and related assets to Sazerac Company, Inc. The transaction closed March 1, 2016, for $543 million in cash (subject to a post-closing inventory adjustment), which resulted in a one-time gain of $485 million in the fourth quarter of fiscal 2016. This adjustment removes (a) the gain on sale, (b) those transaction-related costs not included in the gain on sale, and (c) operating activity for the non-comparable period, March and April in fiscal 2015 and 2016. We believe that these adjustments allow us to understand better our underlying results on a comparable basis. |
We have provided reconciliations of the non-GAAP measures adjusted to an “underlying” basis to their
Selected Financial Data” and “Item 7.
Management’s Discussion and Analysis of Financial Condition and Results of Operations – Executive Summary”:
| • | “Return on average invested capital.” This measure refers to the sum of net income and after-tax interest expense, divided by average invested capital. Average invested capital equals assets less liabilities, excluding interest-bearing debt, and is calculated using the average of the most recent 13 month-end balances. After-tax interest expense equals interest expense multiplied by one minus our effective tax rate. We consider return on average invested capital to be a meaningful indicator of how effectively and efficiently we use capital invested in our business. |
| • | “Adjusted” measures for (a) operating income, (b) operating margin, (c) effective tax rate, (d) diluted earnings per share, and (e) return on average invested capital. We provide these adjusted measures to identify the effect of the sale of Southern Comfort and Tuaca on reported income from operations and other key measures derived therefrom; this effect is expected not be part of our sustainable results or trends. These measures remove the effects of (a) the gain on sale, (b) those transaction-related costs not included in the gain on sale, and (c) operating activity related to the brands for the period subsequent to their divestiture (March and April in fiscal 2016). Tax effects on items (c), (d), and (e) are calculated consistent with the nature of the underlying transaction. |
| | | Page |
See “Item 1.
Business – Strategy” for details.
We are partway through a multiyear production capacity expansion project for Jack Daniel's.
| • | Over the past five years, we have divested certain businesses to enable better alignment of our resources with our long-term strategy. We divested our Hopland-based wine brands in 2011, leaving us with a portfolio primarily focused on spirits. Since then, we have pursued growth of our spirits portfolio mostly by organic means, with innovation playing a key role (see discussion below). In March 2016, we sold Southern Comfort and Tuaca to dedicate additional resources to opportunities with greater long-term growth prospects. See ‘‘Financial Highlights’’ below, “Item 7. Management’s Discussion and Analysis of Financial Condition and Results of Operations – Results of Operations,” and Note 15 to the accompanying financial statements for details about the financial impact of the sale of Southern Comfort and Tuaca. |
| • | In addition to our successful efforts to develop and introduce new products and line extensions for the Jack Daniel’s family of brands, we have pursued growth through innovation in the rest of our portfolio. Notable introductions have included Woodford Reserve Double Oaked (fiscal 2012) and Herradura Ultra (fiscal 2015). In April 2016, we announced plans to release our first new bourbon trademark in 20 years, Coopers’ Craft, in the summer of 2016 (fiscal 2017). |
| • | In June 2016 (fiscal 2017), we purchased The BenRiach Distillery Company Limited and, with it, three single malt Scotch whisky brands and distilleries – The GlenDronach, BenRiach, and Glenglassaugh. This purchase included other trademarks, a bottling plant, and The BenRiach Distillery Company Limited’s headquarters in Edinburgh, Scotland. We believe that these super-premium brands will provide us an immediate opportunity to participate in the growing single malt Scotch category and strengthen our portfolio’s long-term growth prospects in markets such as the United States, the United Kingdom, Taiwan, Germany, and in travel retail. We plan to build three new warehouses in fiscal 2017 to support the growth of these brands. |
| • | Our focus on the importance of the barrel in crafting whiskeys of the highest quality is perhaps unique in the industry. We believe we are the largest maker of new whiskey barrels in the world and, within the global spirits industry, only we own manufacturing facilities for new whiskey barrels. Our control over this critical input to the whiskey-making process gives us a competitive advantage – one that applies both to Jack Daniel’s and to our other aged spirits, including bourbons and tequilas today and – over time – Irish and Scotch whiskeys. For example, our barrel-making expertise enables us to introduce unique characteristics into our products, as we did with our successful recent innovation, Woodford Reserve Double Oaked. In addition, newly-introduced Coopers’ Craft bourbon was created to celebrate our more than 70 years of expertise raising barrels at the Brown-Forman Cooperage. While we expect it to benefit from a generally favorable craft spirits trend, we also believe that linking its identity to our distinctive barrel-making expertise will benefit Coopers’. As we progress toward becoming a global leader in whiskey, we will continue to take advantage of this source of differentiation for our existing portfolio and across the range of new opportunities. |
| | | Introduced Woodford Reserve Rye Whiskey | | | | |
| | | Sold Southern Comfort and Tuaca in Q4 | | | | Opened the Spencer Mill |
| 2017 | | Announced Coopers’ Craft bourbon to be released in Q1 | | | | |
| | | Purchased The BenRiach Distillery Company Limited in Q1 | | | | |
On March 1, 2016, we sold our Southern Comfort and Tuaca brands and related assets to Sazerac Company, Inc. for $543 million in cash (subject to a post-closing inventory adjustment).
The following table shows the impact of the sale of Southern Comfort and Tuaca on our operating results.
| Sale of Southern Comfort and Tuaca | | | | | | | | | | | |
| --- | --- | --- | --- | --- | --- | --- | --- | --- | --- | --- | --- |
| | | | | | | | | | | | |
| Fiscal year ended April 30, 2016 | Reported | | | | Sale of Southern Comfort and Tuaca1 | | | | Adjusted | | |
| | | | | | | | | | | | |
| Operating income | $ | 1,533 | | | $ | 486 | | | $ | 1,047 | |
| Operating margin | 38.2 | | % | | 12.0 | | % | | 26.2 | | % |
| Effective tax rate | 28.3 | | % | | (1.1 | | )% | | 29.4 | | % |
| Diluted earnings per share | $ | 5.22 | | | $ | 1.76 | | | $ | 3.46 | |
| Return on average invested capital2 | 34.1 | | % | | 11.1 | | % | | 23.0 | | % |
1See “Non-GAAP Financial Measures” above for details on the sale of Southern Comfort and Tuaca.
The $486 million adjustment above includes the sum of: (a) the $485 million gain on the sale of Southern Comfort and Tuaca, (b) those transaction-related costs not included in the gain on sale, and (c) operating activity related to the brands for the period subsequent to their divestiture (March and April in fiscal 2016).
2See “Non-GAAP Financial Measures” above for details on our use of “return on average invested capital,” including how we calculate this measure and why we think this information is useful to readers.
In fiscal 2016, we delivered net sales of $4.0 billion, a decrease of 2% compared to fiscal 2015, but an increase of 5% on an underlying basis; operating income of $1.5 billion, an increase of 49% compared to fiscal 2015, or 8% on an underlying basis;
and, diluted earnings per share of $5.22, or $3.46 after removing the $1.76 impact of the sale of Southern Comfort and Tuaca.
We improved our operating margin in fiscal 2016, as we added 1.1 percentage points from our continuing business and 12.0 percentage points attributed to the sale of Southern Comfort and Tuaca.
From a geographic perspective, the United States and our developed international markets led the growth, while emerging markets grew more slowly compared to fiscal 2015, and our business in the travel retail channel declined.
In fiscal 2016, our return on average invested capital improved to 34.1% driven by the sale of Southern Comfort and Tuaca.
| • | Growing competitive intensity of flavored whiskeys. Flavored whiskey continues to be the fastest-growing component of the whiskey category1, and we have participated fully in this market opportunity through our successful introductions of both JDTH and JDTF. Competition in the flavored whiskey category has intensified recently as industry participants seek to capitalize on the trend through sequential new product introductions. Our strategy has been to limit our flavored whiskey portfolio while investing to build JDTH and JDTF as sustainable growth brands in the United States and to expand both brands internationally. We believe that our strategy will allow us to benefit from this trend in a manner compatible with the long-term value of the Jack Daniel’s brand, but we may forgo growth opportunities in the nearer term. Because we essentially concluded the global rollout of JDTH in fiscal 2015, its growth slowed in fiscal 2016; however, we expect it will continue to be an important contributor to our growth in fiscal 2017. We launched JDTF in the United States in fiscal 2015 and then tested it in a few international markets in fiscal 2016. We will continue to roll out JDTF globally in fiscal 2017, and we expect it to continue to be an important contributor to our growth. |
Wood barrels are an essential input to our whiskeys.
“Net debt.” This measure refers to the sum of (a) long-term debt, (b) the current portion of long-term debt, and (c) short-term borrowings, less (d) cash and cash equivalents.
Management uses net debt as an additional measure of liquidity.
“Return on average invested capital.” This measure refers to the sum of net income and after-tax interest expense, divided by average invested capital.
Average invested capital equals assets less liabilities, excluding interest-bearing debt and is calculated
using the average of the most recent 13 month-end balances.
After-tax interest expense equals interest expense multiplied by one minus our effective tax rate.
We consider return on average invested capital to be a meaningful indicator of how effectively and efficiently we use invested capital in our business.
We have been expanding our production capacity for the Jack Daniel’s family of brands so that we can satisfy expected demand.
We believe that we were already the largest maker of new whiskey barrels in the world before the new cooperage significantly added to our capacity.
We believe that our ownership of new whiskey barrel manufacturing facilities is unique among our competitors, and that our control over this critical input to the whiskey-making process gives us a competitive advantage.
| • | We divested our Hopland-based wine brands in 2011, leaving us with a portfolio primarily focused on spirits. We have not made any material acquisitions since then (but see the next paragraph for a description of a recent minor acquisition). During this time, we have pursued growth of our spirits portfolio mostly through organic growth, with innovation playing a key role. In addition to our successful efforts to develop and introduce new products and line extensions for the Jack Daniel’s family of brands, we have pursued growth through innovation in the rest of our portfolio. Notable introductions have included Southern Comfort Lime (introduced in fiscal 2011) and Woodford Reserve Double Oaked (fiscal 2012). In fiscal 2015, we launched Herradura Ultra in Mexico during our second quarter and Southern Comfort Caramel in the United States during our third quarter. |
| | | Introduced Southern Comfort Lime | | Started distribution operations in Brazil | | |
In fiscal 2015 compared to fiscal 2014, we grew our underlying net sales by 6% (4% reported), increased underlying operating income by 9% (6% reported), and delivered a 5% increase in diluted earnings per share.
We improved our margins in fiscal 2015, as we added 60 basis points to our gross margin and 50 basis points to our operating margin.
Our net sales growth was driven by the United States, France, and emerging markets while the rest of the developed international markets grew more slowly.
| |
| --- |
growth opportunities driven by consumer trends affecting the category, including increased interest in luxury, craft, and small-batch whiskeys.
We believe that we can benefit from these trends with our existing portfolio of American whiskeys, and – when our assessment of opportunity supports it – we expect to bring other new products and line extensions to the market.
| • | Growing importance of flavored whiskeys. Flavored whiskey continues to be the fastest-growing category of whiskey.1 Because we essentially concluded the global rollout of Jack Daniel’s Tennessee Honey in fiscal 2015, its growth rates are slowing; however, we expect it will still be an important contributor to our growth in fiscal 2016. Additionally, since the rollout of Jack Daniel’s Tennessee Honey, cinnamon flavors have become the largest component of the flavored whiskey category. Accordingly, we anticipate that Jack Daniel’s Tennessee Fire, recently launched nationwide in the United States, will be an important contributor of growth for the Jack Daniel’s family of brands in fiscal 2016. |
While American white oak, the raw material used to make our barrels, is not in short supply, we believe that supply of wood inputs is constrained primarily by stave and heading mill capacity, and to a lesser extent, by logging capacity.
These market forces could cause prices for wood inputs to rise, which could lead to higher cost of sales for our whiskeys.
We believe that our investments in barrel manufacturing partially mitigate this risk.
| • | Emerging-market uncertainty. During fiscal 2015, we grew net sales in emerging markets, led by the Jack Daniel’s family of brands, while our competition reported generally stable results in emerging markets. We experienced challenges in Poland and to a lesser extent in Mexico and Russia but, collectively, our emerging markets have grown net sales consistently and at higher rates than our developed markets in recent years. We expect this to continue, but we are cautious about our |
growth outlook given the geopolitical uncertainty in Russia and Ukraine.
These two countries, and more broadly the emerging markets in eastern Europe and central Asia, have been important to our emerging markets net sales growth in recent years, including in fiscal 2015.
| --- | --- | --- | --- | --- | --- | --- | --- | --- | --- | --- | --- | --- | --- |
| | | | | | | | | | | | | | |
In fiscal 2015, underlying net sales in the United States increased 8%, driven by the Jack Daniel’s family of brands, including JDTW volume growth and price/mix improvement, JDTH volume growth, as well as volumes from the new line extension, Jack Daniel’s Tennessee Fire.
Reported net sales were hurt across Europe by foreign exchange due to the dollar strengthening against all currencies.
| • | In France, underlying net sales growth was primarily driven by higher direct-to-trade prices for JDTW associated with our fiscal 2014 route-to-consumer change. In addition, volumetric gains on JDTH, which was introduced in the second half of fiscal 2014, boosted net sales. (Underlying net sales growth was lower than reported net sales growth after excluding the effect of a favorable comparison to the prior year, when our former distributor reduced its inventory ahead of our January 2014 route-to-consumer change.) |
| • | In the United Kingdom, underlying net sales growth was driven by higher volumes of JDTH and JDTW, and to a lesser extent, by Jack Daniel’s RTDs/RTPs. These gains were only partially offset by declines in Finlandia and Southern Comfort. |
| • | In Turkey, underlying net sales growth was driven by JDTW volume and price increases and a more favorable customer mix. |
| • | In Poland, volumes were lower compared with those of the prior year, which included a buy-in prior to a 15% excise tax increase not repeated in fiscal 2015, as well as weaker consumer demand following the excise tax hike. |
| • | In Germany, underlying net sales were down due to decreased volumes related to reduced trade promotional activity. |
JD & Cola, an RTD and our largest brand in Australia, declined, reflecting changing consumer preferences, but was partially offset by gains in a recent RTD line extension, JD Double Jack.
The increase in underlying net sales was driven by broad growth across most of our other markets, led by Brazil, Mexico, markets in Africa, markets in Southeast Asia, and Canada, offset slightly by net sales declines in Korea and China.
In Mexico, underlying net sales growth of 3% was driven by increases in the Jack Daniel’s family of brands and Herradura, partially offset by volume declines on el Jimador associated with our decision to increase pricing to reposition the brand, as well as our decision to discontinue selling a lower-margin third-party brand.
| Finlandia | 3.4 | | (5 | %) | | 3.2 | | (5 | %) | | (11 | %) | 6 | % | (1 | %) | | (5 | %) |
| Southern Comfort Family | 2.2 | | (4 | %) | | 1.9 | | (4 | %) | | (7 | %) | 2 | % | (1 | %) | | (5 | %) |
An excerpt. Shown here: 40 of 265 rewritten, 40 of 175 added and 40 of 134 removed. The counts are complete. For every sentence, read Item 7. Management’s Discussion and Analysis of Financial Condition and Results of Operations in the FY2016 filing and the FY2015 filing.
Item 7A. Quantitative and Qualitative Disclosures about Market Risk
16 rewritten, 1 added, 1 removed, 40 unchanged
Only by taking risks [removed: are] [added: can] we [removed: able to] seize opportunities that will enhance brand performance and improve earnings, but we must balance risk and reward appropriately.
Our enterprise risk management process is intended to ensure that we take risks knowingly and [removed: thoughtfully,] [added: thoughtfully] and that we balance risks and potential rewards appropriately.
| • | Our Board of Directors is responsible for overseeing our enterprise risk assessment and mitigation processes and procedures. The Board [removed: has reserved to] itself [removed: the oversight of certain] [added: oversees some] strategic enterprise [removed: risks, delegating] [added: risks and delegates] responsibility for other risks to committees that report to the Board regularly on risks within their purview, and to management. |
| • | Our Risk [removed: Committee is] [added: Committee,] composed of [removed: members within various levels of management] [added: managers] from an array of [removed: functional] [added: levels, functions,] and [removed: geographical regions around] [added: geographies, reports to] the [removed: world. The Risk Committee] [added: Board at least annually. It] leads [removed: the Company’s] [added: our] enterprise risk management program, which systematically identifies and evaluates the major risks we face, identifies “owners” for each risk, and ensures that risk mitigation plans are in [removed: place. The Risk Committee reports to the Board at least annually.] [added: place and are being followed.] |
We try to manage risk responsibly through a variety of strategies, including production initiatives and [removed: hedging strategies.][added: hedging.]
Our foreign currency hedging contracts are subject to [removed: changes in] exchange [removed: rates,] [added: rate changes,] our commodity forward purchase contracts are subject to [removed: changes in] commodity [removed: prices,] [added: price changes,] and some of our debt obligations are subject to [removed: changes in] interest [removed: rates.][added: rate changes.]
[removed: We] [added: Below, we] discuss these exposures [removed: below] and [removed: also] provide a sensitivity analysis as to [removed: the effect the] [added: how these] changes could [removed: have on] [added: affect] our results of operations.
Risk Factors” for details on how economic conditions affecting market risks also affect the demand for and pricing of our products and how we are affected by [removed: fluctuations in foreign currency] exchange [removed: rates.][added: rate fluctuations.]
We estimate that our foreign currency revenue for our largest exposures will exceed our foreign currency expenses by approximately [removed: $677] [added: $650] million in fiscal [removed: 2016.][added: 2017.]
If these contracts remain effective, we will not recognize any unrealized gains or losses until we either recognize the underlying hedged transactions in earnings or convert the underlying hedged net asset [removed: exposures.]
At April 30, [removed: 2015,] [added: 2016,] our total foreign currency hedges had a notional value of [removed: $1,212] [added: $1,265] million, with a maximum term outstanding of 36 months, and were recorded as a net asset at their fair value of of [removed: $41] [added: $9] million.
As of April 30, [removed: 2015,] [added: 2016,] we hedged approximately [removed: 70%] [added: 75%] of our total transactional exposure to foreign exchange fluctuations in fiscal [removed: 2016] [added: 2017] for our major currencies by entering into foreign currency forward contracts.
Considering these hedges, we estimate that a 10% increase/decrease in the average value of the dollar in fiscal [removed: 2016] [added: 2017] relative to fiscal [removed: 2015’s] [added: 2016’s] effective exchange rates for our significant currency exposures would decrease/increase our fiscal [removed: 2016] [added: 2017] operating income by approximately [removed: $21] [added: $18] million.
To reduce price volatility, we use deliverable contracts for corn (in which we take physical delivery of the corn underlying each [removed: contract),] [added: contract)] rather than futures contracts or options.
Our cash and cash equivalents [removed: ($370] [added: ($263] million as of April 30, [removed: 2015)] [added: 2016)] and variable-rate debt [removed: ($190] [added: ($271] million as of April 30, [removed: 2015)] [added: 2016)] are exposed to the risk of [removed: changes in] interest [removed: rates.][added: rate changes.]
Based on the net balance of these items as of April 30, [removed: 2015,] [added: 2016,] a 1% increase in interest rates would result in [removed: higher interest expense and higher interest income, leading to about $2 million less interest expense on] a [added: negligible increase in] net [removed: basis.][added: interest expense.]
exposures.
We expect to mitigate the effect of some of the increases in our raw material costs through ongoing production and cost saving initiatives and targeted price increases.
Item 1. Business
131 rewritten, 41 added, 29 removed, 91 unchanged
We employ over [removed: 4,400] [added: 4,600] people on six continents, including about 1,300 people in Louisville, Kentucky, USA, home of our world headquarters.
Beginning in 1870 with Old Forester Bourbon Whisky – our founding brand – and spanning the generations since, we have built a portfolio of more than [removed: 30] [added: 40] spirit, wine, and ready-to-drink cocktail (RTD) brands that includes some of the best-known and most-loved trademarks in our industry.
The most important brand in our portfolio is Jack Daniel’s Tennessee Whiskey, which is the fourth-largest spirits brand of any kind and the largest [removed: selling] American whiskey brand in the world, according to Impact Databank’s “Top 100 Premium Spirits Brands Worldwide” list.1 In its [removed: second] [added: third] year on the list, Jack Daniel’s Tennessee Honey [removed: moved up to 89th] [added: is the second-largest-selling flavored whiskey] on the Worldwide Impact list, selling over [removed: 1.3] [added: 1.5] million nine-liter cases in calendar year [removed: 2014,] [added: 2015,] up [removed: 34%] [added: 13%] from the prior calendar [removed: year.][added: year.1 Additionally, Jack Daniel’s Tennessee Fire was designated as an Impact “Hot Brand”1 in its first full calendar year (2015).]
Our other leading global brands on the [added: Worldwide] Impact list are Finlandia, the [removed: seventh-largest-selling] [added: ninth-largest-selling] vodka; [removed: Southern Comfort, the fourth-largest-selling liqueur;] Canadian Mist, the fourth-largest-selling Canadian whisky; and el Jimador, [added: which is] the fourth-largest-selling [removed: tequila.][added: tequila and designated as an Impact “Hot Brand”.1]
| Jack Daniel’s [removed: Tennessee Whiskey] [added: RTDs] | | el Jimador Tequilas |
| Jack Daniel’s [removed: RTDs] [added: Tennessee Honey] | | el Jimador New Mix RTDs |
| Jack Daniel’s Tennessee [removed: Honey] [added: Whiskey] | | Woodford Reserve Kentucky Bourbons |
| Gentleman Jack Rare Tennessee Whiskey | | [removed: Canadian Mist Canadian Whisky] [added: Herradura Tequilas] |
| Jack Daniel’s Tennessee Fire | | [removed: Herradura Tequilas] [added: Canadian Mist Canadian Whisky] |
| Jack Daniel’s Single Barrel [added: Collection2] | | Sonoma-Cutrer California Wines |
| Jack Daniel’s [removed: Winter Jack] [added: Sinatra Select] | | Early Times Kentucky Whisky [added: and Bourbon] |
| Jack Daniel’s No. 27 Gold Tennessee Whiskey | | [removed: Early Times] [added: Old Forester] Kentucky Bourbon |
| Korbel California [removed: Champagnes2] [added: Brandy3] | | Collingwood Canadian Whisky |
| Korbel California [removed: Brandy2] [added: Champagnes3] | | Santa Dose Cachaça |
| 1Impact Databank, a well-known U.S. trade publication, published these industry statistics in [removed: February 2015.] [added: March 2016.] | |
| [removed: 2Not] [added: 3While Korbel is not an] owned [removed: by Brown-Forman but sold by us] [added: brand, we sell Korbel products] under contract in the United States and other select markets. | |
Management’s Discussion and Analysis of Financial Condition and Results of Operations – Results of Operations – Fiscal 2015 Brand Highlights” for [removed: additional information regarding] [added: details on] the performance of our brands.
Our vision in marketing is to “be the best brand builders in the [removed: industry … period.”] [added: industry.”] We build our brands by investing in programs that we believe create enduring connections with our consumers.
[added: We expect to grow our sales and profits by consistently] delivering creative, responsible marketing programs that drive brand recognition, brand trial, brand loyalty, and, ultimately, consumer demand around the world.
[removed: Our] [added: We sell our] products [removed: are sold] in [removed: more than] [added: approximately] 160 countries around the world.
Our largest international markets include [removed: Australia,] the United Kingdom, [added: Australia,] Mexico, Germany, Poland, France, [removed: Russia,] Turkey, [added: Russia,] Canada, and [removed: Japan.][added: Brazil.]
In fiscal [removed: 2015,] [added: 2016,] we generated [removed: 57%] [added: 54%] of our net sales outside the United States compared to [removed: 40%] [added: 41%] ten years ago.
The United States, our largest, most important market, accounted for [removed: 43%] [added: 46%] of our net sales in fiscal [removed: 2015.][added: 2016.]
We present the percentage of total net sales by geographic area for our most recent three fiscal years and, to provide historical context, fiscal [removed: 2005,] [added: 2006,] below:
| [removed: 2005] [added: 2006] | | ... | [removed: 2013 | |] 2014 | | 2015 | | [added: 2016] | [added: | |]
| United States | [removed: 60] [added: 59] | % | ... | 41 | % | [removed: 41] [added: 43] | % | [removed: 43] [added: 46] | % |
| Europe | | | ... | [removed: 30] [added: 32] | % | [removed: 32] [added: 31] | % | 31 | % |
| Australia | | | ... | [removed: 14] [added: 12] | % | [removed: 12] [added: 11] | % | [removed: 11] [added: 9] | % |
| Other | | | ... | 15 | % | 15 | % | [removed: 15] [added: 14] | % |
| Total [removed: International] [added: International*] | [removed: 40] [added: 41] | % | ... | 59 | % | [removed: 59] [added: 57] | % | [removed: 57] [added: 54] | % |
Management’s Discussion and Analysis of Financial Condition and Results of Operations – Fiscal [removed: 2015] [added: 2016] Market Highlights.” For details about our reportable segment and for additional geographic information about net sales and long-lived assets, refer to Note [removed: 13] [added: 14] to the Consolidated Financial Statements in “Item 8.
Our distribution network, which we sometimes refer to as our [removed: “route-to-consumer,”] [added: “route-to-consumer” (RTC),] takes a variety of forms, depending on (a) a market’s laws and regulatory framework for trade in beverage alcohol, (b) our assessment of a market’s long-term attractiveness and competitive dynamics, (c) the relative profitability of distribution options available to us, (d) the structure of the retail and wholesale trade in [removed: the] [added: a] market, and (e) our portfolio’s development stage in [removed: the] [added: a] market.
As these factors change, we evaluate our [removed: route-to-consumer] [added: RTC] strategy and, from time to time, [removed: adopt a different] [added: adapt our] model.
Outside the United States, we use a variety of [removed: route-to-consumer] [added: RTC] models.
We own and operate distribution companies in [removed: 11] [added: 13] markets: Australia, Brazil, Canada, China, the Czech Republic, France, Germany, [added: Hong Kong,] South Korea, Mexico, Poland, [added: Thailand,] and Turkey.
In these markets, [added: and in a large portion of the travel retail channel,] we sell our products directly to [removed: retail stores,] [added: retailers,] to wholesalers, or, in Canada, to provincial governments.
In many other markets, including Italy, Japan, Russia, [added: and] South Africa, [removed: and Spain,] we rely on others to distribute our brands, generally under fixed-term distribution contracts.
[removed: Approximately 31% of our net sales for] [added: For the] fiscal [removed: year] [added: years] ended April 30, [removed: 2013, was] [added: 2014, 2015, and 2016, approximately 32% of our net sales were] in the fourth calendar quarter.
Trade information indicates that we are one of the largest global suppliers of premium [removed: wine] [added: spirits] and [removed: spirits.][added: wine.]
According to International Wine & Spirit [removed: Research,] [added: Research (the IWSR),] for calendar year [removed: 2014,] [added: 2015,] the ten largest global spirits companies controlled less than 20% of the total global market for spirits (on a volume basis).
| Jack Daniel’s Winter Jack | | Chambord Liqueur |
| Finlandia Vodkas | | Antiguo Tequila |
| 2The Jack Daniel’s Single Barrel Collection includes Jack Daniel’s Single Barrel Select, Jack Daniel’s Single Barrel Barrel Proof, Jack Daniel’s Single Barrel Rye, and Jack Daniel’s Single Barrel 100 Proof. | |
The U.S. proportion of net sales has grown from fiscal 2014 to fiscal 2016, mainly due to the negative impact of foreign exchange on our international business.
| Note: Totals may differ due to rounding | | | | | | | | | |
In fiscal 2017, we plan to establish a new distribution company in Spain, which we expect to begin operating in fiscal 2018.
In addition, particularly in the United States, we increasingly compete with (a) national companies, and (b) entrepreneurs, many of whom are recent entrants to the industry – typically with small-batch or craft spirit brands.
Our first priority is to grow our premium spirits portfolio organically.
But as opportunities arise, we will pursue innovation and consider acquisitions and partnerships that meet our rigorous quantitative and qualitative criteria.
We have taken steps to reposition el Jimador tequila as a more premium brand in Mexico, its largest market by volume.
As a result, volumes have declined over the past couple of years in Mexico, though we expect the brand’s overall performance to improve there over time.
In the United States and select international markets, we continue to experience solid growth with el Jimador, and we believe in this brand’s long-term potential.
We recently announced the launch of Coopers’ Craft, our first new bourbon trademark in more than 20 years, which we will begin selling in select United States markets in July 2016.
We are in the development stage of our Slane Irish Whiskey brand, which we anticipate launching in the spring of 2017.
Lastly, on June 1, 2016, we acquired The BenRiach Distillery Company Limited.
This purchase added three single malt Scotch whisky brands into our growing whiskey portfolio: The GlenDronach, BenRiach, and Glenglassaugh.
We believe that super- and ultra-premium whiskeys are attractive long-term businesses for us, and we will continue to pursue global growth in these categories.
In fiscal 2016, as part of our evolving portfolio strategy and our efforts to focus resources on our highest strategic priorities, we sold our Southern Comfort and Tuaca brands.
This decision reflects our continuing efforts to reshape our portfolio by developing, divesting, and acquiring brands to create value and improve growth.
It is also essential for the long-term prosperity of our company and our industry.
The group made significant progress in 2015, resulting from the collaboration among all signatories and with stakeholders where we do business.
By engaging non-governmental organizations, we reached more people across a broader geographic footprint with underage drinking programs.
Drunk driving prevention pilot programs expanded to another four countries, with two more planned
for 2016.
With our retail business partners, we developed and launched responsible retailing principles that are increasing the number of retail programs focused on enforcing legal purchase age and responsible beverage service.
As part of our commitment to responsible marketing, and to enable consumers to make more informed decisions, we will be adding nutritional information to our brand websites later this year.
Our vision – Building Forever – is inherently linked to environmental sustainability.
A key component of our environmental sustainability strategy is reducing our energy consumption and greenhouse gas (GHG) emissions.
We report on our progress toward these goals in our biennial Corporate Responsibility Reports, available online.
In 2016, Newsweek magazine named Brown-Forman the third “greenest” U.S. beverage company, and number 52 among the 500 largest publicly traded companies in the United States.
Rankings are based on eight measures of corporate sustainability and environmental performance.
In addition, we have been identified as a global leader for our actions and strategies in response to climate change and have been awarded a position on The Climate “A” List by CDP, an international not-for-profit organization that produces the list at the request of 822 investors who represent more than a third of the world’s invested capital.
Our eight ERGs foster a diverse and inclusive environment that drives our high-commitment, high-performance organization and encourages employees to bring their individuality to work.
Our work in this area will help inform our response to the U.K.’s recent passage of the Modern Slavery Act.
| | |
| --- | --- |
| | |
| | |
| 1Human Rights Campaign 2016 Corporate Equity Index at www.hrc.org/resources/best-places-to-work-2016. | |
We believe, as a responsible and caring corporate citizen, it is vital that we give back to the communities that support both our employees and our business.
| Jack Daniel’s Sinatra™ Select | | Early Times Fire Eater |
| Finlandia Vodkas | | Chambord Liqueur |
| Southern Comfort | | Antiguo Tequila |
| Southern Comfort flavored line extensions | | Old Forester Kentucky Bourbon |
| Southern Comfort RTDs | | Tuaca Liqueur |
See “Item 7.
We expect to grow our sales and profits by consistently
In some states, we have distribution contracts; these contracts typically have no fixed term, but we can terminate them at any time if we pay a terminated distributor a fee (primarily based on a percentage of purchases over time).
Some state franchise statutes limit our ability to terminate distributors or mandate a payment to a terminated distributor.
For the fiscal years ended April 30, 2014, and April 30, 2015, approximately 32% of our net sales were in the fourth calendar quarter.
We typically age our whiskeys between three and six years.
An excellent business for B-F is one that delivers strong growth, solid margins, and high returns.
While our first priority is to drive the organic growth of our premium spirits portfolio, we will pursue innovation and consider acquisitions that meet our rigorous criteria as opportunities arise.
Management’s Discussion and Analysis of Financial Condition and Results of Operations, Executive Summary” for details about our acquisition of Slane Castle Irish Whiskey Limited.
We are taking steps to reposition el Jimador tequila as a more premium brand in Mexico, its largest market; as a result, volumes will likely decline in Mexico in the short term, we expect overall performance of the brand to improve there over time.
We also will continue our efforts to enhance and broaden the consumer appeal of the Southern Comfort brand.
So we plan to continue our engagement with our shareholders, including our controlling family shareholders.
In its second year, calendar 2014, the group made significant progress.
We increased outreach to governments and other stakeholders on strengthening legal purchase age, launched the first ever Digital Guiding Principles for digital advertising, and developed guidelines for responsible retailing.
We are pleased to have surpassed our previous 2020 greenhouse gas (GHG) and water goals ahead of schedule, and we have recently committed to a tougher challenge.
In calendar 2015, Brown-Forman received a Climate Leadership Award from the U.S. Environmental Protection Agency for Excellence in Greenhouse Gas Management (known as a Goal Setting Certificate).
Brown-Forman was one of eight companies recognized for setting aggressive GHG goals.
Brown-Forman Tequila Mexico was recognized by the Mexican Environmental Protection Agency (Procuraduría Federal de Protección al Ambiente) with the Level 2 Clean Industry Certificate.
In addition to recognizing waste reduction efforts, the award reflects Casa Herradura’s broad commitment to environmental stewardship, including energy and emissions reductions, water conservation and treatment, and more.
Casa Herradura is the first tequila distillery, and only the third company in the state of Jalisco, to receive this honor.
Todman became our first African-American director.
We target our support in six general areas: arts and culture, education, environment, social services, alcohol responsibility, and community development.
| James S. Welch, Jr. | 56 | Company Vice Chairman, Executive Director Corporate and Civic Affairs since February 2015. Company Vice Chairman, Executive Director of Corporate Affairs, Strategy, and Diversity from 2012 to 2015. Company Vice Chairman, Executive Director of Corporate Affairs, Strategy, Diversity, and Human Resources from 2007 to 2012. |
Corporate Governance and Nominating Committee, and Executive Committee of our Board of Directors.
An excerpt. Shown here: 40 of 131 rewritten, 40 of 41 added and all 29 removed. The counts are complete. For every sentence, read Item 1. Business in the FY2016 filing and the FY2015 filing.
Cover and table of contents
39 rewritten, 4 added, 3 removed, 129 unchanged
| | For the fiscal year ended April 30, [removed: 2015] [added: 2016] |
The aggregate market value, as of the last business day of the most recently completed second fiscal quarter, of the voting and nonvoting equity held by nonaffiliates of the registrant was approximately [removed: $14,300,000,000.][added: $15,400,000,000.]
The number of shares outstanding for each of the registrant’s classes of Common Stock on [removed: June 15, 2015,] [added: May 31, 2016,] was:
| Class A Common Stock (voting) | [removed: 84,528,000] [added: 84,509,838] | |
| Class B Common Stock (nonvoting) | [removed: 122,483,629] [added: 112,418,105] | |
Portions of the Proxy Statement of Registrant for use in connection with the Annual Meeting of Stockholders to be held July [removed: 23, 2015,] [added: 28, 2016,] are incorporated by reference into Part III of this report.
| | | Page [removed: No.] |
| Item 1. | [removed: [Business](#sFAFB98ECBCA95D9E3073D305971F5F6F)] [added: [Business](#s5F740E4579BF495E213725E99D478476)] | [removed: [4](#sFAFB98ECBCA95D9E3073D305971F5F6F)] [added: [4](#s5F740E4579BF495E213725E99D478476)] |
| Item 1A. | [Risk [removed: Factors](#sEE69F5047BD8C57CE23DD3059935F087)] [added: Factors](#s50688331E6B81BEFB2BB25E99F6CC24C)] | [removed: [11](#sEE69F5047BD8C57CE23DD3059935F087)] [added: [11](#s50688331E6B81BEFB2BB25E99F6CC24C)] |
| Item 1B. | [Unresolved Staff [removed: Comments](#s8A8EB5B2A5657EB9D6BED30599676DCE)] [added: Comments](#s29DCEB9439569CFFB0B125E99F8DE80B)] | [removed: [17](#s8A8EB5B2A5657EB9D6BED30599676DCE)] [added: [17](#s29DCEB9439569CFFB0B125E99F8DE80B)] |
| Item 2. | [removed: [Properties](#sDCE14DDAB53ED2E868B4D305998937D4)] [added: [Properties](#sC33FAFF2911521BBC83425E99FC0EDB6)] | [removed: [18](#sDCE14DDAB53ED2E868B4D305998937D4)] [added: [18](#sC33FAFF2911521BBC83425E99FC0EDB6)] |
| Item 3. | [Legal [removed: Proceedings](#s54D4942FAD6BAB73F1F8D30599BADD25)] [added: Proceedings](#s6B4E2DCD9E9B8F340E0225E99FE0B10E)] | [removed: [18](#s54D4942FAD6BAB73F1F8D30599BADD25)] [added: [18](#s6B4E2DCD9E9B8F340E0225E99FE0B10E)] |
| Item 4. | [Mine Safety [removed: Disclosures](#s2129E106403910B5D545D30599DC088A)] [added: Disclosures](#s01F670B34F08190004C325E9A012CC65)] | [removed: [18](#s2129E106403910B5D545D30599DC088A)] [added: [18](#s01F670B34F08190004C325E9A012CC65)] |
| Item 5. | [Market for the Registrant’s Common Equity, Related Stockholder Matters, and Issuer Purchases of Equity [removed: Securities](#s697B5CF1BDD9646107A2D3059A3065CB)] [added: Securities](#s705BB5DAE3503056D26B25E9A066878B)] | [removed: [19](#s697B5CF1BDD9646107A2D3059A3065CB)] [added: [19](#s705BB5DAE3503056D26B25E9A066878B)] |
| Item 6. | [Selected Financial [removed: Data](#sA01ABEE8BFC6D5064FC2D3059AD571F6)] [added: Data](#s28253894EA1347FC5CEE25E99B8DF7E2)] | [removed: [21](#sA01ABEE8BFC6D5064FC2D3059AD571F6)] [added: [21](#s28253894EA1347FC5CEE25E99B8DF7E2)] |
| Item 7. | [Management’s Discussion and Analysis of Financial Condition and Results of [removed: Operations](#sEC1247088FD2CB06B856D3059B07CA0A)] [added: Operations](#sA9427562616B15C9A6C925E9A161ECA2)] | [removed: [22](#sEC1247088FD2CB06B856D3059B07CA0A)] [added: [22](#sA9427562616B15C9A6C925E9A161ECA2)] |
| Item 7A. | [Quantitative and Qualitative Disclosures about Market [removed: Risk](#sE62D9602B03D63AF1C7AD3059C760606)] [added: Risk](#sC563A596F9B9B7D4456325E9A2CF2717)] | [removed: [43](#sE62D9602B03D63AF1C7AD3059C760606)] [added: [44](#sC563A596F9B9B7D4456325E9A2CF2717)] |
| Item 8. | [Financial Statements and Supplementary [removed: Data](#sE584633CF0003A69CEDBD3059CA9E056)] [added: Data](#sB207C2CABC5BCCBC32EC25E9A30149C4)] | [removed: [45](#sE584633CF0003A69CEDBD3059CA9E056)] [added: [46](#sB207C2CABC5BCCBC32EC25E9A30149C4)] |
| Item 9. | [Changes in and Disagreements with Accountants on Accounting and Financial [removed: Disclosure](#s3116B32F60BC01456136D305A18B51AD)] [added: Disclosure](#s1CA8D884688D5340917825E9A7E4FBE3)] | [removed: [72](#s3116B32F60BC01456136D305A18B51AD)] [added: [75](#s1CA8D884688D5340917825E9A7E4FBE3)] |
| Item 9A. | [Controls and [removed: Procedures](#s3DD70CF80EC41245F481D305A1ABB49F)] [added: Procedures](#s062FE71ED1D38A6AFA8B25E9A8066551)] | [removed: [72](#s3DD70CF80EC41245F481D305A1ABB49F)] [added: [75](#s062FE71ED1D38A6AFA8B25E9A8066551)] |
| Item 9B. | [Other [removed: Information](#s38CD231216BF9A89C9DBD305A1DEFA16)] [added: Information](#s8F15F961CE67972F72F225E9A8388B2C)] | [removed: [72](#s38CD231216BF9A89C9DBD305A1DEFA16)] [added: [75](#s8F15F961CE67972F72F225E9A8388B2C)] |
| Item 10. | [Directors, Executive Officers, and Corporate [removed: Governance](#s2C02EF9469D01AAB5F2BD305A232DD3C)] [added: Governance](#s1136F27E9E2E16177E7625E9A88AC26F)] | [removed: [72](#s2C02EF9469D01AAB5F2BD305A232DD3C)] [added: [75](#s1136F27E9E2E16177E7625E9A88AC26F)] |
| Item 11. | [Executive [removed: Compensation](#s30B26A2E7773CEED4EB0D305A2524C5E)] [added: Compensation](#s79F4129C06B8A6A8E36325E9A8AC703B)] | [removed: [72](#s30B26A2E7773CEED4EB0D305A2524C5E)] [added: [75](#s79F4129C06B8A6A8E36325E9A8AC703B)] |
| Item 12. | [Security Ownership of Certain Beneficial Owners and Management and Related Stockholder [removed: Matters](#s306FE2EC7EA898879B8ED305A28525FA)] [added: Matters](#s89EBCD0DAB71FD9916B325E9A8DD7961)] | [removed: [72](#s306FE2EC7EA898879B8ED305A28525FA)] [added: [75](#s89EBCD0DAB71FD9916B325E9A8DD7961)] |
| Item 13. | [Certain Relationships and Related Transactions, and Director [removed: Independence](#s89F5A52B7D3BCEF5E625D305A2A5C38A)] [added: Independence](#sEC0DA210C240E697EB4325E9A8FF8EB3)] | [removed: [72](#s89F5A52B7D3BCEF5E625D305A2A5C38A)] [added: [75](#sEC0DA210C240E697EB4325E9A8FF8EB3)] |
| Item 14. | [Principal Accounting Fees and [removed: Services](#s3E6EDE7B8B3B44AF3833D305A2D83640)] [added: Services](#s93C5525ED0C65D6AD2B925E9A9314FE8)] | [removed: [73](#s3E6EDE7B8B3B44AF3833D305A2D83640)] [added: [76](#s93C5525ED0C65D6AD2B925E9A9314FE8)] |
| Item 15. | [Exhibits and Financial Statements [removed: Schedules](#sF45B316473109A0C4E4CD305A32BE97B)] [added: Schedules](#sA74EB73AEED8EF7D23A325E9A9851346)] | [removed: [73](#sF45B316473109A0C4E4CD305A32BE97B)] [added: [76](#sA74EB73AEED8EF7D23A325E9A9851346)] |
| [SCHEDULE II – Valuation and Qualifying [removed: Accounts](#s21389F8244EB8B261FD0D3057081B59C)] [added: Accounts](#s5DBC36A0306FA07DA3F625E98F8BE2D4)] | | [removed: [79](#s21389F8244EB8B261FD0D3057081B59C)] [added: [82](#s5DBC36A0306FA07DA3F625E98F8BE2D4)] |
Management’s Discussion and Analysis of Financial Condition and Results of Operations,” contain statements, estimates, [removed: or] [added: and] projections that are “forward-looking statements” as defined under U.S. federal securities laws.
Words such as “aim,” “anticipate,” “aspire,” [removed: “believe,”] [added: “believe,”, “can,”] “continue,” “could,” “envision,” “estimate,” “expect,” “expectation,” “intend,” “may,” [added: “might,”] “plan,” “potential,” “project,” “pursue,” “see,” “seek,” “should,” “will,” [added: “would,”] and similar words identify forward-looking statements, which speak only as of the date we make them.
These risks and uncertainties [removed: include] [added: include, but are not limited to,] those described in Part I under “Item 1A.
| • | Tax rate changes (including excise, sales, VAT, tariffs, duties, corporate, individual income, dividends, capital gains) or changes in related reserves, changes in tax rules (for example, LIFO, foreign income deferral, U.S. [removed: manufacturing] [added: manufacturing,] and other deductions) or accounting standards, and the unpredictability and suddenness with which they can occur |
| • | Changes in consumer preferences, consumption, or purchase patterns – particularly away from larger producers in favor of smaller distilleries or local producers, or away from brown spirits, our premium products, or spirits generally, and our ability to anticipate or react to them; bar, restaurant, travel, or other on-premise declines; shifts in demographic trends; [added: or] unfavorable consumer reaction to new products, line extensions, package changes, product reformulations, or other product innovation |
| • | Decline in the social acceptability of beverage alcohol [removed: products] in significant markets |
| • | Product recalls or other product liability claims; [added: or] product counterfeiting, tampering, contamination, or product quality issues |
| • | Significant legal disputes and proceedings; [added: or] government investigations [removed: (particularly of industry or company business, trade or marketing practices)] |
Management’s Discussion and Analysis of Financial Condition and Results of Operations,” include measures [added: that are] not [removed: derived in accordance with] [added: measures of financial performance under] U.S. generally accepted accounting principles (GAAP).
These [added: non-GAAP] measures should not be considered in isolation or as a substitute for any measure derived in accordance with GAAP, and also may be inconsistent with [removed: similar] [added: similarly-titled] measures presented by other companies.
Management’s Discussion and Analysis of Financial Condition and Results of Operations,” [added: we present] the reasons [removed: for the company’s] [added: we] use [removed: of] these measures [removed: are presented] under the heading, “Non-GAAP Financial Measures,” and [added: we present] reconciliations of these measures to the most closely comparable GAAP measures [removed: are presented] under the heading “Results of Operations – Year-Over-Year Comparisons.”
10-K 1 bfb-2016430x10k.htm 10-K
| OR | |
| | Table of Contents | |
| [SIGNATURES](#s2C456720265DDE5C223125E9A9A6C6B6) | | [79](#s2C456720265DDE5C223125E9A9A6C6B6) |
10-K 1 bfb-2015430x10k.htm 10-K
| | OR |
| [SIGNATURES](#s4B36B9B8868F7FFD6667D305A34C6ECF) | | [76](#s4B36B9B8868F7FFD6667D305A34C6ECF) |
Item 2. Properties
5 rewritten, 1 added, 0 removed, 33 unchanged
Company-owned production facilities include distilleries, a winery, a concentrate plant, bottling plants, warehousing operations, [removed: saw mills,] [added: sawmills,] and cooperages.
We also have agreements with other parties for contract production in Australia, Belgium, [added: Brazil,] China, Estonia, Finland, [added: Ireland,] Mexico, the Netherlands, South Africa, and the United States.
| • | United States: Irvine, California; Irving, Texas; Atlanta, Georgia; [removed: and] Baltimore, [removed: Maryland.] [added: Maryland; and Washington, D.C.] |
| • | International: Guadalajara, Mexico; [removed: Sydney, Australia;] Hamburg, Germany; [removed: Paris, France; Warsaw, Poland;] [added: Sydney, Australia;] London, United Kingdom; [removed: Prague, Czech Republic;] [added: Warsaw, Poland; Paris, France;] Mexico City, Mexico; [added: Prague, Czech Republic;] São Paulo, Brazil; [added: Istanbul, Turkey;] Amsterdam, Netherlands; [removed: and] [added: Moscow, Russia; Shanghai, China;] Hong [removed: Kong.] [added: Kong; and Gurgaon, India.] |
| Lynchburg, Tennessee | Distilling, bottling, warehousing | Home of [removed: the] Jack Daniel’s [removed: family of brands] |
| Slane, Ireland | Distilling, visitors’ center | Future home of Slane Irish Whiskey |
Item 5. Market for the Registrant’s Common Equity, Related Stockholder Matters, and Issuer Purchases of Equity Securities
19 rewritten, 7 added, 6 removed, 24 unchanged
Our Class A and Class B common stock is traded on the New York Stock Exchange [removed: (under] [added: under] the symbols “BFA” and “BFB,” [removed: respectively).][added: respectively.]
As of May 31, [removed: 2015,] [added: 2016,] there were [removed: 2,712] [added: 2,736] holders of record of Class A common stock and [removed: 5,265] [added: 5,154] holders of record of Class B common stock.
Because of overlapping ownership between classes, as of May 31, [removed: 2015,] [added: 2016,] we had only [removed: 5,877] [added: 5,719] distinct [removed: record holders.][added: common stockholders of record.]
The following table sets forth, for the [removed: quarterly] periods indicated, the high and low sales prices per share for our Class A and Class B common stock, as reported on the New York Stock Exchange composite tape, and dividend per share information:
| | | Fiscal [removed: 2014] [added: 2015] | | | | | | | | | | | | | | | | | | | Fiscal [removed: 2015] [added: 2016] | | | | | | | | | | | | | | | | | | |
| Class A high | | $ | [removed: 75.47] [added: 95.29] | | | $ | [removed: 74.65] [added: 93.09] | | | $ | [removed: 79.83] [added: 98.00] | | | [removed: 91.00] [added: 95.23] | | | $ | [removed: 91.00] [added: 98.00] | | | $ | [removed: 95.29] [added: 119.49] | | | $ | [removed: 93.09] [added: 122.30] | | | $ | [removed: 98.00] [added: 117.53] | | | $ | [removed: 95.23] [added: 112.24] | | | $ | [removed: 98.00] [added: 122.30] | |
| Class A low | | [removed: 67.00] [added: 85.98] | | | | [removed: 65.46] [added: 81.38] | | | | [removed: 71.00] [added: 85.33] | | | | [removed: 74.67] [added: 86.85] | | | [removed: 65.46] [added: 81.38] | | | | [removed: 85.98] [added: 93.09] | | | | [removed: 81.38] [added: 105.87] | | | | [removed: 85.33] [added: 99.50] | | | | [removed: 86.85] [added: 100.40] | | | | [removed: 81.38] [added: 93.09] | | |
| Class B high | | [removed: 74.29] [added: 97.15] | | | | [removed: 74.96] [added: 93.62] | | | | [removed: 80.76] [added: 97.97] | | | | [removed: 91.15] [added: 93.99] | | | [removed: 91.15] [added: 97.97] | | | | [removed: 97.15] [added: 108.41] | | | | [removed: 93.62] [added: 110.81] | | | | [removed: 97.97] [added: 106.88] | | | | [removed: 93.99] [added: 103.39] | | | | [removed: 97.97] [added: 110.81] | | |
| Class B low | | [removed: 66.44] [added: 86.48] | | | | [removed: 66.41] [added: 81.89] | | | | [removed: 72.11] [added: 85.43] | | | | [removed: 75.54] [added: 86.71] | | | [removed: 66.41] [added: 81.89] | | | | [removed: 86.48] [added: 90.65] | | | | [removed: 81.89] [added: 95.21] | | | | [removed: 85.43] [added: 90.60] | | | | [removed: 86.71] [added: 93.25] | | | | [removed: 81.89] [added: 90.60] | | |
Note: Quarterly amounts [removed: do] [added: may] not add to amounts for the year due to rounding.
The following table summarizes information as of April 30, [removed: 2015, relating to] [added: 2016, about] our equity compensation plans [removed: pursuant to] [added: under] which [added: we have made] grants of stock options, stock appreciation rights, restricted stock, market value units, performance [removed: units] [added: units,] or other equity [removed: awards have been made.][added: awards.]
| Equity compensation plans approved by Class A common stockholders | | | [removed: 1,901,441] [added: 1,532,196] | | [removed: $48.46] [added: $56.83] | | [removed: 7,253,166] [added: 6,803,869] |
1Includes [removed: 1,773,777] [added: 1,411,701] Class B common shares to be issued upon exercise of stock-settled stock appreciation rights (SSARs); [removed: 81,322] [added: 67,426] Class B common restricted stock units (RSUs); [removed: 21,506] [added: 31,676] Class A common deferred stock units (DSUs); and [removed: 24,836] [added: 21,393] Class B common DSUs issued under the Brown-Forman 2004 or 2013 Omnibus Compensation Plans.
The fair market value of our common stock at fiscal year-end has been used for the purposes of reporting the number of shares to be issued upon exercise of the [removed: 3,817,206] [added: 3,426,162] SSARs outstanding at fiscal year-end.
2RSUs and DSUs [removed: do not] have [removed: an] [added: no] exercise price because their value depends on continued employment or service over time, and are to be settled for shares of Class B common stock.
The information presented assumes an initial investment of $100 on April 30, [removed: 2010,] [added: 2011,] and that all dividends were reinvested.
The cumulative returns shown [removed: on the graph] represent the value that these investments would have had on April 30 in the years since [removed: 2010.][added: 2011.]
[removed: ][added: 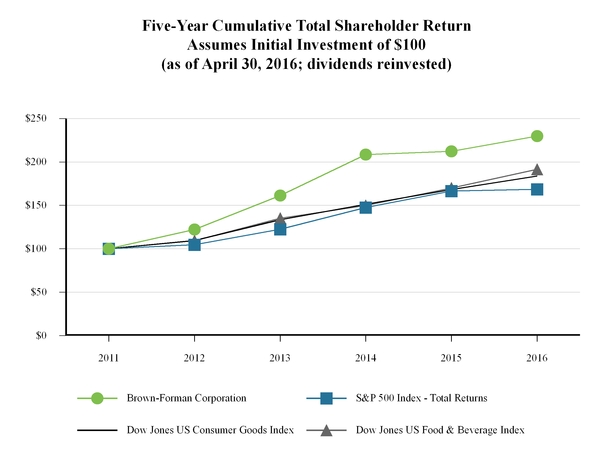]
The following table provides information about shares of our common stock that we acquired during the quarter ended April 30, [removed: 2015:][added: 2016:]
| Declared | | 0.580 | | | | — | | | | 0.630 | | | | — | | | 1.210 | | | | 0.630 | | | | — | | | | 0.680 | | | | — | | | | 1.310 | | |
| Paid | | 0.290 | | | | 0.290 | | | | 0.315 | | | | 0.315 | | | 1.210 | | | | 0.315 | | | | 0.315 | | | | 0.340 | | | | 0.340 | | | | 1.310 | | |
| February 1, 2016 - February 29, 2016 | 1,133,637 | | $96.03 | 1,133,637 | | $ | 1,124,800,000 | |
| March 1, 2016 - March 31, 2016 | 1,282,310 | | $97.38 | 1,282,310 | | $ | 1,000,000,000 | |
| April 1, 2016 - April 30, 2016 | 1,165,013 | | $95.70 | 1,165,013 | | $ | 888,500,000 | |
| Total | 3,580,960 | | $96.41 | 3,580,960 | | | | |
As we announced on January 28, 2016, the Board approved a new $1 billion share repurchase authorization, commencing April 1, 2016, through March 31, 2017, subject to market and other conditions.
| Declared | | 0.51 | | | | — | | | | 0.58 | | | | — | | | 1.09 | | | | 0.58 | | | | — | | | | 0.63 | | | | — | | | | 1.21 | | |
| Paid | | 0.26 | | | | 0.26 | | | | 0.29 | | | | 0.29 | | | 1.09 | | | | 0.29 | | | | 0.29 | | | | 0.32 | | | | 0.32 | | | | 1.21 | | |
| February 1, 2015 - February 28, 2015 | 152,944 | | $88.91 | 152,944 | | $ | 170,000,000 | |
| March 1, 2015 - March 31, 2015 | 815,595 | | $88.71 | 815,595 | | $ | 1,097,700,000 | |
| April 1, 2015 - April 30, 2015 | 1,154,886 | | $91.59 | 1,154,886 | | $ | 991,900,000 | |
| Total | 2,123,425 | | $90.29 | 2,123,425 | | | | |
Item 6. Selected Financial Data
24 rewritten, 2 added, 6 removed, 17 unchanged
| Year Ended April 30, | [removed: 2006 | | |] 2007 | | [added: |] 2008 | | 2009 | | 2010 | | 2011 | | 2012 | | 2013 | | 2014 | | 2015 | | [added: 2016 | |]
| Net sales | $ | [removed: 2,412 | |] 2,806 | | 3,282 | | 3,192 | | 3,226 | | 3,404 | | 3,614 | | 3,784 | | 3,946 | | 4,096 | | [added: 4,011 | |]
| Gross profit | $ | [removed: 1,308 | |] 1,481 | | 1,695 | | 1,577 | | 1,611 | | 1,724 | | 1,795 | | 1,955 | | 2,078 | | 2,183 | | [added: 2,144 | |]
| Operating income | $ | [removed: 563 | |] 602 | | 685 | | 661 | | 710 | | 855 | | 788 | | 898 | | 971 | | 1,027 | | [added: 1,533 | |]
| Net income | $ | [removed: 395 | |] 400 | | 440 | | 435 | | 449 | | 572 | | 513 | | 591 | | 659 | | 684 | | [added: 1,067 | |]
| – Basic | [removed: 228.9 | | |] 230.4 | | [added: |] 229.6 | | 225.7 | | 221.8 | | 218.4 | | 214.5 | | 213.4 | | 213.5 | | 211.6 | | [added: 203.0 | |]
| – Diluted | [removed: 231.4 | | |] 232.8 | | [added: |] 231.6 | | 227.1 | | 222.9 | | 219.8 | | 216.1 | | 215.0 | | 215.1 | | 213.1 | | [added: 204.3 | |]
| – Basic | $ | [removed: 1.73 | |] 1.74 | | 1.91 | | 1.92 | | 2.02 | | 2.61 | | 2.39 | | 2.77 | | 3.08 | | 3.23 | | [added: 5.26 | |]
| – Diluted | $ | [removed: 1.71 | |] 1.72 | | 1.89 | | 1.91 | | 2.01 | | 2.60 | | 2.37 | | 2.75 | | 3.06 | | 3.21 | | [added: 5.22 | |]
| Gross margin | [removed: 54.2 | | % |] 52.8 | [added: |] % | 51.6 | % | 49.4 | % | 50.0 | % | 50.7 | % | 49.7 | % | 51.7 | % | 52.7 | % | 53.3 | % | [added: 53.4 | % |]
| Operating margin | [removed: 23.3 | | % |] 21.5 | [added: |] % | 20.9 | % | 20.7 | % | 22.0 | % | 25.1 | % | 21.8 | % | 23.7 | % | 24.6 | % | 25.1 | % | [added: 38.2 | % |]
| Effective tax rate | [removed: 29.3 | | % |] 31.7 | [added: |] % | 31.7 | % | 31.1 | % | 34.1 | % | 31.0 | % | 32.5 | % | 31.7 | % | 30.5 | % | 31.7 | % | [added: 28.3 | % |]
| Average invested capital | $ | [removed: 1,863 | |] 2,431 | | 2,747 | | 2,893 | | 2,825 | | 2,711 | | 2,803 | | 2,834 | | 3,131 | | 3,196 | | [added: 3,221 | |]
| Return on average invested capital | [removed: 21.9 | | % |] 17.4 | [added: |] % | 17.2 | % | 15.9 | % | 16.6 | % | 21.8 | % | 19.1 | % | 21.7 | % | 21.6 | % | 22.0 | % | [added: 34.1 | % |]
| Cash dividends declared per common share | $ | [removed: 0.56 | |] 0.62 | | 0.69 | | 0.75 | | 0.78 | | 1.49 | | 0.89 | | 4.98 | | 1.09 | | 1.21 | | [added: 1.31 | |]
| Total assets at April 30 | $ | [removed: 2,728 | |] 3,551 | | 3,405 | | 3,475 | | 3,383 | | 3,712 | | 3,477 | | 3,626 | | 4,103 | | [removed: 4,193] [added: 4,188] | | [added: 4,183 | |]
| Long-term debt at April 30 | $ | [removed: 351 | |] 422 | | 417 | | 509 | | 508 | | 504 | | 503 | | 997 | | 997 | | [removed: 748] [added: 743] | | [added: 1,230 | |]
| Total debt at April 30 | $ | [removed: 576 | |] 1,177 | | 1,006 | | 999 | | 699 | | 759 | | 510 | | 1,002 | | 1,005 | | [removed: 1,188] [added: 1,183] | | [added: 1,501 | |]
| Cash flow from operations | $ | [removed: 343 | |] 355 | | 534 | | 491 | | 545 | | 527 | | 516 | | 537 | | 649 | | 608 | | [added: 524 | |]
| Dividend payout ratio | [removed: 40.0 | | % |] 36.8 | [added: |] % | 35.8 | % | 38.9 | % | 38.7 | % | 57.0 | % | 37.4 | % | 179.8 | % | 35.3 | % | 37.5 | % | [added: 25.0 | % |]
| 1. | Includes the consolidated results of [removed: Swift & Moore, Chambord,] [added: Chambord] and Casa Herradura since their acquisitions in [removed: February 2006,] May [removed: 2006,] [added: 2006] and January 2007, respectively. Includes the results of our Hopland-based wine brands, which were sold in April 2011 but retained in our portfolio as agency brands through December 2011. [added: Includes the results of Southern Comfort and Tuaca, both of which were sold on March 1, 2016.] |
| 2. | Weighted average shares, earnings per share, and cash dividends declared per common share have been adjusted for a [removed: 2-for-1 stock split in January 2004, a] 5-for-4 stock split in October [removed: 2008,] [added: 2008] and a 3-for-2 stock split in August 2012. |
| [removed: 3.] [added: 4.] | Cash dividends declared per common share include special cash dividends of $0.67 per share in fiscal 2011 and $4.00 per share in fiscal 2013. |
| [removed: 7.] [added: 5.] | We define dividend payout ratio as cash dividends divided by net income. |
| 3. | See “Item 7. Management’s Discussion and Analysis of Financial Condition and Results of Operation – Non-GAAP Financial Measures” for details on our use of “return on average invested capital,” including how we calculate this measure and why we think this information is useful to readers. |
| 6. | Results for fiscal 2016 include a gain of $485 million on the sale of Southern Comfort and Tuaca. See “Item 7. Management’s Discussion and Analysis of Financial Condition and Results of Operation – Executive Summary – Fiscal 2016 Financial Highlights” for additional information about the impact of that sale on our operating results for fiscal 2016. |
| Average stockholders’ equity | $ | 1,397 | | 1,700 | | 1,668 | | 1,793 | | 1,870 | | 1,904 | | 2,046 | | 1,879 | | 1,817 | | 2,040 | |
| Return on average stockholders’ equity | 22.9 | | % | 22.9 | % | 26.4 | % | 24.2 | % | 24.0 | % | 30.0 | % | 25.1 | % | 31.4 | % | 36.3 | % | 33.5 | % |
| Total debt to total capital | 26.9 | | % | 42.8 | % | 36.8 | % | 35.5 | % | 26.9 | % | 26.9 | % | 19.8 | % | 38.1 | % | 33.1 | % | 38.4 | % |
| 4. | We define return on average invested capital as the sum of net income and after-tax interest expense, divided by average invested capital. Average invested capital equals assets less liabilities, excluding interest-bearing debt and is calculated using the average of the most recent 13 month-end balances. After-tax interest expense equals interest expense multiplied by one minus our effective tax rate. |
| 5. | We define return on average stockholders’ equity as net income applicable to common stock divided by average stockholders’ equity. |
| 6. | We define total debt to total capital as total debt divided by the sum of total debt and stockholders’ equity. |
Item 8. Financial Statements and Supplementary Data
397 rewritten, 144 added, 83 removed, 576 unchanged
| Year Ended April 30, | [removed: 2013] [added: 2014] | | | | [removed: 2014] [added: 2015] | | | | [removed: 2015] [added: 2016] | | |
| Net sales | $ | [removed: 3,784] [added: 3,946] | | | $ | [removed: 3,946] [added: 4,096] | | | $ | [removed: 4,096] [added: 4,011] | |
| Excise taxes | [removed: 935] [added: 955] | | | | [removed: 955] [added: 962] | | | | [removed: 962] [added: 922] | | |
| Cost of sales | [removed: 894] [added: 913] | | | | [removed: 913] [added: 951] | | | | [removed: 951] [added: 945] | | |
| Gross profit | [removed: 1,955] [added: 2,078] | | | | [removed: 2,078] [added: 2,183] | | | | [removed: 2,183] [added: 2,144] | | |
| Advertising expenses | [removed: 408] [added: 436] | | | | [removed: 436] [added: 437] | | | | [removed: 437] [added: 417] | | |
| Selling, general, and administrative expenses | [removed: 650] [added: 686] | | | | [removed: 686] [added: 697] | | | | [removed: 697] [added: 688] | | |
| Other expense (income), net | [removed: (1] [added: (15] | | ) | | [removed: (15] [added: 22] | | [removed: )] | | [removed: 22] [added: (9] | | [added: )] |
| Operating income | [removed: 898] [added: 971] | | | | [removed: 971] [added: 1,027] | | | | [removed: 1,027] [added: 1,533] | | |
| Interest income | [removed: 3] [added: 2] | | | | 2 | | | | 2 | | |
| Interest expense | [removed: 36] [added: 26] | | | | [removed: 26] [added: 27] | | | | [removed: 27] [added: 46] | | |
| Income before income taxes | [removed: 865] [added: 947] | | | | [removed: 947] [added: 1,002] | | | | [removed: 1,002] [added: 1,489] | | |
| Income taxes | [removed: 274] [added: 288] | | | | [removed: 288] [added: 318] | | | | [removed: 318] [added: 422] | | |
| Net income | $ | [removed: 591] [added: 659] | | | $ | [removed: 659] [added: 684] | | | $ | [removed: 684] [added: 1,067] | |
| Basic | $ | [removed: 2.77] [added: 3.08] | | | $ | [removed: 3.08] [added: 3.23] | | | $ | [removed: 3.23] [added: 5.26] | |
| Diluted | $ | [removed: 2.75] [added: 3.06] | | | $ | [removed: 3.06] [added: 3.21] | | | $ | [removed: 3.21] [added: 5.22] | |
| Currency translation adjustments | [removed: 17] [added: (4] | | [added: )] | | [removed: (4] [added: (114] | | ) | | [removed: (114] [added: (23] | | ) |
| Cash flow hedge adjustments | [removed: 3] [added: (4] | | [added: )] | | [removed: (4] [added: 32] | | [removed: )] | | [removed: 32] [added: (17] | | [added: )] |
| Postretirement benefits adjustments | [removed: (1] [added: 31] | | [removed: )] | | [removed: 31] [added: (30] | | [added: )] | | [removed: (30] [added: (10] | | ) |
| Net other comprehensive income (loss) | [removed: 19] [added: 23] | | | | [removed: 23] [added: (112] | | [added: )] | | [removed: (112] [added: (50] | | ) |
| Comprehensive income | $ | [removed: 610] [added: 682] | | | $ | [removed: 682] [added: 572] | | | $ | [removed: 572] [added: 1,017] | |
| April 30, [added: 2015:] | [removed: 2014] | | | | [removed: 2015] | | | [added: | | | | | | | |]
| Cash and cash equivalents | $ | [removed: 437] [added: 370] | | | $ | [removed: 370] [added: 263] | |
| Accounts receivable, less allowance for doubtful accounts of [removed: $9 in 2014 and] $10 in 2015 [added: and $9 in 2016] | [removed: 569] [added: 583] | | | | [removed: 583] [added: 559] | | |
| Barreled whiskey | [removed: 504] [added: 571] | | | | [removed: 571] [added: 666] | | |
| Finished goods | [removed: 187] [added: 200] | | | | [removed: 200] [added: 187] | | |
| Work in process | [removed: 144] [added: 121] | | | | [removed: 121] [added: 116] | | |
| Raw materials and supplies | [removed: 47] [added: 61] | | | | [removed: 61] [added: 85] | | |
| Total inventories | [removed: 882] [added: 953] | | | | [removed: 953] [added: 1,054] | | |
| Current deferred tax assets | [removed: 33] [added: 16] | | | | [removed: 16] [added: —] | | |
| Other current assets | [removed: 256] [added: 332] | | | | [removed: 332] [added: 357] | | |
| Total current assets | [removed: 2,177] [added: 2,254] | | | | [removed: 2,254] [added: 2,233] | | |
| Property, plant, and equipment, net | [removed: 526] [added: 586] | | | | [removed: 586] [added: 629] | | |
| Goodwill | [removed: 620] [added: 607] | | | | [removed: 607] [added: 590] | | |
| Other intangible assets | [removed: 677] [added: 611] | | | | [removed: 611] [added: 595] | | |
| Deferred tax assets | 18 | | | | [removed: 18] [added: 17] | | |
| Other [added: current] assets | [removed: 85] [added: (43] | | [added: )] | | [removed: 117] [added: (30] | | [added: )] | [added: | (57 | | ) |]
| Accounts payable and accrued expenses | $ | [removed: 474] [added: 497] | | | $ | [removed: 497] [added: 501] | |
| Accrued income taxes | [removed: 71] [added: 12] | | | | [removed: 12] [added: 19] | | |
| Current deferred tax liabilities | [removed: 8] [added: 9] | | | | [removed: 9] [added: —] | | |
| Table of Contents | |
| | Page |
| [Reports of Management](#sC1653C9FE446B992488525E9A78F15C8) | [47](#sC1653C9FE446B992488525E9A78F15C8) |
| [Report of Independent Registered Public Accounting Firm](#s6F68EB38D128CE7487FA25E99B5A92B6) | [48](#s6F68EB38D128CE7487FA25E99B5A92B6) |
| [Consolidated Statements of Operations](#sF7B5BD1A63F6989ADB0225E98EF81C68) | [49](#sF7B5BD1A63F6989ADB0225E98EF81C68) |
| [Consolidated Statements of Comprehensive Income](#s472FCEE2113F9D0CD9CD25E98ED97E4F) | [50](#s472FCEE2113F9D0CD9CD25E98ED97E4F) |
| [Consolidated Balance Sheets](#s2B9E455AB3065A3A751B25E98EB0C4F8) | [51](#s2B9E455AB3065A3A751B25E98EB0C4F8) |
| [Consolidated Statements of Cash Flows](#sE587AB37A9BD37A1356925E98F042020) | [52](#sE587AB37A9BD37A1356925E98F042020) |
| [Consolidated Statements of Stockholders’ Equity](#s282042EC092E1C5C4FB725E98E9BFDC0) | [53](#s282042EC092E1C5C4FB725E98E9BFDC0) |
| [Notes to Consolidated Financial Statements](#s6BC650A7803FAE7CD61825E9A44EF946) | [54](#s6BC650A7803FAE7CD61825E9A44EF946) |
| [Quarterly Financial Information (Unaudited)](#s6AB30437E3950BEEF6BF25E9A75DFCAC) | [74](#s6AB30437E3950BEEF6BF25E9A75DFCAC) |
As discussed in Note 1 to the consolidated financial statements, the Company changed the manner in which it classifies deferred taxes in 2016.
| Gain on sale of business | — | | | | — | | | | (485 | | ) |
| Total assets | $ | 4,188 | | | $ | 4,183 | |
| Long-term debt | 743 | | | | 1,230 | | |
| Total liabilities | 2,283 | | | | 2,621 | | |
| Net income | $ | 659 | | | $ | 684 | | | $ | 1,067 | |
| Gain on sale of business | — | | | | — | | | | (485 | | ) |
| Changes in assets and liabilities, excluding the effects of sale of business: | | | | | | | | | | | |
| Proceeds from sale of business | — | | | | — | | | | 543 | | |
| Stock-based compensation expense | 13 | | | | 15 | | | | 15 | | |
| Excess tax benefits from stock-based awards | 10 | | | | 18 | | | | 15 | | |
| Net income | 659 | | | | 684 | | | | 1,067 | | |
| Acquisition of treasury stock | (49 | | ) | | (462 | | ) | | (1,107 | | ) |
Inventories are valued at the lower of cost or market value.
Approximately 59% of our consolidated inventories are valued using the last-in, first-out (LIFO) cost method, which we use for the majority of our U.S. inventories.
We translate the financial statements of those foreign entities into U.S. dollars, using the exchange rate in effect at the balance sheet date to translate assets and liabilities, and using the average exchange rate for the reporting period to translate translate income and expenses.
We record the resulting translation adjustments in other comprehensive income (loss).
However, the FASB has since deferred the effective date until our fiscal 2019, though permitting voluntary adoption as of the original effective date.
In April 2015, FASB issued new guidance for the presentation of debt issuance costs, which we adopted during the first quarter of fiscal 2016.
Under the new guidance, debt issuance costs are presented as a direct deduction from the debt liability rather than as an asset.
In adopting the new guidance, we retrospectively adjusted our balance sheet as of April 30, 2015.
As a result, the carrying amounts of other assets (noncurrent) and long-term debt have decreased by $5 million from the amounts previously reported as of that date.
In November 2015, the FASB issued new guidance that requires all deferred tax assets and deferred tax liabilities to be presented as noncurrent on our balance sheet.
We adopted this new guidance prospectively as of April 30, 2016.
Accordingly, prior period balances have not been adjusted.
In February 2016, the FASB issued new guidance on accounting for leases.
The new guidance will become effective for us beginning fiscal 2020, although voluntary adoption during an earlier period will be permitted.
We are currently evaluating the potential impact of the new guidance on our financial statements.
In March 2016, the FASB issued new guidance related to certain aspects of the accounting for stock-based compensation, including the income tax consequences.
| Total assets | $ | 4,103 | | | $ | 4,193 | |
| Long-term debt, less unamortized discount of $3 in 2014 and $2 in 2015 | 997 | | | | 748 | | |
| Total liabilities | 2,071 | | | | 2,288 | | |
| Noncurrent assets and liabilities | (27 | | ) | | (16 | | ) | | 19 | | |
| Stock split | 4 | | | | — | | | | — | | |
| Stock split | 6 | | | | — | | | | — | | |
| Balance at beginning of year | 3,031 | | | | 2,500 | | | | 2,894 | | |
| Stock split | (18 | | ) | | — | | | | — | | |
| Balance at end of year | (211 | | ) | | (188 | | ) | | (300 | | ) |
| Stock split | 8 | | | | — | | | | — | | |
| Stock split | 28,149 | | | | — | | | | — | | |
| Stock split | 42,951 | | | | — | | | | — | | |
We state inventories at the lower of cost or market, with approximately 57% of consolidated inventories being valued using the last-in, first-out (LIFO) method.
For those investments, we report cumulative translation effects as a component of accumulated other comprehensive income (loss), a component of stockholders’ equity.
We may use newly-issued shares to cover exercises or redemptions of awards, and then purchase an equal number of shares on the open market or otherwise as quickly as is reasonably practicable.
This practice minimizes long-term dilution to our stockholders.
However, in April 2015, the FASB proposed an amendment to the new guidance that would defer the effective date by one year, though permit voluntary adoption as of the original effective date.
| | $ | 256 | | | $ | 332 | |
| | 1,054 | | | | 1,140 | | |
| | $ | 526 | | | $ | 586 | |
| Self-insurance losses | 10 | | | | 10 | | |
| | 340 | | | | 374 | | |
| | $ | 474 | | | $ | 497 | |
| | $ | 167 | | | $ | 164 | |
| | 997 | | | | 998 | | |
| | $ | 997 | | | $ | 748 | |
On February 25, 2013, we redeemed, in full, our 5.00% notes due in fiscal 2014 by exercising a “make whole” call provision of the notes.
In connection with the redemption, we incurred costs of $9, which is reflected as interest expense in the accompanying consolidated statement of operations for fiscal 2013.
| April 30, 2014: | | | | | | | | | | | | | | | |
Inputs used in these standard valuation models include the applicable exchange rate, forward rates, and discount rates.
The standard valuation model for foreign currency options also uses implied volatility as an additional input.
The discount rates are based on historical U.S. Treasury rates, and the implied volatility specific to individual foreign currency options is based on quoted rates from financial institutions.
| April 30, 2014: | | | | | | | | | |
| Currency derivatives | Accrued expenses | | 1 | | | | — | | |
| Currency derivatives | Other current assets | | 42 | | | | (2 | | ) |
Because of these safeguards, we believe the risk of loss from counterparty default to be immaterial.
| April 30, 2014: | | | | | | | | | | | | | | | | | | | |
| 2021 – 2025 | 303 | | | | 18 | | |
| | | | | | | | | | | | | | | | | | | | | | |
| --- | --- | --- | --- | --- | --- | --- | --- | --- | --- | --- | --- | --- | --- | --- | --- | --- | --- | --- | --- | --- | --- |
An excerpt. Shown here: 40 of 397 rewritten, 40 of 144 added and 40 of 83 removed. The counts are complete. For every sentence, read Item 8. Financial Statements and Supplementary Data in the FY2016 filing and the FY2015 filing.
Item 9A. Controls and Procedures
3 rewritten, 0 added, 0 removed, 5 unchanged
Our management, with the participation of our Chief Executive Officer (CEO) and Chief Financial Officer (CFO) (our principal executive [removed: officer] and principal financial [removed: officer),] [added: officers),] has evaluated the effectiveness of our disclosure controls and procedures (as defined in Rule 13a-15(e) under the Securities Exchange Act of 1934 (the “Exchange Act”)) as of the end of fiscal [removed: 2015.][added: 2016.]
There has been no change in our internal control over financial reporting during the quarter ended April 30, [removed: 2015,] [added: 2016,] that has materially affected, or is reasonably likely to materially affect, our internal control over financial reporting.
[removed: The] [added: Management’s] report [removed: of management] on our internal control over financial reporting as of April 30, [removed: 2015,] [added: 2016,] and [removed: the report of] our independent registered public accounting [removed: firm] [added: firm’s report] on our internal control over financial reporting are set forth in “Item 8.
Item 10. Directors, Executive Officers, and Corporate Governance
1 rewritten, 0 added, 0 removed, 1 unchanged
For the other information required by this item, see the following sections of our definitive proxy statement for the Annual Meeting of Stockholders to be held July [removed: 23, 2015,] [added: 28, 2016,] which information is incorporated into this report by reference: (a) “Election of Directors” (for biographical information on directors and family relationships); (b) “Code of Conduct” (for information on our Code of Ethics); (c) “Section 16(a) Beneficial Ownership Reporting Compliance” (for information on compliance with Section 16 of the Exchange Act); (d) “Corporate Governance and Nominating Committee” (for information on the procedures by which security holders may recommend nominees to the Company’s Board of Directors); and (e) “Corporate Governance” (for information on our Audit Committee).
Item 11. Executive Compensation
1 rewritten, 0 added, 0 removed, 0 unchanged
For the information required by this item, refer to the following sections of our definitive proxy statement for the Annual Meeting of Stockholders to be held July [removed: 23, 2015,] [added: 28, 2016,] which information is incorporated into this report by reference: (a) “Compensation Discussion and Analysis”; (b) “Compensation Tables”; (c) “Director Compensation”; and (d) “Compensation Committee Interlocks and Insider Participation.”
Item 12. Security Ownership of Certain Beneficial Owners and Management and Related Stockholder Matters
2 rewritten, 0 added, 0 removed, 0 unchanged
For [removed: Equity Compensation Plan] [added: equity compensation plan] information, [removed: please see] [added: refer to] “Item 5.
Market for the Registrant’s Common Equity, Related Stockholder Matters and Issuer Purchases of Equity Securities.” For the other information required by this item, refer to the section entitled “Stock Ownership” of our definitive proxy statement for the Annual Meeting of Stockholders to be held July [removed: 23, 2015,] [added: 28, 2016,] which information is incorporated into this report by reference.
Item 13. Certain Relationships and Related Transactions, and Director Independence
1 rewritten, 0 added, 0 removed, 0 unchanged
For the information required by this item, refer to the following sections of our definitive proxy statement for the Annual Meeting of Stockholders to be held July [removed: 23, 2015,] [added: 28, 2016,] which information is incorporated into this report by reference: (a) “Certain Relationships and Related Transactions”; and (b) “Our Independent Directors.”
Item 14. Principal Accounting Fees and Services
1 rewritten, 0 added, 0 removed, 1 unchanged
For the information required by this item, refer to the following sections of our definitive proxy statement for the Annual Meeting of Stockholders to be held July [removed: 23, 2015,] [added: 28, 2016,] which information is incorporated into this report by reference: (a) “Fees Paid to Independent Registered Public Accounting Firm”; and (b) “Audit Committee Pre-Approval Policies and Procedures.”
Item 15. Exhibits and Financial Statement Schedules
29 rewritten, 16 added, 4 removed, 165 unchanged
| | [Consolidated Statements of [removed: Operations](#s1796298470D955D9C099D3056E52257B)] [added: Operations](#sF7B5BD1A63F6989ADB0225E98EF81C68)] | [removed: [45](#s1796298470D955D9C099D3056E52257B)] [added: [49](#sF7B5BD1A63F6989ADB0225E98EF81C68)] |
| | [Consolidated Statements of Comprehensive [removed: Income](#s5361627FB0BA2E7C15F2D3056E6415F4)] [added: Income](#s472FCEE2113F9D0CD9CD25E98ED97E4F)] | [removed: [46](#s5361627FB0BA2E7C15F2D3056E6415F4)] [added: [50](#s472FCEE2113F9D0CD9CD25E98ED97E4F)] |
| | [Consolidated Balance [removed: Sheets](#s3769D7EBAECF04D1F6BED3056E69A5A6)] [added: Sheets](#s2B9E455AB3065A3A751B25E98EB0C4F8)] | [removed: [47](#s3769D7EBAECF04D1F6BED3056E69A5A6)] [added: [51](#s2B9E455AB3065A3A751B25E98EB0C4F8)] |
| | [Consolidated Statements of Cash [removed: Flows](#sFB1DD3741C31B020D590D3056E829790)] [added: Flows](#sE587AB37A9BD37A1356925E98F042020)] | [removed: [48](#sFB1DD3741C31B020D590D3056E829790)] [added: [52](#sE587AB37A9BD37A1356925E98F042020)] |
| | [Consolidated Statements of Stockholders’ [removed: Equity](#s7D33D301B36FF347B26BD3056E9D0AFE)] [added: Equity](#s282042EC092E1C5C4FB725E98E9BFDC0)] | [removed: [49](#s7D33D301B36FF347B26BD3056E9D0AFE)] [added: [53](#s282042EC092E1C5C4FB725E98E9BFDC0)] |
| | [Notes to Consolidated Financial [removed: Statements](#sD566213C82DD110EDE0DD3059DF6E1F9)] [added: Statements](#s6BC650A7803FAE7CD61825E9A44EF946)] | [removed: [50](#sD566213C82DD110EDE0DD3059DF6E1F9)] [added: [54](#s6BC650A7803FAE7CD61825E9A44EF946)] |
| | [Report of Independent Registered Public Accounting [removed: Firm](#s2760176F398DE66D42D2D305A158C638)] [added: Firm](#s6F68EB38D128CE7487FA25E99B5A92B6)] | [removed: [71](#s2760176F398DE66D42D2D305A158C638)] [added: [48](#s6F68EB38D128CE7487FA25E99B5A92B6)] |
| | [Schedule II – Valuation and Qualifying [removed: Accounts](#s21389F8244EB8B261FD0D3057081B59C)] [added: Accounts](#s5DBC36A0306FA07DA3F625E98F8BE2D4)] | [removed: [79](#s21389F8244EB8B261FD0D3057081B59C)] [added: [82](#s5DBC36A0306FA07DA3F625E98F8BE2D4)] |
| 12 | [added: Statement re Computation of] Ratio of Earnings to Fixed Charges. |
| 101 | The following materials from Brown-Forman Corporation’s Annual Report on Form 10-K for the fiscal year ended April 30, [removed: 2015,] [added: 2016,] formatted in XBRL (eXtensible Business Reporting Language): (a) Consolidated Statements of Operations, (b) Consolidated Statements of Comprehensive Income, (c) Consolidated Balance Sheets, (d) Consolidated Statements of Cash Flows, (e) Consolidated Statements of Stockholders’ Equity, and (f) Notes to Consolidated Financial Statements. |
| [removed: 4.3] [added: 4.4] | Form of [removed: 2.5%] [added: 1.00%] Note due [removed: 2016,] [added: 2018,] incorporated into this report by reference to Exhibit 4.4 of Brown-Forman Corporation’s Form 8-K filed on December [removed: 16, 2010] [added: 12, 2012] (File No. 002-26821). |
| [removed: 4.4] [added: 4.7] | Officer’s Certificate dated December [removed: 16, 2010,] [added: 12, 2012,] pursuant to Sections [removed: 1.02,] [added: 1.01,] 2.02, and 3.01 of the Indenture dated as of April 2, 2007, as supplemented by the First Supplemental Indenture dated as of December 13, 2010, between Brown-Forman Corporation and U.S. Bank National Association, as Trustee, setting forth the terms of the [removed: 2.5%] [added: 1.00%] Notes due [removed: 2016,] [added: 2018, the 2.25% Notes due 2023, and the 3.75% Notes due 2043,] incorporated into this report by reference to Exhibit 4.3 of Brown-Forman Corporation’s Form 8-K filed on December [removed: 16, 2010] [added: 12, 2012] (File No. 002-26821). |
| 4.5 | Form of [removed: 1.00%] [added: 2.25%] Note due [removed: 2018,] [added: 2023,] incorporated into this report by reference to Exhibit [removed: 4.4] [added: 4.5] of Brown-Forman Corporation’s Form 8-K filed on December 12, 2012 (File No. 002-26821). |
| 4.6 | Form of [removed: 2.25%] [added: 3.75%] Note due [removed: 2023,] [added: 2043,] incorporated into this report by reference to Exhibit [removed: 4.5] [added: 4.6] of Brown-Forman Corporation’s Form 8-K filed on December 12, 2012 (File No. 002-26821). |
| [removed: 4.7] [added: 4.9] | Form of [removed: 3.75% Note] [added: 4.500% Notes] due [removed: 2043,] [added: 2045,] incorporated into this report by reference to Exhibit [removed: 4.6] [added: 4.5] of Brown-Forman Corporation’s Form 8-K filed on [removed: December 12, 2012] [added: June 29, 2015] (File No. 002-26821). |
| 4.8 | Officer’s Certificate dated [removed: December 12, 2012,] [added: June 29, 2015,] pursuant to Sections [removed: 1.01,] [added: 1.02,] 2.02, [removed: and] 3.01 [added: and 3.03] of the Indenture dated as of April 2, 2007, as supplemented by the First Supplemental Indenture dated as of December 13, [removed: 2010,] [added: 2010 and the Second Supplemental Indenture dated as of June 24, 2015,] between Brown-Forman Corporation and U.S. Bank National Association, as Trustee, setting forth the terms of the [removed: 1.00% Notes due 2018, the 2.25% Notes due 2023, and the 3.75%] [added: 4.500%] Notes due [removed: 2043,] [added: 2045,] incorporated into this report by reference to Exhibit 4.3 of Brown-Forman Corporation’s Form [removed: 8-K] [added: S-3ASR Registration Statement] filed on [removed: December 12, 2012] [added: June 24, 2015] (File No. [removed: 002-26821).] [added: 333-205183).] |
| [removed: 10.14] [added: 10.15] | Brown-Forman Corporation Amended and Restated Non-Employee Director Deferred Stock Unit Program, incorporated into this report by reference to Exhibit 10.2 of Brown-Forman Corporation’s Form 8-K filed on July 26, 2013 (File No. 002-26821).* |
| [removed: 10.15] [added: 10.16] | Brown-Forman Corporation 2013 Omnibus Compensation Plan, incorporated into this report by reference to Exhibit 10.1 of Brown-Forman Corporation’s Form 8-K filed on July 26, 2013 (File No. 002-26821).* |
| [removed: 10.16] [added: 10.17] | Form of Employee Stock-Settled Stock Appreciation Right Award Agreement, incorporated into this report by reference to Exhibit 10.3 of Brown-Forman Corporation’s Form 8-K filed on July 26, 2013 (File No. 002-26821).* |
| [removed: 10.17] [added: 10.18] | Form of Restricted Stock Unit Award Agreement, incorporated into this report by reference to Exhibit 10.4 of Brown-Forman Corporation’s Form 8-K filed on July 26, 2013 (File No. 002-26821).* |
| [removed: 10.18] [added: 10.19] | Form of Restricted Stock Award Agreement, incorporated into this report by reference to Exhibit 10.5 of Brown-Forman Corporation’s Form 8-K filed on July 26, 2013 (File No. 002-26821).* |
| [removed: 10.19] [added: 10.20] | Paul C. Varga July 25, 2013 Special Restricted Stock Award Agreement, incorporated into this report by reference to Exhibit 10.1 of Brown-Forman Corporation’s Form 8-K filed on July 30, 2014 (File No. 002-26821).* |
| [removed: 10.20] [added: 4.3] | [removed: Letter Agreement] [added: Second Supplemental Indenture dated as of June 24, 2015,] between Brown-Forman Corporation and [removed: Donald C. Berg dated May 14, 2014,] [added: U.S. Bank National Association, as Trustee,] incorporated into this report by reference to Exhibit [removed: 10.1] [added: 4.4] of Brown-Forman Corporation’s Form 8-K filed on [removed: May 14, 2014] [added: June 29, 2015] (File No. [removed: 002-26821).*] [added: 002-26821).] |
Date: June [removed: 17, 2015][added: 15, 2016]
Pursuant to the requirements of the Securities Exchange Act of 1934, this report has been signed below by the following persons on behalf of the registrant and in the capacities on June [removed: 17, 2015,] [added: 15, 2016,] as indicated:
For the Years Ended April 30, [removed: 2013,] 2014, [added: 2015,] and [removed: 2015][added: 2016]
| Allowance for Doubtful Accounts | $ | 9 | | | [removed: 2] [added: $] | [added: —] | | | $ | — | | | [removed: 2] [added: $] | [added: —] | | [removed: (1)] | $ | 9 | |
| Allowance for Doubtful Accounts | $ | 9 | | | $ | [removed: —] [added: 2] | | | $ | — | | | [removed: —] [added: $] | [added: 1] | | (1) | $ | [removed: 9] [added: 10] | |
| Allowance for Doubtful Accounts | $ | [removed: 9] [added: 10] | | | [removed: 2] [added: $] | [added: 1] | | | [removed: —] [added: $] | [added: —] | | | $ | [removed: 1] [added: 2] | | (1) | $ | [removed: 10] [added: 9] | |
| 10.14 | 364-Day Credit Agreement, dated as of May 6, 2016, among Brown-Forman Corporation, certain lenders party thereto, Barclays Capital, as Syndication Agent, Bank of America, N.A. and Citibank, N.A. as Co-Documentation Agents, U.S. Bank National Association, as Administrative Agent, and U.S. Bank National Association, Barclays Capital, Merrill Lynch, Pierce, Fenner & Smith Incorporated and Citigroup Global Markets, Inc., as Joint Lead Arrangers and Joint Bookrunners, incorporated into this report by reference to Exhibit 10.1 of Brown-Forman Corporation’s Form 8-K filed on May 6, 2016 (File No. 002-26821). |
| /s/ Campbell P. Brown | | |
| By: | Campbell P. Brown | |
| /s/ Marshall B. Farrer | | |
| By: | Marshall B. Farrer | |
| /s/ Laura L. Frazier | | |
| By: | Laura L. Frazier | |
| | Director | |
| | Director | |
| | | |
| --- | --- | --- |
| | | |
| | | |
| --- | --- | --- |
| | | |
| 2016 | | | | | | | | | | | | | | | | | | | |
| 14 | Code of Ethics for Senior Financial Officers, incorporated into this report by reference to Exhibit 14 of Brown-Forman Corporation’s Form 10-K filed on July 2, 2004 (File No. 002-26821). |
| /s/ Dace Brown Stubbs | | |
| By: | Dace Brown Stubbs | |
| 2013 | | | | | | | | | | | | | | | | | | | |