 filings.tools
Item 2. MANAGEMENT'S DISCUSSION AND ANALYSIS OF FINANCIAL CONDITION AND RESULTS OF OPERATIONS
127K characters. Original on sec.gov · Markdown
Item 2. MANAGEMENT'S DISCUSSION AND ANALYSIS OF FINANCIAL CONDITION AND RESULTS OF OPERATIONS
The following discussion should be read in conjunction with our unaudited condensed consolidated financial statements (condensed consolidated financial statements) and the accompanying notes beginning on page 5 of this quarterly report on Form 10-Q and our audited consolidated financial statements and the accompanying notes included in our Annual Report on Form 10-K for the year ended December 31, 2021 (2021 Form 10-K).
Executive Summary
Introduction
Biogen is a global biopharmaceutical company focused on discovering, developing and delivering worldwide innovative therapies for people living with serious neurological and neurodegenerative diseases as well as related therapeutic adjacencies. We have a leading portfolio of medicines to treat multiple sclerosis (MS), have introduced the first approved treatment for spinal muscular atrophy (SMA) and developed the first and only approved treatment to address a defining pathology of Alzheimer's disease. We also commercialize biosimilars of advanced biologics and focus on advancing our pipeline in neuroscience and specialized immunology. Lastly, we are focused on accelerating our efforts in digital health to support our commercial and pipeline programs while also creating opportunities for potential digital therapeutics. We support our drug discovery and development efforts through the commitment of significant resources to discovery, research and development programs and business development opportunities.
Our marketed products include TECFIDERA, VUMERITY, AVONEX, PLEGRIDY, TYSABRI and FAMPYRA for the treatment of MS; SPINRAZA for the treatment of SMA; ADUHELM for the treatment of Alzheimer's disease; and FUMADERM for the treatment of severe plaque psoriasis. We have certain business and financial rights with respect to RITUXAN for the treatment of non-Hodgkin's lymphoma, chronic lymphocytic leukemia (CLL) and other conditions; RITUXAN HYCELA for the treatment of non-Hodgkin's lymphoma and CLL; GAZYVA for the treatment of CLL and follicular lymphoma; OCREVUS for the treatment of primary progressive MS (PPMS) and relapsing MS (RMS); and other potential anti-CD20 therapies, including mosunetuzumab, pursuant to our collaboration arrangements with Genentech, Inc. (Genentech), a wholly-owned member of the Roche Group. For additional information on our collaboration arrangements with Genentech, please read Note 18,
Collaborative and Other Relationships, to our consolidated financial statements included in our 2021 Form 10-K.
Our innovative drug development and commercialization activities are complemented by our biosimilar business that expands access to medicines and reduces the cost burden for healthcare systems. Through our collaboration with Samsung Bioepis Co., Ltd. (Samsung Bioepis) we market and sell BENEPALI, an etanercept biosimilar referencing ENBREL, IMRALDI, an adalimumab biosimilar referencing HUMIRA, and FLIXABI, an infliximab biosimilar referencing REMICADE, in certain countries in Europe, as well as BYOOVIZ, a ranibizumab biosimilar referencing LUCENTIS. For additional information on our collaboration arrangements with Samsung Bioepis, please read Note 17, Collaborative and Other Relationships, to our condensed consolidated financial statements included in this report.
We seek to ensure an uninterrupted supply of medicines to patients around the world. To that end, we continually review our manufacturing capacity, capabilities, processes and facilities. In order to support our future growth and drug development pipeline, we are expanding our large molecule production capacity by building a large-scale biologics manufacturing facility in Solothurn, Switzerland. In the second quarter of 2021 a portion of the facility received a Good Manufacturing Practice (GMP) multi-product license from the Swiss Agency for Therapeutic Products (SWISSMEDIC). In April 2022 the United States (U.S.) Food and Drug Administration (FDA) approved the Prior Approval Supplement for the Solothurn facility for ADUHELM. We estimate the second manufacturing suite will be operational during the second half of 2023. We believe that the Solothurn facility will support our anticipated near-term needs for the manufacturing of biologic assets. If we are unable to fully utilize our manufacturing facilities, due to lower than forecasted demand for our products, we will incur excess capacity charges which will have a negative effect on our financial condition and results of operations.
Our revenue depends upon continued sales of our products as well as the financial rights we have in our anti-CD20 therapeutic programs, and, unless we develop, acquire rights to and/or commercialize new products and technologies, we will be substantially dependent on sales from our products and our financial rights in our anti-CD20 therapeutic programs for many years.
In the longer term, our revenue growth will depend upon the successful clinical development, regulatory approval and launch of new commercial products as well as additional indications for our existing products, our ability to obtain and maintain patents and other rights related to our marketed
products, assets originating from our research and development efforts and/or successful execution of external business development opportunities.
Business Environment
The biopharmaceutical industry and the markets in which we operate are intensely competitive. Many of our competitors are working to develop or have commercialized products similar to those we market or are developing and have considerable experience in undertaking clinical trials and in obtaining regulatory approval to market pharmaceutical products. In addition, the commercialization of certain of our own approved products, products of our collaborators and pipeline product candidates may negatively impact future sales of our existing products.
Our products and revenue streams continue to face increasing competition in many markets from generic versions, prodrugs and biosimilars of existing products as well as products approved under abbreviated regulatory pathways. Such products are likely to be sold at substantially lower prices than branded products. Accordingly, the introduction of such products as well as other lower-priced competing products may significantly reduce both the price that we are able to charge for our products and the volume of products we sell, which will negatively impact our revenue. In addition, in some markets, when a generic or biosimilar version of one of our products is commercialized, it may be automatically substituted for our product and significantly reduce our revenue in a short period of time.
Sales of our products depend, to a significant extent, on the availability and extent of adequate coverage, pricing and reimbursement from government health administration authorities, private health insurers and other organizations. When a new pharmaceutical product is approved, the availability of government and private reimbursement for that product may be uncertain, as is the pricing and amount for which that product will be reimbursed.
Drug prices are under significant scrutiny in the markets in which our products are prescribed. We expect drug pricing and other health care costs to continue to be subject to intense political and societal pressures on a global basis.
Our failure to obtain or maintain adequate coverage, pricing or reimbursement for our products could have an adverse effect on our business, reputation, revenue and results of operations, could curtail or eliminate our ability to adequately fund research and development programs for the discovery and commercialization of new products and/or could cause a decline or volatility in our stock price.
In addition to the impact of competition, pricing actions and other measures being taken worldwide
designed to reduce healthcare costs and limit the overall level of government expenditures, our sales and operations could also be affected by other risks of doing business internationally, including the impact of public health epidemics, such as the COVID-19 pandemic, on employees, the global economy and the delivery of healthcare treatments, geopolitical events, foreign currency exchange fluctuations, changes in intellectual property legal protections and changes in trade regulations and procedures.
For a detailed discussion on our business environment, please read Item 1. Business, in our 2021 Form 10-K. For additional information on our competition and pricing risks that could negatively impact our product sales, please read Item 1A. Risk Factors included in this report.
ADUHELM (aducanumab)
U.S.
In June 2021 the FDA granted accelerated approval of ADUHELM, which we are collaborating on with Eisai Co., Ltd. (Eisai), based on reduction in amyloid beta plaques observed in patients treated with ADUHELM. As part of the accelerated approval, we are required to conduct a confirmatory trial to verify the clinical benefit of ADUHELM in patients with Alzheimer’s disease. The FDA may withdraw approval if, among other things, the confirmatory trial fails to verify clinical benefit of ADUHELM, ADUHELM's benefit-risk is no longer positive or we fail to comply with the conditions of the accelerated approval.
The U.S. ADUHELM product label states that treatment with ADUHELM should be initiated in patients with mild cognitive impairment or mild dementia stage of disease, the population which was studied in clinical trials.
In January 2022 the Centers for Medicare and Medicaid Services (CMS) released a proposed National Coverage Determination (NCD) decision memorandum, stating the proposed NCD would cover FDA approved monoclonal antibodies that target amyloid for the treatment of Alzheimer's disease for people with Medicare only if they are enrolled in qualifying clinical trials.
In April 2022 CMS released the final NCD for the class of anti-amyloid treatments in Alzheimer’s disease, including ADUHELM. The final NCD confirmed coverage with evidence development, in which patients with Medicare can only access treatment if they are part of an approved clinical trial. We expect that this decision will reduce future demand for ADUHELM to a minimal level. During the first quarter of 2022 we recorded approximately $275.0 million of gross charges associated with inventory and purchase commitments in excess of forecasted demand related to ADUHELM, as well as approximately $45.0 million of gross idle capacity charges, which were recognized in cost of sales within our condensed consolidated
statements of income for the six months ended June 30, 2022. We have recognized approximately $160.0 million related to Eisai's 45.0% share of these charges in collaboration profit (loss) sharing within our condensed consolidated statements of income for the six months ended June 30, 2022.
Additionally, as a result of the final NCD we have substantially eliminated our commercial infrastructure supporting ADUHELM, retaining minimal resources to manage patient access programs, including a continued free drug program for patients currently on treatment in the U.S.
We expect to continue funding certain regulatory and research and development activities for ADUHELM, including the continuation of the EMBARK re-dosing study and the initiation of the Phase 4 post-marketing requirement study, ENVISION. Additional actions regarding ADUHELM may be informed by upcoming data readouts expected for this class of antibodies, as well as further engagement with the FDA and CMS.
In March 2022 we amended our ADUHELM Collaboration Agreement with Eisai. Effective March 2022 we have sole decision making and commercialization rights worldwide on ADUHELM and beginning January 1, 2023, Eisai will receive a tiered royalty based on net sales of ADUHELM, rather than sharing global profits and losses. Eisai's share of development, commercialization and manufacturing expense is limited to $335.0 million for the period from January 1, 2022 to December 31, 2022. As of June 30, 2022, Eisai's portion of these expenses was approximately $275.0 million. Once this limit is achieved, we will be responsible for all ADUHELM related development costs. After the tiered royalty model commences on January 1, 2023, Eisai will not participate in ADUHELM’s economics beyond these royalties.
Rest of World
In October 2020 the European Medicines Agency (EMA) accepted for review the Marketing Authorization Application (MAA) for aducanumab and in December 2020 the Ministry of Health, Labor and Welfare accepted for review the Japanese New Drug Application (NDA) for aducanumab.
In December 2021 the Committee for Medicinal Products for Human Use (CHMP) of the EMA adopted a negative opinion on the MAA for aducanumab in Europe. We sought re-examination of the opinion by the CHMP. In April 2022 we announced our decision to withdraw our MAA for aducanumab in Europe.
If we do not receive regulatory approval or are unable to successfully commercialize aducanumab in other jurisdictions, our financial condition, business and operations may be adversely affected.
TECFIDERA
In 2020 U.S. federal courts in West Virginia and Delaware entered judgments in favor of the defendants in patent infringement proceedings relating to TECFIDERA Orange-Book listed patents. We appealed both decisions. In late 2021 the U.S. Court of Appeals for the Federal Circuit (Federal Circuit) affirmed the judgment of the West Virginia federal court. The appeals in the actions in Delaware are stayed pending any final action by the United States Supreme Court with respect to the judgment in the West Virginia Action.
Multiple TECFIDERA generic entrants are now in the U.S. market and have deeply discounted prices compared to TECFIDERA. The generic competition for TECFIDERA has significantly reduced our TECFIDERA revenue and is expected to continue to have a substantial and increasing negative impact on our U.S. TECFIDERA revenue in the future.
In May 2021 the European General Court annulled the EMA's decision not to validate applications for approval of TECFIDERA generics on the basis that the EMA conducted the wrong assessment when determining TECFIDERA's entitlement to regulatory data and marketing protection. Our Company, the EMA and the European Commission (EC) have each appealed the General Court’s decision as wrongly decided and the appeal is pending.
In November 2021 the CHMP of the EMA issued an ad hoc opinion referencing the General Court’s decision which concluded that "the totality of the available data cannot establish that [monoethyl fumarate] exerts a clinically relevant therapeutic contribution within FUMADERM," and in May 2022 the EC approved applications to market generic TECFIDERA. Generic TECFIDERA is now for sale in the E.U. and we expect generic sales to have an adverse impact on our TECFIDERA sales in the E.U. and our results of operations. In June 2022 the European Patent Office granted Biogen a patent that relates to TECFIDERA and expires in 2028. We intend to enforce this new patent.
For additional information, please read Note 19, Litigation, to our condensed consolidated financial statements included in this report and the discussion under Results of Operations - Product Revenue - Multiple Sclerosis (MS) - Fumarate below.
Business Update Regarding COVID-19 and Other Disruptions
COVID-19
The COVID-19 pandemic continues to present a substantial public health and economic challenge around the world. The length of time and full extent to which the COVID-19 pandemic directly or indirectly
impacts our business, results of operations and financial condition, including sales, expense, reserves and allowances, the supply chain, manufacturing, clinical trials, research and development costs and employee-related costs, depends on future developments that are highly uncertain, subject to change and are difficult to predict, including as a result of new information that may emerge concerning COVID-19 and the actions taken to contain or treat COVID-19 as well as the economic impact on local, regional, national and international customers and markets.
We are monitoring the demand for our products, including the duration and degree to which we may see delays in starting new patients on a product due to hospitals diverting the resources that are necessary to administer certain of our products to care for COVID-19 patients, including products, such as TYSABRI and SPINRAZA, that are administered in a physician's office or hospital setting. We may also see reduced demand for immunosuppressant therapies during the COVID-19 pandemic.
While we are currently continuing the clinical trials we have underway in sites across the globe, COVID-19 precautions have impacted the timeline for some of our clinical trials and these precautions may, directly or indirectly, have a further impact on timing in the future.
Conflict in Ukraine
The ongoing geopolitical tensions related to Russia's invasion of Ukraine have resulted in global business disruptions and economic volatility, including sanctions and other restrictions levied on the government and businesses in Russia. Although we do not have affiliates or employees, in either Russia or Ukraine, we do provide various therapies to patients in Russia through a distributor and are currently involved in clinical trials with sites in Ukraine and Russia. The timing and costs of these trials may be impacted as a result of the conflict. For example, the development of orelabrutinib, an oral small molecule Bruton’s tyrosine kinase inhibitor for the potential treatment of MS, that we are developing with InnoCare has been delayed and will require the establishment of new clinical sites in other geographies.
The impact of the conflict on our operations and financial performance remains uncertain and will depend on future developments, including the severity and duration of the conflict, its impact on regional and global economic conditions and whether the conflict spreads or has effects on countries outside Ukraine and Russia. Revenue generated from sales in these regions represented less than 2.0% of total product revenue for the three and six months ended June 30, 2022 and the year ended December 31, 2021.
We will continue to monitor the ongoing conflict between Russia and Ukraine and assess any potential impacts on our business, supply chain, partners or customers, as well as any factors that could have an adverse effect on our results of operations.
Factors such as the COVID-19 pandemic, adverse weather events, geopolitical events, labor or raw material shortages and other supply chain disruptions could result in product shortages or other difficulties and delays or increased costs in manufacturing our products.
For additional information on the various risks posed by the COVID-19 pandemic and the conflict in Ukraine, please read Item 1A. Risk Factors included in this report.
Financial Highlights
Diluted earnings per share attributable to Biogen Inc. was $7.24 for the three months ended June 30, 2022, representing a increase of 142.1% compared to $2.99 in the same period in 2021.
As described below under Results of Operations, our net income and diluted earnings per share attributable to Biogen Inc. for the three months ended June 30, 2022, compared to the three months ended June 30, 2021, reflects the following:
Revenue
-
Total revenue was $2,589.1 million for the second quarter of 2022, representing a $185.9 million, or 6.7%, decrease compared to $2,775.0 million in the same period in 2021.
-
Product revenue, net totaled $2,054.9 million for the second quarter of 2022, representing a $181.1 million, or 8.1%, decrease compared to $2,236.0 million in the same period in 2021. This decrease was primarily due to a $102.6 million, or 6.7%, decrease in MS product revenue and a $68.6 million, or 13.7%, decrease in SPINRAZA product revenue.
◦The decrease in MS product revenue was primarily due to a decrease in U.S. TECFIDERA demand as a result of multiple TECFIDERA generic entrants in the U.S. market and a decrease in Interferon demand due to competition.
◦The decrease in SPINRAZA revenue was primarily due to a decrease in demand as a result of increased competition in certain established markets, particularly Germany, and the timing of shipments, as well as unfavorable pricing and the
unfavorable impact of foreign currency exchange.
-
Revenue from anti-CD20 therapeutic programs totaled $436.3 million for the second quarter of 2022, representing a $3.7 million, or 0.8%, decrease compared to $440.0 million in the same period in 2021. This decrease was primarily due to a $39.2 million, or 24.6%, decrease in RITUXAN revenue, partially offset by a $34.8 million, or 13.6%, increase in royalty revenue on sales of OCREVUS. Sales of RITUXAN have been adversely affected by the onset of biosimilars competition.
-
Other revenue totaled $97.9 million for the second quarter of 2022, representing a $1.1 million, or 1.1%, decrease compared to $99.0 million in the same period in 2021.
Expense
- Total cost and expense was $1,319.6 million for the second quarter of 2022, representing a $873.3 million, or 39.8%, decrease compared to $2,192.9 million in the same period in 2021.
**◦**The decrease in amortization and impairment of acquired intangible assets is primarily due to impairment charges recorded during the three months ended June 30, 2021 totaling $541.6 million.
◦Other (income) expense, net for the second quarter of 2022 reflected a pre-tax gain of approximately $1.5 billion related to the sale of our 49.9% equity interest in Samsung Bioepis, partially offset by a pre-tax charge of $900.0 million related to an agreement in principle to resolve a qui tam litigation relating to conduct prior to 2015.
As described below under Financial Condition, Liquidity and Capital Resources:
-
We generated $898.3 million of net cash flow from operations for the six months ended June 30, 2022.
-
Cash, cash equivalents and marketable securities totaled approximately $5,900.8 million as of June 30, 2022.
-
We repurchased and retired approximately 2.4 million shares of our common stock at a cost of approximately $500.0 million during the second quarter of 2022 under a program authorized by our Board of Directors in October 2020 to repurchase up to $5.0 billion
of our common stock (2020 Share Repurchase Program). Approximately $2.3 billion remained available under our 2020 Share Repurchase Program as of June 30, 2022.
Collaborative and Other Relationships
For additional information on our collaborative and other relationships discussed below, please read Note 17, Collaborative and Other Relationships, and Note 18, Investments in Variable Interest Entities, to our condensed consolidated financial statements included in this report.
Samsung Bioepis - Biogen's Joint Venture with Samsung BioLogics
In April 2022 we completed the sale of our 49.9% equity interest in Samsung Bioepis to Samsung BioLogics. Under the terms of this transaction, we received approximately $1.0 billion in cash at closing and expect to receive approximately $1.3 billion in cash to be deferred over two payments of approximately $812.5 million due at the first anniversary and approximately $437.5 million due at the second anniversary of the closing of the transaction.
We are also eligible to receive up to an additional $50.0 million upon the achievement of certain commercial milestones. Our policy for contingent payments of this nature is to recognize them in the period that they become realizable, which is generally the same period in which they are earned.
For additional information on the sale of our equity interest in Samsung Bioepis, please read Note 2, Dispositions, to our condensed consolidated financial statements included in this report.
Eisai Collaboration Agreements
ADUHELM Collaboration Agreement
In March 2022 we amended our ADUHELM Collaboration Agreement with Eisai. Effective March 2022 we have sole decision making and commercialization rights worldwide on ADUHELM and beginning January 1, 2023, Eisai will receive a tiered royalty based on net sales of ADUHELM, rather than sharing global profits and losses. Eisai's share of development, commercialization and manufacturing expense is limited to $335.0 million for the period from January 1, 2022 to December 31, 2022. As of June 30, 2022, Eisai's portion of these expenses was approximately $275.0 million. Once this limit is achieved, we will be responsible for all ADUHELM related development costs. After the tiered royalty model commences on January 1, 2023, Eisai will not participate in ADUHELM’s economics beyond these royalties.
Lecanemab Collaboration
In March 2022 we extended our supply agreement related to lecanemab from 5 years to 10 years, and we will manufacture the lecanemab drug substance.
For additional information on our collaboration arrangements with Eisai, please read Note 17, Collaborative and Other Relationships, to our condensed consolidated financial statements included in this report.
Other Key Developments
2022 Cost Saving Initiatives
In December 2021 and May 2022 we announced our plans to implement a series of cost-reduction measures during 2022. These savings are expected to be achieved through a number of initiatives, including reductions to our workforce, primarily within our global Alzheimer's infrastructure, the consolidation of certain real estate locations and operating efficiency gains across our selling, general and administrative and research and development functions.
Under these initiatives, we expect to incur restructuring charges ranging from approximately $130.0 million to $150.0 million. These amounts are primarily related to severance and are expected to be substantially incurred and paid by the end of 2022.
For additional information on our 2022 cost saving initiatives, please read Note 3, Restructuring, Business Transformation and Other Cost Saving Initiatives, to our condensed consolidated financial statements included in this report.
BIIB125 (zuranolone)
In May 2022 we and our collaboration partner Sage Therapeutics, Inc. (Sage) initiated a rolling submission of a New Drug Application (NDA) to the FDA for BIIB125 (zuranolone) for the potential treatment of major depressive disorder (MDD). We have submitted the nonclinical module of the NDA to the FDA and plan to submit the remaining components for the MDD filing in the second half of 2022.
In June 2022 we and Sage announced that the Phase 3 SKYLARK Study of zuranolone, which is being evaluated in women with postpartum depression, met its primary and all key secondary endpoints. Subsequently, we decided to submit a single NDA seeking approval of zuranolone for the treatment of both MDD and PPD. We expect to complete the submission of this single NDA in the second half of 2022, and to seek priority review of the filing.
For additional information on our collaboration arrangement with Sage, please read Note 17, Collaborative and Other Relationships, to our condensed consolidated financial statements included in this report.
Lecanemab
In May 2022 we and our collaboration partner Eisai announced the completed submission of a Biologics License Application (BLA) to the FDA for the accelerated approval of lecanemab, an anti-amyloid antibody candidate for the potential treatment of Alzheimer's disease. In July 2022 the FDA accepted the BLA and granted Priority Review with a Prescription Drug User Fee Act (PDUFA) action date of January 6, 2023.
For additional information on our collaboration arrangements with Eisai, please read Note 17, Collaborative and Other Relationships, to our condensed consolidated financial statements included in this report.
Mosunetuzumab
In June 2022 our collaboration partner Genentech announced that mosunetuzumab, a late-stage bispecific antibody in development for B-cell non-Hodgkin's lymphoma and other therapeutic areas, was approved in the E.U.
In July Genentech announced that the FDA accepted the company's BLA and granted Priority Review for mosunetuzumab, with a PDUFA action date of December 29, 2022.
For additional information on our collaboration arrangements with Genentech, please read Note 18, Collaborative and Other Relationships, to our consolidated financial statements included in our 2021 Form 10-K.
RESULTS OF OPERATIONS
Revenue
Revenue is summarized as follows:
| For the Three Months Ended June 30, | ||||||||||||||||||||||||||||||||||||||
| (In millions, except percentages) | 2022 | 2021 | $ Change | % Change | ||||||||||||||||||||||||||||||||||
| Product revenue, net: | ||||||||||||||||||||||||||||||||||||||
| United States | $ | 894.1 | 34.5 | % | $ | 977.2 | 35.2 | % | $ | (83.1) | (8.5) | % | ||||||||||||||||||||||||||
| Rest of world | 1,160.8 | 44.8 | 1,258.8 | 45.4 | (98.0) | (7.8) | ||||||||||||||||||||||||||||||||
| Total product revenue, net | 2,054.9 | 79.3 | 2,236.0 | 80.6 | (181.1) | (8.1) | ||||||||||||||||||||||||||||||||
| Revenue from anti-CD20 therapeutic programs | 436.3 | 16.9 | 440.0 | 15.9 | (3.7) | (0.8) | ||||||||||||||||||||||||||||||||
| Other revenue | 97.9 | 3.8 | 99.0 | 3.5 | (1.1) | (1.1) | ||||||||||||||||||||||||||||||||
| Total revenue | $ | 2,589.1 | 100.0 | % | $ | 2,775.0 | 100.0 | % | $ | (185.9) | (6.7) | % | ||||||||||||||||||||||||||
| For the Six Months Ended June 30, | ||||||||||||||||||||||||||||||||||||||
| (In millions, except percentages) | 2022 | 2021 | $ Change | % Change | ||||||||||||||||||||||||||||||||||
| Product revenue, net: | ||||||||||||||||||||||||||||||||||||||
| United States | $ | 1,769.3 | 34.6 | % | $ | 1,877.0 | 34.3 | % | $ | (107.7) | (5.7) | % | ||||||||||||||||||||||||||
| Rest of world | 2,351.9 | 45.9 | 2,570.7 | 47.0 | (218.8) | (8.5) | ||||||||||||||||||||||||||||||||
| Total product revenue, net | 4,121.2 | 80.5 | 4,447.7 | 81.3 | (326.5) | (7.3) | ||||||||||||||||||||||||||||||||
| Revenue from anti-CD20 therapeutic programs | 835.7 | 16.3 | 829.0 | 15.2 | 6.7 | 0.8 | ||||||||||||||||||||||||||||||||
| Other revenue | 164.0 | 3.2 | 192.3 | 3.5 | (28.3) | (14.7) | ||||||||||||||||||||||||||||||||
| Total revenue | $ | 5,120.9 | 100.0 | % | $ | 5,469.0 | 100.0 | % | $ | (348.1) | (6.4) | % |
Product Revenue
Product revenue is summarized as follows:
| For the Three Months Ended June 30, | ||||||||||||||||||||||||||||||||||||||
| (In millions, except percentages) | 2022 | 2021 | $ Change | % Change | ||||||||||||||||||||||||||||||||||
| Multiple Sclerosis (MS): | ||||||||||||||||||||||||||||||||||||||
| TECFIDERA | $ | 397.9 | 19.4 | % | $ | 487.6 | 21.8 | % | $ | (89.7) | (18.4) | % | ||||||||||||||||||||||||||
| VUMERITY(1) | 136.8 | 6.7 | 90.9 | 4.1 | 45.9 | 50.5 | ||||||||||||||||||||||||||||||||
| Total Fumarate | 534.7 | 26.1 | 578.5 | 25.9 | (43.8) | (7.6) | ||||||||||||||||||||||||||||||||
| AVONEX | 258.7 | 12.6 | 310.9 | 13.9 | (52.2) | (16.8) | ||||||||||||||||||||||||||||||||
| PLEGRIDY | 91.5 | 4.5 | 89.5 | 4.0 | 2.0 | 2.2 | ||||||||||||||||||||||||||||||||
| Total Interferon | 350.2 | 17.0 | 400.4 | 17.9 | (50.2) | (12.5) | ||||||||||||||||||||||||||||||||
| TYSABRI | 516.2 | 25.1 | 524.2 | 23.4 | (8.0) | (1.5) | ||||||||||||||||||||||||||||||||
| FAMPYRA | 25.5 | 1.2 | 26.1 | 1.2 | (0.6) | (2.3) | ||||||||||||||||||||||||||||||||
| Subtotal: MS | 1,426.6 | 69.4 | 1,529.2 | 68.4 | (102.6) | (6.7) | ||||||||||||||||||||||||||||||||
| Spinal Muscular Atrophy: | ||||||||||||||||||||||||||||||||||||||
| SPINRAZA | 431.1 | 21.0 | 499.7 | 22.3 | (68.6) | (13.7) | ||||||||||||||||||||||||||||||||
| Biosimilars: | ||||||||||||||||||||||||||||||||||||||
| BENEPALI | 115.8 | 5.6 | 121.5 | 5.4 | (5.7) | (4.7) | ||||||||||||||||||||||||||||||||
| IMRALDI | 57.6 | 2.8 | 55.6 | 2.5 | 2.0 | 3.6 | ||||||||||||||||||||||||||||||||
| FLIXABI | 20.5 | 1.0 | 25.3 | 1.2 | (4.8) | (19.0) | ||||||||||||||||||||||||||||||||
| BYOOVIZ(2) | 0.5 | — | — | — | 0.5 | nm | ||||||||||||||||||||||||||||||||
| Subtotal: Biosimilars | 194.4 | 9.4 | 202.4 | 9.1 | (8.0) | (4.0) | ||||||||||||||||||||||||||||||||
| Other: | ||||||||||||||||||||||||||||||||||||||
| FUMADERM | 2.7 | 0.1 | 3.1 | 0.1 | (0.4) | (12.9) | ||||||||||||||||||||||||||||||||
| ADUHELM | 0.1 | — | 1.6 | 0.1 | (1.5) | (93.8) | ||||||||||||||||||||||||||||||||
| Total product revenue, net | $ | 2,054.9 | 100.0 | % | $ | 2,236.0 | 100.0 | % | $ | (181.1) | (8.1) | % |
(1) VUMERITY became commercially available in the E.U. during the fourth quarter of 2021.
(2) BYOOVIZ launched in the U.S. in June 2022 and will be commercially available in July 2022.
nm Not meaningful
| For the Six Months Ended June 30, | ||||||||||||||||||||||||||||||||||||||
| (In millions, except percentages) | 2022 | 2021 | $ Change | % Change | ||||||||||||||||||||||||||||||||||
| Multiple Sclerosis (MS): | ||||||||||||||||||||||||||||||||||||||
| TECFIDERA | $ | 807.8 | 19.6 | % | $ | 966.8 | 21.7 | % | $ | (159.0) | (16.4) | % | ||||||||||||||||||||||||||
| VUMERITY(1) | 264.8 | 6.4 | 164.6 | 3.7 | 100.2 | 60.9 | ||||||||||||||||||||||||||||||||
| Total Fumarate | 1,072.6 | 26.0 | 1,131.4 | 25.4 | (58.8) | (5.2) | ||||||||||||||||||||||||||||||||
| AVONEX | 488.3 | 11.8 | 622.0 | 14.0 | (133.7) | (21.5) | ||||||||||||||||||||||||||||||||
| PLEGRIDY | 171.5 | 4.2 | 178.9 | 4.0 | (7.4) | (4.1) | ||||||||||||||||||||||||||||||||
| Total Interferon | 659.8 | 16.0 | 800.9 | 18.0 | (141.1) | (17.6) | ||||||||||||||||||||||||||||||||
| TYSABRI | 1,037.0 | 25.2 | 1,027.5 | 23.1 | 9.5 | 0.9 | ||||||||||||||||||||||||||||||||
| FAMPYRA | 51.7 | 1.3 | 52.7 | 1.2 | (1.0) | (1.9) | ||||||||||||||||||||||||||||||||
| Subtotal: MS | 2,821.1 | 68.5 | 3,012.5 | 67.7 | (191.4) | (6.4) | ||||||||||||||||||||||||||||||||
| Spinal Muscular Atrophy: | ||||||||||||||||||||||||||||||||||||||
| SPINRAZA | 903.6 | 21.9 | 1,020.2 | 23.0 | (116.6) | (11.4) | ||||||||||||||||||||||||||||||||
| Biosimilars: | ||||||||||||||||||||||||||||||||||||||
| BENEPALI | 230.5 | 5.6 | 243.2 | 5.5 | (12.7) | (5.2) | ||||||||||||||||||||||||||||||||
| IMRALDI | 114.7 | 2.8 | 113.5 | 2.6 | 1.2 | 1.1 | ||||||||||||||||||||||||||||||||
| FLIXABI | 43.0 | 1.0 | 50.8 | 1.1 | (7.8) | (15.4) | ||||||||||||||||||||||||||||||||
| BYOOVIZ(2) | 0.5 | — | — | — | 0.5 | nm | ||||||||||||||||||||||||||||||||
| Subtotal: Biosimilars | 388.7 | 9.4 | 407.5 | 9.2 | (18.8) | (4.6) | ||||||||||||||||||||||||||||||||
| Other: | ||||||||||||||||||||||||||||||||||||||
| FUMADERM | 4.9 | 0.1 | 5.9 | 0.1 | (1.0) | (16.9) | ||||||||||||||||||||||||||||||||
| ADUHELM | 2.9 | 0.1 | 1.6 | — | 1.3 | 81.3 | ||||||||||||||||||||||||||||||||
| Total product revenue, net | $ | 4,121.2 | 100.0 | % | $ | 4,447.7 | 100.0 | % | $ | (326.5) | (7.3) | % |
(1) VUMERITY became commercially available in the E.U. during the fourth quarter of 2021.
(2) BYOOVIZ launched in the U.S. in June 2022 and will be commercially available in July 2022.
nm Not meaningful
Multiple Sclerosis (MS)
Fumarate

Fumarate revenue includes sales from TECFIDERA and VUMERITY. During the fourth quarter of 2021 VUMERITY was approved for the treatment of relapsing-remitting MS (RRMS) in the E.U., Switzerland and the United Kingdom (U.K.).
For the three and six months ended June 30, 2022, compared to the same periods in 2021, the decreases of 6.9% and 2.4%, respectively, in U.S. Fumarate revenue were primarily due to decreases in TECFIDERA demand as a result of multiple TECFIDERA generic entrants in the U.S. market, partially offset by favorable pricing for TECFIDERA driven by discounts and allowances and increases in VUMERITY sales volumes.
For the three and six months ended June 30, 2022, compared to the same periods in 2021, the decreases of 8.2% and 7.4%, respectively, in rest of world Fumarate revenue were primarily due to TECFIDERA pricing reductions in certain European countries, the unfavorable impact of foreign currency
exchange and decreases in TECFIDERA demand as multiple TECFIDERA generic entrants entered into markets such as Germany and Canada.
In 2020 U.S. federal courts in West Virginia and Delaware entered judgments in favor of the defendants in patent infringement proceedings relating to TECFIDERA Orange-Book listed patents. We appealed both decisions. In late 2021 the Federal Circuit affirmed the judgment of the West Virginia federal court. The appeals in the actions in Delaware are stayed pending any final action by the United States Supreme Court with respect to the judgment in the West Virginia Action.
Multiple TECFIDERA generic entrants are now in the U.S. market and have deeply discounted prices compared to TECFIDERA. The generic competition for TECFIDERA has significantly reduced our TECFIDERA revenue and is expected to continue to have a substantial and increasing negative impact on our U.S. TECFIDERA revenue in the future.
In May 2021 the European General Court annulled the EMA's decision not to validate applications for approval of TECFIDERA generics on the basis that the EMA conducted the wrong assessment when determining TECFIDERA's entitlement to regulatory data and marketing protection. Our Company, the EMA and the EC have each appealed the General Court’s decision as wrongly decided and the appeal is pending.
In November 2021 the CHMP of the EMA issued an ad hoc opinion referencing the General Court’s decision which concluded that "the totality of the available data cannot establish that [monoethyl fumarate] exerts a clinically relevant therapeutic contribution within FUMADERM," and in May 2022 the EC approved applications to market generic TECFIDERA. Generic TECFIDERA is now for sale in the E.U. and we expect generic sales to have an adverse impact on our TECFIDERA sales in the E.U. and our results of operations. In June 2022 the European Patent Office granted Biogen a patent that relates to TECFIDERA and expires in 2028. We intend to enforce this new patent.
For additional information, please read Note 19, Litigation, to our condensed consolidated financial statements included in this report.
We expect that TECFIDERA revenue will continue to decline in 2022, compared to 2021, as a result of generic competition.
We expect an increase in VUMERITY sales volumes in 2022, compared to 2021, mostly due to demand growth in the U.S. and 14 other markets. We are currently working with our contract manufacturing suppliers to address potential supply constraints and have therefore delayed any additional country launches.
Interferon

For the three and six months ended June 30, 2022, compared to the same periods in 2021, the decreases of 17.9% and 21.2%, respectively, in U.S. Interferon revenue were primarily due to decreases in Interferon sales volumes of 15.5% and 15.1%, respectively, and decreases in pricing of 2.4% and 6.1%, respectively. The net declines in sales volumes reflect the continued decline of the Interferon market as patients transition to other higher efficacy and oral MS therapies.
For the three months ended June 30, 2022, compared to the same period in 2021, the decrease of 2.8% in rest of world Interferon revenue was primarily due to the unfavorable impact of foreign currency exchange.
For the six months ended June 30, 2022, compared to the same period in 2021, the decrease of 11.7% was primarily due to decreases in Interferon sales volumes resulting from the continued decline of the Interferon market, unfavorable pricing and the unfavorable impact of foreign currency exchange.
We expect that Interferon revenue will continue to decline in both the U.S. and rest of world markets in 2022, compared to 2021, as a result of increasing competition from other MS products, including biosimilars, and further pricing reductions in certain European markets.
TYSABRI

For the three months ended June 30, 2022, compared to the same period in 2021, the decrease of 2.6% in U.S. TYSABRI revenue was primarily due to a decrease in sales volumes, partially offset by an increase in pricing.
For the six months ended June 30, 2022, compared to the same period in 2021, U.S. TYSABRI revenue remained flat.
For the three and six months ended June 30, 2022, compared to the same periods in 2021, rest of world TYSABRI revenue remained flat.
We anticipate TYSABRI revenue to be relatively flat on a global basis in 2022, compared to 2021, despite increasing competition from additional treatments for MS. We expect to continue to face price reductions in certain European markets. We are also aware of a potential biosimilar entrant of TYSABRI that may enter the market as early as 2023.
Spinal Muscular Atrophy
SPINRAZA

For the three months ended June 30, 2022, compared to the same period in 2021, the decrease of 6.4% in U.S. SPINRAZA revenue was primarily due to a decrease in sales volumes resulting from increased competition and unfavorable pricing driven by higher rebates.
For the six months ended June 30, 2022, compared to the same period in 2021, the increase of 1.7% in U.S. SPINRAZA revenue was primarily due to an increase in sales volumes resulting from favorable channel dynamics in the first quarter of 2022.
For the three and six months ended June 30, 2022, compared to the same periods in 2021, the decreases of 16.9% for both periods in rest of world SPINRAZA revenue were primarily due to decreases in pricing of 7.3% and 6.8%, respectively, and decreases in sales volumes of 4.7% and 4.9%, respectively, resulting from increased competition in certain established markets, particularly Germany, and the timing of shipments, as well as the unfavorable impact of foreign currency exchange. The decreases were partially offset by sales volume growth in certain Asian markets.
We face competition from a gene therapy product and an oral product. In 2022 we expect that SPINRAZA revenue will be subject to increased competition likely resulting in continued patient discontinuations and a lower rate of new patient starts combined with the impact of loading dose dynamics as patients transition to dosing once every four months and lower prices in certain rest of world countries.
For additional information on our collaboration arrangements with Ionis Pharmaceuticals, Inc. (Ionis), please read Note 18, Collaborative and Other
Relationships, to our consolidated financial statements included in our 2021 Form 10-K.
Alzheimer's Disease
ADUHELM
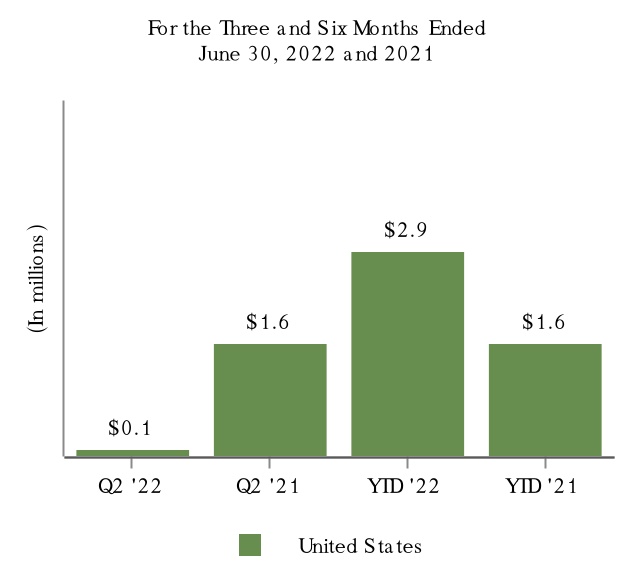
In June 2021 the FDA granted accelerated approval of ADUHELM, which became commercially available in the U.S. during the second quarter of 2021.
In April 2022 the CMS released the final NCD for the class of anti-amyloid treatments in Alzheimer’s disease, including ADUHELM. The final NCD confirmed coverage with evidence development, in which patients with Medicare can only access treatment if they are part of an approved clinical trial. We expect that this decision will reduce future demand for ADUHELM to a minimal level.
Additionally, as a result of the final NCD we have substantially eliminated our commercial infrastructure supporting ADUHELM, retaining minimal resources to manage patient access programs, including a continued free drug program for patients currently on treatment in the U.S.
For additional information on our collaboration arrangements with Eisai, please read Note 17, Collaborative and Other Relationships, to our condensed consolidated financial statements included in this report.
Biosimilars
BENEPALI, IMRALDI, FLIXABI and BYOOVIZ

During the third quarter of 2021 BYOOVIZ, a biosimilar referencing LUCENTIS, was approved in the U.S., the E.U. and the U.K. BYOOVIZ launched in the U.S. in June 2022 and will be commercially available in July 2022 through major distributors in the U.S.
For the three and six months ended June 30, 2022, compared to the same periods in 2021, the decreases of 4.0% and 4.6%, respectively, in biosimilar revenue were primarily due to decreases in pricing in certain markets and the unfavorable impact of foreign currency exchange, partially offset by increases in sales volumes.
We anticipate a slight decline in revenue from our biosimilars business in 2022, despite the launch of BYOOVIZ in the U.S., and an anticipated modest
increase in sales volumes as we continue to face price reductions in certain markets.
For additional information on our collaboration arrangements with Samsung Bioepis, please read Note 17, Collaborative and Other Relationships, to our condensed consolidated financial statements included in this report.
Revenue from Anti-CD20 Therapeutic Programs
Genentech (Roche Group)
Our share of RITUXAN, including RITUXAN HYCELA, and GAZYVA collaboration operating profits in the U.S. and other revenue from anti-CD20 therapeutic programs are summarized in the table below. For purposes of this discussion, we refer to RITUXAN and RITUXAN HYCELA collectively as RITUXAN.

Biogen’s Share of Pre-tax Profits in the U.S. for RITUXAN and GAZYVA
The following tables provide a summary of amounts comprising our share of pre-tax profits in the U.S. for RITUXAN and GAZYVA:
| For the Three Months Ended June 30, | ||||||||||||||
| (In millions) | 2022 | 2021 | ||||||||||||
| Product revenue, net | $ | 443.1 | $ | 554.1 | ||||||||||
| Cost and expense | 70.1 | 77.9 | ||||||||||||
| Pre-tax profits in the U.S. | 373.0 | 476.2 | ||||||||||||
| Biogen's share of pre-tax profits | $ | 139.9 | $ | 178.8 | ||||||||||
| For the Six Months Ended June 30, | ||||||||||||||
| (In millions) | 2022 | 2021 | ||||||||||||
| Product revenue, net | $ | 898.1 | $ | 1,105.5 | ||||||||||
| Cost and expense | 129.9 | 152.1 | ||||||||||||
| Pre-tax profits in the U.S. | 768.2 | 953.4 | ||||||||||||
| Biogen's share of pre-tax profits | $ | 283.1 | $ | 352.9 |
For the three and six months ended June 30, 2022, compared to the same periods in 2021, the decreases in U.S. product revenue, net were primarily due to decreases in sales volumes of RITUXAN in the U.S. of 30.9% and 30.6%, respectively, primarily due to the onset of competition from multiple biosimilar products and decreases in GAZYVA sales volumes of 4.0% and 3.8%, respectively.
For the three and six months ended June 30, 2022, compared to the same periods in 2021, the decreases in collaboration costs and expense were primarily due to lower cost of sales, selling and marketing expense and distribution costs related to RITUXAN.
We are aware of several other anti-CD20 molecules, including biosimilar products, that have been approved and are competing with RITUXAN and GAZYVA in the oncology and other markets. Biosimilar products referencing RITUXAN have launched in the U.S. and are being offered at lower prices. This
competition has had a significant adverse impact on the pre-tax profits of our collaboration arrangements with Genentech, as the sales of RITUXAN have decreased substantially compared to prior periods. We expect that biosimilar competition will continue to increase as these products capture additional market share and that this will have a significant adverse impact on our co-promotion profits in the U.S. in future years.
Other Revenue from Anti-CD20 Therapeutic Programs
Other revenue from anti-CD20 therapeutic programs consists of royalty revenue on sales of OCREVUS and our share of pre-tax co-promotion profits from RITUXAN in Canada.
For the three and six months ended June 30, 2022, compared to the same periods in 2021, the increases in other revenue from anti-CD20 therapeutic programs were primarily due to sales growth of OCREVUS.
Royalty revenue recognized on sales of OCREVUS for the three and six months ended June 30, 2022, totaled $291.8 million and $544.1 million, respectively, compared to $257.0 million and $466.3 million, respectively, in the prior year comparative periods.
OCREVUS royalty revenue is based on our estimates from third party and market research data of OCREVUS sales occurring during the corresponding period. Differences between actual and estimated royalty revenue will be adjusted for in the period in which they become known, which is generally expected to be the following quarter.
For additional information on our collaboration arrangements with Genentech, including information regarding the pre-tax profit-sharing formula and its impact on future revenue from anti-CD20 therapeutic programs, please read Note 18, Collaborative and Other Relationships, to our consolidated financial statements included in our 2021 Form 10-K.
Other Revenue
Other revenue is summarized as follows:
| For the Three Months Ended June 30, | ||||||||||||||||||||||||||||||||||||||
| (In millions, except percentages) | 2022 | 2021 | $ Change | % Change | ||||||||||||||||||||||||||||||||||
| Revenue from collaborative and other relationships | $ | 6.4 | 6.5 | % | $ | 5.5 | 5.6 | % | $ | 0.9 | 16.4 | % | ||||||||||||||||||||||||||
| Other royalty and corporate revenue | 91.5 | 93.5 | 93.5 | 94.4 | (2.0) | (2.1) | ||||||||||||||||||||||||||||||||
| Total other revenue | $ | 97.9 | 100.0 | % | $ | 99.0 | 100.0 | % | $ | (1.1) | (1.1) | % | ||||||||||||||||||||||||||
| For the Six Months Ended June 30, | ||||||||||||||||||||||||||||||||||||||
| (In millions, except percentages) | 2022 | 2021 | $ Change | % Change | ||||||||||||||||||||||||||||||||||
| Revenue from collaborative and other relationships | $ | 14.4 | 8.8 | % | $ | 9.4 | 4.9 | % | $ | 5.0 | 53.2 | % | ||||||||||||||||||||||||||
| Other royalty and corporate revenue | 149.6 | 91.2 | 182.9 | 95.1 | (33.3) | (18.2) | ||||||||||||||||||||||||||||||||
| Total other revenue | $ | 164.0 | 100.0 | % | $ | 192.3 | 100.0 | % | $ | (28.3) | (14.7) | % |
Revenue from Collaborative and Other Relationships
Revenue from collaborative and other relationships primarily includes royalty revenue on biosimilar products from Samsung Bioepis.
For additional information on our collaborative arrangements with Samsung Bioepis, please read Note 17, Collaborative and Other Relationships, to our condensed consolidated financial statements included in this report.
Other Royalty and Corporate Revenue

We receive royalties from net sales on products related to patents that we have out-licensed and we record other corporate revenue primarily from amounts earned under contract manufacturing agreements.
For the three and six months ended June 30, 2022, compared to the same periods in 2021, the
decreases in other corporate revenue were primarily due to lower contract manufacturing revenue related to the timing of batch releases.
Reserves for Discounts and Allowances
Revenue from product sales is recorded net of reserves established for applicable discounts and allowances, including those associated with the implementation of pricing actions in certain international markets where we operate.
These reserves are based on estimates of the amounts earned or to be claimed on the related sales and are classified as reductions of accounts receivable (if the amount is payable to our customer) or a liability (if the amount is payable to a party other than our customer). These estimates reflect our historical experience, current contractual and statutory requirements, specific known market events and trends, industry data and forecasted customer buying and payment patterns. Actual amounts may ultimately differ from our estimates. If actual results vary, we adjust these estimates, which could have an effect on earnings in the period of adjustment.
Reserves for discounts, contractual adjustments and returns that reduced gross product revenue are summarized as follows:
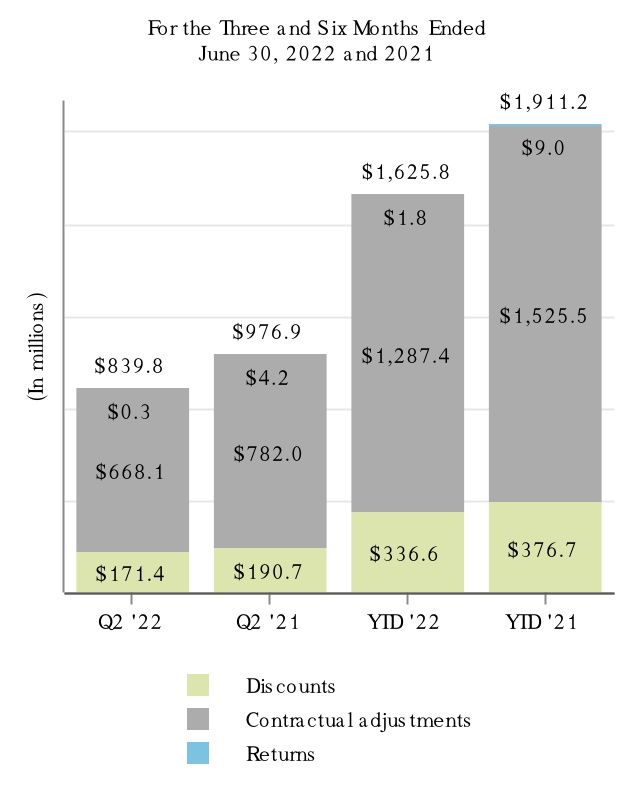
For the three and six months ended June 30, 2022, reserves for discounts and allowances as a percentage of gross product revenue were 29.2% and 28.1%, respectively, compared to 29.2% and 28.6%, respectively, in the prior year comparative periods.
Discounts
Discounts include trade term discounts and wholesaler incentives.
For the three and six months ended June 30, 2022, compared to the same periods in 2021, the
decreases in discounts were primarily driven by decreases in gross sales.
Contractual Adjustments
Contractual adjustments primarily relate to Medicaid and managed care rebates in the U.S., pharmacy rebates, co-payment (copay) assistance, Veterans Administration, 340B discounts, specialty pharmacy program fees and other government rebates or applicable allowances.
For the three and six months ended June 30, 2022, compared to the same periods in 2021, the decreases in contractual adjustments were primarily driven by lower TECFIDERA sales in the U.S., resulting in lower pharmacy rebates, Medicaid rebates and managed care rebates, as well as lower Medicaid rebates in the U.S. driven by a favorable change in estimates for VUMERITY.
Returns
Product return reserves are established for returns made by wholesalers. In accordance with contractual terms, wholesalers are permitted to return product for reasons such as damaged or expired product. The majority of wholesaler returns are due to product expiration. Provisions for product returns are recognized in the period the related revenue is recognized, resulting in a reduction to product sales.
For the three and six months ended June 30, 2022, compared to the same periods in 2021, return reserves were relatively consistent.
For additional information on our revenue reserves, please read Note 4, Revenue, to our condensed consolidated financial statements included in this report.
Cost and Expense
A summary of total cost and expense is as follows:
| For the Three Months Ended June 30, | ||||||||||||||||||||||||||
| (In millions, except percentages) | 2022 | 2021 | % Change | $ Change | ||||||||||||||||||||||
| Cost of sales, excluding amortization and impairment of acquired intangible assets | $ | 484.0 | $ | 459.7 | 5.3 | % | $ | 24.3 | ||||||||||||||||||
| Research and development | 528.6 | 585.1 | (9.7) | (56.5) | ||||||||||||||||||||||
| Selling, general and administrative | 572.6 | 637.3 | (10.2) | (64.7) | ||||||||||||||||||||||
| Amortization and impairment of acquired intangible assets | 67.5 | 604.1 | (88.8) | (536.6) | ||||||||||||||||||||||
| Collaboration profit (loss) sharing | 29.4 | (15.2) | (293.4) | 44.6 | ||||||||||||||||||||||
| (Gain) loss on fair value remeasurement of contingent consideration | (4.5) | 0.3 | nm | (4.8) | ||||||||||||||||||||||
| Acquired in-process research and development | — | 18.0 | nm | (18.0) | ||||||||||||||||||||||
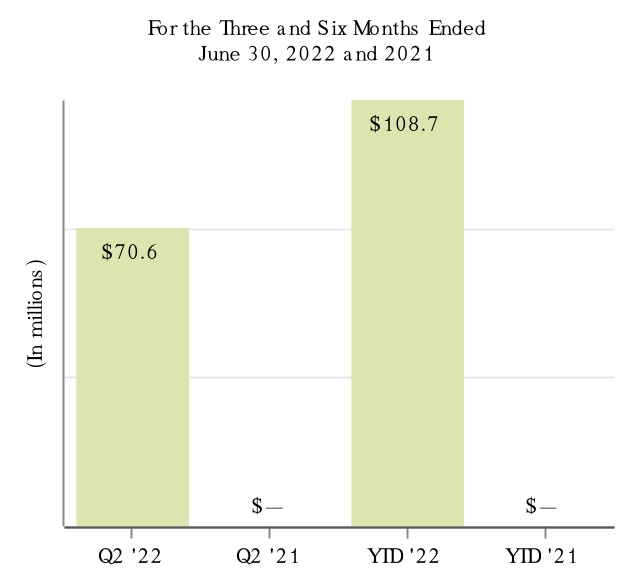
| Restructuring charges | 70.6 | — | nm | 70.6 | ||||||||||||||||||||||
| Other (income) expense, net | (428.6) | (96.4) | 344.6 | (332.2) | ||||||||||||||||||||||
| Total cost and expense | $ | 1,319.6 | $ | 2,192.9 | (39.8) | % | $ | (873.3) | ||||||||||||||||||
| For the Six Months Ended June 30, | ||||||||||||||||||||||||||
| (In millions, except percentages) | 2022 | 2021 | % Change | $ Change | ||||||||||||||||||||||
| Cost of sales, excluding amortization and impairment of acquired intangible assets | $ | 1,237.9 | $ | 937.8 | 32.0 | % | $ | 300.1 | ||||||||||||||||||
| Research and development | 1,080.3 | 1,099.3 | (1.7) | (19.0) | ||||||||||||||||||||||
| Selling, general and administrative | 1,207.5 | 1,232.3 | (2.0) | (24.8) | ||||||||||||||||||||||
| Amortization and impairment of acquired intangible assets | 134.4 | 702.2 | (80.9) | (567.8) | ||||||||||||||||||||||
| Collaboration profit (loss) sharing | (87.9) | 53.3 | (264.9) | (141.2) | ||||||||||||||||||||||
| (Gain) loss on fair value remeasurement of contingent consideration | (11.6) | (33.5) | (65.4) | 21.9 | ||||||||||||||||||||||
| Acquired in-process research and development | — | 18.0 | nm | (18.0) | ||||||||||||||||||||||
| Restructuring charges | 108.7 | — | nm | 108.7 | ||||||||||||||||||||||
| Other (income) expense, net | (165.3) | 410.5 | (140.3) | (575.8) | ||||||||||||||||||||||
| Total cost and expense | $ | 3,504.0 | $ | 4,419.9 | (20.7) | % | $ | (915.9) |
nm Not meaningful
Cost of Sales, Excluding Amortization and Impairment of Acquired Intangible Assets

Product Cost of Sales
For the three months ended June 30, 2022, compared to the same period in 2021, the increase in product cost of sales was primarily due to product mix and higher cost of sales associated with contract manufacturing agreements.
For the six months ended June 30, 2022, compared to the same period in 2021, the increase in product cost of sales was primarily due to the write-off of ADUHELM inventory during the first quarter of 2022. During the first quarter of 2022 we recorded approximately $275.0 million of gross charges associated with inventory and purchase commitments in excess of forecasted demand related to ADUHELM, as well as approximately $45.0 million of gross idle capacity charges. We have recognized approximately $160.0 million related to Eisai's 45.0% share of these charges in collaboration profit (loss) sharing within our condensed consolidated statements of income for the six months ended June 30, 2022.
During 2022 we recorded approximately $72.0 million of gross idle capacity charges. We have recognized approximately $32.0 million related to Eisai's 45.0% share of these charges in collaboration profit (loss) sharing within our condensed consolidated statements of income for the six months ended June 30, 2022.
For the three and six months ended June 30, 2022, compared to the same periods in 2021, the decreases in royalty cost of sales were primarily due to lower royalties payable on lower sales of SPINRAZA, TYSABRI and AVONEX, partially offset by higher royalties payable on higher sales of VUMERITY.
Research and Development

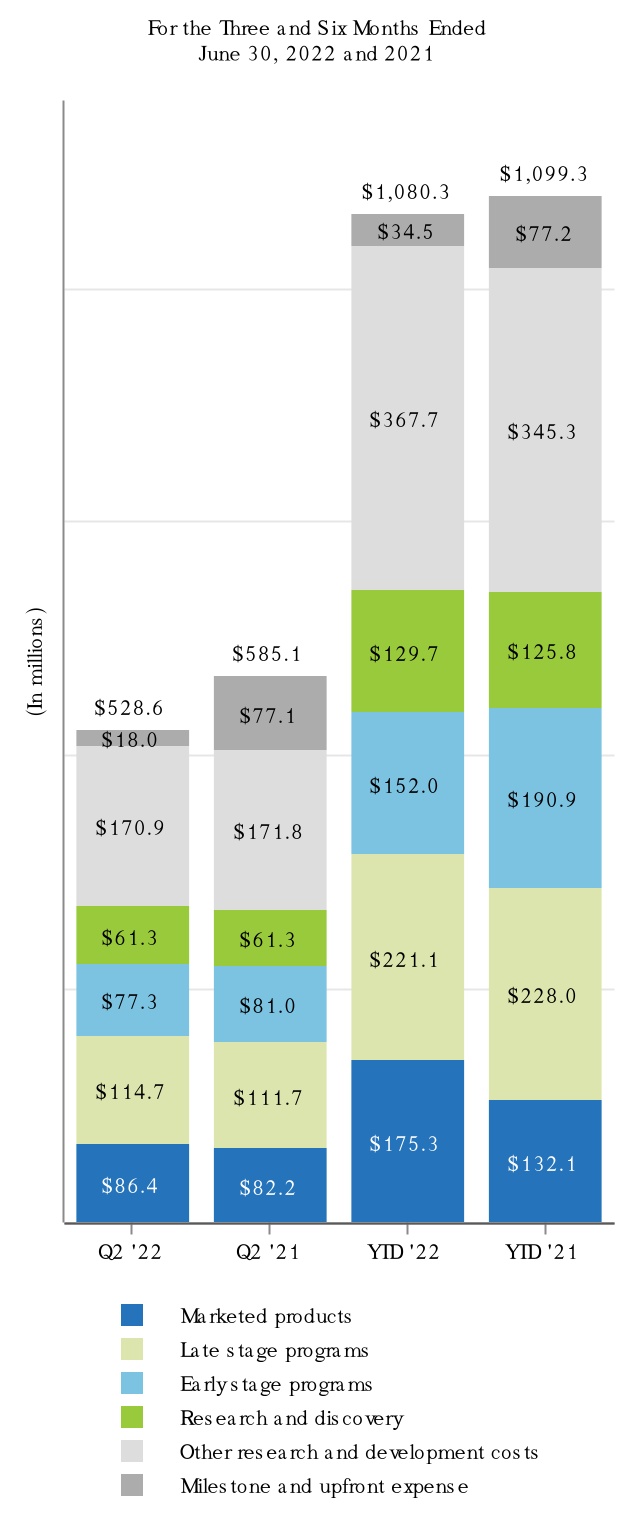
We support our drug discovery and development efforts through the commitment of significant resources to discovery, research and development programs and business development opportunities.
A significant amount of our research and development costs consists of indirect costs incurred in support of overall research and development activities and non-specific programs, including activities that benefit multiple programs, such as
management costs, as well as depreciation, information technology and facility-based expenses. These costs are considered other research and development costs in the table above and are not allocated to a specific program or stage.
Research and development expense incurred in support of our marketed products includes costs associated with product lifecycle management activities including, if applicable, costs associated with the development of new indications for existing products. Late stage programs are programs in Phase 3 development or in registration stage. Early stage programs are programs in Phase 1 or Phase 2 development. Research and discovery represents costs incurred to support our discovery research and translational science efforts. Costs are reflected in the development stage based upon the program status when incurred. Therefore, the same program could be reflected in different development stages in the same year. For several of our programs, the research and development activities are part of our collaborative and other relationships. Our costs reflect our share of the total costs incurred.
For the three months ended June 30, 2022, compared to the same period in 2021, the decrease in research and development expense was primarily due to higher milestone payments in 2021.
For the six months ended June 30, 2022, compared to the same period in 2021, the decrease in research and development expense was primarily due to higher milestone payments in 2021, partially offset by an increase in spending related to lecanemab, the advancement of BIIB059 (anti-BDCA2) for the potential treatment of systemic lupus erytheatosus (SLE), the development of mosunetuzumab, a late-stage bispecific antibody in development for B-cell non-Hodgkin's lymphoma and other therapeutic areas, the development of BIIB124 (SAGE-324) for the potential treatment of essential tremor, which we are developing in collaboration with Sage, the development of BIIB122 (DNL151) for the potential treatment of Parkinson's disease, which we are developing in collaboration with Denali Therapeutics Inc. (Denali), and the development of BIIB135 (orelabrutinib) for the potential treatment of MS.
In 2021 we recorded significant upfront payments related to our new collaborations as part of research and development expense. Excluding upfront payments, we expect our core research and development expense in 2022 to be consistent with 2021 as we continue to invest in our pipeline. We intend to continue committing significant resources to targeted research and development opportunities where there is a significant unmet need and where a drug candidate has the potential to be highly differentiated.
Early Stage Programs
For the three and six months ended June 30, 2022, compared to the same periods in 2021, the decreases in spending related to our early stage programs were primarily due to decreases in costs associated with:
-
the discontinuation of BIIB054 (cinpanemab) in Parkinson's disease;
-
the discontinuation of gosuranemab (BIIB092) in Alzheimer's disease;
-
the discontinuation of BIIB112 (cotoretigene toliparvovec) in X-linked retinitis pigmentosa; and
-
the advancement of BIIB059 for the potential treatment of SLE into late stage.
These decreases were partially offset by increases in costs associated with:
-
an increase in spending in the development of BIIB124 for the potential treatment of essential tremor;
-
an increase in spending in the development of BIIB122 for the potential treatment of Parkinson's disease;
-
an increase in spending in the development of BIIB135 for the potential treatment of MS; and
-
an increase in spending in the development of BIIB059 for the potential treatment of cutaneous lupus erythematosus (CLE).
Late Stage Programs
For the three months ended June 30, 2022, compared to the same period in 2021, the increase in spending associated with our late stage programs was primarily due to an increase in costs associated with:
-
the increase in spending related to lecanemab; and
-
an increase in spending related to mosunetuzumab, a late-stage bispecific antibody in development for B-cell non-Hodgkin's lymphoma and other therapeutic areas.
The increase was partially offset by a decrease in costs associated with:
- the discontinuation of BIIB111 (timrepigene emparvovec) in choroideremia.
For the six months ended June 30, 2022, compared to the same period in 2021, the decrease in spending associated with our late stage programs was primarily due to a decrease in costs associated with:
-
the advancement of ADUHELM from late stage to marketed upon the accelerated approval of ADUHELM in the U.S.; and
-
the discontinuation of BIIB111 (timrepigene emparvovec) in choroideremia.
The decrease was partially offset by an increase in costs associated with:
-
the advancement of BIIB059 for the potential treatment of SLE into late stage;
-
an increase in spending related to lecanemab; and
-
an increase in spending related to mosunetuzumab.
Marketed Programs
For the three and six months ended June 30, 2022, compared to the same periods in 2021, the increases in spending associated with our marketed programs were primarily due to increases in costs associated with:
- the advancement of ADUHELM from late stage to marketed upon the accelerated approval of ADUHELM in the U.S.
In March 2019 Eisai initiated a global Phase 3 trial for the development of lecanemab in early Alzheimer's disease. Under our collaboration arrangement, Eisai serves as the lead of lecanemab development and regulatory submissions globally with both companies co-commercializing and co-promoting the product, and Eisai having final decision-making authority. All costs, including research, development, sales and marketing expense, are shared equally between us and Eisai. In July 2022 Eisai completed the submission of a BLA to the FDA for the accelerated approval of lecanemab.
As of June 30, 2022, we had approximately $71.5 million of work-in-process inventory related to lecanemab. We plan to continue producing inventory and are also procuring raw materials associated with this production. If the lecanemab Phase 3 study receives a negative readout, or if the program does not receive regulatory approval, we would expect to expense inventory on hand at that time as research and development expense and, under the terms of the collaboration arrangement with Eisai to jointly develop and commercialize lecanemab, we and Eisai would share the costs equally.
For additional information on our collaboration arrangements with Eisai, please read Note 17, Collaborative and Other Relationships, to our condensed consolidated financial statements included in this report.
Selling, General and Administrative

For the three and six months ended June 30, 2022, compared to the same periods in 2021, selling, general and administrative expense decreased by approximately 10.2% and 2.0%, respectively, primarily due cost-reduction measures realized during 2022, partially offset by gross ADUHELM commercialization expense of approximately $27.0 million and $107.0 million, respectively.
As a result of the final NCD we have substantially eliminated our commercial infrastructure supporting ADUHELM, retaining minimal resources to manage patient access programs, including a continued free drug program for patients currently on treatment in the U.S.
Beginning in the second quarter of 2021 reimbursement from Eisai for its share of U.S. ADUHELM selling, general and administrative expense is recognized in collaboration profit (loss) sharing in our condensed consolidated statements of income.
In 2022 we expect selling, general and administrative costs to decline versus 2021 primarily driven by the implementation of our cost savings initiatives, which include the substantial elimination of our commercial infrastructure supporting ADUHELM as well as other cost-reduction measures.
Amortization and Impairment of Acquired Intangible Assets

Our amortization expense is based on the economic consumption and impairment of intangible assets. Our most significant amortizable intangible assets are related to our TYSABRI, AVONEX, SPINRAZA, VUMERITY and TECFIDERA (rest of world) products and other programs acquired through business combinations.
For the three and six months ended June 30, 2022, compared to the same periods in 2021, the decreases in amortization and impairment of acquired intangible assets were primarily related to impairment charges recorded in 2021. For the three and six months ended June 30, 2022, we had no impairment charges.
For the three months ended June 30, 2021, amortization and impairment of acquired intangible assets reflects a $350.0 million impairment charge related to BIIB111 for the potential treatment of choroideremia and a $191.6 million impairment charge related to BIIB112 for the potential treatment of X-linked retinitis pigmentosa.
For the six months ended June 30, 2021, amortization and impairment of acquired intangible assets also reflects a $44.3 million impairment charge related to vixotrigine (BIIB074) for the potential treatment of trigeminal neuralgia (TGN).
We monitor events and expectations regarding product performance. If new information indicates that the assumptions underlying our most recent analysis are substantially different than those utilized in our current estimates, our analysis would be updated and may result in a significant change in the anticipated lifetime revenue of the relevant products. The occurrence of an adverse event could substantially increase the amount of amortization expense related
to our acquired intangible assets as compared to previous periods or our current expectations, which may result in a significant negative impact on our future results of operations.
IPR&D Related to Business Combinations
In-process research and development (IPR&D) represents the fair value assigned to research and development assets that we acquired as part of a business combination and had not yet reached technological feasibility at the date of acquisition. We review amounts capitalized as acquired IPR&D for impairment annually, as of October 31, and whenever events or changes in circumstances indicate to us that the carrying value of the assets might not be recoverable.
Overall, the value of our acquired IPR&D assets is dependent upon several variables, including estimates of future revenue and the effects of competition, our ability to secure sufficient pricing in a competitive market, our ability to confirm safety and efficacy based on data from clinical trials and regulatory feedback, the level of anticipated development costs and the probability and timing of successfully advancing a particular research program from one clinical trial phase to the next. We are continually reevaluating our estimates concerning these and other variables, including our life cycle management strategies, research and development priorities and development risk, changes in program and portfolio economics and related impact of foreign currency exchange rates and economic trends and evaluating industry and company data regarding the productivity of clinical research and the development process. Changes in our estimates may result in a significant change to our valuation of our IPR&D assets.
Vixotrigine
In the periods since we acquired vixotrigine, there have been numerous delays in the initiation of Phase 3 studies for the potential treatment of TGN and for the potential treatment of diabetic painful neuropathy (DPN), another form of neuropathic pain. We have engaged with the FDA regarding the design of the Phase 3 studies of vixotrigine for the potential treatment of TGN and DPN and are now performing an additional clinical trial of vixotrigine, which is expected to be completed by the end of 2022.
The performance of this additional clinical trial has delayed the initiation of the Phase 3 studies of vixotrigine for the potential treatment of TGN, and, as a result, we recognized an impairment charge of $44.3 million related to vixotrigine for the potential treatment of TGN during the first quarter of 2021.
As of June 30, 2022, the carrying value associated with the remaining IPR&D intangible asset
for DPN was $119.2 million and the fair value of this asset was not significantly in excess of its carrying value. We will reassess the carrying value of this program upon conclusion of the ongoing clinical trial or sooner if there is a reevaluation event and may record an impairment charge related to this asset.
BIIB111 and BIIB112
During the second quarter of 2021 we announced that our Phase 3 STAR study of BIIB111 did not meet its primary or key secondary endpoints. We reassessed the fair value of the program based on the results of this study and recognized an impairment charge of $350.0 million during the second quarter of 2021, which resulted in a reduction of the IPR&D intangible asset from $365.0 million to $15.0 million.
During the second quarter of 2021 we announced that our Phase 2/3 XIRIUS study of BIIB112 did not meet its primary endpoint; however, positive trends were observed across several clinically relevant prespecified secondary endpoints. We reassessed the fair value of the program based on the results of this study and recognized an impairment charge of $191.6 million during the second quarter of 2021, which resulted in a reduction of the IPR&D intangible asset from $220.0 million to $28.4 million.
In the third quarter of 2021 we suspended further development on these programs based on the decision by management as part of its strategic review process. For the year ended December 31, 2021, we recognized additional impairment charges related to BIIB111 and BIIB112, reducing the remaining book values of these IPR&D intangible assets to zero.
For additional information on the amortization and impairment of our acquired intangible assets, please read Note 6, Intangible Assets and Goodwill, to our condensed consolidated financial statements included in this report.
Collaboration Profit (Loss) Sharing

Collaboration profit (loss) sharing primarily includes Samsung Bioepis' 50.0% share of the profit or loss related to our biosimilars commercial agreement with Samsung Bioepis and, beginning in the second quarter of 2021, Eisai's 45.0% share of income and expense in the U.S. related to the ADUHELM Collaboration Agreement.
For the three and six months ended June 30, 2022, we recognized net profit-sharing expense of $58.3 million and $122.7 million, respectively, to reflect Samsung Bioepis' 50.0% sharing of the net collaboration profits compared to a net profit-sharing expense of $69.9 million and $138.4 million, respectively, in the prior year comparative periods.
For the three and six months ended June 30, 2022, we recognized a net reduction to our operating expense of $28.9 million and $210.6 million, respectively, to reflect Eisai's 45.0% share of net collaboration losses in the U.S., compared to $40.1 million in each of the prior year comparative periods.
For the three and six months ended June 30, 2021, we also recognized net profit-sharing income of $45.0 million to reflect Eisai's 45.0% share of the $100.0 million milestone payment made to Neurimmune related to the launch of ADUHELM in the U.S.
For additional information on our collaboration arrangements with Samsung Bioepis and Eisai, please read Note 17, Collaborative and Other Relationships, to our condensed consolidated financial statements included in this report.
(Gain) Loss on Fair Value Remeasurement of Contingent Consideration

Consideration payable for certain of our business combinations includes future payments that are contingent upon the occurrence of a particular event or events. We record an obligation for such contingent consideration payments at fair value on the acquisition date. We then revalue our contingent consideration obligations each reporting period. Changes in the fair value of our contingent consideration obligations, other than changes due to payments, are recognized as a (gain) loss on fair value remeasurement of contingent consideration in our condensed consolidated statements of income.
For the three and six months ended June 30, 2022, compared to the same periods in 2021, changes in the fair value of our contingent consideration obligations were primarily due to increases in the discount rates used to revalue these obligations and delays in the expected timing of the achievement of certain remaining developmental milestones related to our vixotrigine programs.
Restructuring Charges
2022 Cost Saving Initiatives
In December 2021 and May 2022 we announced our plans to implement a series of cost-reduction measures during 2022. These savings are being achieved through a number of initiatives, including reductions to our workforce, the substantial elimination of our commercial ADUHELM infrastructure, the consolidation of certain real estate locations and operating efficiencies across our selling, general and administrative and research and development functions.
Under these initiatives, we expect to incur restructuring charges ranging from approximately $130.0 million to $150.0 million. These amounts are primarily related to severance and are expected to be substantially incurred and paid by the end of 2022.
For the three and six months ended June 30, 2022, we recognized approximately $70.6 million and $108.7 million, respectively, of pre-tax restructuring charges related to our 2022 cost saving initiatives, of which approximately $60.9 million and $88.6 million, respectively, consisted of employee severance costs. These costs were recorded in restructuring charges in
our condensed consolidated statements of income. Our restructuring reserve is included in accrued expense and other in our condensed consolidated balance sheets.
Following an evaluation of our current capacity needs, in March 2022 we ceased using a patient services office space in Durham, North Carolina. Our decision to cease use of the facility resulted in the immediate expense of certain leasehold improvements and other assets at this facility. As a result, for the six months ended June 30, 2022, we recognized approximately $10.4 million of accelerated depreciation expense, which was recorded in restructuring charges in our condensed consolidated statements of income. In May 2022 we entered into a lease assignment agreement whereby we assigned our remaining lease obligations to an external third party. As a result of the lease assignment, we derecognized the related operating lease obligation and right-of-use asset as of June 30, 2022.
For the three and six months ended June 30, 2022, we recorded other restructuring costs of approximately $9.7 million, which were recorded in restructuring charges in our condensed consolidated statements of income. Other restructuring costs includes items such as facility closure costs, employee non-severance expense, asset write-offs and other costs.
The following table summarizes the charges and spending related to our 2022 workforce reductions for the three and six months ended June 30, 2022:
| (In millions) | Total | |||||||||||||||||||
| Restructuring reserve as of December 31, 2021 | $ | — | ||||||||||||||||||
| Expense | 27.7 | |||||||||||||||||||
| Payment | (6.2) | |||||||||||||||||||
| Restructuring reserve as of March 31, 2022 | 21.5 | |||||||||||||||||||
| Expense | 60.9 | |||||||||||||||||||
| Payment | (29.7) | |||||||||||||||||||
| Adjustment | (0.5) | |||||||||||||||||||
| Restructuring reserve as of June 30, 2022 | $ | 52.2 |
Other (Income) Expense, Net

For the three and six months ended June 30, 2022, compared to the same periods in 2021, the changes in other (income) expense, net primarily reflect a pre-tax gain of approximately $1.5 billion related to the sale of our 49.9% equity interest in Samsung Bioepis during the second quarter of 2022, partially offset by a pre-tax charge in connection with a litigation agreement in principle, as discussed below.
During the second quarter of 2022 we recorded a pre-tax charge of $900.0 million, plus estimated fees and expenses, related to an agreement in principle to resolve a qui tam litigation relating to conduct prior to 2015. This charge is included within other (income) expense, net in our condensed consolidated statements of income for the three and six months ended June 30, 2022. In the period paid, the settlement amount plus all related fees and expenses will have a material adverse impact on our cash flow. For additional information on the litigation agreement in principle, please read Note 19, Litigation, to our condensed consolidated financial statements included in this report.
For the three months ended June 30, 2022, net unrealized losses and realized losses on our holdings in equity securities were approximately $76.5 million and $0.7 million, respectively, compared to net unrealized gains and realized gains of approximately $153.9 million and $0.4 million, respectively, in the prior year comparative period. The net unrealized losses recognized during the three months ended June 30, 2022, primarily reflect a decrease in the aggregate fair value of our investments in Sangamo Therapeutics, Inc. (Sangamo) and Denali common stock of approximately $75.3 million.
For the six months ended June 30, 2022, net unrealized losses and realized losses on our holdings in equity securities were approximately $267.4 million and $0.5 million, respectively, compared to net unrealized losses and realized gains of $288.4 million
and $6.6 million, respectively, in the prior year comparative period. The net unrealized losses recognized during the six months ended June 30, 2022, primarily reflect a decrease in the aggregate fair value of our investments in Denali, Sangamo and Sage common stock of approximately $277.1 million.
For additional information on the sale of our equity interest in Samsung Bioepis, please read Note 2, Dispositions, to our condensed consolidated financial statements included in this report.
Income Tax Provision

Our effective tax rate fluctuates from year to year due to the global nature of our operations. The factors that most significantly impact our effective tax rate include changes in tax laws, variability in the allocation of our taxable earnings among multiple jurisdictions, the amount and characterization of our research and development expense, the levels of certain deductions and credits, acquisitions and licensing transactions.
For the three and six months ended June 30, 2022, compared to the same periods in 2021, the increases in our effective tax rate were primarily due to the overall current year unfavorable tax rate impact
on the sale of our equity interest in Samsung Bioepis in April 2022, the litigation agreement in principle and the tax benefit recorded in the second quarter of 2021 related to the Neurimmune SubOne AG (Neurimmune) deferred tax asset matter, as discussed below. These effective tax rate increases were partially offset by the non-cash tax effects of changes in the value of our equity instruments and the current year tax benefits recorded in the second quarter of 2022 related to an international reorganization to align with global tax developments.
For the six months ended June 30, 2022, compared to the same period in 2021, our effective tax rate also increased as a result of the Neurimmune valuation allowance recorded in the first quarter of 2022.
During the second quarter of 2021 we recorded a net deferred tax asset in Switzerland of approximately $490.0 million on Neurimmune's tax basis in ADUHELM, the realization of which is dependent on future sales of ADUHELM. During the fourth quarter of 2021, due to reduced future expected revenue associated with ADUHELM, we recorded a valuation allowance of approximately $390.0 million.
During the first quarter of 2022, upon issuance of the final NCD related to ADUHELM, we recorded an additional valuation allowance of approximately $85.0 million to reduce the net value of this deferred tax asset to zero. These adjustments to our deferred tax assets and their valuation allowances are each recorded with an equal and offsetting amount assigned to net income (loss) attributable to noncontrolling interests, net of tax in our condensed consolidated statements of income, resulting in a zero net impact to net income attributable to Biogen Inc.
For additional information on the litigation agreement in principle, please read Note 19, Litigation, to our condensed consolidated financial statements included in this report.
For additional information on our collaboration arrangement with Neurimmune, please read Note 18, Investments in Variable Interest Entities, to these condensed consolidated financial statements.
For additional information on our income taxes please read Note 15, Income Taxes, to our condensed consolidated financial statements included in this report.
Equity in (Income) Loss of Investee, Net of Tax

In February 2012 we entered into a joint venture agreement with Samsung BioLogics establishing an entity, Samsung Bioepis, to develop, manufacture and market biosimilar products.
In April 2022 we completed the sale of our 49.9% equity interest in Samsung Bioepis to Samsung BioLogics. Following the sale of Samsung Bioepis we no longer recognize gains or losses associated with Samsung Bioepis' results of operations and amortization related to basis differences.
Prior to this sale, we recognized our share of the results of operations related to our investment in Samsung Bioepis under the equity method of accounting one quarter in arrears when the results of the entity became available, which was reflected as equity in (income) loss of investee, net of tax in our condensed consolidated statements of income. We recognized amortization on certain basis differences resulting from our November 2018 investment.
For the three and six months ended June 30, 2022, we recognized net income on our investment of $5.9 million and $2.6 million, respectively, reflecting our share of Samsung Bioepis' operating profits, net of tax totaling $13.0 million and $17.0 million, respectively, offset by amortization of basis differences totaling $7.1 million and $14.4 million, respectively. These amounts reflect our share of results prior to the sale of Samsung Bioepis as the results are recognized one quarter in arrears.
For the three and six months ended June 30, 2021, we recognized net income on our investment of $34.3 million and $16.1 million, respectively, reflecting our share of Samsung Bioepis' operating income, net of tax totaling $41.6 million and $30.6 million, respectively, and amortization of basis
differences totaling $7.3 million and $14.5 million, respectively.
For additional information on the sale of our equity interest in Samsung Bioepis, please read Note 2, Dispositions, to our condensed consolidated financial statements included in this report.
For additional information on our collaboration arrangements with Samsung Bioepis, please read Note 17, Collaborative and Other Relationships, to our condensed consolidated financial statements included in this report.
Noncontrolling Interests, Net of Tax

Our condensed consolidated financial statements include the financial results of our variable interest entity, Neurimmune, as we determined that we are the primary beneficiary.
For the three and six months ended June 30, 2022, compared to the same periods in 2021, the changes in net income (loss) attributable to noncontrolling interests, net of tax were primarily due to a deferred tax benefit recorded in the second quarter of 2021, as discussed below.
During the second quarter of 2021 we recorded a deferred tax benefit associated with the accelerated approval of ADUHELM by the FDA in the U.S. We recorded a net deferred tax asset of approximately $490.0 million related to Neurimmune's tax basis in ADUHELM, the realization of which is dependent on future sales of ADUHELM and approval of the Swiss cantonal tax authorities, with an equal and offsetting amount assigned to net income (loss) attributable to noncontrolling interest, net of tax in our condensed consolidated statements of income, resulting in a zero net impact to net income attributable to Biogen Inc.
During the first quarter of 2022 we recorded a valuation allowance of approximately $85.0 million related to this deferred tax asset. There is an equal and offsetting amount assigned to net income (loss) attributable to noncontrolling interests, net of tax in our condensed consolidated statements of income, resulting in a zero net impact to net income attributable to Biogen Inc.
For the three and six months ended June 30, 2021, the changes in net income (loss) attributable to noncontrolling interests, net of tax were also due to the $100.0 million milestone payment to Neurimmune related to the launch of ADUHELM in the U.S. during the second quarter of 2021.
For additional information on our collaboration agreement with Neurimmune, please read Note 18, Investments in Variable Interest Entities, to our condensed consolidated financial statements included in this report.
For additional information on our income taxes please read Note 15, Income Taxes, to our condensed consolidated financial statements included in this report.
FINANCIAL CONDITION, LIQUIDITY AND CAPITAL RESOURCES
Our financial condition is summarized as follows:
| (In millions, except percentages) | As of June 30, 2022 | As of December 31, 2021 | Change % | |||||||||||||||||
| Financial assets: | ||||||||||||||||||||
| Cash and cash equivalents | $ | 2,646.6 | $ | 2,261.4 | 17.0 | % | ||||||||||||||
| Marketable securities — current | 2,151.3 | 1,541.1 | 39.6 | |||||||||||||||||
| Marketable securities — non-current | 1,102.9 | 892.0 | 23.6 | |||||||||||||||||
| Total cash, cash equivalents and marketable securities | $ | 5,900.8 | $ | 4,694.5 | 25.7 | % | ||||||||||||||
| Borrowings: | ||||||||||||||||||||
| Current portion of notes payable | $ | 999.8 | $ | 999.1 | 0.1 | % | ||||||||||||||
| Notes payable | 6,277.4 | 6,274.0 | 0.1 | |||||||||||||||||
| Total borrowings | $ | 7,277.2 | $ | 7,273.1 | 0.1 | % | ||||||||||||||
| Working capital: | ||||||||||||||||||||
| Current assets | $ | 9,740.9 | $ | 7,856.5 | 24.0 | % | ||||||||||||||
| Current liabilities | (5,018.0) | (4,298.2) | 16.7 | |||||||||||||||||
| Total working capital | $ | 4,722.9 | $ | 3,558.3 | 32.7 | % |
For the six months ended June 30, 2022, certain significant cash flows were as follows:
-
$990.3 million in net proceeds received from the sale of our equity interest in Samsung Bioepis;
-
$898.3 million in net cash flow provided by operating activities;
-
$500.0 million used for share repurchases;
-
$443.2 million in total net payments for income taxes; and
-
$94.8 million used for purchases of property, plant and equipment.
Overview
We have historically financed and expect to continue to fund our operating and capital expenditures primarily through cash flow earned through our operations as well as our existing cash resources. We believe generic competition for TECFIDERA in the U.S. and other markets will continue to reduce our cash flow from operations in 2022 and will have a significant adverse impact on our future cash flow from operations. During the second quarter of 2022 we recorded a pre-tax charge of $900.0 million, plus estimated fees and expenses, related to an agreement in principle to resolve a qui tam litigation relating to conduct prior to 2015. In the period paid, the settlement amount plus all related fees and expenses will have a material adverse impact on our cash flow. Additionally, in July 2022 we redeemed our 3.625% Senior Notes due September 15, 2022, with an aggregate principal amount of $1.0 billion.
We believe that our existing funds, when combined with cash generated from operations and our access to additional financing resources, if
needed, are sufficient to satisfy our operating, working capital, strategic alliance, milestone payment, capital expenditure and debt service requirements for the foreseeable future. In addition, we may choose to opportunistically return cash to shareholders and pursue other business initiatives, including acquisition and licensing activities. We may, from time to time, also seek additional funding through a combination of new collaborative agreements, strategic alliances and additional equity and debt financings or from other sources should we identify a significant new opportunity.
For additional information on the litigation agreement in principle, please read Note 19, Litigation, to our condensed consolidated financial statements included in this report.
For additional information on certain risks that could negatively impact our financial position or future results of operations, please read Item 1A. Risk Factors and Item 3. Quantitative and Qualitative Disclosures About Market Risk included in this report.
Cash, Cash Equivalents and Marketable Securities
Until required for another use in our business, we typically invest our cash reserves in bank deposits, certificates of deposit, commercial paper, corporate notes, U.S. and foreign government instruments, overnight reverse repurchase agreements and other interest-bearing marketable debt instruments in accordance with our investment policy. It is our policy to mitigate credit risk in our cash reserves and marketable securities by maintaining a well-diversified portfolio that limits the amount of exposure as to institution, maturity and investment type.
As of June 30, 2022, we had cash, cash equivalents and marketable securities totaling approximately $5.9 billion compared to approximately
$4.7 billion as of December 31, 2021. The change in cash, cash equivalents and marketable securities at June 30, 2022, from December 31, 2021, was primarily due to proceeds received from the sale of our equity interest in Samsung Bioepis and net cash flow provided by operating activities, partially offset by share repurchases.
Investments and other assets in our condensed consolidated balance sheets as of December 31, 2021, include the carrying value of our investment in Samsung Bioepis of $599.9 million. In April 2022 we completed the sale of our 49.9% equity interest in Samsung Bioepis to Samsung BioLogics. Under the terms of this transaction, we received approximately $1.0 billion in cash at closing and expect to receive approximately $1.3 billion in cash to be deferred over two payments of approximately $812.5 million due at the first anniversary and approximately $437.5 million due at the second anniversary of the closing of the transaction.
We are also eligible to receive up to an additional $50.0 million upon the achievement of certain commercial milestones. If any payments due to us remain outstanding after the second anniversary of the closing of the transaction, we may elect to receive shares of Samsung BioLogics common stock at a 5.0% discount in lieu of a cash payment for the remaining amount due. Currently, we believe that the likelihood of Samsung BioLogics failing to make timely payments to us for the amounts due is remote.
For additional information on the sale of our equity interest in Samsung Bioepis, please read Note 2, Dispositions, to our condensed consolidated financial statements included in this report*.*
The following table summarizes the fair value of our significant common stock investments:
| (In millions) | June 30, 2022 | December 31, 2021 | ||||||||||||
| Denali | $ | 391.7 | $ | 550.7 | ||||||||||
| Sangamo | 100.0 | 173.7 | ||||||||||||
| Sage | 187.4 | 231.9 | ||||||||||||
| Ionis | 106.5 | 87.5 | ||||||||||||
| $ | 785.6 | $ | 1,043.8 |
For additional information on our collaboration arrangements with Samsung Bioepis, Sangamo, Denali and Sage, please read Note 17, Collaborative and Other Relationships, to our condensed consolidated financial statements included in this report*.*
For additional information on our collaboration arrangements with Ionis, please read Note 18, Collaborative and Other Relationships, to our consolidated financial statements included in our 2021 Form 10-K.
Capital Expenditures
In March 2021 we announced our plans to build a new gene therapy manufacturing facility in RTP, North Carolina to support our gene therapy pipeline across multiple therapeutic areas. The new facility is expected to be operational by the end of 2023, with an estimated total investment of approximately $200.0 million. Construction for this new facility began during the fourth quarter of 2021.
Borrowings
In February 2021 we completed our Exchange Offer, consisting of the following:
-
$624.6 million aggregate principal amount of our 2045 Senior Notes was exchanged for $700.7 million aggregate principal amount of our 2051 Senior Notes and approximately $151.8 million of aggregate cash payments; and
-
$8.9 million aggregate principal amount of our 2045 Senior Notes was redeemed for approximately $12.1 million of aggregate cash payments, excluding accrued and unpaid interest.
In April 2020 we issued senior unsecured notes for an aggregate principal amount of $3.0 billion (2020 Senior Notes), consisting of the following:
-
$1.5 billion aggregate principal amount of 2.25% Senior Notes due May 1, 2030; and
-
$1.5 billion aggregate principal amount of 3.15% Senior Notes due May 1, 2050.
The following is a summary of our currently outstanding senior unsecured notes issued in 2015 (2015 Senior Notes):
-
$1.0 billion aggregate principal amount of 3.625% Senior Notes due September 15, 2022;
-
$1.75 billion aggregate principal amount of 4.05% Senior Notes due September 15, 2025; and
-
$1.12 billion aggregate principal amount of 5.20% Senior Notes due September 15, 2045.
Our 2020 Senior Notes and our 2015 Senior Notes were issued at a discount, which are amortized as additional interest expense over the period from issuance through maturity.
For a summary of the fair and carrying values of our outstanding borrowings as of June 30, 2022 and December 31, 2021, please read Note 7, Fair Value Measurements, to our condensed consolidated financial statements included in this report.
Credit Facility
In January 2020 we entered into a $1.0 billion, five-year senior unsecured revolving credit facility under which we are permitted to draw funds for working capital and general corporate purposes. The terms of the revolving credit facility include a financial covenant that requires us not to exceed a maximum consolidated leverage ratio. As of June 30, 2022 and December 31, 2021, we had no outstanding borrowings and were in compliance with all covenants under this facility.
Working Capital
Working capital is defined as current assets less current liabilities. Working capital was $4.7 billion and $3.6 billion as of June 30, 2022 and December 31, 2021, respectively. The change in working capital reflects an increase in total current assets of approximately $1,884.4 million and a increase in total current liabilities of approximately $719.8 million.
The increase in total current assets was primarily driven by the receipt of approximately $990.3 million in cash, net of expenses, and the recording of a receivable from Samsung BioLogics for approximately $788.1 million as part of the sale of our equity interest in Samsung Bioepis in the second quarter of 2022.
The increase in current liabilities was primarily due to an increase in accrued expense and other resulting from a pre-tax charge of $900.0 million in connection with a litigation agreement in principle reached during the second quarter of 2022.
Share Repurchase Programs
In October 2020 our Board of Directors authorized our 2020 Share Repurchase Program, which is a program to repurchase up to $5.0 billion of our common stock. Our 2020 Share Repurchase Program does not have an expiration date. All share repurchases under our 2020 Share Repurchase Program will be retired. Under our 2020 Share Repurchase Program, we repurchased and retired approximately 2.4 million shares of our common stock at a cost of approximately $500.0 million during the three and six months ended June 30, 2022. During the three and six months ended June 30, 2021, we repurchased and retired approximately 1.6 million and 3.8 million shares of our common stock at a cost of approximately $450.0 million and $1.1 billion, respectively. Approximately $2.3 billion remained available under our 2020 Share Repurchase Program as of June 30, 2022.
Cash Flow
The following table summarizes our cash flow activity:
| For the Six Months Ended June 30, | ||||||||||||||||||||
| (In millions, except percentages) | 2022 | 2021 | % Change | |||||||||||||||||
| Net cash flow provided by (used in) operating activities | $ | 898.3 | $ | 1,996.3 | (55.0) | % | ||||||||||||||
| Net cash flow provided by (used in) investing activities | 45.5 | (217.4) | 120.9 | |||||||||||||||||
| Net cash flow provided by (used in) financing activities | (488.0) | (1,349.5) | (63.8) |
Operating Activities
Cash flow from operating activities represents the cash receipts and disbursements related to all of our activities other than investing and financing activities. We expect cash provided from operating activities will continue to be our primary source of funds to finance operating needs and capital expenditures for the foreseeable future.
Operating cash flow is derived by adjusting our net income for:
-
non-cash operating items such as depreciation and amortization, impairment charges, unrealized gain (loss) on strategic investments, acquired IPR&D and share-based compensation;
-
changes in operating assets and liabilities, which reflect timing differences between the receipt and payment of cash associated with
transactions and when they are recognized in results of operations; and
- changes in the fair value of contingent payments associated with our acquisitions of businesses and payments related to collaborations.
For the six months ended June 30, 2022, compared to the same period in 2021, the decrease in net cash flow provided by operating activities was primarily due to to lower net income in 2022, timing of payments and higher net income tax payments in 2022 as compared to the same period in 2021.
Investing Activities
For the six months ended June 30, 2022, compared to the same period in 2021, the increase in net cash flow provided by investing activities was primarily due to proceeds received from the sale of our equity interest in Samsung Bioepis of $990.3
million, net of expenses, during the second quarter of 2022.
Financing Activities
For the six months ended June 30, 2022, compared to the same period in 2021, the decrease in net cash flow used in financing activities was primarily due to a greater number of shares repurchased in 2021 as compared to the comparative period in 2022. Additionally, we executed our Exchange Offer in the first quarter of 2021, which resulted in net cash outflows of $170.0 million.
Contractual Obligations and Off-Balance Sheet Arrangements
Contractual Obligations
Our contractual obligations primarily consist of our obligations under non-cancellable operating leases, long-term debt obligations and defined benefit and other purchase obligations, excluding amounts related to uncertain tax positions, funding commitments, contingent development, regulatory and commercial milestone payments, contingent payments and contingent consideration related to our business combinations, as described below.
There have been no material changes in our contractual obligations since December 31, 2021.
Royalty Payments
TYSABRI
We are obligated to make contingent payments of 18.0% on annual worldwide net sales of TYSABRI up to $2.0 billion and 25.0% on annual worldwide net sales of TYSABRI that exceed $2.0 billion. Royalty payments are recognized as cost of sales in our condensed consolidated statements of income.
SPINRAZA
We make royalty payments on annual worldwide net sales of SPINRAZA using a tiered royalty rate between 11.0% and 15.0%, which are recognized as cost of sales in our condensed consolidated statements of income.
VUMERITY
In October 2019 the FDA approved VUMERITY for the treatment of RMS. During the fourth quarter of 2021 VUMERITY was approved for the treatment of RRMS in the E.U., Switzerland and the U.K. Under our agreement with Alkermes Pharma Ireland Limited, a subsidiary of Alkermes plc (Alkermes), we make royalty payments to Alkermes on worldwide net sales of VUMERITY using a royalty rate of 15.0%, which are recognized as cost of sales in our condensed consolidated statements of income.
In October 2019 we entered into a new supply agreement and amended our license and collaboration agreement with Alkermes. We have elected to initiate a technology transfer and, following a transition period, to manufacture VUMERITY or have VUMERITY manufactured by a third party we have engaged in exchange for paying an increased royalty rate to Alkermes on any portion of future worldwide net sales of VUMERITY that is manufactured by us or our designee. For additional information on our collaboration arrangement with Alkermes, please read Note 18, Collaborative and Other Relationships, to our consolidated financial statements included in our 2021 Form 10-K.
Contingent Consideration related to Business Combinations
In connection with our acquisition of Convergence Pharmaceuticals Holdings Ltd. we agreed to make additional payments based upon the achievement of certain milestone events.
We recognized the contingent consideration liabilities associated with this acquisition at their fair value on the acquisition date and revalue these obligations each reporting period. We may pay up to approximately $400.0 million in remaining milestones related to this acquisition.
Contingent Development, Regulatory and Commercial Milestone Payments
Based on our development plans as of June 30, 2022, we could trigger potential future milestone payments to third parties of up to approximately $9.6 billion, including approximately $1.9 billion in development milestones, approximately $0.8 million in regulatory milestones and approximately $6.9 billion in commercial milestones, as part of our various collaborations, including licensing and development programs. Payments under these agreements generally become due and payable upon achievement of certain development, regulatory or commercial milestones. Because the achievement of these milestones was not considered probable as of June 30, 2022, such contingencies have not been recorded in our financial statements. Amounts related to contingent milestone payments are not considered contractual obligations as they are contingent on the successful achievement of certain development, regulatory or commercial milestones.
If certain clinical and commercial milestones are met, we may pay up to $39.7 million in milestones in 2022 under our current agreements.
For additional information on our collaboration arrangements with Eisai, please read Note 17, Collaborative and Other Relationships, to our
condensed consolidated financial statements included in this report.
Other Funding Commitments
As of June 30, 2022, we have several ongoing clinical studies in various clinical trial stages. Our most significant clinical trial expenditures are to contract research organizations (CROs). The contracts with CROs are generally cancellable, with notice, at our option. We recorded accrued expense of approximately $18.8 million in our condensed consolidated balance sheet for expenditures incurred by CROs as of June 30, 2022. We have approximately $986.5 million in cancellable future commitments based on existing CRO contracts as of June 30, 2022.
As part of the sale of our Hillerød, Denmark manufacturing operations to FUJIFILM Corporation (FUJIFILM), we provided FUJIFILM with certain minimum batch production commitment guarantees. There is a risk that the minimum contractual batch production commitments will not be met. Based upon current estimates we do not expect to incur an adverse commitment obligation associated with such guarantees. We developed this estimate using a probability-weighted estimate of future manufacturing activity and may further adjust this estimate based upon changes in business conditions, which may result in the increase or reduction of this adverse commitment obligation in subsequent periods.
For additional information on the divestiture of our Hillerød, Denmark manufacturing operations, please read Note 3, Divestitures, to our consolidated financial statements included in our 2021 Form 10-K.
Tax Related Obligations
We exclude liabilities pertaining to uncertain tax positions from our summary of contractual obligations as we cannot make a reliable estimate of the period of cash settlement with the respective taxing authorities. As of June 30, 2022, we have approximately $104.7 million of liabilities associated with uncertain tax positions.
As of June 30, 2022 and December 31, 2021, we have accrued income tax liabilities of approximately $558.0 million and $633.0 million, respectively, under a one-time mandatory deemed repatriation tax on accumulated foreign subsidiaries' previously untaxed foreign earnings (the Transition Toll Tax). Of the amounts accrued as of June 30, 2022, approximately $137.8 million is expected to be paid within one year. The Transition Toll Tax will be paid in installments over an eight-year period, which started in 2018, and will not accrue interest.
Other Off-Balance Sheet Arrangements
We do not have any relationships with entities often referred to as structured finance or special purpose entities that were established for the purpose of facilitating off-balance sheet arrangements. As such, we are not exposed to any financing, liquidity, market or credit risk that could arise if we had engaged in such relationships. We consolidate variable interest entities if we are the primary beneficiary.
New Accounting Standards
For a discussion of new accounting standards please read Note 1, Summary of Significant Accounting Policies, to our condensed consolidated financial statements included in this report.
Critical Accounting Estimates
The preparation of our condensed consolidated financial statements, which have been prepared in accordance with accounting principles generally accepted in the U.S., requires us to make estimates, judgments and assumptions that may affect the reported amounts of assets, liabilities, equity, revenue and expense and related disclosure of contingent assets and liabilities. On an ongoing basis we evaluate our estimates, judgments and assumptions. We base our estimates on historical experience and on various other assumptions that we believe are reasonable, the results of which form the basis for making judgments about the carrying values of assets, liabilities and equity and the amount of revenue and expense. Actual results may differ from these estimates.
For a discussion of our critical accounting estimates, please read Part II, Item 7. Management’s Discussion and Analysis of Financial Condition and Results of Operations in our 2021 Form 10-K. There have been no material changes to our critical accounting estimates since our 2021 Form 10-K.
Previous: Cover and table of contents · Next: Item 3. QUANTITATIVE AND QUALITATIVE DISCLOSURES ABOUT MARKET RISK