 filings.tools
Builders FirstSource (BLDR) 10-K risk factor changes: FY2019 vs FY2018
The 2019-12-31 10-K against the 2018-12-31 one, compared heading by heading and sentence by sentence. One of these filings carries no fiscal year tag, so its year is the calendar year of the period end.
Item 1A46 rewritten6 added10 removed267 unchanged
All filing items724 rewritten415 added357 removed1,257 unchanged
Summary
counted, not written
- Item 1A headings could not be compared: only 0 carried over between the two years, which usually means one filing was read wrongly, so none is reported as new or removed.
- Sentence by sentence, 415 added, 357 removed, 724 rewritten and 1,257 unchanged across 19 items that differ.
Sentences by item
22 items, with every count and a link to each item that changed
Underlined words on a shaded ground are new in FY2019; struck-through words were in FY2018. Sentences that are wholly new or wholly gone are labelled rather than marked.
Item 1A. Risk Factors
46 rewritten, 6 added, 10 removed, 267 unchanged
Read the full itemFY2019 item · filed February 21, 2020FY2018 item · filed March 1, 2019
According to the U.S. Census Bureau, annual U.S. total and single-family housing starts were [removed: 1.2] [added: 1.3] million and 0.9 million, respectively, for the year ended December 31, [removed: 2018.][added: 2019.]
However, both total and single-family housing starts remain [removed: well] below the normalized historical averages (from 1959 through [removed: 2018)] [added: 2019)] of 1.5 million and 1.1 million, respectively.
Due to the lower levels in housing starts, increased competition for homebuilder [removed: business] [added: business,] and cyclical fluctuations in commodity prices, we have [removed: seen] [added: seen,] and may continue to experience pressure on our gross margins.
Our lumber and lumber sheet goods product category represented [removed: 37.6%] [added: 30.9%] of total [added: net] sales for the year ended December 31, [removed: 2018.][added: 2019.]
The homebuilding industry has experienced growth in recent years and industry forecasters expect to see continued growth in the housing market [removed: in] [added: over] the [removed: near term.][added: next year.]
Over the past [removed: few] [added: several] years, these pricing pressures have adversely affected our operating results and cash flows.
As of December 31, [removed: 2018,] [added: 2019,] our debt totaled [removed: $1,577.1] [added: $1,300.0] million, which includes [removed: $243.5] [added: $242.1] million of [removed: capital] [added: finance] lease and other finance obligations.
We also have a $900.0 million revolving credit facility [removed: (“2022] [added: (“2023] facility”), under which we had [removed: $179.0] [added: $27.0] million of outstanding borrowings and $82.2 million of letters of credit outstanding as of December 31, [removed: 2018.][added: 2019.]
| | • | exposing us to the risk of increased interest rates, and corresponding increased interest expense, because borrowings under the [removed: 2022] [added: 2023] facility and the [removed: $458.3] [added: $52.0] million senior secured term loan facility due 2024 (“2024 term loan”) are at variable rates of interest; |
In addition, [removed: some of] our debt [removed: instruments, including those governing the 2022 facility, the 2024 term loan, and the 5.625% senior secured notes due 2024 (“2024 notes”),] [added: instruments] contain cross-default provisions that could result in our debt being declared immediately due and payable under a number of debt instruments, even if we default on only one debt instrument.
The agreements governing [removed: the 2022 facility and the 2024 term loan and the indenture governing] our [removed: 2024 notes] [added: debt instruments] restrict our ability to dispose of assets and to use the proceeds from such dispositions.
We are substantially reliant on cash on hand and borrowing availability under the [removed: 2022] [added: 2023] facility, which totaled [removed: $595.5] [added: $695.3] million at December 31, [removed: 2018,] [added: 2019,] to provide working capital and fund our operations.
Our inability to renew, amend or replace [removed: the 2022 facility, the 2024 term loan or the 2024 notes] [added: our debt instruments] when required or when business conditions warrant could have a material adverse effect on our business, financial condition and results of operations.
We may be unable to secure additional financing, financing on favorable terms or our operating cash flow may be insufficient to satisfy our financial obligations under indebtedness outstanding from time to [removed: time, including the 2022 facility, the 2024 term loan, and the 2024 notes.][added: time.]
The agreements governing [removed: the 2022 facility and the 2024 term loan and the indenture governing the 2024 notes,] [added: our debt instruments,] moreover, restrict the amount of permitted indebtedness allowed.
We may incur additional indebtedness in the future, including collateralized debt, subject to the restrictions contained in the agreements governing [removed: the 2022 facility and the 2024 term loan and the indenture governing the 2024 notes.][added: our debt instruments.]
Our financing arrangements, including the agreements governing [removed: the 2022 facility and the 2024 term loan and the indenture governing the 2024 notes,] [added: our debt instruments,] contain various provisions that limit our ability to, among other things:
The agreement governing the [removed: 2022] [added: 2023] facility contains a financial covenant requiring the satisfaction of a minimum fixed charge ratio of 1.00 to 1.00 if our excess availability falls below the greater of $80.0 million or 10% of the maximum borrowing amount, which was [removed: $84.7] [added: $80.0] million as of December 31, [removed: 2018.][added: 2019.]
Our ability to comply with the agreements governing [removed: the 2022 facility and the 2024 term loan and the indenture governing the 2024 notes] [added: our debt instruments] may be affected by changes in our operating and financial performance, changes in general business and economic conditions, adverse regulatory developments, a change in control or other events beyond our control.
The breach of any of these [removed: provisions, including those contained in the 2022 facility and the 2024 term loan and the indenture governing the 2024 notes,] [added: provisions] could result in a default under our indebtedness, which could cause those and other obligations to become due and payable.
[removed: Our] [added: Our] variable rate indebtedness subjects us to interest rate risk, which could cause our indebtedness service obligations to increase [removed: significantly.][added: significantly.]
As a result, interest rates on our [removed: 2022] [added: 2023] facility and our 2024 term loan could be higher or lower than current levels.
As of December 31, [removed: 2018,] [added: 2019,] we had approximately [removed: $637.3] [added: $79.0] million, or [removed: 40.4%,] [added: 6.1%,] of our outstanding debt at variable interest rates.
Further, an increase in interest rates could also trigger a limitation on the deductibility of those interest costs, increasing our tax expense [removed: thereby] [added: and] further decreasing our net income and cash flows.
[removed: Since 2016,] [added: In recent years,] the Company has executed several debt transactions designed to reduce debt, extend maturities or lower our interest rates.
A 1.0% increase in interest rates on the [removed: 2022] [added: 2023] facility would result in approximately [removed: $1.8] [added: $0.3] million in additional interest expense annually as we had [removed: $179.0] [added: $27.0] million in outstanding borrowings as of December 31, [removed: 2018.][added: 2019.]
The [removed: 2022] [added: 2023] facility also assesses variable commitment and outstanding letter of credit fees based on quarterly average loan utilization.
A 1.0% increase in interest rates on the 2024 term loan outstanding as of December 31, [removed: 2018] [added: 2019] would result in approximately [removed: $4.6] [added: $0.5] million in additional interest expense annually.
Our ten largest customers generated approximately [removed: 16.8%] [added: 15.3%] of our [added: net] sales for the year ended December 31, [removed: 2018.][added: 2019.]
A range of factors may make our quarterly [removed: revenues and] [added: revenues,] earnings [added: and cash flows] variable.
We have historically experienced, and in the future will continue to experience, variability in [removed: revenues and] [added: revenues,] earnings [added: and cash flows] on a quarterly basis.
These factors, among others, make it difficult to project our operating results [added: and cash flows] on a consistent basis, which may affect the price of our stock.
[removed: Product] [added: Product] shortages, loss of key suppliers, and our dependence on third-party suppliers and manufacturers could affect our financial [removed: health.][added: health.]
[removed: During the period from 2007 through 2018, we] [added: We have] closed or idled a number of facilities for which we continue to remain liable.
[removed: We] [added: We] are a holding company and conduct all of our operations through our [removed: subsidiaries.][added: subsidiaries.]
The ability of our subsidiaries to pay dividends or make other payments or distributions to us will depend on their respective operating results and may be restricted by, among other things, the laws of their jurisdiction of organization (which may limit the amount of funds available for the payment of dividends and other distributions to us), the terms of existing and future indebtedness and other agreements of our subsidiaries, [removed: the 2022 facility, the 2024 term loan, the terms of the indentures governing the 2024 notes and] [added: as well as] the covenants of any future outstanding indebtedness we or our subsidiaries incur.
As cyber-attacks become more sophisticated, we expect to incur increasing costs to strengthen our systems from outside [removed: intrusions and have purchased and expect to maintain insurance coverage related to the threat of such attacks.][added: intrusions.]
[removed: We] [added: We] may be adversely affected by any natural or man-made disruptions to our distribution and manufacturing [removed: facilities.][added: facilities.]
Moreover, our liquidity position, or the requirements of [removed: the 2022 facility, the 2024 term loan] or [removed: the indentures governing the 2024 notes,] [added: debt instruments] could prevent us from obtaining the capital required to effect new acquisitions or expand our existing facilities.
[removed: Recently enacted tax legislation as well as any future] [added: Future] changes to tax laws and regulations could have an adverse impact on our [removed: business.][added: business.]
In addition, we also have $298.6 million in obligations under operating leases.
The interest rates on our 2023 facility and 2024 term loan may be impacted by the phase out of the London Interbank Offered Rate (“LIBOR”)
Interest rates on borrowings under our 2023 facility and 2024 term loan can, at our option, be based on LIBOR.
In July 2017, the United Kingdom Financial Conduct Authority announced the desire to phase out the use of LIBOR by the end of 2021.
The U.S. Federal Reserve, in conjunction with the Alternative Rates Reference Committee, is considering various alternatives, such as the Secured Overnight Financing Rate (“SOFR”), to replace LIBOR.
The phase out of LIBOR may have an adverse impact on the cost of our borrowings under our 2023 facility and 2024 term loan.
In addition, we have significant obligations under ongoing operating leases that are not reflected on our balance sheet.
Our ProBuild subsidiary currently maintains multiple ERP systems to manage its operations.
We are in the process of integrating certain of ProBuild’s systems with ours and are expecting to complete that process in 2019.
We may encounter significant operational disruptions and higher than expected costs in connection with the ongoing ERP integration process, which could have a material adverse effect on our financial condition, operating results and cash flows.
On December 22, 2017, legislation commonly referred to as the Tax Cuts and Jobs Act (“the 2017 Tax Act”) became enacted law.
In addition, the 2017 Tax Act eliminates the ability for companies to carryback any future net operating losses (“NOLs”).
While the 2017 Tax Act provides for indefinite carryforwards of future NOLs, the utilization of these NOLs is limited to 80% of taxable income in a carryforward year.
Further, the 2017 Tax Act limits the ability for companies to deduct interest expense that exceeds 30% of adjusted taxable income with disallowed interest for a given year allowed to be carried forward to future years indefinitely.
The 2017 Tax Act also modified the existing 162(m) limitations, creating additional limitations on the deductibility of executive compensation.
These limitations on the utilization of future NOLs, the deductibility of interest expense and the deductibility of executive compensation could adversely impact us in the future.
An excerpt. Shown here: 40 of 46 rewritten, all 6 added and all 10 removed. The counts are complete. For every sentence, read Item 1A. Risk Factors in the FY2019 filing and the FY2018 filing.
Item 7. Management’s Discussion and Analysis of Financial Condition and Results of Operations
120 rewritten, 67 added, 114 removed, 101 unchanged
Read the full itemFY2019 item · filed February 21, 2020FY2018 item · filed March 1, 2019
We are a leading supplier [added: and manufacturer] of building materials, manufactured components and construction services to professional contractors, [removed: sub-contractors,] [added: sub-contractors] and consumers.
The Company operates [removed: 401] [added: approximately 400] locations in [removed: 39] [added: 40] states across the United States.
Our financial statements contain additional information regarding segment performance which is discussed in Note [removed: 14] [added: 15] to the consolidated financial statements included in Item 8 of this annual report on Form 10-K.
Our full range of construction-related services includes professional installation, turn-key framing and shell construction, and spans [removed: products across] all [removed: of] our product categories.
| | • | [removed: Lumber] [added: *Lumber] & Lumber Sheet [removed: Goods.] [added: Goods.*] Lumber & lumber sheet goods include dimensional lumber, plywood, and OSB products used in on-site house framing. |
| | • | [removed: Manufactured Products.] [added: *Manufactured Products.*] Manufactured products consist of wood floor and roof trusses, steel roof trusses, wall panels, stairs, and engineered wood. |
| | • | [removed: Windows,] [added: *Windows,] Door & [removed: Millwork.] [added: Millwork.*] Windows & doors are comprised of the manufacturing, assembly, and distribution of windows and the assembly and distribution of interior and exterior door units. Millwork includes interior trim and custom features [removed: including those] that we manufacture under the Synboard ® brand name. |
| | • | [removed: Gypsum,] [added: *Gypsum,] Roofing & [removed: Insulation.] [added: Insulation.*] Gypsum, roofing, & insulation include wallboard, ceilings, joint treatment and finishes. |
| | • | [removed: Siding, metal,] [added: *Siding, Metal,] and [removed: concrete.] [added: Concrete.*] Siding, metal, and concrete includes vinyl, composite, and wood siding, exterior trim, other exteriors, metal studs and cement. |
| | • | [removed: Other] [added: *Other] Building Products & [removed: Services.] [added: Services.*] Other building products & services are comprised of products such as cabinets and hardware as well as services such as turn-key framing, shell construction, design assistance, and professional installation spanning the majority of our product categories. |
| | • | [removed: Homebuilding Industry.] [added: *Homebuilding Industry.*] Our business is driven primarily by the residential new construction market and the residential repair and remodel market, which are in turn dependent upon a number of factors, including demographic trends, interest rates, consumer confidence, employment rates, [removed: foreclosure rates,] [added: housing affordability, household formation, land development costs,] the availability of skilled construction labor, and the health of the economy and mortgage markets. According to the U.S. Census Bureau, annual U.S. total and single-family housing starts were [removed: 1.2] [added: 1.3] million and 0.9 million, respectively, in [removed: 2018.] [added: 2019.] However, both total and single-family housing starts remain [removed: well] below the normalized historical averages (from 1959 through [removed: 2018)] [added: 2019)] of 1.5 million and 1.1 million, respectively. [removed: We believe the housing industry is currently experiencing a shortage of skilled construction labor, which is constraining housing activity.] Due to the lower levels in housing starts versus historical norms, increased competition for homebuilder business and cyclical fluctuations in commodity [removed: prices] [added: prices,] we [removed: have seen and] may [removed: continue to] experience pressure on our gross margins. In addition to these factors, there has been a trend of consolidation within the building products supply industry. However, our industry remains highly fragmented and competitive and we will continue to face significant competition from local and regional suppliers. We still believe there are several meaningful trends that indicate U.S. housing demand will continue to trend towards recovering to the historical average. These trends include relatively low interest rates, the aging of housing stock, and normal population growth due to immigration and birthrate exceeding death rate. While the rate of market growth has recently eased, industry forecasters, including the National Association of Homebuilders (“NAHB”), expect to see continued increases in housing demand over the next year. |
| | • | [removed: Targeting] [added: *Targeting] Large Production [removed: Homebuilders.] [added: Homebuilders.*] In recent years, the homebuilding industry has undergone consolidation, and the larger homebuilders have increased their market share. We expect that trend to continue as larger homebuilders have better liquidity and land positions relative to the smaller, less capitalized homebuilders. Our focus is on maintaining relationships and market share with these customers while balancing the competitive pressures we are facing in servicing large homebuilders with certain profitability expectations. Additionally, we have been successful in expanding our custom homebuilder base while maintaining acceptable credit standards. |
| | • | [removed: Repair] [added: *Repair] and remodel end [removed: market.] [added: market*.] Although the repair and remodel end market is influenced by housing starts to a lesser degree than the homebuilding market, the repair and remodel end market is still dependent upon some of the same factors as the homebuilding market, including demographic trends, interest rates, consumer confidence, employment [removed: rates, foreclosure rates,] [added: rates] and the health of the economy and home financing markets. We expect that our ability to remain competitive in this space will depend on our continued ability to provide a high level of customer service coupled with a broad product offering. |
| | • | [removed: Use] [added: *Use] of Prefabricated [removed: Components.] [added: Components.*] Homebuilders are increasingly using prefabricated components in order to realize increased efficiency, overcome skilled construction labor shortages and improve quality. Shortening cycle time from start to completion is a key imperative of the homebuilders during periods of strong consumer demand. We [added: continue to] see the demand for prefabricated components increasing [removed: as] [added: within] the residential new construction market [removed: continues to strengthen and] [added: as] the availability of skilled construction labor remains limited. |
| | • | [removed: Economic Conditions.] [added: *Economic Conditions.*] Economic changes both nationally and locally in our markets impact our financial performance. The building products supply industry is highly dependent upon new home construction and subject to cyclical market changes. Our operations are subject to fluctuations arising from changes in supply and demand, national and local economic conditions, labor costs and availability, competition, government regulation, trade policies and other factors that affect the homebuilding industry such as demographic trends, interest rates, housing starts, the high cost of land development, employment levels, consumer confidence, and the availability of credit to homebuilders, contractors, and homeowners. |
| | • | [removed: Housing Affordability.] [added: *Housing Affordability.*] The affordability of housing can be a key driver in demand for our products. Home affordability is influenced by a number of economic factors, such as the level of employment, consumer confidence, consumer income, [added: the] supply of houses, the availability of financing and interest rates. Changes in the inventory of available homes as well as economic factors relative to home prices could result in changes to the affordability of homes. As a result, homebuyer demand may shift towards smaller, or larger, homes creating fluctuations in demand for our products. |
| | • | [removed: Cost] [added: *Cost] of [removed: Materials.] [added: Materials.*] Prices of wood products, which are subject to cyclical market fluctuations, may adversely impact operating income when prices rapidly rise or fall within a relatively short period of time. We purchase certain materials, including lumber products, which are then sold to customers as well as used as direct production inputs for our manufactured and prefabricated products. Short-term changes in the cost of these materials, some of which are subject to significant fluctuations, are oftentimes passed on to our customers, but our pricing quotation periods [added: and market competition] may limit our ability to pass on such price changes. We may also be limited in our ability to pass on increases on in-bound freight costs on our products. Our inability to pass on material price increases to our customers could adversely impact our operating results. |
| | • | [removed: Controlling Expenses.] [added: *Controlling Expenses.*] Another important aspect of our strategy is controlling costs and striving to be [removed: the] [added: a] low-cost building materials supplier in the markets we serve. We pay close attention to managing our working capital and operating expenses. Further, we pay careful attention to our logistics function and its effect on our shipping and handling [removed: costs] [added: costs.] |
| | • | [removed: Multi-Family] [added: *Multi-Family] and Light Commercial [removed: Business.] [added: Business.*] Our primary focus has been, and continues to be, on single-family residential new construction and the repair and remodel end market. However, we will continue to identify opportunities for profitable growth in the multi-family and light commercial markets. |
| | • | [removed: Capital Structure:] [added: *Capital Structure.*] As a result of our historical growth through acquisitions, we have substantial indebtedness. We strive to optimize our capital structure to ensure that our financial needs are met in light of economic conditions, business activities, organic investments, opportunities for growth through acquisition and the overall risk characteristics of our underlying assets. [removed: We] [added: In addition to these factors, we also] evaluate our capital structure on the basis of our leverage [removed: ratio as well as the factors described above. While] [added: ratio, our liquidity position, our] debt [removed: reduction will continue to be a key area of focus for the Company,] [added: maturity profile and market interest rates. As such,] we may [removed: adjust] [added: enter into various] debt or equity [removed: levels] [added: transactions] in order to appropriately manage and optimize our capital structure. |
[removed: RECENT DEVELOPMENTS][added: RECENT DEVELOPMENTS]
These [removed: repurchases] [added: transactions] are described in [removed: Note 8] [added: Notes 9 and 18] to the consolidated financial statements included in Item 8 of this annual report on Form 10-K.
From time to time, based on market conditions and other factors and subject to compliance with applicable laws and regulations, the Company may repurchase or call [removed: the 2024] [added: our] notes, repay debt, or otherwise enter into transactions regarding its capital structure.
According to the U.S. Census Bureau, actual U.S. total housing starts for the year ended [removed: ended] December 31, [removed: 2018] [added: 2019] were [removed: 1.2] [added: 1.3] million, an increase of [removed: 3.6%] [added: 3.3%] compared to the year ended December 31, [removed: 2017.][added: 2018.]
Actual U.S. single-family housing starts for the year ended December 31, [removed: 2018] [added: 2019] were 0.9 million, an increase of [removed: 2.8%] [added: 1.4%] compared to the year ended December 31 [removed: 2017.][added: 2018.]
A composite of third party sources, including the NAHB, are forecasting 1.3 million U.S. total housing starts and 0.9 million U.S. single-family housing starts for [removed: 2019,] [added: 2020,] which are increases of [removed: 3.1%] [added: 1.0%] and [removed: 3.1%,] [added: 5.8%,] respectively, from [removed: 2018.][added: 2019.]
In addition, [added: in its September 2019 semi-annual forecast,] the Home Improvement Research Institute (“HIRI”) [removed: is forecasting] [added: forecasted] sales in the professional repair and remodel end market to increase approximately [removed: 6.8%] [added: 0.9%] in [removed: 2019] [added: 2020] compared to [removed: 2018.][added: 2019.]
Our net sales for the year ended December 31, [removed: 2018 were up 9.8%] [added: 2019 decreased 5.8%] over the same period last year.
Our gross margin percentage increased by [removed: 0.3%] [added: 2.3%] during the year ended December 31, [removed: 2018] [added: 2019] compared to the year ended December 31, [removed: 2017.][added: 2018.]
Our selling, general and administrative expenses, as a percentage of net sales, were [removed: 20.1% for the year ended December 31, 2018,] [added: 21.8% in 2019,] a [removed: 0.4% decrease] [added: 1.7% increase] from [removed: 20.5%] [added: 20.1%] in [removed: 2017.][added: 2018.]
[removed: While the rate of market growth has recently eased we still] [added: We] believe the long-term outlook for the housing industry is positive due to growth [removed: and trends] in the underlying demographics.
We feel we are well-positioned to take advantage of the construction activity in our markets and to increase our market share, which may include strategic [removed: acquisitions or investments in organic growth opportunities.][added: acquisitions.]
We strive to achieve the appropriate balance of short-term expense control while maintaining the expertise and capacity to grow the business as market conditions [removed: improve.][added: warrant.]
In addition, [removed: debt reduction] [added: optimization of our capital structure] will continue to be a key area of focus for the Company.
The following table sets forth the percentage relationship to [added: net] sales of certain costs, expenses and income items for the years ended December 31:
| [removed: Sales] [added: Net sales] | | | 100.0 | % | | | 100.0 | % | | [removed: | 100.0 | % |]
| Cost of sales | | | [removed: 75.1] [added: 72.8] | % | | | [removed: 75.4] [added: 75.1] | % | | [removed: | 74.9 | % |]
| Gross margin | | | [removed: 24.9] [added: 27.2] | % | | | [removed: 24.6] [added: 24.9] | % | | [removed: | 25.1 | % |]
| Selling, general and administrative expenses | | | [removed: 20.1] [added: 21.8] | % | | | [removed: 20.5] [added: 20.1] | % | | [removed: | 21.4 | % |]
| Income from operations | | | [removed: 4.8] [added: 5.4] | % | | | [removed: 4.1] [added: 4.8] | % | | [removed: | 3.7 | % |]
Debt Transactions
During the year ended December 31, 2019, the Company executed several debt transactions, including extending the maturity of our $900.0 million revolving credit facility (“2023 facility”), redemption and repurchase of $192.4 million in aggregate principal amount of our 5.625% senior secured notes due 2024 (“2024 notes”), and repayment of $406.3 million of our senior secured term loan facility due 2024 (“2024 term loan”).
The repayments of our 2024 notes and 2024 term loan were funded with the proceeds from the issuance of $475.0 million in aggregate principal amount of our 6.75% senior secured notes due 2027 (“2027 notes”) and cash on hand.
In February 2020, we completed a private offering of $550.0 million in aggregate principal amount of 5.0% unsecured senior notes due 2030 (“2030 notes”) at an issue price equal to 100% of their par value.
The proceeds from this offering were used together with borrowing under our 2023 facility to redeem the remaining $503.9 million in aggregate principal amount of 2024 notes outstanding at a redemption price of 104.2% of their par value and $47.5 million in aggregate principal amount of 2027 notes at a redemption price of 103.0% of their par value.
Collectively, these transactions have extended our debt maturity profile and reduced the amount of long-term debt outstanding.
Business Combinations
On July 1, 2019, we acquired certain assets and the operations of Sun State Components (“Sun State”) for $42.5 million in cash.
Sun State is comprised of three truss locations, which are located in Las Vegas, Nevada; Surprise, Arizona; and Kingman, Arizona.
Sun State manufactures roof trusses and floor trusses and distributes lumber and related products to residential homebuilders and commercial contractors.
On December 9, 2019, we acquired certain assets and the operations of Raney Components, LLC and Raney Construction, Inc. (collectively “Raney”) for $59.0 million in cash, subject to certain adjustments.
Located in Groveland, Florida, Raney is a vertically-integrated manufacturer and installer of residential structures for production builder customers.
Raney combines sub-contractor labor and material supply to place concrete slabs, install masonry block for exterior walls, set wall panels and roof trusses, frame interior walls and install roof decking.
On January 9, 2020, we acquired certain assets and the operations of Bianchi & Company, Inc. (“Bianchi”) for $17.2 million in cash, subject to certain adjustments.
Located in Charlotte, North Carolina, Bianchi is a supplier and installer of interior and exterior doors, crown moldings, open stair rail, chair rail, wainscoting, commercial hollow metal frames and doors and other custom millwork.
These acquisitions are described in Notes 5 and 18 to the consolidated financial statements included in Item 8 of this annual report on Form 10-K.
Retirement of President and Chief Executive Officer
On January 10, 2020, Mr. Crow notified our Board of his decision to retire as President and Chief Executive Officer of the Company during 2020 after assisting the Board in hiring his replacement.
Mr. Crow has agreed to continue with the Company in a consulting capacity for a period of time following the appointment of a new Chief Executive Officer to assist in the transition.
The Board has retained a leading global executive search firm to help identify a successor.
Commodity price deflation decreased our net sales in 2019 by an estimated 12.3%.
Excluding the impact of commodity price deflation, we achieved 6.5% net sales growth in the single-family, multi-family and repair and remodel/other end markets, primarily as a result of sales volume growth in our manufactured products and windows, doors & millwork categories.
This increase in gross margin percentage is primarily attributable to an improved product mix, the decline in the cost of commodities relative to our customer pricing commitments and continued pricing discipline.
In addition, sales growth in our value-add higher margin product categories, primarily our manufactured products and windows, doors & millwork categories, contributed to increased gross profit dollars and percentage compared to the year ended December 31, 2018.
This increase was largely due to the effects of commodity price deflation on our net sales and an increase in variable compensation related to increased sales volume and gross margin for the year ended December 31, 2019 compared to the year ended December 31, 2018.
A discussion regarding our financial condition and results of operations for the year ended December 31, 2019 compared to the year ended December 31, 2018 is presented below.
A discussion regarding our financial condition and results of operations for the year ended December 31, 2018 compared to the year ended December 31, 2017 can be found under Item 7 of Part II of our Annual Report on Form 10-K for the fiscal year ended December 31, 2018, filed with the SEC on March 1, 2019.
| | | 2019 | | | | 2018 | | | |
| --- | --- | --- | --- | --- | --- | --- | --- | --- | --- |
Commodity price deflation decreased our net sales in 2019 by an estimated 12.3%.
Excluding the impact of commodity price deflation, we achieved 6.5% sales growth in the single-family, multi-family and repair and remodel/other end markets, primarily as a result of sales volume growth in our manufactured products and windows, doors & millwork categories.
| | | 2019 | | | | | | | | 2018 | | | | | | | | | | |
The decrease in net sales in our lumber and lumber sheet goods category resulted from the impact of commodity price deflation in 2019 compared to the prior year, which offset increased volume in the category.
Our gross margin percentage increase was primarily attributable to an improved product mix, the decline in the cost of commodities relative to our customer pricing commitments and continued pricing discipline.
In addition, sales growth in our value-add higher margin product categories, primarily our manufactured products and windows, doors & millwork categories, contributed to increased gross profit dollars and percentage compared to the year ended December 31, 2018.
This increase was primarily due to increases in variable compensation related to increased sales volume and gross margin.
The increase as a percentage of net sales was also attributable to the effect of commodity price deflation on our net sales.
This decrease in interest expense is primarily due to lower outstanding debt balances in 2019 compared to 2018.
| Northeast | | $ | 1,295,643 | | | | 18.4 | % | | $ | 1,309,391 | | | | 17.5 | % | | | (1.0 | )% | | $ | 56,012 | | | | 4.3 | % | | $ | 36,354 | | | | 2.8 | % | | | 54.1 | % |
| Southeast | | | 1,610,156 | | | | 22.9 | % | | | 1,700,317 | | | | 22.7 | % | | | (5.3 | )% | | | 83,466 | | | | 5.2 | % | | | 67,465 | | | | 4.0 | % | | | 23.7 | % |
During the fourth quarter of 2018, the Company repurchased $53.6 million in aggregate principal amount of its 5.625% senior secured notes due 2024 (“2024 notes”) and in February 2019 we repurchased an additional $20.4 million in aggregate principal amount of the 2024 notes.
Following these repurchases we have $675.9 million of 2024 notes which remain outstanding.
Though the level of housing starts remains below the historical average, the homebuilding industry has shown improvement since 2011.
While the housing industry has strengthened over the past few years, the limited availability of credit to smaller homebuilders and potential homebuyers, the high cost of land development in many major metropolitan areas, the high demand for a limited supply of skilled construction labor, and increasing costs for materials and labor, among other factors, have hampered a stronger recovery.
We estimate that 6.7% of this increase is attributable to the impact of commodity price inflation on sales in 2018 compared to 2017.
Single-family and repair and remodel/other end market sales volume growth in 2018 was partially offset by declines in multi-family.
The pressure we experienced on our gross margins in the first half of 2018 due to rising commodity costs relative to our customer pricing commitments was more than offset by the sharp decline in these commodity costs during the second half of 2018.
We continue to invest in our business to improve our operating efficiency, which, along with operating leverage and disciplined cost management, has allowed us to better leverage our operating costs against changes in net sales.
This improvement was primarily driven by cost leverage.
However, this decrease was partially offset by increased commissions due to increased sales and margins as well as increased incentives and operating costs related to our profitable growth in 2018.
| | | 2018 | | | | 2017 | | | | 2016 | | |
| --- | --- | --- | --- | --- | --- | --- | --- | --- | --- | --- | --- | --- |
Net Sales.
We estimate that 6.7% of this increase is attributable to the impact of commodity price inflation on sales in 2018 compared to 2017.
Single-family and repair and remodel/other end market sales unit volume growth in 2018 was partially offset by declines in multi-family.
| | | 2018 | | | | | | | | 2017 | | | | | | | | | | |
| --- | --- | --- | --- | --- | --- | --- | --- | --- | --- | --- | --- | --- | --- | --- | --- | --- | --- | --- | --- | --- |
The impact of commodity price inflation in 2018 resulted in the sales growth of our lumber and lumber sheet goods and manufactured products categories exceeding the sales growth of our other product categories.
Gross Margin.
The pressure we experienced on our gross margins in the first half of 2018 due to rising commodity costs relative to our customer pricing commitments was more than offset by the sharp decline in these commodity costs during the second half of 2018.
Selling, General and Administrative Expenses.
Selling, general and administrative expenses increased $111.7 million, or 7.7%.
Our salaries and benefits expense was $1,021.5 million, an increase of $86.0 million from 2017, primarily due to increases in variable compensation attributable to the increase in sales as well as an increase in group health insurance costs.
Largely due to our sales growth in 2018 fuel expense increased $9.9 million, office general and administrative expenses increased $10.3 million and bad debt expense increased $3.2 million.
This improvement was primarily driven by cost leverage.
However, this decrease was partially offset by increased commissions due to increased sales and margins as well as increased incentives and operating costs related to our profitable growth in 2018.
Interest Expense, net.
Interest expense declined $88.5 million due to the positive results of our debt transactions executed in fiscal years 2018 and 2017, and was slightly offset by increased interest expense of $4.0 million on our variable rate debt instruments due to increased market interest rates in 2018 compared to 2017.
Income Tax Expense.
Due to the enactment of the 2017 Tax Act, we recorded income tax expense of $29.0 million for the year ended December 31, 2017 related to revaluation of our deferred tax assets.
Absent the effect of the 2017 Tax Act and the changes to our valuation allowance, our effective rate would have been 29.4% for the year ended December 31, 2017.
2017 Compared with 2016
Sales for the year ended December 31, 2017 were $7,034.2 million, a 10.5% increase from sales of $6,367.3 million for 2016.
We estimate that 6.2% of this increase is attributable to the impact of commodity price inflation on sales in 2017 compared to 2016.
For the year ended December 31, 2017, sales unit volume growth in single-family and the repair and remodel end market were partially offset by declines in multi-family.
The following table shows sales classified by major product category (dollars in millions):
| | | 2017 | | | | | | | | 2016 | | | | | | | | | | |
| Lumber & lumber sheet goods | | $ | 2,510.9 | | | | 35.7 | % | | $ | 2,131.4 | | | | 33.5 | % | | | 17.8 | % |
| Manufactured products | | | 1,208.5 | | | | 17.2 | % | | | 1,097.7 | | | | 17.2 | % | | | 10.1 | % |
| Windows, doors & millwork | | | 1,360.6 | | | | 19.4 | % | | | 1,286.2 | | | | 20.2 | % | | | 5.8 | % |
An excerpt. Shown here: 40 of 120 rewritten, 40 of 67 added and 40 of 114 removed. The counts are complete. For every sentence, read Item 7. Management’s Discussion and Analysis of Financial Condition and Results of Operations in the FY2019 filing and the FY2018 filing.
Item 7A. Quantitative and Qualitative Disclosures about Market Risk
6 rewritten, 0 added, 0 removed, 4 unchanged
Read the full itemFY2019 item · filed February 21, 2020FY2018 item · filed March 1, 2019
Our 2024 notes [added: and 2027 notes] bear interest at a fixed rate, therefore, our interest expense related to these notes would not be affected by an increase in market interest rates.
Borrowings under the [removed: 2022] [added: 2023] facility and the 2024 term loan bear interest at either a base rate or [removed: Eurodollar] [added: eurodollar] rate, plus, in each case, an applicable margin.
A 1.0% increase in interest rates on the [removed: 2022] [added: 2023] facility would result in approximately [removed: $1.8] [added: $0.3] million in additional interest expense annually as we had [removed: $179.0] [added: $27.0] million in outstanding borrowings as of December 31, [removed: 2018.][added: 2019.]
The [removed: 2022] [added: 2023] facility also assesses variable commitment and outstanding letter of credit fees based on quarterly average loan utilization.
A 1.0% increase in interest rates on the 2024 term loan would result in approximately [removed: $4.6] [added: $0.5] million in additional interest expense annually as of December 31, [removed: 2018.][added: 2019.]
Short-term changes in the cost of these materials and the related in-bound freight costs, some of which are subject to significant fluctuations, are [removed: sometimes,] [added: oftentimes,] but not always, passed on to our customers.
Item 1. Business
32 rewritten, 5 added, 6 removed, 238 unchanged
Read the full itemFY2019 item · filed February 21, 2020FY2018 item · filed March 1, 2019
The Company operates [removed: 401] [added: approximately 400] locations in [removed: 39] [added: 40] states across the United States.
There were only [removed: seven] [added: eight] building product suppliers with manufacturing capabilities in the Pro Segment that generated more than $500 million in sales, according to [removed: ProSales] [added: *ProSales*] magazine’s [removed: 2018] [added: 2019] ProSales 100 list.
| | • | [removed: Prefabricated components:] [added: *Prefabricated components*:] Compared to conventional “stick-build” construction where builders cut and assemble lumber at the job site with their own labor, prefabricated components are engineered in an offsite location using specialized equipment and labor. This outsourced task allows for optimal material usage, lower overall labor costs and improved quality of structural elements. In addition, using prefabricated components typically results in faster construction because fabrication can be automated and performed more systematically. As such, we believe there is a long term trend towards increased use of prefabricated components by homebuilders. |
| | • | [removed: Turn\-key services:] [added: *Turn*\-*key services*:] Many homebuilders have taken a more limited role in the homebuilding process and have outsourced certain key elements of the construction process, including process management, product selection, order input, scheduling, framing and installation. As such, we believe that many homebuilders are increasingly looking to suppliers in the Pro Segment to perform these critical functions, resulting in greater demand for integrated project services. |
| | • | [removed: Consolidation] [added: *Consolidation] of suppliers by [removed: homebuilders:] [added: homebuilders*:] We believe that homebuilders are increasingly looking to consolidate their supplier base. Many homebuilders are seeking a more strategic relationship with suppliers that are able to offer a broad range of products and services and, as a result, are allocating a greater share of wallet to a select number of larger, full service suppliers. [removed: We believe this trend continues in the current housing market recovery.] |
According to the U.S. Census Bureau, the single-family residential construction market was an estimated [removed: $285.4] [added: $289.3] billion in [removed: 2018,] [added: 2019,] which was [removed: 5.8%] [added: 5.2%] higher than [removed: 2017, though] [added: 2018, and] still down significantly from the historical high of $413.2 billion in 2006.
Further, according to the Home Improvement Research Institute [removed: (“HIRI”),] [added: (“HIRI”) in its September 2019 semi-annual forecast,] the professional repair and remodel end market was an estimated [removed: $121.9] [added: $124.6] billion in [removed: 2018,] [added: 2019,] which was [removed: 9.9%] [added: 4.5%] higher than [removed: 2017.][added: 2018.]
We have a diverse geographic footprint as we have operations in [removed: 75] [added: 77] of the top 100 U.S. Metropolitan Statistical Areas (“MSAs”), as ranked by single family housing permits based on available [removed: 2018] [added: 2019] U.S. Census data.
In addition, approximately [removed: 84%] [added: 86%] of U.S. single-family housing permits in [removed: 2018] [added: 2019] were issued in MSAs in which we operate.
For the year ended December 31, [removed: 2018,] [added: 2019,] our top 10 customers accounted for approximately [removed: 16.8%] [added: 15.3%] of [added: net] sales, and no single customer accounted for more than 5% of [added: net] sales.
Our top 10 customers are comprised primarily of the largest production homebuilders, including publicly traded companies such as D.R. Horton, Inc., Pulte Homes, Inc., Lennar Corporation, [removed: Beazer Homes USA, Inc.,] Hovnanian Enterprises, Inc., [added: and] Taylor Morrison Home [removed: Corporation and Toll Brothers, Inc.][added: Corporation.]
[added: *Windows, Doors & Millwork.*] Windows & doors are comprised of the manufacturing, assembly and distribution of windows, and the assembly and distribution of interior and exterior door units.
Millwork includes interior trim and custom [removed: features] [added: features,] including those that we manufacture under the Synboard ® brand name.
This category also includes services such as turn-key framing, shell construction, design assistance and professional installation of products spanning all [added: of] our product categories.
[added: *Windows.*] We manufacture a full line of traditional vinyl windows at an approximately 200,000 square foot manufacturing facility located in Houston, Texas.
We believe our national manufacturing footprint and differentiated capabilities will allow us to capture growth in our higher margin value-added [removed: products with single family homebuilders.][added: products.]
[removed: SALES] [added: SALES] AND [removed: MARKETING][added: MARKETING]
Throughout the construction process, the salesperson makes frequent site visits to ensure timely delivery and proper [removed: installation] [added: installation,] and to make suggestions for efficiency improvements.
At December 31, [removed: 2018,] [added: 2019,] we employed approximately 1,900 sales representatives, who are [removed: typically] paid a commission based on gross margin dollars collected and [removed: work] [added: worked] with approximately 1,600 sales coordinators and product specialists.
We currently source products from [removed: approximately 10,300] [added: thousands of] suppliers in order to reduce our dependence on any single company and to maximize purchasing leverage.
Although no purchases from any single supplier represented more than 8% of our total materials purchases for the year ended December 31, [removed: 2018,] [added: 2019,] we believe we are one of the largest customers for many suppliers, and therefore have significant purchasing leverage.
The principal methods of competition in the Pro Segment are the development of long-term relationships with professional builders and retaining such customers by (i) delivering a full range of high-quality products on time, and (ii) offering trade credit, competitive pricing and integrated service and product packages, such as turn-key framing and shell [added: construction, as well as manufactured components and installation.]
At December 31, [removed: 2018,] [added: 2019,] we had approximately [removed: 15,000] [added: 15,800] employees.
Hundreds of price lists are maintained on [added: hundreds of] thousands of SKUs, facilitating rapid price changes in a changing product cost environment.
These increases [removed: have in the past resulted] [added: may result] in negative operating cash flows during this peak season, which historically have been financed through available cash and [removed: our] borrowing availability under credit facilities.
[removed: Collection] [added: Generally, collection] of receivables and reduction in inventory levels following the peak building and construction season [removed: have in the past] positively [removed: impacted] [added: impact] cash flow.
In addition to our [removed: website] [added: website,] the SEC maintains an Internet site that contains our reports, proxy and information statements, and other information that we electronically file with, or furnish to, the SEC at www.sec.gov.
Chad Crow, President, Chief Executive Officer and Director, age [removed: 50.][added: 51.]
McAleenan, Senior Vice President and General Counsel, age [removed: 64.][added: 65.]
Mr. Robins has 30 years of experience in the building products [removed: business.][added: industry.]
[removed: David] [added: *David] E.
Rush, Senior Vice President and Chief Operating Officer – East, age [removed: 56.][added: 57*.]
Environmental, social and governance strategy
We are committed to making informed choices that improve our corporate governance, financial strength, operational efficiency, environmental stewardship, community engagement and resource management.
Consistent with our core values, our goal is to be recognized by our customers as the preferred supplier, by our employees as a safe, diverse and inclusive workforce, by the industry as being at the forefront of innovation and by our stakeholders as an ethical company.
We are working towards identifying, measuring and mapping the environmental, social and governance impacts of our business in an effort to be a good corporate citizen and proactively manage the impacts on the communities in which we serve.
Helping homebuilders become more productive and efficient is fundamental to what we do and we are passionate about building this future together.
Windows, Doors & Millwork.
Windows.
construction, as well as manufactured components and installation.
ProBuild maintained multiple ERP systems to manage its operations.
We are in the process of integrating certain of the legacy ProBuild information technology systems with ours which is an ongoing, multi-year process.
We are currently expecting to complete the planned ERP integration process in 2019.
Cover and table of contents
25 rewritten, 2 added, 4 removed, 51 unchanged
Read the full itemFY2019 item · filed February 21, 2020FY2018 item · filed March 1, 2019
| [removed: ☑] [added: ☑] | ANNUAL REPORT PURSUANT TO SECTION 13 OR 15(d) OF THE SECURITIES EXCHANGE ACT OF 1934 |
For the fiscal year ended December 31, [removed: 2018][added: 2019]
| [removed: ☐] [added: ☐] | TRANSITION REPORT PURSUANT TO SECTION 13 OR 15(d) OF THE SECURITIES EXCHANGE ACT OF 1934 |
[removed: BUILDERS] [added: BUILDERS] FIRSTSOURCE, [removed: INC.][added: INC.]
| Title of Each Class | [added: Trading Symbol(s)] | Name of [added: Each] Exchange on Which Registered |
| Common stock, par value $0.01 per share | [added: BLDR] | NASDAQ Stock Market LLC |
| Large accelerated filer ☑ | | Accelerated filer ☐ | | Non-accelerated filer ☐ | | Smaller reporting company ☐ | [added: |]
| Emerging growth company ☐ | | | | | | | [added: |]
The aggregate market value of the registrant’s common stock held by non-affiliates of the registrant as of June 30, [removed: 2018] [added: 2019] was approximately [removed: $2,058.5] [added: $1,920.7] million based on the closing price per share on that date of [removed: $18.29] [added: $16.86] as reported on the NASDAQ Stock Market LLC.
The number of shares of the registrant’s common stock, par value $0.01, outstanding as of February [removed: 26, 2019] [added: 19, 2020] was [removed: 115,359,616.][added: 116,130,284.]
Portions of the registrant’s definitive proxy statement for its annual meeting of stockholders to be held on May [removed: 22, 2019] [added: 21, 2020] are incorporated by reference into Part II and Part III of this Form 10-K.
| Item 2. | | [Properties](#Item_2_Properties) | | [removed: 20] [added: 19] |
| Item 6. | | [Selected Financial Data](#Item_6) | | [removed: 23] [added: 22] |
| Item 7. | | [Management’s Discussion and Analysis of Financial Condition and Results of [removed: Operations](#Item_7)] [added: Operations](#ITEM_7_MANAGEMENTS_DISCUSSION_ANALYSIS_F)] | | [removed: 24] [added: 23] |
| Item 7A. | | [Quantitative and Qualitative Disclosures About Market Risk](#Item_7A) | | [removed: 34] [added: 31] |
| Item 8. | | [Financial Statements and Supplementary Data](#Item_8) | | [removed: 35] [added: 32] |
| Item 9. | | [Changes in and Disagreements with Accountants on Accounting and Financial Disclosure](#Item_9) | | [removed: 66] [added: 65] |
| Item 9A. | | [Controls and Procedures](#Item_9A) | | [removed: 66] [added: 65] |
| Item 9B. | | [Other Information](#Item_9B) | | [removed: 67] [added: 66] |
| Item 10. | | [Directors, Executive Officers and Corporate Governance](#Item_10_Directors_Executive_Officers) | | [removed: 68] [added: 67] |
| Item 11. | | [Executive Compensation](#Item_11_Executive_Compensation) | | [removed: 68] [added: 67] |
| Item 12. | | [Security Ownership of Certain Beneficial Owners and Management and Related Stockholder Matters](#Item_12) | | [removed: 68] [added: 67] |
| Item 13. | | [Certain Relationships and Related Transactions, and Director Independence](#Item_13) | | [removed: 69] [added: 68] |
| Item 14. | | [Principal Accountant Fees and Services](#Item_14) | | [removed: 69] [added: 68] |
| Item 15. | | [Exhibits and Financial Statement Schedules](#ITEM_15_EXHIBITS_FINANCIAL_STATEMENT_SCH) | | [removed: 70] [added: 69] |
| --- | --- | --- | --- | --- | --- | --- | --- |
PART I
10-K 1 bldr-10k_20181231.htm 10-K
Indicate by check mark if disclosure of delinquent filers pursuant to Item 405 of Regulation S-K is not contained herein, and will not be contained, to the best of registrant’s knowledge, in definitive proxy or information statements incorporated by reference in Part III of this Form 10-K or any amendment to this Form 10-K.
| --- | --- | --- | --- | --- | --- | --- |
PART I
Item 2. Properties
4 rewritten, 0 added, 0 removed, 15 unchanged
Read the full itemFY2019 item · filed February 21, 2020FY2018 item · filed March 1, 2019
We have a broad network of distribution and manufacturing facilities in [removed: 39] [added: 40] states throughout the U.S. Based on available 2018 U.S. Census data, we have operations in [removed: 75] [added: 77] of the top 100 U.S. Metropolitan Statistical Areas, as ranked by single family housing permits in 2018.
We contractually lease [removed: 311] [added: approximately 310] facilities and own [added: approximately] 90 facilities.
As described in Note [removed: 9] [added: 10] to the consolidated financial statements included in Item 8 of this annual report on Form 10-K, [removed: 140] [added: 139] of our leased facilities are subject to a sales-lease back transaction that is accounted for in our financial statements as owned assets with offsetting financing obligations.
We operate a fleet of approximately [removed: 10,700] [added: 11,000] rolling stock units, which includes approximately 4,500 trucks [added: and 4,500 forklifts] as well as [removed: forklifts and] trailers to deliver products from our distribution and manufacturing centers to our [removed: customer’s] [added: customers’] job sites.
Item 4. Mine Safety Disclosures
0 rewritten, 1 added, 1 removed, 1 unchanged
Read the full itemFY2019 item · filed February 21, 2020FY2018 item · filed March 1, 2019
PART II
PART II
Item 5. Market for Registrant’s Common Equity, Related Stockholder Matters and Issuer Purchases of Equity Securities
4 rewritten, 5 added, 14 removed, 7 unchanged
Read the full itemFY2019 item · filed February 21, 2020FY2018 item · filed March 1, 2019
The approximate number of stockholders of record of our common stock as of February [removed: 26, 2019] [added: 19, 2020] was [removed: 89.][added: 70.]
The graph assumes that the value of the investment in our common stock, in each index, and in the peer group (including reinvestment of dividends) was $100 on [removed: 12/31/2013] [added: 12/31/2014] and tracks it through [removed: 12/31/2018.][added: 12/31/2019.]
[removed: 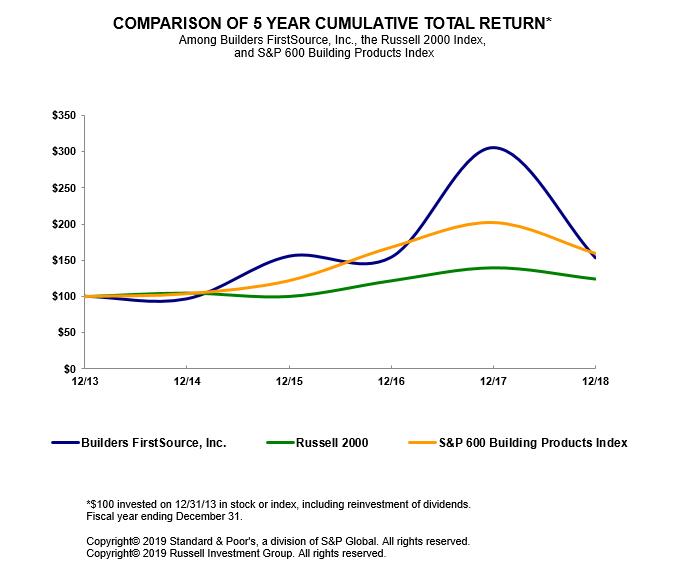][added: 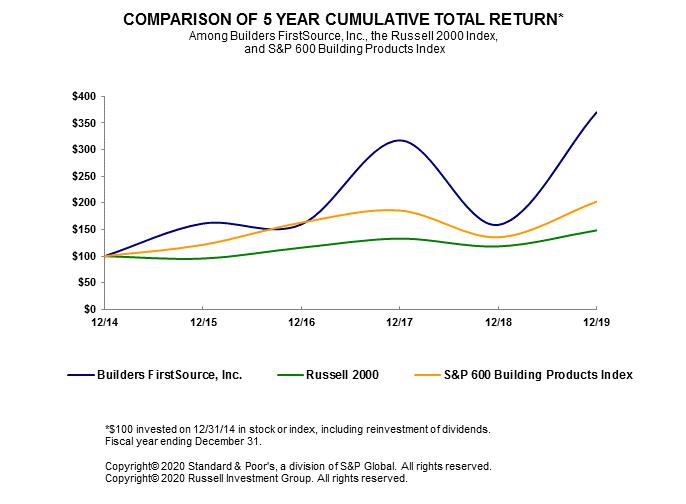]
The information regarding securities authorized for issuance under equity compensation plans appears in our definitive proxy statement for our annual meeting of stockholders to be held on May [removed: 22, 2019] [added: 21, 2020] under the caption “Equity Compensation Plan Information,” which information is incorporated herein by reference.
| | | 12/14 | | | | 12/15 | | | | 12/16 | | | | 12/17 | | | | 12/18 | | | | 12/19 | |
| --- | --- | --- | --- | --- | --- | --- | --- | --- | --- | --- | --- | --- | --- | --- | --- | --- | --- | --- | --- | --- | --- | --- | --- |
| Builders FirstSource, Inc. | | | 100.00 | | | | 161.28 | | | | 159.68 | | | | 317.18 | | | | 158.81 | | | | 369.87 |
| Russell 2000 | | | 100.00 | | | | 95.59 | | | | 115.95 | | | | 132.94 | | | | 118.30 | | | | 148.49 |
| S&P 600 Building Products Index | | | 100.00 | | | | 121.42 | | | | 162.96 | | | | 185.64 | | | | 135.56 | | | | 202.37 |
Company Stock Repurchases
The following table provides information with respect to our purchases of Builders FirstSource, Inc. common stock during the fourth quarter of fiscal year 2018:
| Period | | Total Number of Shares Purchased | | | | Average Price Paid per Share | | | | Total Number of Shares Purchased as Part of Publicly Announced Plans or Programs | | | | Maximum Number of Shares That May Yet be Purchased Under the Plans or Programs | | |
| --- | --- | --- | --- | --- | --- | --- | --- | --- | --- | --- | --- | --- | --- | --- | --- | --- |
| October 1, 2018 — October 31, 2018 | | | 3,221 | | | $ | 12.38 | | | | — | | | | — | |
| November 1, 2018 — November 30, 2018 | | | — | | | | — | | | | — | | | | — | |
| December 1, 2018 — December 31, 2018 | | | — | | | | — | | | | — | | | | — | |
| Total | | | 3,221 | | | $ | 12.38 | | | | — | | | | — | |
The shares presented in the above table represent stock tendered in order to meet tax withholding requirements for restricted stock units vested.
| | | 12/13 | | | | 12/14 | | | | 12/15 | | | | 12/16 | | | | 12/17 | | | | 12/18 | | |
| --- | --- | --- | --- | --- | --- | --- | --- | --- | --- | --- | --- | --- | --- | --- | --- | --- | --- | --- | --- | --- | --- | --- | --- | --- |
| Builders FirstSource, Inc. | | | 100.00 | | | | 96.35 | | | | 155.40 | | | | 153.86 | | | | 305.61 | | | | 153.02 | |
| Russell 2000 | | | 100.00 | | | | 104.89 | | | | 100.26 | | | | 121.63 | | | | 139.44 | | | | 124.09 | |
| S&P 600 Building Products Index | | | 100.00 | | | | 103.82 | | | | 121.71 | | | | 167.53 | | | | 201.53 | | | | 159.09 | |
Item 6. Selected Financial Data
17 rewritten, 2 added, 0 removed, 10 unchanged
Read the full itemFY2019 item · filed February 21, 2020FY2018 item · filed March 1, 2019
The following selected consolidated financial data for the years ended December 31, [removed: 2018, 2017] [added: 2019, 2018] and [removed: 2016] [added: 2017] and as of December 31, [removed: 2018] [added: 2019] and [removed: 2017] [added: 2018] were derived from our consolidated financial statements which are included in Item 8 of this annual report on Form 10-K.
Selected consolidated financial data as of December 31, [removed: 2016] [added: 2017] and as of and for the years ended December 31, [removed: 2015] [added: 2016] and [removed: 2014] [added: 2015] were derived from our consolidated financial statements, but are not included herein.
| | | [removed: 2018] [added: 2019] | | | | [removed: 2017] [added: 2018] | | | | [removed: 2016] [added: 2017] | | | | [removed: 2015] [added: 2016] | | | | [removed: 2014] [added: 2015] | | | |
| [removed: Sales] [added: Net sales] (1) | | $ | [removed: 7,724,771] [added: 7,280,431] | | | $ | [removed: 7,034,209] [added: 7,724,771] | | | $ | [removed: 6,367,284] [added: 7,034,209] | | | $ | [removed: 3,564,425] [added: 6,367,284] | | | $ | [removed: 1,604,096] [added: 3,564,425] | | |
| Gross margin | | | [removed: 1,922,940] [added: 1,976,829] | | | | [removed: 1,727,391] [added: 1,922,940] | | | | [removed: 1,596,748] [added: 1,727,391] | | | | [removed: 901,458] [added: 1,596,748] | | | | [removed: 356,997] [added: 901,458] | | |
| Selling, general and administrative expenses | | | [removed: 1,553,972] [added: 1,584,523] | | | | [removed: 1,442,288] [added: 1,553,972] | | | | [removed: 1,360,412] [added: 1,442,288] | | | | [removed: 810,703] [added: 1,360,412] | | | | [removed: 307,387] [added: 810,703] | | |
| Net income (loss) (2)(3) | | | [added: 221,809 | | | |] 205,191 | | | | 38,781 | | | | 144,341 | | | | (22,831 | ) | | [removed: | 18,150 | | |]
| Net income (loss) per share — basic | | $ | [removed: 1.79] [added: 1.92] | | | $ | [removed: 0.34] [added: 1.79] | | | $ | [removed: 1.30] [added: 0.34] | | | $ | [removed: (0.22] [added: 1.30] | [removed: )] | | $ | [removed: 0.19] [added: (0.22] | [added: )] | |
| Net income (loss) per share — diluted | | $ | [removed: 1.76] [added: 1.90] | | | $ | [removed: 0.34] [added: 1.76] | | | $ | [removed: 1.27] [added: 0.34] | | | $ | [removed: (0.22] [added: 1.27] | [removed: )] | | $ | [removed: 0.18] [added: (0.22] | [added: )] | |
| Cash and cash equivalents | | $ | [removed: 10,127] [added: 14,096] | | | $ | [removed: 57,533] [added: 10,127] | | | $ | [removed: 14,449] [added: 57,533] | | | $ | [removed: 65,063] [added: 14,449] | | | $ | [removed: 17,773] [added: 65,063] | | |
| Total assets [added: (4)] | | | [removed: 2,932,309] [added: 3,249,490] | | | | [removed: 3,006,124] [added: 2,932,309] | | | | [removed: 2,909,887] [added: 3,006,124] | | | | [removed: 2,882,038] [added: 2,909,887] | | | | [removed: 574,065] [added: 2,882,038] | | |
| Total debt (including current portion) | | | [removed: 1,561,294] [added: 1,291,273] | | | | [removed: 1,784,420] [added: 1,561,294] | | | | [removed: 1,802,052] [added: 1,784,420] | | | | [removed: 1,951,671] [added: 1,802,052] | | | | [removed: 374,903] [added: 1,951,671] | | |
| Stockholders’ equity | | | [removed: 596,338] [added: 824,953] | | | | [removed: 376,209] [added: 596,338] | | | | [removed: 309,620] [added: 376,209] | | | | [removed: 149,195] [added: 309,620] | | | | [removed: 40,200] [added: 149,195] | | |
| Depreciation and amortization | | $ | [removed: 97,906] [added: 100,038] | | | $ | [removed: 92,993] [added: 97,906] | | | $ | [removed: 109,793] [added: 92,993] | | | $ | [removed: 58,280] [added: 109,793] | | | $ | [removed: 9,519] [added: 58,280] | | |
| [removed: (1)] [added: (4)] | As discussed in Note 2 to the consolidated financial statements included in Item 8 of this annual report on Form 10-K we adopted updated [removed: revenue recognition] guidance [added: relating to leases] using the modified retrospective method as of January 1, [removed: 2018.] [added: 2019.] As such, periods prior to the adoption date have not been restated and continue to be presented in accordance with previous guidance. |
| (2) | As discussed in Note [removed: 11] [added: 12] to the consolidated financial statements included in Item 8 of this annual report on Form 10-K, net income for the year ended December 31, 2017 includes $29.0 million in income tax expense attributable to revaluation of our net deferred tax assets resulting from the enactment of the 2017 Tax Act. Net income for the year ended December 31, 2016 includes a reduction to our valuation allowance of $131.7 million as we released the valuation allowance against our net federal and certain state deferred tax assets in that period. Net loss for the year ended December 31, 2015 includes a valuation allowance of $9.7 million against primarily all of our deferred tax assets. [removed: Net income for the year ended December 31, 2014 includes a reduction to our valuation allowance of $7.2 million due to the utilization of net operating loss carryforwards to reduce taxable income.] |
| (3) | Net income for the year ended December 31, [added: 2019 includes net losses on debt extinguishment and other financing costs of $10.2 million. Net income for the year ended December 31,] 2018 includes a [added: net] gain on debt extinguishment of $3.2 million. Net income for the [removed: years] [added: year] ended December 31, 2017 [removed: and 2016] includes [added: net] losses on debt extinguishment and other financing costs of $58.7 [removed: million and $56.9 million, respectively, resulting from multiple debt transactions executed in 2017 and 2016.] [added: million.] Our [removed: 2018, 2017] [added: 2019, 2018] and [removed: 2016] [added: 2017] debt transactions are discussed in detail in Note [removed: 8] [added: 9] to the consolidated financial statements included in Item 8 of this annual report on Form 10-K. Net [added: income for the year ended December 31, 2016 includes net losses on debt extinguishment and other financing costs of $56.9 million. Net] loss for the year ended December 31, 2015 includes $38.6 million of acquisition and transaction related costs associated with the ProBuild acquisition, including $13.2 million in commitment fees related to bridge and backstop financing facilities incurred in connection with the financing of the ProBuild acquisition. In addition, net loss for the year ended December 31, 2015 also includes $10.3 million related to non-cash interest expense from the amortization of debt discount and deferred loan costs, and fair value adjustments related to previously outstanding stock warrants. |
| (1) | We adopted updated revenue recognition guidance using the modified retrospective method as of January 1, 2018. As such, periods prior to the adoption date have not been restated and continue to be presented in accordance with previous guidance. |
| --- | --- |
Item 8. Financial Statements and Supplementary Data
402 rewritten, 308 added, 198 removed, 451 unchanged
Read the full itemFY2019 item · filed February 21, 2020FY2018 item · filed March 1, 2019
| [Report of Independent Registered Public Accounting Firm](#REPORT_INDEPENDENT_REGISTERED_PUBLIC_ACC) | | [removed: 36] [added: 33] |
| [Consolidated Statement of Operations and Comprehensive Income for the years ended December 31, [removed: 2018, 2017] [added: 2019, 2018] and [removed: 2016](#COMPREHENSIVE_LOSS)] [added: 2017](#COMPREHENSIVE_LOSS)] | | [removed: 38] [added: 35] |
| [Consolidated Balance Sheet at December 31, [removed: 2018] [added: 2019] and [removed: 2017](#BALANCE_SHEETS)] [added: 2018](#BALANCE_SHEETS)] | | [removed: 39] [added: 36] |
| [Consolidated Statement of Cash Flows for the years ended December 31, [removed: 2018, 2017] [added: 2019, 2018] and [removed: 2016](#CASH_FLOWS)] [added: 2017](#CASH_FLOWS)] | | [removed: 40] [added: 37] |
| [Consolidated Statement of Changes in Stockholders’ Equity for the years ended December 31, [removed: 2018, 2017] [added: 2019, 2018] and [removed: 2016](#STOCKHOLDERS_EQUITY)] [added: 2017](#STOCKHOLDERS_EQUITY)] | | [removed: 41] [added: 38] |
| [Notes to Consolidated Financial Statements](#NOTES_TO) | | [removed: 42] [added: 39] |
We have audited the accompanying consolidated balance [removed: sheets] [added: sheet] of Builders FirstSource, Inc. and its subsidiaries (the “Company”) as of December 31, [removed: 2018] [added: 2019] and [removed: 2017,] [added: 2018,] and the related consolidated statements of operations and comprehensive income, of changes in stockholders’ equity and of cash flows for each of the three years in the period ended December 31, [removed: 2018,] [added: 2019,] including the related notes (collectively referred to as the “consolidated financial statements”).
We also have audited the Company's internal control over financial reporting as of December 31, [removed: 2018,] [added: 2019,] based on criteria established in [removed: Internal] [added: *Internal] Control - Integrated [removed: Framework] [added: Framework*] (2013) issued by the Committee of Sponsoring Organizations of the Treadway Commission (COSO).
In our opinion, the consolidated financial statements referred to above present fairly, in all material respects, the financial position of the Company as of December 31, [removed: 2018] [added: 2019] and [removed: 2017,] [added: 2018,] and the results of its operations and its cash flows for each of the three years in the period ended December 31, [removed: 2018] [added: 2019] in conformity with accounting principles generally accepted in the United States of America.
Also in our opinion, the Company maintained, in all material respects, effective internal control over financial reporting as of December 31, [removed: 2018,] [added: 2019,] based on criteria established in [removed: Internal] [added: *Internal] Control - Integrated [removed: Framework] [added: Framework*] (2013) issued by the COSO.
We are a public accounting firm registered with the Public Company Accounting Oversight Board (United States) [removed: ("PCAOB")] [added: (PCAOB)] and are required to be independent with respect to the Company in accordance with the U.S. federal securities laws and the applicable rules and regulations of the Securities and Exchange Commission and the PCAOB.
[removed: BUILDERS] [added: BUILDERS] FIRSTSOURCE, INC. AND [removed: SUBSIDIARIES][added: SUBSIDIARIES]
| | | [removed: 2018] [added: 2019] | | | | [removed: 2017] [added: 2018] | | | | [removed: 2016] [added: 2017] | | |
| [removed: Sales] [added: Net sales] | | $ | [removed: 7,724,771] [added: 7,280,431] | | | $ | [removed: 7,034,209] [added: 7,724,771] | | | $ | [removed: 6,367,284] [added: 7,034,209] | |
| Cost of sales | | | [removed: 5,801,831] [added: 5,303,602] | | | | [removed: 5,306,818] [added: 5,801,831] | | | | [removed: 4,770,536] [added: 5,306,818] | |
| Gross margin | | | [removed: 1,922,940] [added: 1,976,829] | | | | [removed: 1,727,391] [added: 1,922,940] | | | | [removed: 1,596,748] [added: 1,727,391] | |
| Selling, general and administrative expenses | | | [removed: 1,553,972] [added: 1,584,523] | | | | [removed: 1,442,288] [added: 1,553,972] | | | | [removed: 1,360,412] [added: 1,442,288] | |
| Income from operations | | | [removed: 368,968] [added: 392,306] | | | | [removed: 285,103] [added: 368,968] | | | | [removed: 236,336] [added: 285,103] | |
| Interest expense, net | | | [removed: 108,213] [added: 109,551] | | | | [removed: 193,174] [added: 108,213] | | | | [removed: 214,667] [added: 193,174] | |
| Income before income taxes | | | [removed: 260,755] [added: 282,755] | | | | [removed: 91,929] [added: 260,755] | | | | [removed: 21,669] [added: 91,929] | |
| Income tax expense [removed: (benefit)] | | | [removed: 55,564] [added: 60,946] | | | | [removed: 53,148] [added: 55,564] | | | | [removed: (122,672] [added: 53,148] | [removed: )] |
| Net income | | [removed: $] [added: —] | [removed: 205,191] | | | [removed: $] [added: —] | [removed: 38,781] | | | [removed: $] [added: —] | [removed: 144,341] | | [added: | 205,191 | | | | 205,191 | | | |]
| Comprehensive income | | $ | [removed: 205,191] [added: 221,809] | | | $ | [removed: 38,781] [added: 205,191] | | | $ | [removed: 144,341] [added: 38,781] | |
| Basic | | $ | [removed: 1.79] [added: 1.92] | | | $ | [removed: 0.34] [added: 1.79] | | | $ | [removed: 1.30] [added: 0.34] | |
| Diluted | | $ | [removed: 1.76] [added: 1.90] | | | $ | [removed: 0.34] [added: 1.76] | | | $ | [removed: 1.27] [added: 0.34] | |
| Basic | | | [removed: 114,586] [added: 115,713] | | | | [removed: 112,587] [added: 114,586] | | | | [removed: 110,754] [added: 112,587] | |
| Diluted | | | [removed: 116,554] [added: 117,025] | | | | [removed: 115,597] [added: 116,554] | | | | [removed: 113,585] [added: 115,597] | |
[removed: BUILDERS] [added: BUILDERS] FIRSTSOURCE, INC. AND [removed: SUBSIDIARIES][added: SUBSIDIARIES]
| | | [added: 2019 | | | |] 2018 | | | | 2017 | | |
| Cash and cash equivalents | | $ | [removed: 10,127] [added: 14,096] | | | $ | [removed: 57,533] [added: 10,127] | |
| Accounts receivable, less allowances of [removed: $13,054] [added: $13,492] and [removed: $11,771] [added: $13,054] at December 31, [removed: 2018] [added: 2019] and [removed: 2017,] [added: 2018,] respectively | | | [removed: 654,170] [added: 614,946] | | | | [removed: 631,992] [added: 654,170] | |
| Other receivables | | | [removed: 68,637] [added: 77,447] | | | | [removed: 71,232] [added: 68,637] | |
| Inventories, net | | | [removed: 596,896] [added: 561,255] | | | | [removed: 601,547] [added: 596,896] | |
| Other current assets | | | [removed: 43,921] [added: 39,123] | | | | [removed: 33,564] [added: 43,921] | |
| Total current assets | | | [removed: 1,373,751] [added: 1,306,867] | | | | [removed: 1,395,868] [added: 1,373,751] | |
| Property, plant and equipment, net | | | [removed: 670,075] [added: 721,887] | | | | [removed: 639,303] [added: 670,075] | |
| Goodwill | | | [removed: 740,411] [added: 769,022] | | | | 740,411 | |
| Intangible assets, net | | | [removed: 103,154] [added: 128,388] | | | | [removed: 132,567] [added: 103,154] | |
| Deferred income taxes | | | [removed: 22,766] [added: 8,417] | | | | [removed: 75,105] [added: 22,766] | |
| Other assets, net | | | [removed: 22,152] [added: 22,225] | | | | [removed: 22,870] [added: 22,152] | |
Change in Accounting Principle
As discussed in Note 2 to the consolidated financial statements, the Company changed the manner in which it accounts for leases in 2019.
Critical Audit Matters
The critical audit matter communicated below is a matter arising from the current period audit of the consolidated financial statements that was communicated or required to be communicated to the audit committee and that (i) relates to accounts or disclosures that are material to the consolidated financial statements and (ii) involved our especially challenging, subjective, or complex judgments.
The communication of critical audit matters does not alter in any way our opinion on the consolidated financial statements, taken as a whole, and we are not, by communicating the critical audit matter below, providing a separate opinion on the critical audit matter or on the accounts or disclosures to which it relates.
Goodwill Quantitative Impairment Test
As described in Notes 2 and 6 to the consolidated financial statements, the Company’s consolidated goodwill balance was $769.0 million as of December 31, 2019, and $77.1 million of the goodwill balance was assessed utilizing a quantitative assessment.
The principal considerations for our determination that performing procedures relating to the goodwill quantitative impairment test is a critical audit matter are there was significant judgment by management when determining the fair value of any reporting unit where a goodwill quantitative impairment test was performed.
This in turn led to a high degree of auditor judgment, subjectivity and effort in performing procedures and evaluating management’s future cash flows, including the significant assumptions for the terminal value, expected future revenues and profitability.
In addition, the audit effort involved the use of professionals with specialized skill and knowledge to assist in performing these procedures and evaluating audit evidence obtained.
Addressing the matter involved performing procedures and evaluating audit evidence in connection with forming our overall opinion on the consolidated financial statements.
These procedures included testing the effectiveness of controls relating to management’s goodwill impairment test, including management’s controls over the goodwill quantitative impairment test.
These procedures also included, among others, testing management’s process for determining the fair value of any reporting unit where a goodwill quantitative impairment test was performed, evaluating the appropriateness of the discounted cash flow methodology, testing the completeness, accuracy, and relevance of underlying data used in the valuation methodology, and evaluating the significant assumptions used by management, including the terminal value, expected future revenues and profitability.
Evaluating management’s assumptions related to the expected future revenues and profitability involved evaluating whether the assumptions used were reasonable considering the past performance of the reporting unit and whether these assumptions were consistent with evidence obtained in other areas of the audit.
Professionals with specialized skill and knowledge were used to assist in evaluating the appropriateness of the valuation method used and the reasonableness of certain significant assumptions, including the terminal value.
February 21, 2020
| Operating lease right-of-use assets, net | | | 292,684 | | | | — | |
| Current portion of operating lease liabilities | | | 61,653 | | | | — | |
| Noncurrent portion of operating lease liabilities | | | 236,948 | | | | — | |
| Deferred income taxes | | | 36,645 | | | | — | |
| Retained earnings | | | 248,837 | | | | 34,966 | |
| --- | --- | --- | --- | --- | --- | --- | --- | --- | --- | --- | --- | --- | --- | --- | --- | --- | --- | --- | --- | --- | --- |
| Shares withheld for restricted stock units vested | | (213 | ) | | | (2 | ) | | | (2,642 | ) | | | — | | | | (2,644 | | | ) |
| Shares withheld for restricted stock units vested | | (239 | ) | | | (2 | ) | | | (4,893 | ) | | | — | | | | (4,895 | | | ) |
| Shares withheld for restricted stock units vested | | (196 | ) | | | (2 | ) | | | (2,448 | ) | | | — | | | | (2,450 | | | ) |
| Repurchase of common stock (1) | | (460 | ) | | | (4 | ) | | | — | | | | (7,938 | ) | | | (7,942 | | | ) |
| Exercise of stock options | | 895 | | | | 9 | | | | 4,950 | | | | — | | | | 4,959 | | | |
| Net income | | — | | | | — | | | | — | | | | 221,809 | | | | 221,809 | | | |
| Balance at December 31, 2019 | | 116,052 | | | $ | 1,161 | | | $ | 574,955 | | | $ | 248,837 | | | $ | 824,953 | | | |
| (1) | During the year ended December 31, 2019, we repurchased and retired 460,000 shares of our common stock, at an average price of $17.24 per share, for $7.9 million pursuant to the repurchase program authorized by our board of directors in February 2019. The primary purpose of the repurchase program is to offset all, or a significant portion, of the dilution from employee stock awards. |
| | | 2019 | | | | 2018 | | |
Leases
These leases typically have initial terms ranging from one to 15 years.
Many of our leases contain renewal options which are exercisable at our discretion.
These renewal options generally have terms ranging from one to five years.
We determine if an arrangement is a lease at the inception of the arrangement.
Lease liabilities are recognized based on the present value of lease payments over the lease term at the arrangement’s commencement date.
Right-of-use assets are recognized based on the amount of the measurement of the lease liability adjusted for any lease payments made to the lessor at or before the commencement date, minus any lease incentives received and any initial direct costs incurred.
Renewal options are included in the calculation of our right-of-use assets and lease liabilities when it is determined that they are reasonably certain of exercise based on an analysis of the relevant facts and circumstances.
As the implicit rate of return of our lease agreements is usually not readily determinable, we generally use our incremental borrowing rate in determining the present value of lease payments.
| --- | --- | --- |
March 1, 2019
| --- | --- | --- | --- | --- | --- | --- | --- | --- | --- | --- | --- | --- |
| Retained earnings (accumulated deficit) | | | 34,966 | | | | (171,693 | ) |
| --- | --- | --- | --- | --- | --- | --- | --- | --- | --- | --- | --- | --- |
| Payment of original issue discount | | | — | | | | — | | | | (1,259 | ) |
| Proceeds from issuance of notes | | | — | | | | — | | | | 750,000 | |
| | | | | | | | | | | | | | | | | | | | | |
| | | (In thousands) | | | | | | | | | | | | | | | | | | |
| Balance at December 31, 2015 | | | 109,726 | | | $ | 1,097 | | | $ | 511,802 | | | $ | (363,704 | ) | | $ | 149,195 | |
| Exercise of stock options | | | 1,496 | | | | 15 | | | | 6,612 | | | | — | | | | 6,627 | |
| Repurchase of common stock | | | (163 | ) | | | (2 | ) | | | (1,090 | ) | | | — | | | | (1,092 | ) |
| Repurchase of common stock | | | (213 | ) | | | (2 | ) | | | (2,642 | ) | | | — | | | | (2,644 | ) |
| Repurchase of common stock | | | (239 | ) | | | (2 | ) | | | (4,893 | ) | | | — | | | | (4,895 | ) |
| | | (In thousands) | | | | | | |
| | | (In thousands) | | | | | | | | | | |
For the purpose of computing diluted EPS, weighted average shares outstanding have been adjusted for common shares underlying 1,332,000 options to purchase common stock and 1,964,000 restricted stock units (“RSUs”) outstanding as of December 31, 2018.
Weighted average shares outstanding have been adjusted for common shares underlying 2,104,000 options and 2,249,000 RSUs outstanding as of December 31, 2017 and 3,515,000 options and 2,177,000 RSUs outstanding as of December, 31, 2016.
| --- | --- | --- | --- | --- | --- |
| Risk-free rate | | 2.20% | | | 1.41% |
In August 2018, the Financial Accounting Standards Board (“FASB”) issued an update to the existing guidance under the Intangibles-Goodwill and Other topic of the Accounting Standards Codification (“Codification”) which aligns the requirements for capitalizing implementation costs of a cloud computing arrangement service contract with the requirements for capitalizing implementation costs incurred for an internal-use software license.
This guidance permits either prospective or retrospective adoption.
In the third quarter of 2018, we elected to adopt this guidance on a prospective basis.
As such, implementation costs related to cloud computing arrangements will now be capitalized and amortized on a straight-line basis over the term of the associated agreement.
In May 2017, the FASB issued an update to the existing guidance under the Compensation-Stock Compensation topic of the Codification to clarify when modification accounting would be applied for a change to the terms or conditions of a share-based award.
Under this new guidance modification accounting is required only if the fair value, the vesting conditions, or the classification of the award changes as a result of the change in terms or conditions.
This guidance was required to be adopted on a prospective basis for annual periods beginning on or after December 15, 2017.
As such, the Company adopted this guidance on January 1, 2018.
The adoption of this guidance did not have an impact on our financial statements.
This update revises the definition of a business.
Under this guidance when substantially all of the assets acquired are concentrated in a single asset (or group of similar assets) the assets acquired would not be considered a business.
If this initial screen is met, the need for further assessment is eliminated.
If this screen is not met, in order to be considered a business an acquisition would have to include an input and a substantive process that together significantly contribute to the ability to create outputs.
As such, the Company adopted this guidance on January 1, 2018.
The adoption of this guidance did not have an impact on our financial statements.
This update is effective for public companies for annual and interim periods beginning after December 15, 2019, with early adoption permitted for annual and interim periods beginning after December 15, 2018.
This update is effective for public companies for fiscal years beginning after December 15, 2018, including interim periods within those fiscal years, with early adoption permitted.
We have assessed and updated our business processes, systems and controls to ensure compliance with the accounting and disclosure requirements of the new standard upon adoption.
The Company has a significant number of leases, primarily related to real estate and rolling stock, which are primarily accounted for as operating leases under existing guidance.
The adoption of this new guidance will result in a material impact to our balance sheet in the range of approximately $250.0 million to $300.0 million related to the establishment of operating lease liabilities and the corresponding operating lease right-of-use assets.
An excerpt. Shown here: 40 of 402 rewritten, 40 of 308 added and 40 of 198 removed. The counts are complete. For every sentence, read Item 8. Financial Statements and Supplementary Data in the FY2019 filing and the FY2018 filing.
Item 9A. Controls and Procedures
5 rewritten, 0 added, 0 removed, 24 unchanged
Read the full itemFY2019 item · filed February 21, 2020FY2018 item · filed March 1, 2019
Based on the required evaluation of our disclosure controls and procedures, our CEO and CFO have concluded that, as of December 31, [removed: 2018,] [added: 2019,] we maintained disclosure controls and procedures that were effective in providing reasonable assurance that information required to be disclosed by us in the reports that we file or submit under the Exchange Act is recorded, processed, summarized and reported within the time periods specified in the SEC’s rules and forms, and that such information is accumulated and communicated to our management, including our CEO and CFO, as appropriate, to allow timely decisions regarding required disclosure.
Under the supervision and with the participation of our management, including our CEO and CFO, we conducted an evaluation of the effectiveness of our internal control over financial reporting based on the framework set forth in [removed: Internal] [added: *Internal] Control — Integrated Framework [removed: (2013)] [added: (2013*)] issued by the Committee of Sponsoring Organizations of the Treadway Commission.
Based on our evaluation under the framework set forth in [removed: Internal] [added: *Internal] Control — Integrated Framework [removed: (2013),] [added: (2013)*,] our management concluded that our internal control over financial reporting was effective as of December 31, [removed: 2018.][added: 2019.]
The effectiveness of the Company’s internal control over financial reporting as of December 31, [removed: 2018,] [added: 2019,] has been audited by PricewaterhouseCoopers LLP, an independent registered public accounting firm, as stated in their report which appears herein.
During the quarter ended December 31, [removed: 2018,] [added: 2019,] there were no changes in our internal control over financial reporting that have materially affected, or are reasonably likely to materially affect, our internal control over financial reporting.
Item 9B. Other Information
0 rewritten, 1 added, 1 removed, 1 unchanged
Read the full itemFY2019 item · filed February 21, 2020FY2018 item · filed March 1, 2019
PART III
PART III
Item 10. Directors, Executive Officers and Corporate Governance
1 rewritten, 0 added, 0 removed, 16 unchanged
Read the full itemFY2019 item · filed February 21, 2020FY2018 item · filed March 1, 2019
The information required by this item appears in our definitive proxy statement for our annual meeting of stockholders to be held May [removed: 22, 2019] [added: 21, 2020] under the captions “Proposal 1 — Election of Directors,” “Continuing Directors,” “Information Regarding the Board and Its Committees,” “Corporate Governance,” “Section 16(a) Beneficial Ownership Reporting Compliance,” and “Executive Officers of the Registrant,” which information is incorporated herein by reference.
Item 11. Executive Compensation
1 rewritten, 0 added, 0 removed, 0 unchanged
Read the full itemFY2019 item · filed February 21, 2020FY2018 item · filed March 1, 2019
The information required by this item appears in our definitive proxy statement for our annual meeting of stockholders to be held May [removed: 22, 2019] [added: 21, 2020] under the captions “Executive Compensation and Other Information,” “Information Regarding the Board and its Committees — Compensation of Directors,” and “Compensation Committee Interlocks and Insider Participation,” which information is incorporated herein by reference.
Item 12. Security Ownership of Certain Beneficial Owners and Management and Related Stockholder Matters
1 rewritten, 0 added, 0 removed, 0 unchanged
Read the full itemFY2019 item · filed February 21, 2020FY2018 item · filed March 1, 2019
The information required by this item appears in our definitive proxy statement for our annual meeting of stockholders to be held on May [removed: 22, 2019] [added: 21, 2020] under the caption “Ownership of Securities” and “Equity Compensation Plan Information,” which information is incorporated herein by reference.
Item 13. Certain Relationships and Related Transactions, and Director Independence
1 rewritten, 0 added, 0 removed, 0 unchanged
Read the full itemFY2019 item · filed February 21, 2020FY2018 item · filed March 1, 2019
The information required by this item appears in our definitive proxy statement for our annual meeting of stockholders to be held May [removed: 22, 2019] [added: 21, 2020] under the caption “Election of Directors and Management Information,” “Information Regarding the Board and its Committees,” and “Certain Relationships and Related Party Transactions,” which information is incorporated herein by reference.
Item 14. Principal Accountant Fees and Services
1 rewritten, 1 added, 1 removed, 0 unchanged
Read the full itemFY2019 item · filed February 21, 2020FY2018 item · filed March 1, 2019
The information required by this item appears in our definitive proxy statement for our annual meeting of stockholders to be held May [removed: 22, 2019] [added: 21, 2020] under the caption “Proposal 3 — Ratification of Selection of Independent Registered Public Accounting Firm — Fees Paid to PricewaterhouseCoopers LLP,” which information is incorporated herein by reference.
PART IV
PART IV
Item 15. Exhibits and Financial Statement Schedules
44 rewritten, 10 added, 0 removed, 28 unchanged
Read the full itemFY2019 item · filed February 21, 2020FY2018 item · filed March 1, 2019
| 10.4 | | [Amended and Restated [removed: Senior Secured Revolving] [added: ABL] Credit [removed: Facility,] [added: Agreement,] dated as of July 31, 2015, among Builders FirstSource, Inc., SunTrust Bank, as administrative agent and collateral agent, and the lenders and financial institutions party thereto (incorporated by reference to Exhibit 10.2 to the Company’s Current Report on Form 8-K, filed with the Securities Exchange Commission on August 6, 2015, File Number 0-51357)](http://www.sec.gov/Archives/edgar/data/1316835/000119312515281152/d89945dex102.htm) |
| [removed: 10.6] [added: 10.7] | | [ABL/Bond Intercreditor Agreement, dated as of May 29, 2013, among Builders FirstSource, Inc. and certain of its subsidiaries, as grantors, SunTrust Bank, as ABL agent, and Wilmington Trust, National Association, as notes collateral agent (incorporated by reference to Exhibit 10.2 to the Company’s Current Report on Form 8-K, filed with the Securities Exchange Commission on June 3, 2013, File Number 0-51357)](http://www.sec.gov/Archives/edgar/data/1316835/000119312513245434/d547322dex102.htm) |
| [removed: 10.7] [added: 10.8] | | [Collateral Agreement, dated as of July 31, 2015, among the Company, certain of its subsidiaries, and Deutsche Bank AG, New York Branch (incorporated by reference to Exhibit 10.4 to the Company’s Current Report on Form 8-K, filed with the Securities Exchange Commission on August 6, 2015, File Number 0-51357)](http://www.sec.gov/Archives/edgar/data/1316835/000119312515281152/d89945dex104.htm) |
| [removed: 10.8] [added: 10.9] | | [Amended and Restated ABL Collateral Agreement, dated as of July 31, 2015, among the Company, certain of its subsidiaries, and SunTrust Bank (incorporated by reference to Exhibit 10.5 to the Company’s Current Report on Form 8-K, filed with the Securities Exchange Commission on August 6, 2015, File Number 0-51357)](http://www.sec.gov/Archives/edgar/data/1316835/000119312515281152/d89945dex105.htm) |
| [removed: 10.9] [added: 10.10] | | [Notes Collateral Agreement, dated as of August 22, 2016, among Builders FirstSource, Inc., certain of its subsidiaries, and Wilmington Trust, National Association, as trustee (incorporated by reference to Exhibit 10.1 to the Company’s Current Report on Form 8-K, filed with the Securities and Exchange Commission on August 23, 2016, File Number 0-51357)](http://www.sec.gov/Archives/edgar/data/1316835/000119312516688065/d131759dex101.htm) |
| [removed: 10.10] [added: 10.12] | | [Guarantee Agreement, dated as of July 31, 2015, among the guarantors party thereto and Deutsche Bank AG, New York Branch (incorporated by reference to Exhibit 10.6 to the Company’s Current Report on Form 8-K, filed with the Securities Exchange Commission on August 6, 2015, File Number 0-51357)](http://www.sec.gov/Archives/edgar/data/1316835/000119312515281152/d89945dex106.htm) |
| [removed: 10.11] [added: 10.13] | | [Amended and Restated ABL Guarantee Agreement, dated as of July 31, 2015, among the Guarantors (as defined therein) and SunTrust Bank (incorporated by reference to Exhibit 10.7 to the Company’s Current Report on Form 8-K, filed with the Securities Exchange Commission on August 6, 2015, File Number 0-51357)](http://www.sec.gov/Archives/edgar/data/1316835/000119312515281152/d89945dex107.htm) |
| [removed: 10.12] [added: 10.14] | | [Lease and Master Agreement Guaranty, dated as of July 31, 2015, by the Company in favor of LN Real Estate LLC (incorporated by reference to Exhibit 10.10 to the Company’s Quarterly Report on Form 10-Q for the quarter ended September 30, 2015, filed with the Securities and Exchange Commission on November 9, 2015, File Number 0-51357)](http://www.sec.gov/Archives/edgar/data/1316835/000156459015010186/bldr-ex1010_344.htm) |
| [removed: 10.13+] [added: 10.15+] | | [Builders FirstSource, Inc. 1998 Stock Incentive Plan, as amended, effective March 1, 2004 (incorporated by reference to Exhibit 10.4 to Amendment No. 1 to the Registration Statement of the Company on Form S-1, filed with the Securities and Exchange Commission on April 27, 2005, File Number 333-122788)](http://www.sec.gov/Archives/edgar/data/1316835/000095012305005102/y05301a1exv10w4.txt) |
| [removed: 10.14+] [added: 10.16+] | | [Amendment No. 7 to the Builders FirstSource, Inc. 1998 Stock Incentive Plan (incorporated by reference to Exhibit 10.6 to the Company’s Annual Report on Form 10-K for the year ended December 31, 2006, filed with the Securities and Exchange Commission on March 12, 2007, File Number 0-51357)](http://www.sec.gov/Archives/edgar/data/1316835/000095013407005357/d43878exv10w6.htm) |
| [removed: 10.15+] [added: 10.17+] | | [2004 Form of Builders FirstSource, Inc. 1998 Stock Incentive Plan Nonqualified Stock Option Agreement (incorporated by reference to Exhibit 10.5 to Amendment No. 1 to the Registration Statement of the Company on Form S-1, filed with the Securities and Exchange Commission on April 27, 2005, File Number 333-122788)](http://www.sec.gov/Archives/edgar/data/1316835/000095012305005102/y05301a1exv10w5.txt) |
| [removed: 10.16+] [added: 10.18+] | | [Builders FirstSource, Inc. 2005 Equity Incentive Plan (incorporated by reference to Exhibit 10.14 to Amendment No. 4 to the Registration Statement of the Company on Form S-1, filed with the Securities and Exchange Commission on June 6, 2005, File Number 333-122788)](http://www.sec.gov/Archives/edgar/data/1316835/000095012305007065/e05301a4exv10w14.txt) |
| [removed: 10.17+] [added: 10.19+] | | [2006 Form of Builders FirstSource, Inc. 2005 Equity Incentive Plan Nonqualified Stock Option Agreement (incorporated by reference to Exhibit 99.1 to the Company’s Current Report on Form 8-K, filed with the Securities and Exchange Commission on February 17, 2006, File Number 0-51357)](http://www.sec.gov/Archives/edgar/data/1316835/000095013406003269/d33021exv99w1.htm) |
| [removed: 10.18+] [added: 10.20+] | | [Builders FirstSource, Inc. 2007 Incentive Plan (incorporated by reference to Annex D of the Company’s Definitive Proxy Statement on Schedule 14A, filed with the Securities and Exchange Commission on December 15, 2009, File Number 0-51357)](http://www.sec.gov/Archives/edgar/data/1316835/000095012309070917/d69871ddef14a.htm) |
| [removed: 10.19+] [added: 10.21+] | | [2008 Form of Builders FirstSource, Inc. 2007 Incentive Plan Nonqualified Stock Option Agreement (incorporated by reference to Exhibit 10.1 to the Company’s Quarterly Report on Form 10-Q for the quarter ended March 31, 2008, filed with the Securities and Exchange Commission on May 1, 2008, File Number 0-51357)](http://www.sec.gov/Archives/edgar/data/1316835/000095013408008182/d56269exv10w1.htm) |
| [removed: 10.20+] [added: 10.22+] | | [2014 Form of Builders FirstSource, Inc. 2007 Incentive Plan Restricted Stock Unit Award Certificate (incorporated by reference to Exhibit 10.2 to the Company’s Quarterly Report on Form 10-Q for the quarter ended June 30, 2014, filed with the Securities and Exchange Commission on August 1, 2014, File Number 0-51357)](http://www.sec.gov/Archives/edgar/data/1316835/000156459014003053/bldr-ex10_2014063097.htm) |
| [removed: 10.21+] [added: 10.23+] | | [Builders FirstSource, Inc. 2014 Incentive Plan (incorporated herein by reference to Appendix A of the Company’s Definitive Proxy Statement on Schedule 14A, filed with the Securities and Exchange Commission on April 11, 2014, File Number 0-51357)](http://www.sec.gov/Archives/edgar/data/1316835/000119312514140211/d709448ddef14a.htm) |
| [removed: 10.22+] [added: 10.24+] | | [Amendment to the Builders FirstSource, Inc. 2014 Incentive Plan (incorporated by reference to Appendix A of the Company’s Definitive Proxy Statement on Schedule 14A, filed with the Securities and Exchange Commission on April 14, 2016, File Number 0-51357)](http://www.sec.gov/Archives/edgar/data/1316835/000119312516541362/d169561ddef14a.htm) |
| [removed: 10.23+] [added: 10.25+] | | [2014 Form of Builders FirstSource, Inc. 2014 Incentive Plan Restricted Stock Unit Award Certificate (incorporated by reference to Exhibit 10.3 to the Company’s Quarterly Report on Form 10-Q for the quarter ended June 30, 2014, filed with the Securities and Exchange Commission on August 1, 2014, File Number 0-51357)](http://www.sec.gov/Archives/edgar/data/1316835/000156459014003053/bldr-ex10_2014063098.htm) |
| [removed: 10.24+] [added: 10.26+] | | [2015 Form of Builders FirstSource, Inc. 2014 Incentive Plan Non-Statutory Stock Option Award Certificate (incorporated by reference to Exhibit 10.22 to the Company’s Annual Report on Form 10-K for the year ended December 31, 2014, filed with the Securities and Exchange Commission on March 3, 2015, File Number 0-51357)](http://www.sec.gov/Archives/edgar/data/1316835/000156459015001235/bldr-ex1022_20141231219.htm) |
| [removed: 10.25+] [added: 10.27+] | | [2016 Form of Builders FirstSource, Inc. 2014 Incentive Plan Restricted Stock Unit Award Certificate (incorporated by reference to Exhibit 10.2 to the Company’s Quarterly Report on Form 10-Q for the quarter ended March 31, 2016, filed with the Securities and Exchange Commission on May 6, 2016, File Number 0-51357)](http://www.sec.gov/Archives/edgar/data/1316835/000156459016018235/bldr-ex102_83.htm) |
| [removed: 10.26+] [added: 10.28+] | | [2017 Form of Builders FirstSource, Inc. 2014 Incentive Plan Director Restricted Stock Unit Award Certificate (incorporated by reference to Exhibit 10.2 to the Company’s Quarterly Report on Form 10-Q for the quarter ended September 30, 2017, filed with the Securities and Exchange Commission on November 9, 2017, File Number 0-51357)](http://www.sec.gov/Archives/edgar/data/1316835/000156459017023142/bldr-ex102_14.htm) |
| [removed: 10.27+] [added: 10.29+] | | [2017 Form of Builders FirstSource, Inc. 2014 Incentive Plan Restricted Stock Unit Award Certificate (incorporated by reference to Exhibit 10.29 to the Company’s Annual Report on Form 10-K for the year ended December 31, 2017, filed with the Securities and Exchange Commission on March 1, 2018, File Number 0-51357)](http://www.sec.gov/Archives/edgar/data/1316835/000156459018004035/bldr-ex1029_236.htm) |
| [removed: 10.28*+] [added: 10.31*+] | | [Builders FirstSource, Inc. Director Compensation [removed: Policy](https://www.sec.gov/Archives/edgar/data/1316835/000156459019005770/bldr-ex1028_281.htm)] [added: Policy](https://www.sec.gov/Archives/edgar/data/1316835/000156459020005717/bldr-ex1031_373.htm)] |
| [removed: 10.29+] [added: 10.32+] | | [Builders FirstSource, Inc. Form of Director Indemnification Agreement (incorporated by reference to Exhibit 10.13 to Amendment No. 3 to the Registration Statement of the Company on Form S-1, filed with the Securities and Exchange Commission on May 26, 2005, File Number 333-122788)](http://www.sec.gov/Archives/edgar/data/1316835/000095012305006750/e05301a3exv10w13.txt) |
| [removed: 10.30+] [added: 10.33+] | | [Amended and Restated Employment Agreement, dated December 29, 2017, between Builders FirstSource, Inc. and M. Chad Crow (incorporated by reference to Exhibit 10.32 to the Company’s Annual Report on Form 10-K for the year ended December 31, 2017, filed with the Securities and Exchange Commission on March 1, 2018, File Number [removed: 0-51357)](http://www.sec.gov/Archives/edgar/data/1316835/000156459018004035/bldr-ex1032_241.htm)] [added: 0-51357](http://www.sec.gov/Archives/edgar/data/1316835/000156459018004035/bldr-ex1032_241.htm))] |
| [removed: 10.31+] [added: 10.34+] | | [Employment Agreement, dated January 15, 2004, between Builders FirstSource, Inc. and Donald F. McAleenan (incorporated by reference to Exhibit 10.3 to the Company’s Quarterly Report on Form 10-Q for the quarter ended September 30, 2005, filed with the Securities Exchange Commission on November 2, 2005, File Number 0-51357)](http://www.sec.gov/Archives/edgar/data/1316835/000095012305012962/y13890exv10w3.txt) |
| [removed: 10.32+] [added: 10.35+] | | [Amendment to Employment Agreement, dated October 29, 2008, between Builders FirstSource, Inc. and Donald F. McAleenan (incorporated by reference to Exhibit 10.33 to the Company’s Annual Report on Form 10-K for the year ended December 31, 2008, filed with the Securities and Exchange Commission on March 2, 2009, File Number 0-51357)](http://www.sec.gov/Archives/edgar/data/1316835/000095013409004066/d66600exv10w33.htm) |
| [removed: 10.33+] [added: 10.36+] | | [Second Amendment to Employment Agreement, dated as of May 19, 2017, between Builders FirstSource, Inc. and Donald F. McAleenan (incorporated by reference to Exhibit 10.4 to the Company’s Quarterly Report on Form 10-Q for the quarter ended June 30, 2017, filed with the Securities Exchange Commission on August 4, 2017, File Number 0-51357)](http://www.sec.gov/Archives/edgar/data/1316835/000156459017015617/bldr-ex104_212.htm) |
| [removed: 10.34+] [added: 10.37+] | | [Employment Agreement, dated November 14, 2016, between Builders FirstSource, Inc. and Peter M. Jackson (incorporated by reference to Exhibit 10.39 to the Company’s Annual Report on Form 10-K for the year ended December 31, 2016, filed with the Securities and Exchange Commission on March 1, 2017, File Number 0-51357)](http://www.sec.gov/Archives/edgar/data/1316835/000156459017003114/bldr-ex1039_212.htm) |
| [removed: 10.35+] [added: 10.38+] | | [First Amendment to Employment Agreement, dated as of May 19, 2017, between Builders FirstSource, Inc. and Peter M. Jackson (incorporated by reference to Exhibit 10.5 to the Company’s Quarterly Report on Form 10-Q for the quarter ended June 30, 2017, filed with the Securities Exchange Commission on August 4, 2017, File Number 0-51357)](http://www.sec.gov/Archives/edgar/data/1316835/000156459017015617/bldr-ex105_211.htm) |
| [removed: 10.36+] [added: 10.39+] | | [Employment Agreement between Builders FirstSource, Inc. and Scott L. Robins dated effective as of February 20, 2018 (incorporated by reference to Exhibit 10.1 to the Company’s Quarterly Report on Form 10-Q for the quarter ended September 30, 2018, filed with the Securities and Exchange Commission on November 2, 2018, File Number 0-51357)](http://www.sec.gov/Archives/edgar/data/1316835/000156459018026435/bldr-ex101_89.htm) |
| [removed: 10.37*+] [added: 10.40+] | | [Employment Agreement between Builders FirstSource, Inc. and David E. Rush dated effective as of November 29, [removed: 2018](https://www.sec.gov/Archives/edgar/data/1316835/000156459019005770/bldr-ex1037_152.htm)] [added: 2018 (incorporated by reference to Exhibit 10.37 to the Company’s Annual Report on Form 10-K for the year ended December 31, 2018, filed with the Securities and Exchange Commission on March 1, 2019, File Number 0-51357)](http://www.sec.gov/Archives/edgar/data/1316835/000156459019005770/bldr-ex1037_152.htm)] |
| [removed: 10.38+] [added: 10.41+] | | [Amended and Restated Employment Agreement, dated January 1, 2018, between Builders FirstSource, Inc. and Floyd Sherman (incorporated by reference to Exhibit 10.41 to the Company’s Annual Report on Form 10-K for the year ended December 31, 2017, filed with the Securities and Exchange Commission on March 1, 2018, File Number 0-51357)](http://www.sec.gov/Archives/edgar/data/1316835/000156459018004035/bldr-ex1041_242.htm) |
| [removed: 14.1*] [added: 14.1] | | [Builders FirstSource, Inc. Code of Business Conduct and [removed: Ethics](https://www.sec.gov/Archives/edgar/data/1316835/000156459019005770/bldr-ex141_256.htm)] [added: Ethics (incorporated by reference to Exhibit 14.1 to the Company’s Annual Report on Form 10-K for the year ended December 31, 2018, filed with the Securities and Exchange Commission on March 1, 2019, File Number 0-51357)](http://www.sec.gov/Archives/edgar/data/1316835/000156459019005770/bldr-ex141_256.htm)] |
| [removed: 21.1] [added: 10.30+] | | [removed: [Subsidiaries] [added: [2019 Form] of [removed: the Registrant] [added: Builders FirstSource, Inc. 2014 Incentive Plan Restricted Stock Unit Award Certificate] (incorporated by reference to Exhibit [removed: 21.1] [added: 10.1] to the Company’s [removed: Annual] [added: Quarterly] Report on Form [removed: 10-K] [added: 10-Q] for the [removed: year] [added: quarter] ended [removed: December] [added: March] 31, [removed: 2017,] [added: 2019,] filed with the Securities and Exchange Commission on [removed: March 1, 2018,] [added: May 3, 2019,] File Number [removed: 0-51357)](http://www.sec.gov/Archives/edgar/data/1316835/000156459018004035/bldr-ex211_240.htm)] [added: 0-51357)](http://www.sec.gov/Archives/edgar/data/1316835/000156459019015572/bldr-ex101_104.htm)] |
| 23.1* | | [Consent of PricewaterhouseCoopers LLP, Independent Registered Public Accounting [removed: Firm](https://www.sec.gov/Archives/edgar/data/1316835/000156459019005770/bldr-ex231_10.htm)] [added: Firm](https://www.sec.gov/Archives/edgar/data/1316835/000156459020005717/bldr-ex231_6.htm)] |
| 24.1* | | [Power of Attorney (included as part of signature [removed: page)](#POWER_OF_ATTORNEY)] [added: page)](#SIGNATURES)] |
| 31.1* | | [Certification of Chief Executive Officer pursuant to 17 CFR 240.13a-14(a), as adopted pursuant to Section 302 of the Sarbanes-Oxley Act of 2002, signed by M. Chad Crow as Chief Executive [removed: Officer](https://www.sec.gov/Archives/edgar/data/1316835/000156459019005770/bldr-ex311_15.htm)] [added: Officer](https://www.sec.gov/Archives/edgar/data/1316835/000156459020005717/bldr-ex311_9.htm)] |
| 31.2* | | [Certification of Chief Financial Officer pursuant to 17 CFR 240.13a-14(a), as adopted pursuant to Section 302 of the Sarbanes-Oxley Act of 2002, signed by Peter M. Jackson as Chief Financial [removed: Officer](https://www.sec.gov/Archives/edgar/data/1316835/000156459019005770/bldr-ex312_12.htm)] [added: Officer](https://www.sec.gov/Archives/edgar/data/1316835/000156459020005717/bldr-ex312_7.htm)] |
| 4.2 | | [Indenture, dated as of May 30, 2019, among Builders FirstSource, Inc., the guarantors party thereto, and Wilmington Trust, National Association, as trustee and notes collateral agent (form of Note included therein) (incorporated by reference to Exhibit 4.1 to the Company’s Current Report on Form 8-K, filed with the Securities and Exchange Commission on May 31, 2019, File Number 0-51357)](http://www.sec.gov/Archives/edgar/data/1316835/000119312519162897/d736510dex41.htm) |
| 4.3 | | [First Supplemental Indenture, dated as of July 25, 2019, among Builders FirstSource, Inc., the guarantors party thereto, and Wilmington Trust, National Association, as trustee and notes collateral agent (incorporated by reference to Exhibit 4.3 to the Company’s Current Report on Form 8-K, filed with the Securities and Exchange Commission on July 30, 2019, File Number 0-51357)](http://www.sec.gov/Archives/edgar/data/1316835/000119312519207090/d784014dex43.htm) |
| 4.4 | | [Indenture, dated as of February 11, 2020, among Builders FirstSource, Inc., the guarantors party thereto, and Wilmington Trust, National Association, as trustee (form of Note included therein) (incorporated by reference to Exhibit 4.1 to the Company’s Current Report on Form 8-K, filed with the Securities and Exchange Commission on February 11, 2020, File Number 0-51357](http://www.sec.gov/Archives/edgar/data/1316835/000119312520031497/d880246dex41.htm)) |
| 4.5* | | [Description of Capital Stock](https://www.sec.gov/Archives/edgar/data/1316835/000156459020005717/bldr-ex45_372.htm) |
| 10.6 | | [Amendment No. 2 to Credit Agreement, dated as of April 24, 2019, among Builders FirstSource, Inc., SunTrust Bank, as administrative agent and collateral agent, and the lenders party thereto (incorporated by reference to Exhibit 10.1 to the Company’s Current Report on Form 8-K, filed with the Securities and Exchange Commission on April 30, 2019, File Number 0-51357)](http://www.sec.gov/Archives/edgar/data/1316835/000119312519129650/d734639dex101.htm) |
| 10.11 | | [Notes Collateral Agreement, dated as of May 30, 2019, among Builders FirstSource, Inc., certain of its subsidiaries, and Wilmington Trust, National Association, as trustee (incorporated by reference to Exhibit 10.1 to the Company’s Current Report on Form 8-K, filed with the Securities and Exchange Commission on May 31, 2019, File Number 0-51357)](http://www.sec.gov/Archives/edgar/data/1316835/000119312519162897/d736510dex101.htm) |
| 21.1* | | [Subsidiaries of the Registrant](https://www.sec.gov/Archives/edgar/data/1316835/000156459020005717/bldr-ex211_374.htm) |
| Exhibit Number | | Description |
| --- | --- | --- |
| 104* | | The cover page from the Company’s Annual Report on Form 10-K for the year ended December 31, 2019 has been formatted in Inline XBRL. |
An excerpt. Shown here: 40 of 44 rewritten, all 10 added and all 0 removed. The counts are complete. For every sentence, read Item 15. Exhibits and Financial Statement Schedules in the FY2019 filing and the FY2018 filing.
Item 16. Form 10-K Summary
14 rewritten, 7 added, 8 removed, 30 unchanged
Read the full itemFY2019 item · filed February 21, 2020FY2018 item · filed March 1, 2019
| [added: |] BUILDERS FIRSTSOURCE, INC. |
| [added: |] /s/ M. CHAD CROW |
| [added: |] M. Chad Crow |
| [added: |] President and Chief Executive Officer |
| /s/ M. CHAD CROW | | President, Chief Executive Officer and Director | | [removed: March 1, 2019] [added: February 21, 2020] |
| /s/ PETER M. JACKSON | | Senior Vice President and Chief Financial Officer | | [removed: March 1, 2019] [added: February 21, 2020] |
| /s/ JAMI COULTER | | Senior Vice President and Chief Accounting Officer | | [removed: March 1, 2019] [added: February 21, 2020] |
| /s/ PAUL S. LEVY | | Chairman and Director | | [removed: March 1, 2019] [added: February 21, 2020] |
| /s/ FLOYD F. SHERMAN | | Director | | [removed: March 1, 2019] [added: February 21, 2020] |
| /s/ CLEVELAND A. CHRISTOPHE | | Director | | [removed: March 1, 2019] [added: February 21, 2020] |
| /s/ DANIEL AGROSKIN | | Director | | [removed: March 1, 2019] [added: February 21, 2020] |
| /s/ BRETT N. MILGRIM | | Director | | [removed: March 1, 2019] [added: February 21, 2020] |
| /s/ CRAIG A. STEINKE | | Director | | [removed: March 1, 2019] [added: February 21, 2020] |
| /s/ DAVID A. BARR | | Director | | [removed: March 1, 2019] [added: February 21, 2020] |
February 21, 2020
| --- | --- |
| | |
| /s/ JANICE DAVIS | | Director | | February 21, 2020 |
| Janice Davis | | | | |
| /s/ WILLIAM B. HAYES | | Director | | February 21, 2020 |
| William B. Hayes | | | | |
March 1, 2019
| --- |
| |
| |
| /s/ ROBERT C. GRIFFIN | | Director | | March 1, 2019 |
| Robert C. Griffin | | | | |
| /s/ KEVIN J. KRUSE | | Director | | March 1, 2019 |
| Kevin J. Kruse | | | | |