 filings.tools
Builders FirstSource 10-K 2020-12-31
Filed 2021-02-26. 20 sections, 343K characters. Original on sec.gov · Markdown · JSON
Cover and table of contents
UNITED STATES
SECURITIES AND EXCHANGE COMMISSION
Washington, D.C. 20549
Form 10-K
| ☑ | ANNUAL REPORT PURSUANT TO SECTION 13 OR 15(d) OF THE SECURITIES EXCHANGE ACT OF 1934 |
|---|
For the fiscal year ended December 31, 2020
OR
| ☐ | TRANSITION REPORT PURSUANT TO SECTION 13 OR 15(d) OF THE SECURITIES EXCHANGE ACT OF 1934 |
|---|
For the transition period from to
Commission File Number: 0-51357
BUILDERS FIRSTSOURCE, INC.
(Exact name of registrant as specified in its charter)
| Delaware | 52-2084569 | |
|---|---|---|
| (State or other jurisdiction of incorporation or organization) | (I.R.S. Employer Identification No.) | |
| 2001 Bryan Street, Suite 1600 Dallas, Texas | 75201 | |
| (Address of principal executive offices) | (Zip Code) |
Registrant’s telephone number, including area code:
(214) 880-3500
Securities registered pursuant to Section 12(b) of the Act:
| Title of Each Class | Trading Symbol(s) | Name of Each Exchange on Which Registered |
|---|---|---|
| Common stock, par value $0.01 per share | BLDR | NASDAQ Stock Market LLC |
Securities registered pursuant to Section 12(g) of the Act:
None
Indicate by check mark if the registrant is a well-known seasoned issuer, as defined in Rule 405 of the Securities Act. Yes ☑ No ☐
Indicate by check mark if the registrant is not required to file reports pursuant to Section 13 or Section 15(d) of the Act. Yes ☐ No ☑
Indicate by check mark whether the registrant (1) has filed all reports required to be filed by Section 13 or 15(d) of the Securities Exchange Act of 1934 during the preceding 12 months (or for such shorter period that the registrant was required to file such reports), and (2) has been subject to such filing requirements for the past 90 days. Yes ☑ No ☐
Indicate by check mark whether the registrant has submitted electronically every Interactive Data File required to be submitted pursuant to Rule 405 of Regulation S-T (§ 232.405 of this chapter) during the preceding 12 months (or for such shorter period that the registrant was required to submit such files). Yes ☑ No ☐
Indicate by check mark whether the registrant is a large accelerated filer, an accelerated filer, a non-accelerated filer, a smaller reporting company, or an emerging growth company. See the definitions of “large accelerated filer,” “accelerated filer,” “smaller reporting company,” and “emerging growth company” in Rule 12b-2 of the Exchange Act.
| Large accelerated filer ☑ | Accelerated filer ☐ | Non-accelerated filer ☐ | Smaller reporting company ☐ | ||||
|---|---|---|---|---|---|---|---|
| Emerging growth company ☐ |
If an emerging growth company, indicate by check mark if the registrant has elected not to use the extended transition period for complying with any new or revised financial accounting standards provided pursuant to Section 13(a) of the Exchange Act. ☐
Indicate by check mark whether the registrant has filed a report on and attestation to its management’s assessment of the effectiveness of its internal control over financial reporting under Section 404(b) of the Sarbanes-Oxley Act (15 U.S.C. 7262(b)) by the registered public accounting firm that prepared or issued its audit report. ☑
Indicate by check mark whether the registrant is a shell company (as defined in Rule 12b-2 of the Act). Yes ☐ No ☑
The aggregate market value of the registrant’s common stock held by non-affiliates of the registrant as of June 30, 2020 was approximately $2,375.5 million based on the closing price per share on that date of $20.70 as reported on the NASDAQ Stock Market LLC.
The number of shares of the registrant’s common stock, par value $0.01, outstanding as of February 24, 2021 was 206,431,681.
DOCUMENTS INCORPORATED BY REFERENCE
Portions of the registrant’s definitive proxy statement for its annual meeting of stockholders to be held on June 16, 2021 are incorporated by reference into Part II and Part III of this Form 10-K.
BUILDERS FIRSTSOURCE, INC.
Table of Contents to Form 10-K
P****ART I
Item 1. Business
CAUTIONARY STATEMENT
Statements in this report and the schedules hereto that are not purely historical facts or that necessarily depend upon future events, including statements about expected market share gains, forecasted financial performance or other statements about anticipations, beliefs, expectations, hopes, intentions or strategies for the future, may be forward-looking statements within the meaning of Section 21E of the Securities Exchange Act of 1934, as amended. Readers are cautioned not to place undue reliance on forward-looking statements. In addition, oral statements made by our directors, officers and employees to the investor and analyst communities, media representatives and others, depending upon their nature, may also constitute forward-looking statements. All forward-looking statements are based upon currently available information and the Company’s current assumptions, expectations and projections about future events. Forward-looking statements are by nature inherently uncertain, and actual results or events may differ materially from the results or events described in the forward-looking statements as a result of many factors. The Company undertakes no obligation to publicly update or revise any forward-looking statements, whether as a result of new information, future events or otherwise. Any forward-looking statements involve risks and uncertainties, many of which are beyond the Company’s control or may be currently unknown to the Company, that could cause actual events or results to differ materially from the events or results described in the forward-looking statements, including risks or uncertainties related to the novel coronavirus disease 2019 (“COVID-19”), the BMC Merger (as defined below), the Company’s growth strategies, including gaining market share, or the Company’s revenues and operating results being highly dependent on, among other things, the homebuilding industry, lumber prices and the economy. The Company may not succeed in addressing these and other risks. Further information regarding the risk factors that could affect our financial and other results are included as Item 1A of this annual report on Form 10-K and may also be described from time to time in the other reports the Company files with the Securities and Exchange Commission (“SEC”). Consequently, all forward-looking statements in this report are qualified by the factors, risks and uncertainties contained therein.
BMC MERGER
On January 1, 2021, Builders FirstSource, Inc. completed its previously announced all stock merger transaction with BMC Stock Holdings, Inc., a Delaware corporation (“BMC”), pursuant to the Agreement and Plan of Merger, dated as of August 26, 2020 (as amended, restated, supplemented, or otherwise modified from time to time, the “Merger Agreement”), by and among Builders FirstSource, Inc., Boston Merger Sub I Inc., a Delaware corporation and direct wholly owned subsidiary of Builders FirstSource, Inc. (“Merger Sub”), and BMC. On the terms and subject to the conditions set forth in the Merger Agreement, on January 1, 2021, Merger Sub merged with and into BMC, with BMC continuing as the surviving corporation and a wholly owned subsidiary of Builders FirstSource, Inc. (the “BMC Merger”).
In this annual report, unless otherwise stated or the context otherwise requires, references to the “company,” “we,” “our,” “ours” or “us” refer to Builders FirstSource, Inc. and its consolidated subsidiaries.
The BMC Merger will be accounted for using the acquisition method of accounting, and the Company will be treated as the accounting acquirer. The operating results of BMC will be reported as part of the Company beginning on January 1, 2021, and as such, references to the Company in this annual report, including the Company’s historical financial condition, results of operations and cash flows, does not include BMC, unless otherwise noted.
OVERVIEW
We are a leading supplier and manufacturer of building materials, manufactured components and construction services to professional homebuilders, sub-contractors, remodelers and consumers. Following the BMC Merger, we operate approximately 550 locations in 40 states across the United States. We offer an integrated solution to our customers by providing manufacturing, supply and installation of a full range of structural and related building products. Our manufactured products include our factory-built roof and floor trusses, wall panels and stairs, vinyl windows, custom millwork and trim, as well as engineered wood that we design, cut, and assemble specifically for each home. We also assemble interior and exterior doors into pre-hung units. Additionally, we supply our customers with a broad offering of professional grade building products not manufactured by us, such as dimensional lumber and lumber sheet goods and various window, door and millwork lines. Our full range of construction-related services include professional installation, turn-key framing and shell construction, spanning all of our product categories.
Builders FirstSource, Inc. is a Delaware corporation formed in 1998 as BSL Holdings, Inc. On October 13, 1999, our name changed to Builders FirstSource, Inc. Our common stock is listed on the NASDAQ Stock Market LLC under the ticker symbol “BLDR”.
OUR INDUSTRY
We compete in the professional segment (“Pro Segment”) of the U.S. residential building products supply market. Suppliers in the Pro Segment primarily focus on serving professional customers such as homebuilders and remodeling contractors. The Pro Segment consists predominantly of small, privately owned suppliers, including framing and shell construction contractors, local and regional materials distributors, single or multi-site lumberyards, and truss manufacturing and millwork operations. Because of the predominance of smaller privately owned companies and the overall size and diversity of the target customer market, the Pro Segment remains fragmented. There were only eight building product suppliers, one of which was BMC, with manufacturing capabilities in the Pro Segment that generated more than $500 million in sales, according to ProSales magazine’s 2020 ProSales 100 list. We were the largest building product supplier with manufacturing capabilities on ProSales’ list and have further increased our size through the BMC Merger.
The residential building products industry is driven by the level of activity in both the U.S. residential new construction market and the U.S. residential repair and remodeling market. Growth within these markets is linked to a number of key factors, including demographic trends, housing demand, interest rates, employment levels, availability of credit, foreclosure rates, consumer confidence, the availability of qualified tradesmen, and the state of the economy in general.
The residential building products industry is characterized by several key trends, including greater utilization of manufactured components, an expanding role of the distributor in providing turn-key services and a consolidation of suppliers by homebuilders, as described in more detail below.
| • | Prefabricated components: Compared to conventional “stick-build” construction where builders cut and assemble lumber at the job site with their own labor, prefabricated components are engineered in an offsite location using specialized equipment and labor. This outsourced task allows for optimal material usage, lower overall labor costs and improved quality of structural elements. In addition, using prefabricated components typically results in faster construction because fabrication can be automated and performed more systematically. As such, we believe there is a long-term trend towards increased use of prefabricated components by homebuilders. |
|---|
| • | Turn-key services: Many homebuilders have taken a more limited role in the homebuilding process and have outsourced certain key elements of the construction process, including process management, product selection, order input, scheduling, framing and installation. As such, we believe that many homebuilders are increasingly looking to suppliers in the Pro Segment to perform these critical functions, resulting in greater demand for integrated project services. |
|---|
| • | Consolidation of suppliers by homebuilders: We believe that homebuilders are increasingly looking to consolidate their supplier base. Many homebuilders are seeking a more strategic relationship with suppliers that are able to offer a broad range of products and services and, as a result, are allocating a greater share of wallet to a select number of larger, full-service suppliers. |
|---|
According to the U.S. Census Bureau, the single-family residential construction market was an estimated $365.0 billion in 2020, which was 23.5% higher than 2019, and still down from the historical high of $413.2 billion in 2006. Further, according to the Home Improvement Research Institute (“HIRI”) in its September 2020 semi-annual forecast, the professional repair and remodel end market was an estimated $126.8 billion in 2020, which was 3.5% higher than 2019.
OUR CUSTOMERS
We serve a broad customer base across the United States. We have a diverse geographic footprint as we now have operations in 85 of the top 100 U.S. Metropolitan Statistical Areas (“MSAs”) following the BMC Merger, as ranked by single family housing permits based on available 2020 U.S. Census data. In addition, approximately 91% of U.S. single-family housing permits in 2020 were issued in MSAs in which we operate. Given the local nature of our business, we have historically and will continue to locate our facilities in close proximity to our key customers and co-locate multiple operations in one facility to improve efficiency.
We have a diversified customer base, ranging from large production builders to small custom homebuilders, as well as multi-family builders, repair and remodeling contractors and light commercial contractors. For the year ended December 31, 2020, our top 10 customers accounted for approximately 15.8% of net sales, and no single customer accounted for more than 6% of net sales. Our top 10 customers are comprised primarily of the largest production homebuilders, including publicly traded companies such as D.R. Horton, Inc., Pulte Homes, Inc., Lennar Corporation, Taylor Morrison Home Corporation, and M/I Homes, Inc.
In addition to the largest production homebuilders, we also service and supply regional production and local custom homebuilders as well as repair and remodeling contractors and multi-family builders. These customers require high levels of service and a broad product offering. Our sales team expects to work very closely with the designers on a day-to-day basis in order to ensure
the appropriate products are identified, ordered or produced and delivered on time to the building site. To account for these increased service costs, pricing in the industry is tied to the level of service provided and the volumes purchased.
OUR PRODUCTS AND SERVICES
We group our building products and services into six product categories:
Lumber & Lumber Sheet Goods. Lumber & lumber sheet goods include dimensional lumber, plywood and oriented strand board (“OSB”) products used in on-site house framing. Lumber & lumber sheet goods are our largest sales volume product category. The products in this category are highly sensitive to fluctuations in market prices for such commodities.
Manufactured Products. Manufactured products are factory-built substitutes for job-site framing and include wood floor and roof trusses, steel roof trusses, wall panels, stairs, and engineered wood that we design, cut, and assemble for each home. Our manufactured products allow builders to build higher quality homes more efficiently. Roof trusses, floor trusses, wall panels and stair units are built in a factory-controlled environment. Engineered floors and beams are cut to the required size and packaged for the given application at many of our locations. Without manufactured products, builders construct these items on site, where weather and variable labor quality can negatively impact construction cost, quality and installation time. In addition, engineered wood beams have greater structural strength than conventional framing materials, allowing builders to frame houses with more open space creating a wider variety of house designs. Engineered wood floors are also stronger and straighter than conventionally framed floors. While not as sensitive to commodity price fluctuations as Lumber & Lumber Sheet Goods, the products in this category include lumber & lumber sheet goods, and thus are somewhat sensitive to commodity price fluctuations.
Windows, Doors & Millwork. Windows & doors are comprised of the manufacturing, assembly and distribution of windows, and the assembly and distribution of interior and exterior door units. We manufacture a portion of the vinyl windows that we distribute in our plant in Houston, Texas which allows us to supply builders, primarily in the Texas market, with cost-competitive products. Our pre-hung interior and exterior doors consist of a door slab with hinges and door jambs attached, reducing on-site installation time and providing higher quality finished door units than those constructed on site. These products typically require a high degree of product knowledge and training to sell. Millwork includes interior trim and custom features, including those that we manufacture under the Synboard ® brand name. Synboard is produced from extruded PVC and offers several advantages over traditional wood features, such as greater durability and no ongoing maintenance such as periodic caulking and painting.
Gypsum, Roofing & Insulation. Gypsum, roofing, and insulation include wallboard, ceilings, joint treatment and finishes.
Siding, Metal, and Concrete. Siding, metal, and concrete includes vinyl, composite, and wood siding, exterior trim, other exteriors, metal studs and cement.
Other Building Products & Services. Other building products & services consist of various products, including cabinets and hardware. This category also includes services such as turn-key framing, shell construction, design assistance and professional installation of products spanning all of our product categories. We provide professional installation and turn-key services as a solution for our homebuilder customers. Through our installation services program, we help homebuilders realize efficiencies through improved scheduling, resulting in reduced cycle time and better cost controls. By utilizing an energy efficiency software program, we also assist homebuilders in designing energy efficient homes in order to meet increasingly stringent energy rating requirements. Upgrading to our premium windows, doors, and insulating products can reduce overall cost to the homebuilder by minimizing costs of the required heating/cooling system. We work closely with the homebuilder to select the appropriate mix of our products in order to meet current and forthcoming energy codes. We believe these services require scale, capital and sophistication that smaller competitors do not possess. We will continue to pursue profitable business in this category.
We compete in a fragmented marketplace. We believe our integrated approach and scale allow us to compete effectively through our comprehensive product lines, prefabricated components, and value-added services, combined with the knowledge of our integrated sales forces to enable our homebuilder customers to complete construction more quickly, with higher quality and at a lower cost. While we expect these benefits to be particularly valuable to our customers in market environments characterized by labor shortages, sourcing challenges or sharply rising demand for new homes, we expect such benefits will also be increasingly valued and demanded by our customers operating under normal market conditions.
MANUFACTURING
Our manufacturing facilities utilize industry leading technology and high quality materials to improve product quality, increase efficiency, reduce lead times and minimize production errors. We manufacture products within two of our product categories: manufactured products, and windows, doors & millwork.
Manufactured Products — Trusses and Wall Panels. Truss and wall panel production has two steps — design and fabrication. Each house requires its own set of designed shop drawings, which vary by builder type — production versus custom builders. Production builders use prototype house plans as they replicate houses. These house plans may be minimally modified to suit individual customer demand. We maintain an electronic master file of trusses and wall panels for each builder’s prototype houses. For custom builders, the components are designed individually for each house. We download the shop drawings from our design department to computerized saws. We assemble the cut lumber to form roof trusses, floor trusses or wall panels, and store the finished components by house awaiting shipment to the job site.
Manufactured Products — Engineered Wood. As with trusses and wall panels, engineered wood components have design and fabrication steps. We design engineered wood floors using a master filing system similar to the truss and wall panel system. Engineered wood beams are designed to ensure the beam will be structurally sound in the given application. After the design phase, a printed layout is generated. We use this layout to cut the engineered wood to the required length and assemble all of the components into a house package. We design and fabricate engineered wood at many of our distribution locations.
Manufactured Products — Stairs. We manufacture box stairs at some of our locations. After a house is framed, our salesman takes measurements at the job site prior to manufacturing to account for any variation between the blueprints and the actual framed house. The fabricated box stairs are based on these measurements.
Custom Millwork. Our manufactured custom millwork consists primarily of interior and exterior trim, interior and exterior doors, custom windows, features and box columns. In addition, we sell many of these custom millwork products in a synthetic material under our Synboard brand name. We sand, cut, and shape sheets of 4 foot by 18 or 20 foot Celuka-blown, extruded PVC, or Synboard, to produce the desired product.
Windows. We manufacture a full line of traditional vinyl windows at an approximately 200,000 square foot manufacturing facility located in Houston, Texas. The process begins by purchasing vinyl lineal extrusions. We cut these extrusions to size and join them together to form the window frame and sash. We then purchase sheet glass and cut it to size. We combine two pieces of identically shaped glass with a sealing compound to create a glass unit with improved insulating capability. We then insert the sealed glass unit and glaze it into the window frame and sash. The unit is completed when we install a balance to operate the window and add a lock to secure the window in a closed position.
Pre-hung Doors. We pre-hang interior and exterior doors at many of our locations. We insert door slabs and pre-cut door jambs into a door machine, which bores holes into the doors for the door hardware and applies the jambs and hinges to the door slab. We then apply the casing that frames interior doors at a separate station. Exterior doors do not have a casing, and instead may have sidelights applied to the sides of the door, a transom attached over the top of the door unit and a door sill applied to the threshold.
OUR STRATEGY
By pursuing the Company’s four pillar strategic priorities as outlined below, we intend to build on our advantaged market position to create value for our shareholders by increasing profits and net cash flow generation, while making us a more valuable partner to our customers. The resulting cash flow should provide meaningful opportunities for increased investment in organic and acquisitive growth that preserve our balance sheet strength, grow our return on invested capital and return capital to our shareholders.
Organic Growth of Value-add Products and Services
Maximize our share of wallet by capturing above-market growth in our higher margin value added products. We believe our national manufacturing footprint and differentiated capabilities will allow us to capture growth in our higher margin value-added products, including trusses, wall panels and millwork. We believe our value-added products address the growing demand for ways to build homes more efficiently, addressing labor constraints and rising costs. We plan to accelerate this growth by further expansion of our national manufacturing footprint to serve locations that do not currently have adequate access to these high margin products. By focusing on our differentiated platform and broad product mix, we are able to offer a complete array of products and services that would otherwise need to be sourced from various distributors, providing us an opportunity to capture a greater share of wallet. This operational platform often will make us a preferred distributor for large scale national homebuilders as well as local and custom
homebuilders looking for more efficient ways to build a home. We believe that customers continue to place an increased value on these capabilities, which further differentiates us from our competitors.
Leverage our competitive strengths to capitalize on housing market growth**.** As the U.S. housing market returns to a historically normalized level, we intend to leverage our core business strengths including size, national footprint, unmatched scale in manufacturing capability, breadth of product portfolio, and end market exposure to expand our sales and profit margins. Our customers continue to emphasize the importance of competitive pricing, a broad product portfolio, sales force knowledge, labor-saving manufactured products, on-site services and overall “ease of use” with their building products suppliers. Our comprehensive product offering, experienced sales force, strong strategic vendor relationships, and tenured senior management team position us well to capitalize on strong demand in the new home construction market and the repair and remodel segment. Our large delivery fleet, professional drivers, and comprehensive inventory management enable us to provide “just-in-time” product delivery, ensuring a smoother and faster production cycle for the homebuilder. Our comprehensive network of products, services and facilities provides a strategically advantaged service model which enhances our value to our customers and provides a strong platform to drive growth.
Drive Operational Excellence
Optimize our highly scalable cost structure with operational excellence initiatives**.** We continue to focus on standardizing and automating processes and technology-based workflows to minimize costs, streamline our operations and enhance working capital efficiency. We are implementing operational excellence initiatives that are designed to further improve efficiency as well as customer service. These initiatives, including distribution and logistics, pricing and margin management, back office efficiencies, customer integration and systems-enabled process improvements, should yield significant cost savings. The scope and scale of our existing infrastructure, customer base, and logistical capabilities mean that improvements in efficiency, when replicated across our network, can yield substantial profit margin expansion.
Continue to Build our High-Performing Culture
Strong emphasis on putting our people first. Our team members are a critical resource, and every single one makes a difference. Enhancing talent acquisition, employee development and retention will ensure we continue to attract and retain this valuable component of our business. Our team members are the face of the Company to our customers and the communities in which we operate. Their contributions in serving our customers is a fundamental component in our success. We care about our team members and strive to have a strong environmental, health and safety program that drives world-class safety results and ensures our team members leave their workplace safely, every day. We recognize how important it is for our team members to develop and progress in their careers and strive to build a performance-based culture.
Environmental, social and governance strategy. We are also committed to making informed choices that improve our corporate governance, financial strength, operational efficiency, environmental stewardship, community engagement and resource management. Consistent with our core values, our goal is to be recognized by our customers as the preferred supplier, by our employees as a safe, diverse and inclusive workforce, by the industry as being at the forefront of innovation, by our stakeholders as an ethical company and by the communities in which we serve as a good corporate citizen. We recognize that the environmental sustainability of our products is important to both us as a company, and to our customers. We prioritize purchasing and supplying sustainable wood products led by the Sustainable Forestry Initiative. Helping homebuilders become more productive, more efficient, and safer is fundamental to what we do and we are passionate about building this future together.
Pursue Strategic Acquisitions
Leverage free cash flow to accelerate strategic growth. The highly fragmented nature of the Pro Segment of the U.S. residential new construction building products supply market presents substantial acquisition opportunities. Our long-term acquisition strategy is focused on the continued growth of our prefabricated components business and on the potential for geographic expansion. First, we plan to selectively seek acquisition targets that manufacture prefabricated components such as factory-built roof and floor trusses, wall panels, stairs, and engineered wood, as well as other value-added products such as vinyl windows and millwork. We also intend to pursue potential acquisitions that present an opportunity to add manufacturing capabilities in a relatively short period of time. Second, there remain a number of attractive homebuilding markets where we do not currently operate. We believe that our proven operating model can be successfully adapted to these markets and where homebuilders, many of whom we currently serve elsewhere, would value our broad product and service offering, professional expertise, and superior customer service. When entering a new market, our strategy is to acquire market-leading distributors and subsequently expand their product offerings or add manufacturing facilities while integrating their operations into our centralized platform. This strategy allows us to quickly achieve the scale required to maximize profitability and leverage existing customer relationships in the local market. Our management has shown the capability to effectively and efficiently integrate newly acquired businesses, ramping up productivity and driving value. Prior to the BMC Merger, we successfully integrated 43 acquisitions since 1998.
SALES AND MARKETING
We seek to attract and retain customers through exceptional customer service, leading product quality, broad product and service offerings, and competitive pricing. This strategy is centered on building and maintaining strong customer relationships rather than traditional marketing and advertising. We strive to add value for the homebuilders through shorter lead times, lower project costs, faster project completion and higher quality. By executing this strategy, we believe we will continue to generate new business.
Our experienced, locally focused sales force is at the core of our sales effort. This sales effort involves deploying salespeople who are skilled in housing construction to meet with a homebuilder’s construction superintendent, local purchasing agent, or local executive with the goal of becoming their primary product supplier. If selected by the homebuilder, the salesperson and his or her team review blueprints for the contracted homes and advise the homebuilder in areas such as opportunities for cost reduction, increased energy efficiencies, and regional aesthetic preferences. Next, the team determines the specific package of products that are needed to complete the project and schedules a sequence of site deliveries. Our large delivery fleet and comprehensive inventory management systems enable us to provide “just-in-time” product delivery, ensuring a smoother and faster production cycle for the homebuilder. Throughout the construction process, the salesperson makes frequent site visits to ensure timely delivery and proper installation, and to make suggestions for efficiency improvements. We believe this level of service is highly valued by our customers and generates significant customer loyalty. At January 31, 2021, following the BMC Merger, we employed approximately 2,400 sales representatives, who are paid a commission based on gross margin dollars collected and worked with approximately 2,100 sales coordinators and product specialists.
BACKLOG
Due to the nature of our business, backlog information is not meaningful. While our customers may provide an estimate of their future needs, in most cases we do not receive a firm order from them until just prior to the anticipated delivery dates. Accordingly, in many cases the time frame from receipt of a firm order to shipment does not exceed a few days.
MATERIALS AND SUPPLIER RELATIONSHIPS
We purchase inventory primarily for distribution, some of which is also utilized in our manufacturing plants. The key materials we purchase include dimensional lumber, OSB and plywood along with engineered wood, windows, doors, millwork, gypsum and roofing. Our largest suppliers are national companies such as Boise Cascade Company, Weyerhaeuser Company, Canfor Corporation, Norbord, Inc., James Hardie Industries plc, National Gypsum Company, PlyGem Holdings, Inc., M I Windows and Doors, Inc., Andersen Corporation, Masonite International Corporation and JELD-WEN Inc. We believe marketplace supply allows us to competitively source most of our requirements without reliance on any particular supplier and that our diversity of suppliers affords us purchasing flexibility. Due to our centralized procurement platform for commodity wood products and corporate oversight of purchasing programs, we believe we are better able to maximize the advantages of both our and our suppliers’ broad geographic footprints and negotiate purchases across multiple markets to achieve more favorable contracts with respect to price, terms of sale, and supply than our regional competitors. Additionally, for certain customers, we institute purchasing programs on commodity wood products such as OSB and lumber to align portions of our procurement costs with our customer pricing commitments. We balance our OSB and lumber purchases with a mix of contract and spot market purchases to ensure consistent supply of product necessary to fulfill customer contracts, to source products at the lowest possible cost, and to minimize our exposure to the volatility of commodity lumber prices.
We currently source products from thousands of suppliers in order to reduce our dependence on any single company and to maximize purchasing leverage. Although no purchases from any single supplier represented more than 6% of our total materials purchases for the year ended December 31, 2020, we believe we are one of the largest customers for many suppliers, and therefore have significant purchasing leverage. We have found that using multiple suppliers ensures a stable source of products and the best purchasing terms as the suppliers compete to gain and maintain our business.
We maintain strong relationships with our suppliers, and we believe opportunities exist to improve purchasing terms in the future, including inventory storage or “just-in-time” delivery to reduce our inventory carrying costs. We will continue to pursue additional procurement cost savings which would further enhance our margins and cash flow.
COMPETITION
We compete in the Pro Segment of the U.S. residential building products supply market. We have and will continue to experience competition for homebuilder business due to the highly fragmented nature of the Pro Segment. Most of our competitors in the Pro Segment are small, privately held local or regional businesses. Most of these companies have limited access to capital and lack
sophisticated information technology systems and large-scale procurement capabilities. We believe we have substantial competitive advantages over these smaller competitors due to our long-standing customer relationships, local market knowledge and competitive pricing. Our largest competitors in our markets often include one or more of 84 Lumber Company, Carter Lumber Company, US LBM Holdings, LLC and, prior to the BMC Merger, BMC Stock Holdings, Inc.
Our customers primarily consist of professional homebuilders and those that provide construction services to them, with whom we focus on developing strong relationships. The principal methods of competition in the Pro Segment are the development of long-term relationships with professional builders and retaining such customers by (i) delivering a full range of high-quality products on time, and (ii) offering trade credit, competitive pricing and integrated service and product packages, such as turn-key framing and shell construction, as well as manufactured components and installation. Our leading market positions in the highly competitive Pro Segment create economies of scale that allow us to cost-effectively supply our customers, which both enhances profitability and reduces the risk of losing customers to competitors.
HUMAN CAPITAL
Following the BMC Merger, we had more than 26,000 employees. Approximately 500 are covered by collective bargaining agreements and the Company believes that its relations with the labor unions are generally good. Employee levels are managed to align with the pace of business and management believes it has sufficient human capital to operate its business successfully.
At Builders FirstSource, our people are the key to our success and our continued focus on delivering exceptional customer service and innovative solutions. In managing our human capital, our goal is to ensure their safety, growth and development in an inclusive and team-based environment. By participating in regular surveys and focus groups, we place a strong emphasis on enhancing and increasing the retention and engagement level of our team members. Key areas of the Company’s human capital focus include the following:
Workplace Health & Safety
We care about our team members and anyone who enters our workplace. We strive to have a strong environmental, health and safety program that focuses on implementing policies and training programs, as well as performing self-audits to ensure our team members leave their workplace safely, every day. Over the past several years, we have developed and implemented programs designed to promote workplace safety, with the goal of reducing the frequency and severity of employee injuries. We also review and monitor our performance closely by updating our executive team monthly on progress.
During 2020, our experience and continuing focus on workplace safety enabled us to preserve business continuity without sacrificing our commitment to keeping our team members and workplace visitors safe during the COVID-19 pandemic.
The Company also aspires to reduce its lost time and recordable injuries each year. In 2020, we reduced our Total Recordable Incident Rate for the fifth consecutive year.
We also broadly provide accessible safety training to our employees in a number of formats to accommodate the learner’s style and pace, location, and access to technology.
Diversity & Inclusion
Our team members are the face of the Company to our customers and the communities in which we operate. Their contributions in serving our customers is a fundamental component in our success, and every single team member makes a difference.
Our Company strives to foster a culture that encourages collaboration, flexibility and fairness to enable all team members to contribute to their full potential. We are committed to enhancing our efforts related to diversity and inclusion across all aspects of our organization, including hiring, promotion and developmental opportunities. We conduct both in-person and online diversity training through our Learning Management System, and we plan to create greater awareness, eliminate unconscious bias and foster more open and honest communication through the establishment of Diversity & Inclusion Councils.
Learning & Development
In order to attract and retain top talent, we provide several resources in a variety of formats that promote the ongoing learning and development of our team members. We offer leadership development training for new and existing leaders in topics such as: Effective Communication, Conducting Performance Management, Developing Successful and Productive Teams, Conflict Resolution
& Management, Providing Exceptional Customer Service, Hiring for Fit and Building a Diverse and Inclusive Team. We have approximately 1,000 courses in our system which is available to all team members, and our commitment to learning and development was maintained during the COVID-19 pandemic through our online learning management system and limited on-site courses facilitated in a safe setting by our training and development team. We continually adapt and modify existing programs to meet the changing needs of our business and our workforce.
To assess and improve employee retention and engagement, the Company surveys employees with the assistance of third-party consultants, and takes actions to address areas of employee concern. Approximately 85% of team members participated in our most recent engagement survey. The highest scoring categories were Safety, Ethics, Future Outlook for the company, Manager Effectiveness and Trust in Leadership. Additionally, we won Best Places to Work awards in Raleigh, North Carolina, Dallas, Texas and Kansas City, Kansas.
INFORMATION TECHNOLOGY SYSTEMS
Our operations are dependent upon our information technology systems, which encompass all of our major business functions. Our primary enterprise resource planning (“ERP”) system, which we currently use for operations representing the majority of our sales, is a proprietary system that has been highly customized by our computer programmers. The materials required for thousands of standard builder plans are stored by the system for rapid quoting or order entry. Hundreds of price lists are maintained on hundreds of thousands of SKUs, facilitating rapid price changes in a changing product cost environment. A customer’s order can be tracked at each stage of the process and billing can be customized to reduce a customer’s administrative costs and speed payment.
We have a customized financial reporting system that consolidates financial, sales and workforce data from our ERP systems and our human resource information system (“HRIS”), delivering standardized enterprise key performance indicators. This technology platform provides management with robust corporate and location level performance management by leveraging standardized metrics and analytics allowing us to plan, track and report performance and compensation measures.
We have developed a proprietary program for use in our component plants. This software reviews product designs for errors, schedules the plants and provides the data used to measure plant efficiency. In addition, we have purchased several software products that have been integrated with our primary ERP system. These programs assist in various aspects of our business such as analyzing blueprints to generate material lists, purchasing lumber products at the lowest cost, delivery management, resource planning and scheduling and financial planning and analysis.
SEASONALITY AND OTHER FACTORS
Our first and fourth quarters have historically been, and are generally expected to continue to be, adversely affected by weather causing reduced construction activity during these quarters. In addition, quarterly results historically have reflected, and are expected to continue to reflect, fluctuations from period to period arising from the following:
| • | The volatility of lumber prices; |
|---|
| • | The cyclical nature of the homebuilding industry; |
|---|
| • | General economic conditions in the markets in which we compete; |
|---|
| • | The pricing policies of our competitors; |
|---|
| • | Disruptions in our supply chain; |
|---|
| • | The production schedules of our customers; and |
|---|
| • | The effects of weather. |
|---|
The composition and level of working capital typically change during periods of increasing sales as we carry more inventory and receivables. Working capital levels typically increase in the first and second quarters of the year due to higher sales during the peak residential construction season. These increases may result in negative operating cash flows during this peak season, which historically have been financed through available cash and borrowing availability under credit facilities. Generally, collection of receivables and reduction in inventory levels following the peak building and construction season positively impact cash flow. However, in 2020, the Company’s typical seasonal working capital was influenced by the COVID-19 pandemic, which had the effect of deferring the typical peak residential construction season later into the year. This, along with the significant commodity price inflation experienced in the third and fourth quarters of 2020, led to increased working capital levels as of December 31, 2020, as compared to December 31, 2019.
AVAILABLE INFORMATION
We are subject to the informational requirements of the Securities Exchange Act of 1934, as amended, and in accordance therewith, we file reports, proxy and information statements and other information with the SEC. Our annual reports on Form 10-K, quarterly reports on Form 10-Q, current reports on Form 8-K, proxy and information statements and other information and amendments to those reports filed or furnished pursuant to Section 13(a) or 15(d) of the Securities Exchange Act of 1934 are available through the investor relations section of our website under the links to “Financial Information.” Our Internet address is www.bldr.com. Reports are available on our website free of charge as soon as reasonably practicable after we electronically file them with, or furnish them to, the SEC. In addition, our officers and directors file with the SEC initial statements of beneficial ownership and statements of change in beneficial ownership of our securities, which are also available on our website at the same location. We are not including this or any other information on our website as a part of, nor incorporating it by reference into, this Form 10-K or any of our other SEC filings.
In addition to our website, the SEC maintains an Internet site that contains our reports, proxy and information statements, and other information that we electronically file with, or furnish to, the SEC at www.sec.gov.
Item 1A. Risk Factors
Risks associated with our business, any investment in our securities, and with achieving the forward looking statements contained in this report or in our news releases, websites, public filings, investor and analyst conferences or elsewhere, include the risk factors described below. Additional risks and uncertainties not presently known to us or that we currently deem immaterial may also impair our business operations. Any of these risks, whether known or unknown, could cause our actual results to differ materially from expectations and could have a material adverse effect on our business, financial condition or results of operations, and we may not succeed in addressing these challenges and risks. You should read these Risk Factors in conjunction with “Management’s Discussion and Analysis of Financial Condition and Results of Operations” in Item 7 and our consolidated financial statements and related notes in Item 8.
Economic and Industry Risks
The COVID-19 pandemic has impacted our business, and will likely continue to impact our business in the future.
The COVID-19 pandemic has adversely impacted economic activity and conditions worldwide, including workforces, liquidity, capital markets, consumer behavior, supply chains, and macroeconomic conditions, which in turn has materially impacted our business. In particular, the COVID-19 pandemic has recently caused significant disruptions and delays in the manufacture and distribution of building products throughout the industry supply chain, resulting in shortages and shipping delays of several categories of building products, such as windows and lumber. In turn, these supply chain disruptions have in many cases led to significant spikes in the prices of the affected building products. While we expect the COVID-19 pandemic to continue to impact our business in the near term, particularly in regions where we derive a significant amount of our revenue or profit or where our suppliers and customers are located, the extent and duration of the continued effects of the COVID-19 pandemic on our business and results of operation is unknown and will depend on future developments, which are highly uncertain and outside our control. These developments include the scope, duration and severity of the pandemic (including the possibility of further surges or variations of COVID-19 or the emergence of other health epidemics or pandemics), the timing and efficacy of the vaccination program in the U.S., further actions taken by governmental authorities, including future stimulus programs, in response to the pandemic and changing consumer and supplier behavior. It is also possible that the pandemic and its aftermath will lead to a prolonged economic slowdown or recession in the U.S. economy. The current COVID-19 pandemic has impacted and may continue to impact our industry and cause disruptions to our operations, including as a result of temporary closure of locations, decreased demand for our products and services or disruption to our supply chain, all of which could materially and adversely affect our business, financial condition and results of operations.
While we have taken significant precautions to ensure the health and safety of our team members and customers throughout the pandemic, we have had several employees test positive for COVID-19 to date, requiring us to quarantine certain groups of employees and disinfect at certain locations and to occasionally temporarily close certain locations to disinfect. Our operations could be further disrupted in the future if additional employees or employees of our suppliers or customers were suspected or confirmed of having COVID-19 or other illnesses, and such illness required us or our suppliers or customers to quarantine some or all such employees or disinfect additional locations. Also, a number of our administrative employees are working remotely. Remote working may heighten cybersecurity, information security and operational risks and affect the productivity of our employees.
The COVID-19 pandemic has caused, and may continue to cause disruptions in our supply chain. Such disruptions may also be caused by the outbreak of new health epidemics or pandemics. The inability of our suppliers to meet our supply needs in a timely
manner or our quality standards could cause delays to delivery date requirements of our customers. Such failures could result in the cancellation of orders, customers’ refusal to accept deliveries, a reduction in purchase prices, and ultimately, termination of customer relationships, any of which could have a material adverse effect on our business, financial condition, results of operations and liquidity. In that case, we may be required to seek alternative sources of materials or products. Although we believe that we can manage our exposure to these risks, we cannot be certain that we will be able to identify such alternative materials or sources without delay or without greater cost to us. Our inability to identify and secure alternative sources of supply in this situation could have a material adverse effect on our ability to satisfy customer orders. While we have largely been able to manage these supply chain disruptions to date, there is no guarantee that we will be able to do so in the future.
While only some of our locations were temporarily closed in the few states or counties where construction activities were temporarily prohibited at the beginning of the pandemic, we could also be adversely affected if government authorities impose further mandatory closures, seek voluntary closures or impose restrictions on our operations. Even if such measures are not further implemented and a virus or other disease does not spread significantly, the perceived risk of infection or health risk may adversely affect our business and operating results.
We cannot predict the duration or scope of the COVID-19 pandemic or when or how our business, financial conditions and results of operations will be further impacted by it, including as a result of the recent deterioration in the U.S. economy and any related impact on the residential homebuilding industry, and based on the duration and scope, such impact could be material. Historically, in times of an economic recession, new home construction in the United States has slowed considerably. Any significant downturn in new home construction as a result of the economic impact of the COVID-19 pandemic could have an adverse effect on our business, financial condition and results of operations.
To the extent the COVID-19 pandemic adversely affects our business, financial conditions and results of operations, it may also have the effect of heightening many of the other risks described in this “Risk Factors” section.
The industry in which we operate is dependent upon the residential homebuilding industry, as well as the U.S. economy, the credit markets and other important factors.
The building products industry is highly dependent on new home and multifamily construction as well as repair and remodel, which in turn are dependent upon a number of factors, including interest rates, consumer confidence, employment rates, foreclosure rates, housing inventory levels and occupancy, housing demand and the health of the U.S. economy and mortgage markets. Unfavorable changes in demographics, credit markets, consumer confidence, housing affordability, or housing inventory levels and occupancy, or a weakening of the U.S. economy or of any regional or local economy, including as a result of the COVID-19 pandemic, in which we operate could adversely affect consumer spending, result in decreased demand for our products, and adversely affect our business. Production of new homes and multifamily buildings may also decline because of shortages of qualified tradesmen, reliance on inadequately capitalized builders and sub-contractors, and shortages of suitable building lots and material. In addition, the building industry is
Showing the first 8K of 66K characters. Open the full section
Item 1B. Unresolved Staff Comments
None.
Item 2. Properties
We have a broad network of distribution and manufacturing facilities in 40 states throughout the U.S. Based on available 2020 U.S. Census data, we have operations in 85 of the top 100 U.S. Metropolitan Statistical Areas following the BMC Merger, as ranked by single family housing permits in 2020.
Distribution centers typically include 10 to 15 acres of outside storage, a 45,000 square foot warehouse, 4,000 square feet of office space, and 15,000 square feet of covered storage. The outside area provides space for lumber storage and a staging area for delivery while the warehouse stores millwork, windows and doors. The distribution centers are usually located in industrial areas with low cost real estate and easy access to freeways to maximize distribution efficiency and convenience. Many of our distribution centers are situated on rail lines for efficient receipt of goods.
Our manufacturing facilities produce trusses, wall panels, engineered wood, stairs, windows, pre-hung doors and custom millwork. In many cases, they are located on the same premises as our distribution facilities. Truss and panel manufacturing facilities vary in size from 30,000 square feet to 60,000 square feet with eight to 10 acres of outside storage for lumber and for finished goods. Our window manufacturing facility in Houston, Texas is approximately 200,000 square feet.
Following the BMC Merger, we contractually lease approximately 400 facilities and own approximately 150 facilities. These leases typically have an initial lease term of five to 15 years and most provide options to renew for specified periods of time. A majority of our leases provide for fixed annual rentals. Certain of our leases include provisions for escalating rent, as an example, based on changes in the consumer price index. Most of the leases require us to pay taxes, insurance and common area maintenance expenses associated with the properties. As described in Note 10 to the consolidated financial statements included in Item 8 of this annual report on Form 10-K, 131 of our leased facilities are subject to a sales-lease back transaction that is accounted for in our financial statements as owned assets with offsetting financing obligations.
In addition, following the BMC Merger, we operate a fleet of approximately 17,000 rolling stock units, which includes approximately 7,500 trucks and 6,500 forklifts as well as trailers to deliver products from our distribution and manufacturing centers to our customers’ job sites. Through our emphasis on local market flexibility and strategically placed locations, we minimize shipping and freight costs while maintaining a high degree of local market expertise. Through knowledge of local homebuilder needs, customer coordination and rapid restocking ability, we reduce working capital requirements and guard against out-of-stock products. We believe that this reliability is highly valued by our customers and reinforces customer relationships.
Item 3. Legal Proceedings
The Company has a number of known and threatened construction defect legal claims. While these claims are generally covered under the Company’s existing insurance programs to the extent any loss exceeds the deductible, there is a reasonable possibility of loss that is not able to be estimated at this time because (i) many of the proceedings are in the discovery stage, (ii) the outcome of future litigation is uncertain, and/or (iii) the complex nature of the claims. Although the Company cannot estimate a reasonable range of loss based on currently available information, the resolution of these matters could have a material adverse effect on the Company's financial position, results of operations or cash flows.
In addition, we are involved in various other claims and lawsuits incidental to the conduct of our business in the ordinary course. We carry insurance coverage in such amounts in excess of our self-insured retention as we believe to be reasonable under the circumstances and that may or may not cover any or all of our liabilities in respect of such claims and lawsuits. Although the ultimate disposition of these other proceedings cannot be predicted with certainty, management believes the outcome of any such claims that are pending or threatened, either individually or on a combined basis, will not have a material adverse effect on our consolidated financial position, cash flows or results of operations. However, there can be no assurances that future adverse judgments and costs would not be material to our results of operations or liquidity for a particular period.
Although our business and facilities are subject to federal, state and local environmental regulation, environmental regulation does not have a material impact on our operations. We believe that our facilities are in material compliance with such laws and regulations. As owners and lessees of real property, we can be held liable for the investigation or remediation of contamination on such properties, in some circumstances without regard to whether we knew of or were responsible for such contamination. Our current expenditures with respect to environmental investigation and remediation at our facilities are minimal, although no assurance can be provided that more significant remediation may not be required in the future as a result of spills or releases of petroleum products or hazardous substances or the discovery of unknown environmental conditions.
Item 4. Mine Safety Disclosures
Not applicable.
P****ART II
Item 5. Market for Registrant’s Common Equity, Related Stockholder Matters and Issuer Purchases of Equity Securities
Our common stock is traded on the NASDAQ Stock Market LLC under the symbol “BLDR”. The approximate number of stockholders of record of our common stock as of February 24, 2021 was 139.
We currently do not pay dividends. Any future determination relating to dividend policy will be made at the discretion of our board of directors and will depend on a number of factors, including restrictions in our debt instruments, as well as our future earnings, capital requirements, financial condition, prospects and other factors that our board of directors may deem relevant. Our debt agreements currently restrict our ability to pay dividends. See “Management’s Discussion and Analysis of Financial Condition and Results of Operations — Liquidity and Capital Resources” contained in Item 7 of this annual report on Form 10-K.
The graph below matches the cumulative 5-Year total return of holders of Builders FirstSource, Inc.’s common stock with the cumulative total returns of the Russell 2000 index and the S&P 600 Building Products index. The graph assumes that the value of the investment in our common stock, in each index, and in the peer group (including reinvestment of dividends) was $100 on December 31, 2015 and tracks it through December 31, 2020.
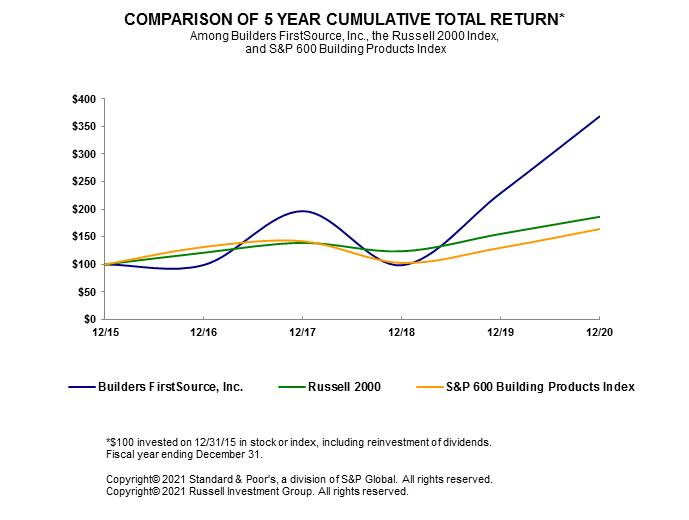
| 12/15 | 12/16 | 12/17 | 12/18 | 12/19 | 12/20 | ||||||||||||||||||
|---|---|---|---|---|---|---|---|---|---|---|---|---|---|---|---|---|---|---|---|---|---|---|---|
| Builders FirstSource, Inc. | 100.00 | 99.01 | 196.66 | 98.47 | 229.33 | 368.32 | |||||||||||||||||
| Russell 2000 | 100.00 | 121.31 | 139.08 | 123.76 | 155.35 | 186.36 | |||||||||||||||||
| S&P 600 Building Products Index | 100.00 | 131.67 | 141.97 | 102.71 | 130.08 | 164.06 |
The stock price performance included in this graph is not necessarily indicative of future stock price performance.
The information regarding securities authorized for issuance under equity compensation plans appears in our definitive proxy statement for our annual meeting of stockholders to be held on June 16, 2021 under the caption “Equity Compensation Plan Information,” which information is incorporated herein by reference.
Item 6. Selected Financial Data
The following selected consolidated financial data for the years ended December 31, 2020, 2019 and 2018 and as of December 31, 2020 and 2019 were derived from our consolidated financial statements which are included in Item 8 of this annual report on Form 10-K. Selected consolidated financial data as of December 31, 2018 and as of and for the years ended December 31, 2017 and 2016 were derived from our consolidated financial statements, but are not included herein.
The following data should be read in conjunction with “Management’s Discussion and Analysis of Financial Condition and Results of Operations” contained in Item 7 of this annual report on Form 10-K and with our consolidated financial statements and related notes included in Item 8 of this annual report on Form 10-K.
| Year Ended December 31, | |||||||||||||||||||||
|---|---|---|---|---|---|---|---|---|---|---|---|---|---|---|---|---|---|---|---|---|---|
| 2020 | 2019 | 2018 | 2017 | 2016 | |||||||||||||||||
| (In thousands, except per share amounts) | |||||||||||||||||||||
| Statement of operations data: | |||||||||||||||||||||
| Net sales (1) | $ | 8,558,874 | $ | 7,280,431 | $ | 7,724,771 | $ | 7,034,209 | $ | 6,367,284 | |||||||||||
| Gross margin | 2,222,584 | 1,976,829 | 1,922,940 | 1,727,391 | 1,596,748 | ||||||||||||||||
| Selling, general and administrative expenses | 1,678,730 | 1,584,523 | 1,553,972 | 1,442,288 | 1,360,412 | ||||||||||||||||
| Net income (loss) (2)(3) | 313,537 | 221,809 | 205,191 | 38,781 | 144,341 | ||||||||||||||||
| Net income (loss) per share — basic | $ | 2.69 | $ | 1.92 | $ | 1.79 | $ | 0.34 | $ | 1.30 | |||||||||||
| Net income (loss) per share — diluted | $ | 2.66 | $ | 1.90 | $ | 1.76 | $ | 0.34 | $ | 1.27 | |||||||||||
| Balance sheet data (end of period): | |||||||||||||||||||||
| Cash and cash equivalents | $ | 423,806 | $ | 14,096 | $ | 10,127 | $ | 57,533 | $ | 14,449 | |||||||||||
| Total assets (4) | 4,173,671 | 3,249,490 | 2,932,309 | 3,006,124 | 2,909,887 | ||||||||||||||||
| Total debt (including current portion) | 1,624,240 | 1,291,273 | 1,561,294 | 1,784,420 | 1,802,052 | ||||||||||||||||
| Stockholders’ equity | 1,152,783 | 824,953 | 596,338 | 376,209 | 309,620 | ||||||||||||||||
| Other financial data: | |||||||||||||||||||||
| Depreciation and amortization | $ | 116,566 | $ | 100,038 | $ | 97,906 | $ | 92,993 | $ | 109,793 |
| (1) | We adopted updated revenue recognition guidance using the modified retrospective method as of January 1, 2018. As such, periods prior to the adoption date have not been restated and continue to be presented in accordance with previous guidance. |
|---|
| (2) | Net income for the year ended December 31, 2017 includes $29.0 million in income tax expense attributable to revaluation of our net deferred tax assets resulting from the enactment of the 2017 Tax Act. Net income for the year ended December 31, 2016 includes a reduction to our valuation allowance of $131.7 million as we released the valuation allowance against our net federal and certain state deferred tax assets in that period. |
|---|
| (3) | Net income for the year ended December 31, 2020 includes net losses on debt extinguishment and other financing costs of $29.4 million. Net income for the year ended December 31, 2019 includes net losses on debt extinguishment and other financing costs of $10.2 million. Net income for the year ended December 31, 2018 includes a net gain on debt extinguishment of $3.2 million. Our 2020, 2019, and 2018 debt transactions are discussed in detail in Note 9 to the consolidated financial statements included in Item 8 of this annual report on Form 10-K. Net income for the year ended December 31, 2017 includes net losses on debt extinguishment and other financing costs of $58.7 million. Net income for the year ended December 31, 2016 includes net losses on debt extinguishment and other financing costs of $56.9 million. |
|---|
| (4) | We adopted guidance relating to leases using the modified retrospective method as of January 1, 2019. As such, periods prior to the adoption date have not been restated and continue to be presented in accordance with previous guidance. |
|---|
Item 7. Management’s Discussion and Analysis of Financial Condition and Results of Operations
The following discussion of our financial condition and results of operations should be read in conjunction with the selected financial data and the consolidated financial statements and related notes contained in Item 6. Selected Financial Data and Item 8. Financial Statements and Supplementary Data of this annual report on Form 10-K, respectively. See “Risk Factors” contained in Item 1A. Risk Factors of this annual report on Form 10-K and “Cautionary Statement” contained in Item 1. Business of this annual report on Form 10-K for a discussion of the uncertainties, risks and assumptions associated with these statements.
OVERVIEW
We are a leading supplier and manufacturer of building materials, manufactured components and construction services to professional contractors, sub-contractors and consumers. Following the BMC Merger, the Company operates approximately 550 locations in 40 states across the United States. Given the span and depth of our geographical reach, prior to the BMC Merger our locations were organized into nine geographical regions (Regions 1 through 9), which were also our operating segments, and these were further aggregated into four reportable segments: Northeast, Southeast, South and West. Following the BMC Merger, we will re-evaluate our operating and reportable segments for future reporting periods. All of our segments have similar customers, products and services, and distribution methods. Our financial statements contain additional information regarding segment performance which is discussed in Note 15 to the consolidated financial statements included in Item 8 of this annual report on Form 10-K.
We offer an integrated solution to our customers providing manufacturing, supply and installation of a full range of structural and related building products. Our manufactured products include our factory-built roof and floor trusses, wall panels and stairs, vinyl windows, custom millwork and trim, as well as engineered wood that we design, cut, and assemble for each home. We also assemble interior and exterior doors into pre-hung units. Additionally, we supply our customers with a broad offering of professional grade building products not manufactured by us, such as dimensional lumber and lumber sheet goods and various window, door and millwork lines. Our full range of construction-related services includes professional installation, turn-key framing and shell construction, and spans all our product categories.
We group our building products into six product categories:
| • | Lumber & Lumber Sheet Goods. Lumber & lumber sheet goods include dimensional lumber, plywood, and OSB products used in on-site house framing. |
|---|
| • | Manufactured Products. Manufactured products consist of wood floor and roof trusses, steel roof trusses, wall panels, stairs, and engineered wood. |
|---|
| • | Windows, Door & Millwork. Windows & doors are comprised of the manufacturing, assembly, and distribution of windows and the assembly and distribution of interior and exterior door units. Millwork includes interior trim and custom features that we manufacture under the Synboard ® brand name. |
|---|
| • | Gypsum, Roofing & Insulation. Gypsum, roofing, & insulation include wallboard, ceilings, joint treatment and finishes. |
|---|
| • | Siding, Metal, and Concrete. Siding, metal, and concrete includes vinyl, composite, and wood siding, exterior trim, other exteriors, metal studs and cement. |
|---|
| • | Other Building Products & Services. Other building products & services are comprised of products such as cabinets and hardware as well as services such as turn-key framing, shell construction, design assistance, and professional installation spanning the majority of our product categories. |
|---|
Our operating results are dependent on the following trends, strategies, events and uncertainties, some of which are beyond our control:
| • | Homebuilding Industry and Market Competition. Our business is driven primarily by the residential new construction market and the residential repair and remodel market, which are in turn dependent upon a number of factors, including demographic trends, interest rates, consumer confidence, employment rates, housing affordability, household formation, land development costs, the availability of skilled construction labor, and the health of the economy and mortgage markets. According to the U.S. Census Bureau, annual U.S. total and single-family housing starts were 1.4 million and 1.0 million, respectively, in 2020. Due to increased competition for homebuilder business and cyclical fluctuations in commodity prices, we may experience pressure on our gross margins. In addition to these factors, there has been a trend of consolidation within the building products supply industry. However, our industry remains highly fragmented and competitive and we will continue to face significant competition from local and regional suppliers. We believe there are several meaningful trends that indicate U.S. housing demand will continue to grow, including historically low interest rates, the aging of housing stock, and normal population growth due to immigration and birthrate exceeding death rate. Building upon the current rate of market growth, industry forecasters, including the National Association of Homebuilders (“NAHB”), expect to see continued increases in housing demand over the next year. |
|---|
| • | Effect of COVID-19 Pandemic. In March of 2020, the U.S. economy began to see significant disruption, uncertainty and record high levels of unemployment as a result of the COVID-19 pandemic. While the COVID-19 pandemic did not have a materially adverse impact on our financial results in 2020, the extent and duration of any future impact resulting from the pandemic is not fully known, and we may experience a decline in housing starts, reduced sales demand, volatility in commodity prices, challenges in the supply chain, increased margin pressures and/or increased operating costs as a result. |
|---|
| • | Targeting Large Production Homebuilders. In recent years, the homebuilding industry has undergone consolidation, and the larger homebuilders have increased their market share. We expect that trend to continue as larger homebuilders have better liquidity and land positions relative to the smaller, less capitalized homebuilders. Our focus is on maintaining relationships and market share with these customers while balancing the competitive pressures we are facing in servicing large homebuilders with certain profitability expectations. Additionally, we have been successful in expanding our custom homebuilder base while maintaining acceptable credit standards. |
|---|
| • | Repair and remodel end market. Although the repair and remodel end market is influenced by housing starts to a lesser degree than the homebuilding market, the repair and remodel end market is still dependent upon some of the same factors as the homebuilding market, including demographic trends, interest rates, consumer confidence, employment rates and the health of the economy and home financing markets. The repair and remodel end market has been impacted by the COVID-19 pandemic and while the extent of this impact and related uncertainties are yet to be fully known, we may experience reduced sales demand, increased margin pressures and/or increased operating costs in this area of our business as a result. We expect that our ability to remain competitive in this space will depend on our continued ability to provide a high level of customer service coupled with a broad product offering. |
|---|
| • | Use of Prefabricated Components. Homebuilders are increasingly using prefabricated components in order to realize increased efficiency, overcome skilled construction labor shortages and improve quality. Shortening cycle time from start to completion is a key imperative of the homebuilders during periods of strong consumer demand. We continue to see the demand for prefabricated components increasing within the residential new construction market as the availability of skilled construction labor remains limited. |
|---|
| • | Economic Conditions. Economic changes both nationally and locally in our markets impact our financial performance. The building products supply industry is highly dependent upon new home construction and subject to cyclical market changes. Our operations are subject to fluctuations arising from changes in supply and demand, national and local economic conditions, labor costs and availability, competition, government regulation, trade policies and other factors that affect the homebuilding industry such as demographic trends, interest rates, housing starts, the high cost of land development, employment levels, consumer confidence, and the availability of credit to homebuilders, contractors, and homeowners. The disruptions and uncertainties as a result of the ensuing COVID-19 pandemic may have a significant impact on our future operating results. |
|---|
| • | Housing Affordability. The affordability of housing can be a key driver in demand for our products. Home affordability is influenced by a number of economic factors, such as the level of employment, consumer confidence, consumer income, supply of houses, the availability of financing and interest rates. Changes in the inventory of available homes as well as economic factors relative to home prices could result in changes to the affordability of homes. As a result, homebuyer demand may shift towards smaller, or larger, homes creating fluctuations in demand for our products. |
|---|
| • | Cost of Materials. Prices of wood products, which are subject to cyclical market fluctuations, may adversely impact operating income when prices rapidly rise or fall within a relatively short period of time. We purchase certain materials, including lumber products, which are then sold to customers as well as used as direct production inputs for our manufactured and prefabricated products. Short-term changes in the cost of these materials, some of which are subject to significant fluctuations, are oftentimes passed on to our customers, but our pricing quotation periods and market competition may limit our ability to pass on such price changes. We may also be limited in our ability to pass on increases on in-bound freight costs on our products. Our inability to pass on material price increases to our customers could adversely impact our operating results. |
|---|
| • | Controlling Expenses. Another important aspect of our strategy is controlling costs and striving to be a low-cost building materials supplier in the markets we serve. We pay close attention to managing our working capital and operating expenses. Further, we pay careful attention to our logistics function and its effect on our shipping and handling costs. |
|---|
| • | Multi-Family and Light Commercial Business. Our primary focus has been, and continues to be, on single-family residential new construction and the repair and remodel end market. However, we will continue to identify opportunities for profitable growth in the multi-family and light commercial markets. |
|---|
| • | Capital Structure. As a result of our historical growth through acquisitions, we had $1,642.4 million of indebtedness as of December 31, 2020. We strive to optimize our capital structure to ensure that our financial needs are met in light of economic conditions, business activities, organic investments, opportunities for growth through acquisition and the overall risk characteristics of our underlying assets. In addition to these factors, we also evaluate our capital structure on the basis of our leverage ratio, our liquidity position, our debt maturity profile and market interest rates. As such, we may enter into various debt or equity transactions in order to appropriately manage and optimize our capital structure and liquidity needs. |
|---|
RECENT DEVELOPMENTS
General
On January 1, 2021, we completed our previously announced all stock merger transaction with BMC. The BMC Merger will be accounted for using the acquisition method of accounting, and Builders FirstSource, Inc. will be treated as the accounting acquirer. The operating results of BMC will be reported as part of the Company beginning on the closing date of the BMC Merger and as such, the historical financial condition, results of operations and cash flows of the Company presented in this annual report do not include BMC.
COVID-19 Pandemic
The COVID-19 pandemic resulted in significant disruption to the U.S. economy in 2020 and impacted our operations and those of our customers. Despite experiencing disruptions to our operations and implementing a number of health and safety precautions as a result of the pandemic, our financial results and financial condition were not materially adversely affected by the pandemic. In most of the states in which we operate, construction was deemed an essential activity and, as a result, our operations faced limited temporary closures early on in the pandemic. Furthermore, housing starts and repair and remodeling activity generally increased throughout our markets in 2020 despite the pandemic.
Despite the limited impact of the COVID-19 pandemic on our 2020 financial results, the extent to which the pandemic may impact our results in future periods is uncertain and will depend upon, among other things, the duration and severity of the outbreak or subsequent outbreaks, related government responses, such as required physical distancing or restrictions on business operations and travel, the pace of recovery of economic activity and the impact to consumers, the effectiveness of available vaccines, and any potential supply disruptions, all of which are uncertain and difficult to predict in light of the rapidly evolving landscape. Refer to Part I, Item 1A. Risk Factors for a full discussion of the risks associated with the COVID-19 pandemic.
Business Combinations
On January 9, 2020, we acquired certain assets and operations of Bianchi & Company, Inc. (“Bianchi”) for $15.9 million in cash. Located in Charlotte, North Carolina, Bianchi is a supplier and installer of interior and exterior millwork.
On November 2, 2020 we acquired certain assets and operations of Kansas Building Supply Company, Inc. (“KBS”) for $16.8 million in cash. Located in Overland Park, Kansas, KBS is a supplier for interior and exterior doors, windows, millwork cabinetry, and hardware.
These acquisitions are described in Note 5 to the consolidated financial statements included in Item 8 of this annual report on Form 10-K.
Debt Transactions
During the year ended December 31, 2020, the Company executed several debt transactions, including the redemption of $503.9 million in outstanding aggregate principal amount of 5.625% senior secured notes due 2024 (“2024 notes”), the redemption of $47.5 million in aggregate principal amount of 6.75% senior secured notes due 2027 (“2027 notes”), and repayment of $52.0 million of our senior secured term loan facility due 2024 (“2024 term loan”). The repayments of our 2024 notes and 2027 notes were funded with the proceeds of the issuance of $550.0 million in aggregate principal amount of 5.00% unsecured senior notes due 2030 (“2030 notes”) and borrowings on our $900.0 million revolving credit facility (“2023 facility”). The repayment of our 2024 term loan was funded with cash on hand. The Company also issued an additional $350.0 million in aggregate principal amount of our 2027 notes.
On January 29, 2021, the Company amended the 2023 facility to, among other things, increase the total commitments by an aggregate amount of $500.0 million resulting in a new $1.4 billion amended credit facility, and extended the maturity date from November 2023 to January 2026.
On February 16, 2021, pursuant to the optional call feature in the 2027 Indenture, the Company gave notice that on March 3, 2021, $82.5 million of 2027 notes will be redeemed at a redemption price equal to 103% of the principal amount of the notes, plus accrued and unpaid interest.
These transactions are described in Notes 9 and 18 to the consolidated financial statements included in Item 8 of this annual report on Form 10-K. Collectively, these transactions have extended our debt maturity. From time to time, based on market conditions and other factors and subject to compliance with applicable laws and regulations, the Company may repurchase or call our notes, repay debt, repurchase shares of our common stock or otherwise enter into transactions regarding its capital structure.
Retirement of President and Chief Executive Officer
In January 2020, Mr. Chad Crow notified our Board of his decision to retire as President and Chief Executive Officer of the Company during 2020 after assisting the Board in hiring his replacement. Mr. Crow will continue to serve as the Company’s Chief Executive Officer for a transition period of 90 days after the BMC Merger, following which BMC’s former Chief Executive Officer, and the recently appointed President of the Company, Mr. Dave Flitman, will succeed Mr. Crow as Chief Executive Officer of the Company.
Composition of the Board of Directors of the Company
As a result of the BMC Merger, effective January 1, 2021, the size of the board of directors was increased to twelve directors, with seven directors designated by the Company and five directors designated by BMC.
CURRENT OPERATING CONDITIONS AND OUTLOOK
According to the U.S. Census Bureau, actual U.S. total housing starts for the year ended December 31, 2020 were 1.4 million, an increase of 7.0% compared to the year ended December 31, 2019. Actual U.S. single-family housing starts for the year ended December 31, 2020 were 1.0 million, an increase of 11.7% compared to the year ended December 31 2019. A composite of third party sources, including the NAHB, are forecasting 1.5 million U.S. total housing starts and 1.1 million U.S. single-family housing starts for 2021, which are increases of 6.0% and 11.0%, respectively, from 2020. In addition, in its September 2020 semi-annual forecast, the Home Improvement Research Institute (“HIRI”) forecasted sales in the professional repair and remodel end market to increase approximately 5.3% in 2021 compared to 2020.
Our net sales for the year ended December 31, 2020 increased 17.6% over the same period last year. Commodity price inflation increased our net sales in 2020 by an estimated 9.0%, while acquisitions and one more selling day increased our sales by 2.5% and 0.5%, respectively. Excluding the impact of commodity price inflation, acquisitions and the impact of one more selling day, we achieved 5.6% net sales growth in the single-family, multi-family and repair and remodel/other end markets. Our gross margin percentage decreased by 1.2% during the year ended December 31, 2020 compared to the year ended December 31, 2019, primarily attributable to margin pressures as a result of commodity price inflation. Our selling, general and administrative expenses, as a percentage of net sales, were 19.6% in 2020, a 2.2% decrease from 21.8% in 2019, primarily driven by the effect of leverage from commodity price inflation in our net sales in the year ended December 31, 2020 compared to the year ended December 31, 2019.
We believe the long-term outlook for the housing industry is positive due to growth in the underlying demographics compared to historical new construction levels. We feel we are well-positioned to take advantage of the construction activity in our markets and to increase our market share, which may include strategic acquisitions. We will continue to focus on working capital by closely monitoring the credit exposure of our customers, remaining focused on maintaining the right level of inventory and by working with our vendors to improve payment terms and pricing on our products. We strive to achieve the appropriate balance of short-term expense control while maintaining the expertise and capacity to grow the business as market conditions continue to improve. In addition, optimization of our capital structure will continue to be a key area of focus for the Company.
RESULTS OF OPERATIONS
A discussion regarding our financial condition and results of operations for the year ended December 31, 2020 compared to the year ended December 31, 2019 is presented below. A discussion regarding our financial condition and results of operations for the year ended December 31, 2019 compared to the year ended December 31, 2018 can be found under Item 7 of Part II of our Annual Report on Form 10-K for the fiscal year ended December 31, 2019, filed with the SEC on February 21, 2020.
20****20 Compared with 201****9
The following table sets forth the percentage relationship to net sales of certain costs, expenses and income items for the years ended December 31:
| 2020 | 2019 | ||||||||
|---|---|---|---|---|---|---|---|---|---|
| Net sales | 100.0 | % | 100.0 | % | |||||
| Cost of sales | 74.0 | % | 72.8 | % | |||||
| Gross margin | 26.0 | % | 27.2 | % | |||||
| Selling, general and administrative expenses | 19.6 | % | 21.8 | % | |||||
| Income from operations | 6.4 | % | 5.4 | % | |||||
| Interest expense, net | 1.6 | % | 1.5 | % | |||||
| Income tax expense | 1.1 | % | 0.8 | % | |||||
| Net income | 3.7 | % | 3.1 | % |
Net Sales. Net sales for the year ended December 31, 2020 were $8,558.9 million, a 17.6% increase from net sales of $7,280.4 million for 2019. Core organic growth increased net sales by 5.6%, commodity price inflation accounted for another 9.0% of the change, while acquisitions and one additional selling day accounted for 2.5% and 0.5%, respectively, of the increase. Core organic growth came primarily from increased sales volume within our single-family end market.
The following table shows net sales classified by major product category for the years ended December 31, (dollars in millions):
| 2020 | 2019 | |||||||||||||||||||
|---|---|---|---|---|---|---|---|---|---|---|---|---|---|---|---|---|---|---|---|---|
| Net sales | % of Sales | Net sales | % of Sales | % Change | ||||||||||||||||
| Lumber & lumber sheet goods | $ | 3,076.4 | 35.9 | % | $ | 2,251.6 | 30.9 | % | 36.6 | % | ||||||||||
| Manufactured products | 1,640.5 | 19.2 | % | 1,449.5 | 19.9 | % | 13.2 | % | ||||||||||||
| Windows, doors & millwork | 1,629.2 | 19.0 | % | 1,542.9 | 21.2 | % | 5.6 | % | ||||||||||||
| Gypsum, roofing & insulation | 514.6 | 6.0 | % | 528.6 | 7.3 | % | (2.6 | )% | ||||||||||||
| Siding, metal & concrete products | 773.6 | 9.0 | % | 712.6 | 9.8 | % | 8.6 | % | ||||||||||||
| Other building products & services | 924.6 | 10.9 | % | 795.2 | 10.9 | % | 16.3 | % | ||||||||||||
| Total sales | $ | 8,558.9 | 100.0 | % | $ | 7,280.4 | 100.0 | % | 17.6 | % |
We achieved increased net sales in all our product categories, except in the gypsum, roofing & insulation category, in part due to higher sales volumes in our single-family end market and as a result of our continued efforts to focus on higher margin opportunities through both acquisition targets and core organic growth, as well as the impact of commodity price inflation, primarily on the lumber & lumber sheet goods category, in the period.
Gross Margin. Gross margin increased $245.8 million to $2,222.6 million. Our gross margin percentage decreased to 26.0% in 2020 from 27.2% in 2019, a 1.2% decrease. The decrease was primarily attributable to the impact of commodity price inflation during the year ended December 31, 2020 relative to our short-term customer pricing commitments.
Selling, General and Administrative Expenses. Selling, general and administrative expenses increased $94.2 million, or 5.9%, and as a percentage of net sales decreased to 19.6% from 21.8% in 2019. This increase in selling, general and administrative expenses was primarily driven by higher variable compensation expense, professional service expense, and depreciation expense, which were partially offset by lower fuel costs, as well as lower travel and entertainment costs, resulting from changed behavior during the pandemic. We expect these variable costs to increase post pandemic. Contributing to the decrease as a percentage of net sales was the effect of commodity price inflation on our net sales in the year ended December, 31 2020.
Interest Expense, Net. Interest expense was $135.7 million in 2020, an increase of $26.1 million from 2019. This increase in interest expense is primarily due to one-time charges of $29.4 million related to debt transactions executed in 2020, compared to one-time charges of $10.2 million related to debt transactions executed in 2019. Adjusting for the one-time charges, interest expense increased for the year ended December 31, 2020 due to higher outstanding debt balance as compared to the year ended December 31, 2019, partially offset by the effect of lower interest rates.
Income Tax Expense. We recorded income tax expense of $94.6 million during the year ended December 31, 2020 compared to income tax expense of $60.9 million during the year ended December 31, 2019, an increase of $33.7 million, primarily as a result of our higher profitability in 2020 compared to 2019. Our effective tax rate was 23.2% for the year ended December 31, 2020 compared to 21.6% for the year ended December 31, 2019.
Results by Reportable Segment
The following tables show net sales and income before income taxes by reportable segment excluding the “All Other” caption as shown in Note 15 to the consolidated financial statements included in Item 8 of this annual report on Form 10-K (dollars in thousands):
| Year ended December 31, | |||||||||||||||||||||||||||||||||||||||||
|---|---|---|---|---|---|---|---|---|---|---|---|---|---|---|---|---|---|---|---|---|---|---|---|---|---|---|---|---|---|---|---|---|---|---|---|---|---|---|---|---|---|
| Net sales | Income before income taxes | ||||||||||||||||||||||||||||||||||||||||
| % of net | % of net | % of net | % of net | ||||||||||||||||||||||||||||||||||||||
| 2020 | sales | 2019 | sales | % change | 2020 | sales | 2019 | sales | % change | ||||||||||||||||||||||||||||||||
| Northeast | $ | 1,323,972 | 16.0 | % | $ | 1,293,472 | 18.6 | % | 2.4 | % | $ | 56,574 | 4.3 | % | $ | 56,573 | 4.4 | % | — | ||||||||||||||||||||||
| Southeast | 1,947,888 | 23.6 | % | 1,599,426 | 23.0 | % | 21.8 | % | 139,017 | 7.1 | % | 83,722 | 5.2 | % | 66.0 | % | |||||||||||||||||||||||||
| South | 2,346,160 | 28.4 | % | 1,860,653 | 26.7 | % | 26.1 | % | 163,224 | 7.0 | % | 113,359 | 6.1 | % | 44.0 | % | |||||||||||||||||||||||||
| West | 2,639,133 | 32.0 | % | 2,205,224 | 31.7 | % | 19.7 | % | 156,744 | 5.9 | % | 89,206 | 4.0 | % | 75.7 | % | |||||||||||||||||||||||||
| $ | 8,257,153 | 100 | % | $ | 6,958,775 | 100.0 | % | $ | 515,559 | 6.2 | % | $ | 342,860 | 4.9 | % |
We have four reportable segments based on an aggregation of the geographic regions in which we operate. While there is some geographic similarity between our reportable segments and the regions as defined by the U.S. Census Bureau, our reportable segments do not necessarily fully align with any single U.S. Census Bureau region.
According to the U.S. Census Bureau, actual single-family housing starts for the year ended December 31, 2020 increased 7.4%, 13.6%, 11.4%, and 12.4% in the Northeast, Midwest, South and West regions, respectively, compared to the year ended December 31, 2019. For the year ended December 31, 2020, our net sales increased in the Northeast, Southeast, South and West reportable segments primarily due to an increase in sales volume across the majority of our product categories, and commodity price inflation compared to the year ended December 31, 2019. We achieved increased profitability in our Southeast, South, and West reportable segments largely due to sales volume growth. However, profitability declined in our Northeast reportable segment largely due to the impact of the COVID-19 pandemic on net sales and the impact of gross margin compression from commodity price inflation.
LIQUIDITY AND CAPITAL RESOURCES
Our primary capital requirements are to fund working capital needs and operating expenses, meet required interest and principal payments, and to fund capital expenditures and potential future growth opportunities. Our capital resources at December 31, 2020 consist of cash on hand and borrowing availability under our 2023 facility.
Our 2023 facility will be primarily used for working capital, general corporate purposes, and funding capital expenditures and growth opportunities. In addition, we may use the 2023 facility to facilitate debt consolidation. Availability under the 2023 facility is determined by a borrowing base. Our borrowing base consists of trade accounts receivable, inventory, other receivables which include progress billings and credit card receivables, and qualified cash that all meet specific criteria contained within the credit agreement, minus agent specified reserves. Net excess borrowing availability is equal to the maximum borrowing amount minus outstanding borrowings and letters of credit.
The following table shows our borrowing base and excess availability as of December 31, 2020 and 2019 (in millions):
| As of | |||||||
|---|---|---|---|---|---|---|---|
| December 31, 2020 | December 31, 2019 | ||||||
| Accounts Receivable Availability | $ | 608.8 | $ | 413.0 | |||
| Inventory Availability | 514.7 | 370.0 | |||||
| Other Receivables Availability | 50.9 | 29.8 | |||||
| Gross Availability | 1,174.4 | 812.8 | |||||
| Less: | |||||||
| Agent Reserves | (40.6 | ) | (26.6 | ) | |||
| Plus: | |||||||
| Cash in Qualified Accounts | 413.9 | 4.2 | |||||
| Borrowing Base | 1,547.7 | 790.4 | |||||
| Aggregate Revolving Commitments | 900.0 | 900.0 | |||||
| Maximum Borrowing Amount (lesser of Borrowing Base and Aggregate Revolving Commitments) | 900.0 | 790.4 | |||||
| Less: | |||||||
| Outstanding Borrowings | (75.0 | ) | (27.0 | ) | |||
| Letters of Credit | (78.0 | ) | (82.2 | ) | |||
| Net Excess Borrowing Availability on Revolving Facility | $ | 747.0 | $ | 681.2 |
As of December 31, 2020, we had $75.0 million in outstanding borrowings under our 2023 facility and our net excess borrowing availability was $747.0 million after being reduced by outstanding letters of credit of approximately $78.0 million. Excess availability must equal or exceed a minimum specified amount, currently $90.0 million, or we are required to meet a fixed charge coverage ratio of 1:00 to 1:00. We were not in violation of any covenants or restrictions imposed by any of our debt agreements at December 31, 2020.
Liquidity
Our liquidity at December 31, 2020 was $1,170.8 million, which consists of net borrowing availability under the 2023 facility and cash on hand.
Our level of indebtedness results in significant interest expense and could have the effect of, among other things, reducing our flexibility to respond to changing business and economic conditions. From time to time, based on market conditions and other factors and subject to compliance with applicable laws and regulations, the Company may repurchase or call our notes, repay debt, or otherwise enter into transactions regarding its capital structure.
Should the current industry conditions deteriorate or we pursue additional acquisitions, we may be required to raise additional funds through the sale of capital stock or debt in the public capital markets or in privately negotiated transactions. There can be no assurance that any of these financing options would be available on favorable terms, if at all. Alternatives to help supplement our liquidity position could include, but are not limited to, idling or permanently closing additional facilities, adjusting our headcount in response to current business conditions, attempts to renegotiate leases, managing our working capital and/or divesting of non-core businesses. There are no assurances that these steps would prove successful or materially improve our liquidity position.
On January 29, 2021, the Company amended the 2023 facility to, among other things, increase the total commitments by an aggregate amount of $500.0 million resulting in a new $1.4 billion amended credit facility, and extended the maturity date from November 2023 to January 2026.
Consolidated Cash Flows
A discussion regarding our consolidated cash flows for the year ended December 31, 2020 compared to the year ended December 31, 2019 is presented below. A discussion regarding our consolidated cash flows for the year ended December 31, 2019 compared to the year ended December 31, 2018 can be found under Item 7 of Part II of our Annual Report on Form 10-K for the fiscal year ended December 31, 2019, filed with the SEC on February 21, 2020.
2020 Compared with 2019
Cash provided by operating activities was $260.1 million and $504.0 million in 2020 and 2019, respectively. The $243.9 million decrease in cash provided by operations was largely the result of a working capital increase of $263.2 million in 2020 compared to a working capital decrease of $106.2 million in 2019. This change in working capital was primarily due to the timing and impact of changes in commodity prices on the value of cash received from customers, inventory purchases and cash paid to vendors during the year ended December 31, 2020 compared to the year ended December 31, 2019.
Cash used in investing activities was $136.2 million and $199.2 million in 2020 and 2019, respectively. This decrease in cash used in investing activities was primarily due to $32.6 million in cash used for our acquisitions of Bianchi and KBS in 2020, compared to $92.9 million in cash used for our acquisitions of Sun State Components, Raney Components, LLC and Raney Construction, Inc. in 2019.
Cash provided by financing activities was $285.9 million in 2020, compared to cash used in financing activities of $300.9 million in 2019. Cash provided by financing activities for the year 2020 was primarily related to the net proceeds received from the Company’s financing transactions during the period, including the issuance of $550.0 million of 2030 notes and the issuance of $350.0 million of 2027 notes. The proceeds from these issuances were offset by the redemption of the remaining $503.9 million in outstanding aggregate principal amount of 2024 notes, $47.5 million in aggregate principal amount of senior secured notes due 2027, and the repayment of the remaining $52.0 million term loan.
Capital Expenditures
Capital expenditures vary depending on prevailing business factors, including current and anticipated market conditions. Historically, capital expenditures have for the most part remained at relatively low levels in comparison to the operating cash flows generated during the corresponding periods. Following the BMC Merger, we expect our 2021 capital expenditures to be in the range of approximately $210 million to $230 million primarily related to rolling stock, equipment and facility improvements to support our operations.
DISCLOSURES OF CONTRACTUAL OBLIGATIONS AND COMMERCIAL COMMITMENTS
The following summarizes our contractual obligations as of December 31, 2020 (in thousands):
| Payments Due by Period | ||||||||||||||||||||
|---|---|---|---|---|---|---|---|---|---|---|---|---|---|---|---|---|---|---|---|---|
| Contractual obligations | Total | Less than 1 year | 1-3 years | 3-5 years | More than 5 years | |||||||||||||||
| Long-term debt | $ | 1,402,500 | $ | — | $ | 75,000 | $ | — | $ | 1,327,500 | ||||||||||
| Interest on long-term debt(1) | 607,797 | 86,534 | 172,368 | 159,963 | 188,932 | |||||||||||||||
| Other finance obligations(2) | 258,796 | 17,196 | 33,629 | 33,671 | 174,300 | |||||||||||||||
| Finance lease obligations(2) | 25,446 | 13,242 | 11,887 | 317 | — | |||||||||||||||
| Operating leases (2) | 342,117 | 76,567 | 113,425 | 67,166 | 84,959 | |||||||||||||||
| Total contractual cash obligations | $ | 2,636,656 | $ | 193,539 | $ | 406,309 | $ | 261,117 | $ | 1,775,691 |
| (1) | We had $75.0 million in outstanding borrowings under the 2023 facility as of December 31, 2020. Borrowings under the 2023 facility bear interest at a variable rate. Therefore, actual interest may differ from the amounts presented above due to interest rate changes or any future borrowing activity under the 2023 facility. |
|---|
| (2) | Future commitments for other finance obligations, finance lease obligations and operating lease obligations associated with real estate, vehicle, and other various equipment. |
|---|
Purchase orders entered into in the ordinary course of business are excluded from the above table because they are payable within one year. Amounts for which we are liable under purchase orders are reflected on our consolidated balance sheet as accounts payable. Where it makes economic sense to do so, we plan to lease certain equipment during 2021 to support anticipated sales growth.
OTHER CASH OBLIGATIONS NOT REFLECTED IN THE BALANCE SHEET
In addition to the lease obligations included in the above table, we have residual value guarantees on certain equipment leases. Under these leases we have the option of (1) purchasing the equipment at the end of the lease term, (2) arranging for the sale of the equipment to a third party, or (3) returning the equipment to the lessor to sell the equipment. If the sales proceeds in either case are less than the residual value, then we are required to reimburse the lessor for the deficiency up to a specified level as stated in each lease agreement. The guarantees under these leases for the residual values of equipment at the end of the respective operating lease periods approximated $4.5 million as of December 31, 2020.
Based upon the expectation that none of these leased assets will have a residual value at the end of the lease term that is materially less than the value specified in the related operating lease agreement or that we will purchase the equipment at the end of the lease term, we do not believe it is probable that we will be required to fund any amounts under the terms of these guarantee arrangements. Accordingly, no accruals have been recognized for these guarantees.
In addition, the Company is party to certain agreements related to its other finance obligations which commit the Company to perform certain repairs and maintenance obligations under the leases in a specified manner and timeframe. As of December 31, 2020 our obligations under these agreements have largely been completed with the remainder expected to be completed within the next year.
CRITICAL ACCOUNTING POLICIES AND ESTIMATES
Critical accounting policies are those that both are important to the accurate portrayal of a company’s financial condition and results, and require subjective or complex judgments, often as a result of the need to make estimates about the effect of matters that are inherently uncertain.
In order to prepare financial statements that conform to generally accepted accounting principles, we make estimates and assumptions that affect the amounts reported in our financial statements and accompanying notes. Certain estimates are particularly sensitive due to their significance to the financial statements and the possibility that future events may be significantly different from our expectations.
We have identified the following accounting policy that requires us to make the most subjective or complex judgments in order to fairly present our consolidated financial position and results of operations.
Goodwill. Goodwill represents the excess of the amount we paid to acquire businesses over the estimated fair value of tangible assets and identifiable intangible assets acquired, less liabilities assumed. At December 31, 2020, our goodwill balance was $785.3 million, representing 18.8% of our total assets.
We test goodwill for impairment in the fourth quarter of each year or at any other time when impairment indicators exist. Examples of such indicators that could cause us to test goodwill for impairment between annual tests include a significant change in the business climate, unexpected competition or a significant deterioration in market share. We may also consider market capitalization relative to our net assets. Housing starts are a significant sales driver for us. If there is a significant decline or an expected decline in housing starts, this could adversely affect our expectations for a reporting unit and the value of that reporting unit.
The process of evaluating goodwill for impairment involves the determination of the fair value of our reporting units. Our reporting units are aligned with our nine geographic regions which are also determined to be our operating segments. In evaluating goodwill for impairment, the Company first assesses qualitative factors to determine whether it is more likely than not that the fair value of the reporting unit is less than its carrying amount. If it is concluded that it is more likely than not that the fair value of the reporting unit is not less than its carrying amount, then no further testing of the goodwill is required.
However, if we determine that it is more likely than not that the fair value of the reporting unit is less than its carrying amount, we perform a quantitative goodwill impairment test. This test identifies both the existence of and the amount of goodwill impairment by comparing the fair value of a reporting unit to its carrying amount, including goodwill. If the fair value of a reporting unit exceeds its carrying amount goodwill is not impaired. If the carrying amount of a reporting unit exceeds its fair value an impairment loss is recognized in amount equal to that excess, limited to the amount of goodwill allocated to that reporting unit.
In performing our annual goodwill impairment tests at December 31, 2020, we first assessed qualitative factors relative to each of our reporting units to determine if it was more likely than not that the fair value of our reporting units were less than their carrying amounts. Examples of such factors we considered in this assessment included the amount of cushion from prior quantitative goodwill impairment tests, significant changes in the goodwill balance, the presence of any known or forecasted declines in operating performance, market conditions, market share or any other negative factors.
For reporting units where we determined that it was more likely than not that the fair values were less than their carrying amounts, we performed a quantitative goodwill impairment test. In evaluating our goodwill for impairment at December 31, 2020, $77.1 million of our goodwill balance was assessed utilizing a quantitative assessment. In performing the quantitative impairment test at December 31, 2020, we developed the fair value using a discounted cash flow methodology. Inherent in such fair value determinations are significant assumptions relating to future cash flows, expected future revenues, expected future profitability, the discount rate, the terminal value, and our interpretation of current economic indicators and market conditions and their impact on our strategic plans and operations. Due to the uncertainties associated with such estimates, interpretations and assumptions, actual results could differ from projected results, which could result in impairment of goodwill being recorded.
Significant information and assumptions utilized in estimating future cash flows for quantitative goodwill impairment analyses include projections of revenue growth utilizing publicly available industry information such as lumber commodity prices and housing start forecasts developed by industry forecasters, including the NAHB. Expected future profitability reflects current headcount levels and cost structure and are flexed in future years based upon historical trends at various revenue levels. Long-term growth was based upon terminal value earnings before interest, taxes, depreciation and amortization (“EBITDA”) multiples of 6.0x to reflect the relevant expected acquisition price. A discount rate of 11.0% was used and is intended to reflect the weighted average cost of capital for a potential market participant and includes all risks of ownership and the associated risks of realizing the stream of projected future cash flows. Decreasing the long-term growth to an EBITDA multiple of 5.0x, or increasing the discount rate by 1.0% to 12.0%, would not have changed the results of our impairment testing.
At December 31, 2020, the fair values of each of our reporting units were substantially in excess of their respective carrying amounts. Factors that could negatively impact the estimated fair value of our reporting units and potentially trigger additional impairment include, but are not limited to, unexpected competition, lower than expected housing starts, an increase in market participant weighted average cost of capital, increases in material or labor cost, and significant declines in our market capitalization. Future impairment of goodwill would have the effect of decreasing our earnings or increasing our losses in such period, but would not impact our current outstanding debt obligations or compliance with covenants contained in the related debt agreements. We did not have any goodwill impairments in 2020, 2019 or 2018.
RECENTLY ISSUED ACCOUNTING STANDARDS
Information regarding recent accounting pronouncements is discussed in Note 2 to the consolidated financial statements included in Item 8 of this annual report on Form 10-K.
Item 7A. Quantitative and Qualitative Disclosures about Market Risk
We may experience changes in interest expense if changes in our debt occur. Changes in market interest rates could also affect our interest expense. Our 2027 notes and 2030 notes bear interest at a fixed rate, therefore, our interest expense related to these notes would not be affected by an increase in market interest rates. Borrowings under the 2023 facility bear interest at either a base rate or eurodollar rate, plus, in each case, an applicable margin. A 1.0% increase in interest rates on the 2023 facility would result in approximately $0.8 in additional interest expense annually based on our $75.0 million in outstanding borrowings as of December 31, 2020. The 2023 facility also assesses variable commitment and outstanding letter of credit fees based on quarterly average loan utilization.
We purchase certain materials, including lumber products, which are then sold to customers as well as used as direct production inputs for our manufactured products that we deliver. Short-term changes in the cost of these materials and the related in-bound freight costs, some of which are subject to significant fluctuations, are sometimes, but not always, passed on to our customers. Delays in our ability to pass on material price increases to our customers can adversely impact our operating results.
I****tem 8. Financial Statements and Supplementary Data
INDEX TO CONSOLIDATED FINANCIAL STATEMENTS
Report of Independent Registered Public Accounting Firm
To the Board of Directors and Stockholders of Builders FirstSource, Inc.
Opinions on the Financial Statements and Internal Control over Financial Reporting
We have audited the accompanying consolidated balance sheet of Builders FirstSource, Inc. and its subsidiaries (the “Company”) as of December 31, 2020 and 2019, and the related consolidated statements of operations and comprehensive income, of changes in stockholders’ equity and of cash flows for each of the three years in the period ended December 31, 2020, including the related notes (collectively referred to as the “consolidated financial statements”). We also have audited the Company's internal control over financial reporting as of December 31, 2020, based on criteria established in Internal Control - Integrated Framework (2013) issued by the Committee of Sponsoring Organizations of the Treadway Commission (COSO).
In our opinion, the consolidated financial statements referred to above present fairly, in all material respects, the financial position of the Company as of December 31, 2020 and 2019, and the results of its operations and its cash flows for each of the three years in the period ended December 31, 2020 in conformity with accounting principles generally accepted in the United States of America. Also in our opinion, the Company maintained, in all material respects, effective internal control over financial reporting as of December 31, 2020, based on criteria established in Internal Control - Integrated Framework (2013) issued by the COSO.
Change in Accounting Principle
As discussed in Note 2 to the consolidated financial statements, the Company changed the manner in which it accounts for leases in 2019.
Basis for Opinions
The Company's management is responsible for these consolidated financial statements, for maintaining effective internal control over financial reporting, and for its assessment of the effectiveness of internal control over financial reporting, included in Management’s Report on Internal Control over Financial Reporting appearing under Item 9A. Our responsibility is to express opinions on the Company’s consolidated financial statements and on the Company's internal control over financial reporting based on our audits. We are a public accounting firm registered with the Public Company Accounting Oversight Board (United States) (PCAOB) and are required to be independent with respect to the Company in accordance with the U.S. federal securities laws and the applicable rules and regulations of the Securities and Exchange Commission and the PCAOB.
We conducted our audits in accordance with the standards of the PCAOB. Those standards require that we plan and perform the audits to obtain reasonable assurance about whether the consolidated financial statements are free of material misstatement, whether due to error or fraud, and whether effective internal control over financial reporting was maintained in all material respects.
Our audits of the consolidated financial statements included performing procedures to assess the risks of material misstatement of the consolidated financial statements, whether due to error or fraud, and performing procedures that respond to those risks. Such procedures included examining, on a test basis, evidence regarding the amounts and disclosures in the consolidated financial statements. Our audits also included evaluating the accounting principles used and significant estimates made by management, as well as evaluating the overall presentation of the consolidated financial statements. Our audit of internal control over financial reporting included obtaining an understanding of internal control over financial reporting, assessing the risk that a material weakness exists, and testing and evaluating the design and operating effectiveness of internal control based on the assessed risk. Our audits also included performing such other procedures as we considered necessary in the circumstances. We believe that our audits provide a reasonable basis for our opinions.
Definition and Limitations of Internal Control over Financial Reporting
A company’s internal control over financial reporting is a process designed to provide reasonable assurance regarding the reliability of financial reporting and the preparation of financial statements for external purposes in accordance with generally accepted accounting principles. A company’s internal control over financial reporting includes those policies and procedures that (i) pertain to the maintenance of records that, in reasonable detail, accurately and fairly reflect the transactions and dispositions of the assets of the company; (ii) provide reasonable assurance that transactions are recorded as necessary to permit preparation of financial statements in accordance with generally accepted accounting principles, and that receipts and expenditures of the company are being made only in accordance with authorizations of management and directors of the company; and (iii) provide reasonable assurance regarding prevention or timely detection of unauthorized acquisition, use, or disposition of the company’s assets that could have a material effect on the financial statements.
Because of its inherent limitations, internal control over financial reporting may not prevent or detect misstatements. Also, projections of any evaluation of effectiveness to future periods are subject to the risk that controls may become inadequate because of changes in conditions, or that the degree of compliance with the policies or procedures may deteriorate.
Critical Audit Matters
The critical audit matter communicated below is a matter arising from the current period audit of the consolidated financial statements that was communicated or required to be communicated to the audit committee
Showing the first 8K of 131K characters. Open the full section
Item 9. Changes in and Disagreements with Accountants on Accounting and Financial Disclosure
None.
Item 9A. Controls and Procedures
Disclosure Controls Evaluation and Related CEO and CFO Certifications. Our management, with the participation of our principal executive officer (“CEO”) and principal financial officer (“CFO”) conducted an evaluation of the effectiveness of the design and operation of our disclosure controls and procedures as of the end of the period covered by this annual report.
Certifications of our CEO and our CFO, which are required in accordance with Rule 13a-14 of the Securities Exchange Act of 1934, as amended (“Exchange Act”), are attached as exhibits to this annual report. This “Controls and Procedures” section includes the information concerning the controls evaluation referred to in the certifications, and it should be read in conjunction with the certifications for a more complete understanding of the topics presented.
Limitations on the Effectiveness of Controls. We do not expect that our disclosure controls and procedures will prevent all errors and all fraud. A system of controls and procedures, no matter how well conceived and operated, can provide only reasonable, not absolute, assurance that the objectives of the system are met. Because of the limitations in all such systems, no evaluation can provide absolute assurance that all control issues and instances of fraud, if any, within the Company have been detected. Furthermore, the design of any system of controls and procedures is based in part upon certain assumptions about the likelihood of future events, and there can be no assurance that any design will succeed in achieving its stated goals under all potential future conditions, regardless of how unlikely. Because of these inherent limitations in a cost-effective system of controls and procedures, misstatements or omissions due to error or fraud may occur and not be detected.
Scope of the Controls Evaluation. The evaluation of our disclosure controls and procedures included a review of their objectives and design, the Company’s implementation of the controls and procedures and the effect of the controls and procedures on the information generated for use in this annual report. In the course of the evaluation, we sought to identify whether we had any data errors, control problems or acts of fraud and to confirm that appropriate corrective action, including process improvements, were being undertaken if needed. This type of evaluation is performed on a quarterly basis so that conclusions concerning the effectiveness of our disclosure controls and procedures can be reported in our quarterly reports on Form 10-Q. Many of the components of our disclosure controls and procedures are also evaluated by our internal audit department, our legal department and by personnel in our finance organization. The overall goals of these various evaluation activities are to monitor our disclosure controls and procedures on an ongoing basis, and to maintain them as dynamic systems that change as conditions warrant.
Conclusions regarding Disclosure Controls. Based on the required evaluation of our disclosure controls and procedures, our CEO and CFO have concluded that, as of December 31, 2020, we maintained disclosure controls and procedures that were effective in providing reasonable assurance that information required to be disclosed by us in the reports that we file or submit under the Exchange Act is recorded, processed, summarized and reported within the time periods specified in the SEC’s rules and forms, and that such information is accumulated and communicated to our management, including our CEO and CFO, as appropriate, to allow timely decisions regarding required disclosure.
Management’s Report on Internal Control over Financial Reporting. Our management is responsible for establishing and maintaining adequate internal control over financial reporting, as such term is defined in Rule 13a-15(f) of the Exchange Act. Internal control over financial reporting is a process designed to provide reasonable assurance regarding the reliability of financial reporting and the preparation of financial statements for external purposes in accordance with generally accepted accounting principles ("GAAP"). Internal control over financial reporting includes policies and procedures that: (i) pertain to the maintenance of records that, in reasonable detail, accurately and fairly reflect the transactions and dispositions of our assets; (ii) provide reasonable assurance that transactions are recorded as necessary to permit preparation of financial statements in accordance with GAAP, and that our receipts and expenditures are being made only in accordance with authorizations of our management and directors; and (iii) provide reasonable assurance regarding prevention or timely detection of unauthorized acquisition, use or disposition of our assets that could have a material effect on the financial statements.
Because of its inherent limitations, internal control over financial reporting may not prevent or detect misstatements. Also, projections of any evaluation of effectiveness to future periods are subject to the risk that controls may become inadequate because of changes in conditions, or that the degree of compliance with existing policies or procedures may deteriorate.
Under the supervision and with the participation of our management, including our CEO and CFO, we conducted an evaluation of the effectiveness of our internal control over financial reporting based on the framework set forth in Internal Control — Integrated Framework (2013) issued by the Committee of Sponsoring Organizations of the Treadway Commission. Based on our evaluation under the framework set forth in Internal Control — Integrated Framework (2013), our management concluded that our internal control over financial reporting was effective as of December 31, 2020.
The effectiveness of the Company’s internal control over financial reporting as of December 31, 2020, has been audited by PricewaterhouseCoopers LLP, an independent registered public accounting firm, as stated in their report which appears herein.
Changes in Internal Control over Financial Reporting. During the quarter ended December 31, 2020, there were no changes in our internal control over financial reporting that have materially affected, or are reasonably likely to materially affect, our internal control over financial reporting.
Item 9B. Other Information
None.
P****ART III
Item 10. Directors, Executive Officers and Corporate Governance
The information required by this item appears in our definitive proxy statement for our annual meeting of stockholders to be held June 16, 2021 under the captions “Proposal 1 — Election of Directors,” “Continuing Directors,” “Information Regarding the Board and Its Committees,” “Corporate Governance,” “Section 16(a) Beneficial Ownership Reporting Compliance,” and “Executive Officers of the Registrant,” which information is incorporated herein by reference.
Code of Business Conduct and Ethics
Builders FirstSource, Inc. and its subsidiaries endeavor to do business according to the highest ethical and legal standards, complying with both the letter and spirit of the law. Our board of directors approved a Code of Business Conduct and Ethics that applies to our directors, officers (including our principal executive officer, principal financial officer and principal accounting officer) and employees. Our Code of Business Conduct and Ethics is administered by a compliance committee made up of representatives from our legal, human resources, finance and internal audit departments.
Our employees are encouraged to report any suspected violations of laws, regulations and the Code of Business Conduct and Ethics, and all unethical business practices. We provide continuously monitored hotlines for anonymous reporting by employees.
Our board of directors has also approved a Supplemental Code of Ethics for the Chief Executive Officer, President, and Senior Financial Officers of Builders FirstSource, Inc., which is administered by our general counsel.
Both of these policies are listed as exhibits to this annual report on Form 10-K and can be found in the “Investors” section of our corporate Web site at: www.bldr.com.
Stockholders may request a free copy of these policies by contacting the Corporate Secretary, Builders FirstSource, Inc., 2001 Bryan Street, Suite 1600, Dallas, Texas 75201, United States of America.
In addition, within four business days of:
| • | Any amendment to a provision of our Code of Business Conduct and Ethics or our Supplemental Code of Ethics for Chief Executive Officer, President and Senior Financial Officers of Builders FirstSource, Inc. that applies to our chief executive officer, chief financial officer or chief accounting officer as it relates to one or more of the items set forth in Item 406(b) of Regulation S-K; or |
|---|
| • | The grant of any waiver, including an implicit waiver, from a provision of one of these policies to one of these officers that relates to one or more of the items set forth in Item 406(b) of Regulation S-K, |
|---|
we will provide information regarding any such amendment or waiver (including the nature of any waiver, the name of the person to whom the waiver was granted and the date of the waiver) on our Web site at the Internet address above, and such information will be available on our Web site for at least a 12-month period. In addition, we will disclose any amendments and waivers to our Code of Business Conduct and Ethics or our Supplemental Code of Ethics for Chief Executive Officer, President and Senior Financial Officers of Builders FirstSource, Inc. as required by the listing standards of the NASDAQ Stock Market LLC.
Item 11. Executive Compensation
The information required by this item appears in our definitive proxy statement for our annual meeting of stockholders to be held June 16, 2021, under the captions “Executive Compensation and Other Information,” “Information Regarding the Board and its Committees — Compensation of Directors,” and “Compensation Committee Interlocks and Insider Participation,” which information is incorporated herein by reference.
Item 12. Security Ownership of Certain Beneficial Owners and Management and Related Stockholder Matters
The information required by this item appears in our definitive proxy statement for our annual meeting of stockholders to be held on June 16, 2021, under the caption “Ownership of Securities” and “Equity Compensation Plan Information,” which information is incorporated herein by reference.
I****tem 13. Certain Relationships and Related Transactions, and Director Independence
The information required by this item appears in our definitive proxy statement for our annual meeting of stockholders to be held June 16, 2021, under the caption “Election of Directors and Management Information,” “Information Regarding the Board and its Committees,” and “Certain Relationships and Related Party Transactions,” which information is incorporated herein by reference.
Item 14. Principal Accountant Fees and Services
The information required by this item appears in our definitive proxy statement for our annual meeting of stockholders to be held June 16, 2021, under the caption “Proposal 3 — Ratification of Selection of Independent Registered Public Accounting Firm — Fees Paid to PricewaterhouseCoopers LLP,” which information is incorporated herein by reference.
P****ART IV
Item 15. Exhibits and Financial Statement Schedules
(a) (1) See the index to consolidated financial statements provided in Item 8 for a list of the financial statements filed as part of this report.
(2) Financial statement schedules are omitted because they are either not applicable or not material.
(3) The following documents are filed, furnished or incorporated by reference as exhibits to this report as required by Item 601 of Regulation S-K.
| * | Filed herewith |
|---|
| ** | Builders FirstSource, Inc. is furnishing, but not filing, the written statement pursuant to Title 18 United States Code 1350, as added by Section 906 of the Sarbanes-Oxley Act of 2002, of M. Chad Crow, our Chief Executive Officer, and Peter M. Jackson, our Chief Financial Officer. |
|---|
| + | Indicates a management contract or compensatory plan or arrangement |
|---|
(b) A list of exhibits filed, furnished or incorporated by reference with this Form 10-K is provided above under Item 15(a)(3) of this report. Builders FirstSource, Inc. will furnish a copy of any exhibit listed above to any stockholder without charge upon written request to Timothy D. Johnson, Executive Vice President, General Counsel and Corporate Secretary, 2001 Bryan Street, Suite 1600, Dallas, Texas 75201.
(c) Not applicable
Item 16. Form 10-K Summary
None.
SIGNATURES
Pursuant to the requirements of Section 13 or 15(d) of the Securities Exchange Act of 1934, the registrant has duly caused this report to be signed on its behalf by the undersigned, thereunto duly authorized.
February 26, 2021
| BUILDERS FIRSTSOURCE, INC. | |
|---|---|
| /s/ M. CHAD CROW | |
| M. Chad Crow | |
| Chief Executive Officer |
The undersigned hereby constitute and appoint Timothy D. Johnson and his substitutes our true and lawful attorneys-in-fact with full power to execute in our name and behalf in the capacities indicated below any and all amendments to this report and to file the same, with all exhibits thereto and other documents in connection therewith, with the Securities and Exchange Commission, and hereby ratify and confirm all that such attorney-in-fact or his substitutes shall lawfully do or cause to be done by virtue thereof.
Pursuant to the requirements of the Securities Exchange Act of 1934, this report has been signed below by the following persons on behalf of the registrant and in the capacities and on the dates indicated.
| Signature | Title | Date | ||
|---|---|---|---|---|
| /s/ M. CHAD CROW | Chief Executive Officer | February 26, 2021 | ||
| M. Chad Crow | (Principal Executive Officer) | |||
| /s/ PETER M. JACKSON | Executive Vice President and Chief Financial Officer | February 26, 2021 | ||
| Peter M. Jackson | (Principal Financial Officer) | |||
| /s/ JAMI COULTER | Senior Vice President and Chief Accounting Officer | February 26, 2021 | ||
| Jami Coulter | (Principal Accounting Officer) | |||
| /s/ DAVID E. FLITMAN | President and Director | February 26, 2021 | ||
| David E. Flitman | ||||
| /s/ PAUL S. LEVY | Chairman and Director | February 26, 2021 | ||
| Paul S. Levy | ||||
| /s/ DANIEL AGROSKIN | Director | February 26, 2021 | ||
| Daniel Agroskin | ||||
| /s/ MARK ALEXANDER | Director | February 26, 2021 | ||
| Mark Alexander | ||||
| /s/ CORY J. BOYDSTON | Director | February 26, 2021 | ||
| Cory J. Boydston | ||||
| /s/ DAVID W. BULLOCK | Director | February 26, 2021 | ||
| David W. Bullock | ||||
| /s/ CLEVELAND A. CHRISTOPHE | Director | February 26, 2021 | ||
| Cleveland A. Christophe | ||||
| /s/ WILLIAM B. HAYES | Director | February 26, 2021 | ||
| William B. Hayes | ||||
| /s/ BRETT N. MILGRIM | Director | February 26, 2021 | ||
| Brett N. Milgrim | ||||
| /s/ JAMES O’LEARY | Director | February 26, 2021 | ||
| James O’Leary |
| Signature | Title | Date | ||
|---|---|---|---|---|
| /s/ FLOYD F. SHERMAN | ||||
| Floyd F. Sherman | Director | February 26, 2021 | ||
| /s/ CRAIG A. STEINKE | ||||
| Craig A. Steinke | Director | February 26, 2021 |