 filings.tools
Berkshire Hathaway 10-K 2017-12-31
Filed 2018-02-26. 16 sections, 565K characters. Original on sec.gov · Markdown · JSON
Cover and table of contents
10-K 1 d437858d10k.htm 10-K
Table of Contents
UNITED STATES
SECURITIES AND EXCHANGE COMMISSION
Washington, D.C. 20549
FORM 10-K
ANNUAL REPORT PURSUANT TO SECTION 13 OR 15(d) OF THE SECURITIES EXCHANGE ACT OF 1934
For the fiscal year ended December 31, 2017
Commission file number 001-14905
BERKSHIRE HATHAWAY INC.
(Exact name of Registrant as specified in its charter)
| Delaware | 47-0813844 | |
| State or other jurisdiction of incorporation or organization | (I.R.S. Employer Identification Number) | |
| 3555 Farnam Street, Omaha, Nebraska | 68131 | |
| (Address of principal executive office) | (Zip Code) |
Registrant’s telephone number, including area code (402) 346-1400
Securities registered pursuant to Section 12(b) of the Act:
| Title of each class | Name of each exchange on which registered | |
| Class A common stock, $5.00 Par Value | New York Stock Exchange | |
| Class B common stock, $0.0033 Par Value | New York Stock Exchange |
Securities registered pursuant to Section 12(g) of the Act: NONE
Indicate by check mark if the Registrant is a well-known seasoned issuer, as defined in Rule 405 of the Securities Act. Yes ☑ No ☐
Indicate by check mark if the Registrant is not required to file reports pursuant to Section 13 or Section 15(d) of the Act. Yes ☐ No ☑
Indicate by check mark whether the Registrant (1) has filed all reports required to be filed by Section 13 or 15(d) of the Securities Exchange Act of 1934 during the preceding 12 months, and (2) has been subject to such filing requirements for the past 90 days. Yes ☑ No ☐
Indicate by check mark whether the Registrant has submitted electronically and posted on its corporate Website, if any, every Interactive Data File required to be submitted and posted pursuant to Rule 405 of Regulations S-T during the preceding 12 months. Yes ☑ No ☐
Indicate by check mark if disclosure of delinquent filers pursuant to Item 405 of Regulation S-K is not contained herein, and will not be contained, to the best of Registrant’s knowledge, in definitive proxy or information statements incorporated by reference in Part III of this Form 10-K or any amendment to this Form 10-K. ☐
Indicate by check mark whether the Registrant is a large accelerated filer, an accelerated filer, a non-accelerated filer, smaller reporting company, or an emerging growth company. See the definitions of “large accelerated filer,” “accelerated filer,” “smaller reporting company,” and “emerging growth company” in Rule 12b-2 of the Exchange Act.: Large accelerated filer ☑ Accelerated filer ☐ Non-accelerated filer ☐ Smaller reporting company ☐ Emerging growth company ☐
If an emerging growth company, indicate by check mark if the registrant has elected not to use the extended transition period for complying with any new or revised financial accounting standards provided pursuant to Section 13(a) of the Exchange Act. ☐
Indicate by check mark whether the Registrant is a shell company (as defined in Rule 12b-2 of the Exchange Act). Yes ☐ No ☑
State the aggregate market value of the voting stock held by non-affiliates of the Registrant as of June 30, 2017: $327,898,000,000*
Indicate number of shares outstanding of each of the Registrant’s classes of common stock:
| February 13, 2018—Class A common stock, $5 par value | 748,745 shares | |
| February 13, 2018—Class B common stock, $0.0033 par value | 1,344,332,039 shares |
DOCUMENTS INCORPORATED BY REFERENCE
| Document | Incorporated In | |
| Proxy Statement for Registrant’s Annual Meeting to be held May 5, 2018 | Part III |
| * | This aggregate value is computed at the last sale price of the common stock on June 30, 2017. It does not include the value of Class A common stock (312,306 shares) and Class B common stock (64,664,309 shares) held by Directors and Executive Officers of the Registrant and members of their immediate families, some of whom may not constitute “affiliates” for purpose of the Securities Exchange Act of 1934. |
|---|
Table of Contents
Table of Contents
Table of Contents
Part I
Item 1. Business Description
| --- | --- |
Berkshire Hathaway Inc. (“Berkshire,” “Company” or “Registrant”) is a holding company owning subsidiaries engaged in a number of diverse business activities. The most important of these are insurance businesses conducted on both a primary basis and a reinsurance basis, a freight rail transportation business and a group of utility and energy generation and distribution businesses. Berkshire also owns and operates a large number of other businesses engaged in a variety of activities, as identified herein. Berkshire is domiciled in the state of Delaware, and its corporate headquarters are located in Omaha, Nebraska.
Berkshire’s operating businesses are managed on an unusually decentralized basis. There are essentially no centralized or integrated business functions (such as sales, marketing, purchasing, legal or human resources) and there is minimal involvement by Berkshire’s corporate headquarters in the day-to-day business activities of the operating businesses. Berkshire’s corporate senior management team participates in and is ultimately responsible for significant capital allocation decisions, investment activities and the selection of the Chief Executive to head each of the operating businesses. It also is responsible for establishing and monitoring Berkshire’s corporate governance practices, including, but not limited to, communicating the appropriate “tone at the top” messages to its employees and associates, monitoring governance efforts, including those at the operating businesses, and participating in the resolution of governance-related issues as needed.
Berkshire and its consolidated subsidiaries employ approximately 377,000 people worldwide.
Insurance and Reinsurance Businesses
Berkshire’s insurance and reinsurance business activities are conducted through numerous domestic and foreign-based insurance entities. Berkshire’s insurance businesses provide insurance and reinsurance of property and casualty risks and also reinsure life, accident and health risks worldwide.
In direct or primary insurance activities, the insurer assumes the risk of loss from persons or organizations that are directly subject to the risks. Such risks may relate to property, casualty (or liability), life, accident, health, financial or other perils that may arise from an insurable event. In reinsurance activities, the reinsurer assumes defined portions of risks that other direct insurers or reinsurers have assumed in their own insuring activities.
Reinsurance contracts are normally classified as treaty or facultative contracts. Treaty reinsurance refers to reinsurance coverage for all or a portion of a specified group or class of risks ceded by the direct insurer, while facultative reinsurance involves coverage of specific individual underlying risks. Reinsurance contracts are further classified as quota-share or excess. Under quota-share (proportional or pro-rata) reinsurance, the reinsurer shares proportionally in the original premiums and losses of the direct insurer or reinsurer. Excess (or non-proportional) reinsurance provides for the indemnification of the direct insurer or reinsurer for all or a portion of the loss in excess of an agreed upon amount or “retention.” Both quota-share and excess reinsurance contracts may provide for aggregate limits of indemnification.
Insurance and reinsurance are generally subject to regulatory oversight throughout the world. Except for regulatory considerations, there are virtually no barriers to entry into the insurance and reinsurance industry. Competitors may be domestic or foreign, as well as licensed or unlicensed. The number of competitors within the industry is not known. Insurers and reinsurers compete on the basis of reliability, financial strength and stability, financial ratings, underwriting consistency, service, business ethics, price, performance, capacity, policy terms and coverage conditions.
Insurers based in the United States (“U.S.”) are subject to regulation by their states of domicile and by those states in which they are licensed to write policies on an admitted basis. The primary focus of regulation is to assure that insurers are financially solvent and that policyholder interests are otherwise protected. States establish minimum capital levels for insurance companies and establish guidelines for permissible business and investment activities. States have the authority to suspend or revoke a company’s authority to do business as conditions warrant. States regulate the payment of dividends by insurance companies to their shareholders and other transactions with affiliates. Dividends, capital distributions and other transactions of extraordinary amounts are subject to prior regulatory approval.
Insurers may market, sell and service insurance policies in the states where they are licensed. These insurers are referred to as admitted insurers. Admitted insurers are generally required to obtain regulatory approval of their policy forms and premium rates. Non-admitted insurance markets have developed to provide insurance that is otherwise unavailable through admitted insurers. Non-admitted insurance, often referred to as “excess and surplus” lines, is procured by either state-licensed surplus lines brokers who place risks with insurers not licensed in that state or by the insured party’s direct procurement from non-admitted insurers. Non-admitted insurance is subject to considerably less regulation with respect to policy rates and forms. Reinsurers are normally not required to obtain regulatory approval of premium rates or reinsurance contracts.
K-1
Table of Contents
The insurance regulators of every state participate in the National Association of Insurance Commissioners (“NAIC”). The NAIC adopts forms, instructions and accounting procedures for use by U.S. insurers and reinsurers in preparing and filing annual statutory financial statements. However, an insurer’s state of domicile has ultimate authority over these matters. In addition to its activities relating to the annual statement, the NAIC develops or adopts statutory accounting principles, model laws, regulations and programs for use by its members. Such matters deal with regulatory oversight of solvency, risk management, compliance with financial regulation standards and risk-based capital reporting requirements.
Berkshire’s insurance companies maintain capital strength at exceptionally high levels, which differentiates them from their competitors. Collectively, the combined statutory surplus of Berkshire’s U.S. based insurers was approximately $170 billion at December 31, 2017. Berkshire’s major insurance subsidiaries are rated AA+ by Standard & Poor’s and A++ (superior) by A.M. Best with respect to their financial condition and claims paying ability.
The Terrorism Risk Insurance Act of 2002 established within the Department of the Treasury a Terrorism Insurance Program (“Program”) for commercial property and casualty insurers by providing federal reinsurance of insured terrorism losses. The Program currently extends to December 31, 2020 through other Acts, most recently the Terrorism Risk Insurance Program Reauthorization Act of 2015 (the “2015 TRIA Reauthorization”). Hereinafter these Acts are collectively referred to as TRIA. Under TRIA, the Department of the Treasury is charged with certifying “acts of terrorism.” During 2018, coverage under TRIA will occur if the industry insured loss for certified events occurring during the calendar year exceeds $160 million. Under the 2015 TRIA Reauthorization, the level of insured losses for certified events occurring during the calendar year required to trigger coverage under TRIA will increase annually by $20 million per year until the level of insured losses required to trigger coverage reaches $200 million in 2020. To be eligible for federal reinsurance, insurers must make available insurance coverage for acts of terrorism, by providing policyholders with
Showing the first 8K of 117K characters. Open the full section
Item 1A. Risk Factors
| --- | --- |
Berkshire and its subsidiaries (referred to herein as “we,” “us,” “our” or similar expressions) are subject to certain risks and uncertainties in its business operations which are described below. The risks and uncertainties described below are not the only risks we face. Additional risks and uncertainties that are presently unknown or are currently deemed immaterial may also impair our business operations.
We are dependent on a few key people for our major investment and capital allocation decisions.
Major investment decisions and all major capital allocation decisions are made by Warren E. Buffett, Chairman of the Board of Directors and Chief Executive Officer, age 87, in consultation with Charles T. Munger, Vice Chairman of the Board of Directors, age 94. If for any reason the services of our key personnel, particularly Mr. Buffett, were to become unavailable, there could be a material adverse effect on our operations. However, Berkshire’s Board of Directors has identified certain current Berkshire subsidiary managers who, in their judgment, are capable of succeeding Mr. Buffett and has agreed on a replacement for Mr. Buffett should a replacement be needed currently. The Board continually monitors this risk and could alter its current view regarding a replacement for Mr. Buffett in the future. We believe that the Board’s succession plan, together with the outstanding managers running our numerous and highly diversified operating units helps to mitigate this risk.
We need qualified personnel to manage and operate our various businesses.
In our decentralized business model, we need qualified and competent management to direct day-to-day business activities of our operating subsidiaries and to manage changes in future business operations due to changing business or regulatory environments. Our operating subsidiaries also need qualified and competent personnel in executing their business plans and serving their customers, suppliers and other stakeholders. Our inability to recruit and retain qualified and competent managers and personnel could negatively affect the operating results, financial condition and liquidity of our subsidiaries and Berkshire as a whole.
K-22
Table of Contents
The past growth rate in Berkshire’s book value per share is not an indication of future results.
In the years since present management acquired control of Berkshire, our book value per share has grown at a highly satisfactory rate. Because of the large size of our capital base (Berkshire shareholders’ equity was approximately $348 billion as of December 31, 2017), our book value per share will very likely not increase in the future at a rate close to its past rate.
Investments are unusually concentrated and fair values are subject to loss in value.
We concentrate a high percentage of the investments of our insurance subsidiaries in a relatively small number of equity securities and diversify our investment portfolios far less than is conventional in the insurance industry. A significant decline in the fair values of our larger investments may produce a material decline in our consolidated shareholders’ equity and our consolidated book value per share. Beginning in 2018, all changes in the fair values of equity securities (whether realized or unrealized) will be recognized as gains or losses in our consolidated statement of earnings. Accordingly, significant declines in the fair values of these securities will produce significant declines in our reported earnings.
Since a large percentage of our equity securities are held by our insurance subsidiaries, significant decreases in the fair values of these investments will produce significant declines in statutory surplus. Our large statutory surplus is a competitive advantage, and a material decline could have a materially adverse effect on our claims-paying ability ratings and our ability to write new insurance business thus potentially reducing our future underwriting profits.
Competition and technology may erode our business franchises and result in lower earnings.
Each of our operating businesses face intense competitive pressures within markets in which they operate. While we manage our businesses with the objective of achieving long-term sustainable growth by developing and strengthening competitive advantages, many factors, including market and technology changes, may erode or prevent the strengthening of competitive advantages. Accordingly, future operating results will depend to some degree on whether our operating units are successful in protecting or enhancing their competitive advantages. If our operating businesses are unsuccessful in these efforts, our periodic operating results in the future may decline.
Deterioration of general economic conditions may significantly reduce our operating earnings and impair our ability to access capital markets at a reasonable cost.
Our operating businesses are subject to normal economic cycles affecting the economy in general or the industries in which they operate. To the extent that the economy deteriorates for a prolonged period of time, one or more of our significant operations could be materially harmed. In addition, our utilities and energy businesses and our railroad business regularly utilize debt as a component of their capital structures. These businesses depend on having access to borrowed funds through the capital markets at reasonable rates. To the extent that access to the capital markets is restricted or the cost of funding increases, these operations could be adversely affected.
Terrorist acts could hurt our operating businesses.
A successful (as defined by the aggressor) cyber, biological, nuclear or chemical attack could produce significant losses to our worldwide operations. Our business operations could be adversely affected directly through the loss of human resources or destruction of production facilities and information systems. This is a risk that we share with all businesses.
Regulatory changes may adversely impact our future operating results.
In recent years, partially in response to financial markets crises, global economic recessions, and social and environmental issues, regulatory initiatives have accelerated in the United States and abroad. Such initiatives address for example, the regulation of banks and other major financial institutions, environmental and global-warming matters and health care reform. These initiatives impact not only our regulated insurance, energy and railroad transportation businesses, but also our manufacturing, services, retailing and financing businesses. Increased regulatory compliance costs could have a significant negative impact on our operating businesses, as well as on the businesses in which we have a significant but not controlling economic interest. We cannot predict whether such initiatives will have a material adverse impact on our consolidated financial position, results of operations or cash flows.
K-23
Table of Contents
Cyber security risks
We rely on information technology in virtually all aspects of our business. Like those of many large businesses, certain of our information technology systems have been subject to computer viruses, malicious codes, unauthorized access, phishing efforts, denial-of-service attacks and other cyber attacks and we expect to be subject to similar attacks in the future as such attacks become more sophisticated and frequent. A significant disruption or failure of our information technology systems could result in service interruptions, safety failures, security violations, regulatory compliance failures, an inability to protect information and assets against intruders, and other operational difficulties. Attacks perpetrated against our information systems could result in loss of assets and critical information and expose us to remediation costs and reputational damage.
Although we have taken steps intended to mitigate these risks, including business continuity planning, disaster recovery planning and business impact analysis, a significant disruption or cyber intrusion could lead to misappropriation of assets or data corruption and could adversely affect our results of operations, financial condition and liquidity. Additionally, if we are unable to acquire, implement or protect rights around new technology, we may suffer a competitive disadvantage, which could also have an adverse effect on our results of operations, financial condition and liquidity.
Cyber attacks could further adversely affect our ability to operate facilities, information technology and business systems, or compromise confidential customer and employee information. Political, economic, social or financial market instability or damage to or interference with our operating assets, customers or suppliers may result in business interruptions, lost revenues, higher commodity prices, disruption in fuel supplies, lower energy consumption, unstable markets, increased security, repair or other costs, may materially adversely affect us in ways that cannot be predicted at this time. Any of these risks could materially affect our consolidated financial results. Furthermore, instability in the financial markets resulting from terrorism, sustained or significant cyber attacks, or war could also have a material adverse effect on our ability to raise capital. These are risks we share with all businesses.
Derivative contracts may require significant cash settlement payments and result in significant losses in the future.
We have assumed the risk of potentially significant losses under equity index put option contracts. Although we received considerable premiums as compensation for accepting these risks, there is no assurance that the premiums we received will exceed our aggregate settlement payments. Risks of losses under our equity index put option contracts are based on declines in equity prices of stocks comprising certain major stock indexes. When these contracts expire beginning in 2018, we could be required to make significant payments if equity index prices are significantly below the strike prices specified in the contracts.
Equity index put option contracts are recorded at fair value in our Consolidated Balance Sheet and the periodic changes in fair values are reported in earnings. Currently, the valuations of these contracts are primarily dependent on the related index values. Material decreases in index values may result in material losses in periodic earnings.
Risks unique to our regulated businesses
Our tolerance for risk in our insurance businesses may result in significant underwriting losses.
When properly paid for the risk assumed, we have been and will continue to be willing to assume more risk from a single event than any other insurer has knowingly assumed. Accordingly, we could incur a significant loss from a single event. We may also write coverages for losses arising from acts of terrorism. We attempt to take into account all possible correlations and avoid writing groups of policies from which pre-tax losses might aggregate above $10 billion. Currently, we estimate that our aggregate exposure from a single event under outstanding policies is significantly below $10 billion. However, despite our efforts, losses may aggregate in unanticipated ways. Our tolerance for significant insurance losses may result in lower reported earnings (or net losses) in a future period.
The degree of estimation error inherent in the process of estimating property and casualty insurance loss reserves may result in significant underwriting losses.
The principal cost associated with the property and casualty insurance business is claims. In writing property and casualty insurance policies, we receive premiums today and promise to pay covered losses in the future. However, it will take decades before all claims that have occurred as of any given balance sheet date will be reported and settled. Although we believe that liabilities for unpaid losses are adequate, we will not know whether these liabilities or the premiums charged for the coverages provided were sufficient until well after the balance sheet date. Estimating insurance claim costs is inherently imprecise. Our estimated unpaid losses arising under contracts covering property and casualty insurance risks are large ($104 billion at December 31, 2017) so even small percentage increases to the aggregate liability estimate can result in materially lower future periodic reported earnings.
K-24
Table of Contents
Changes in regulations and regulatory actions can adversely affect our operating results and our ability to allocate capital.
Our insurance businesses are subject to regulation in the jurisdictions in which we operate. Such regulations may relate to among other things, the types of business that can be written, the rates that can be charged for coverage, the level of capital that must be maintained, and restrictions on the types and size of investments that can be made. Regulations may also restrict the timing and amount of dividend payments to Berkshire by these businesses. Accordingly, changes in regulations related to these or other matters or regulatory actions imposing restrictions on our insurance companies may adversely impact our results of operations and restrict our ability to allocate capital.
Our railroad business conducted through BNSF is also subject to a significant number of governmental laws and regulations with respect to rates and practices, taxes, railroad operations and a variety of health, safety, labor, environmental and other matters. Failure to comply with applicable laws and regulations could have a material adverse effect on BNSF’s business. Governments may change the legislative and/or regulatory framework within which BNSF operates without providing any recourse for any adverse effects that the change may have on the business. For example, federal legislation enacted in 2008 and amended in 2015 mandates the implementation of positive train control technology by December 31, 2018, on certain mainline track where inter-city and commuter passenger railroads operate and where toxic-by-inhalation (“TIH”) hazardous materials are transported. Complying with legislative and regulatory changes may pose significant operating and implementation risks and require significant capital expenditures.
BNSF derives significant amounts of revenue from the transportation of energy-related commodities, particularly coal. To the extent that changes in government policies limit or restrict the usage of coal as a source of fuel in generating electricity or alternate fuels, such as natural gas, displace coal on a competitive basis, revenues and earnings could be adversely affected. As a common carrier, BNSF is also required to transport TIH chemicals and other hazardous materials. An accidental release of hazardous materials could expose BNSF to significant claims, losses, penalties and environmental remediation obligations. Changes in the regulation of the rail industry could negatively impact BNSF’s ability to determine prices for rail services and to make capital improvements to its rail network, resulting in an adverse effect on our results of operations, financial condition or liquidity.
Our utilities and energy businesses operated under BHE are highly regulated by numerous federal, state, local and foreign governmental authorities in the jurisdictions in which they operate. These laws and regulations are complex, dynamic and subject to new interpretations and/or change. Regulations affect almost every aspect of our utilities and energy businesses. Regulations broadly apply and may limit management’s ability to independently make and implement decisions regarding numerous matters including acquiring businesses; constructing, acquiring or disposing of operating assets; operating and maintaining generating facilities and transmission and distribution system assets; complying with pipeline safety and integrity and environmental requirements; setting rates charged to customers; establishing capital structures and issuing debt or equity securities; transacting between our domestic utilities and our other subsidiaries and affiliates; and paying dividends or similar distributions. Failure to comply with or reinterpretations of existing regulations and new legislation or regulations, such as those relating to air and water quality, renewable portfolio standards, cyber security, emissions performance standards, climate change, coal combustion byproduct disposal, hazardous and solid waste disposal, protected species and other environmental matters, or changes in the nature of the regulatory process may have a significant adverse impact on our financial results.
Our railroad business requires significant ongoing capital investment to improve and maintain its railroad network so that transportation services can be safely and reliably provided to customers on a timely basis. Our utilities and energy businesses also require significant amounts of capital to construct, operate and maintain generation, transmission and distribution systems to meet their customers’ needs and reliability criteria. Additionally, system assets may need to be operational for long periods of time in order to justify the financial investment. The risk of operational or financial failure of capital projects is not necessarily recoverable through rates that are charged to customers. Further, a significant portion of costs of capital improvements are funded through debt issued by BNSF and BHE and their subsidiaries. Disruptions in debt capital markets that restrict access to funding when needed could adversely affect the results of operations, liquidity and capital resources of these businesses.
Item 1B. Unresolved Staff Comments
| --- | --- |
None.
Item 2. Description of Properties
| --- | --- |
The properties used by Berkshire’s business segments are summarized in this section. Berkshire’s railroad and utilities and energy businesses, in particular, utilize considerable physical assets in their businesses.
Railroad Business—Burlington Northern Santa Fe
Through BNSF Railway, BNSF operates approximately 32,500 route miles of track (excluding multiple main tracks, yard tracks and sidings) in 28 states, and also operates in three Canadian provinces. BNSF owns over 23,000 route miles, including easements, and operates over 9,000 route miles of trackage rights that permit BNSF to operate its trains with its crews over other railroads’ tracks. The total BNSF system, including single and multiple main tracks, yard tracks and sidings, consists of over 50,000 operated miles of track, all of which are owned by or held under easement by BNSF except for over 10,000 miles operated under trackage rights.
K-25
Table of Contents
BNSF operates various facilities and equipment to support its transportation system, including its infrastructure, locomotives and freight cars. It also owns or leases other equipment to support rail operations, such as vehicles. Support facilities for rail operations include yards and terminals throughout its rail network, system locomotive shops to perform locomotive servicing and maintenance, a centralized network operations center for train dispatching and network operations monitoring and management in Fort Worth, Texas, regional dispatching centers, computers, telecommunications equipment, signal systems and other support systems. Transfer facilities are maintained for rail-to-rail as well as intermodal transfer of containers, trailers and other freight traffic and include approximately 25 intermodal hubs located across the system. BNSF owns or holds under non-cancelable leases exceeding one year approximately 8,000 locomotives and 71,000 freight cars, in addition to maintenance of way and other equipment.
In the ordinary course of business, BNSF makes significant capital investments to expand and improve its railroad network. BNSF incurs significant costs in repairing and maintaining its properties. In 2017, BNSF recorded approximately $2 billion in repairs and maintenance expense.
Utilities and Energy Businesses—Berkshire Hathaway Energy
BHE’s energy properties consist of the physical assets necessary to support its electricity and natural gas businesses. Properties of BHE’s electricity businesses include electric generation, transmission and distribution facilities, as well as coal mining assets that support certain of BHE’s electric generating facilities. Properties of BHE’s natural gas businesses include natural gas distribution facilities, interstate pipelines, storage facilities, compressor stations and meter stations. The transmission and distribution assets are primarily within each of BHE’s utility service territories. In addition to these physical assets, BHE has rights-of-way, mineral rights and water rights that enable BHE to utilize its facilities. Pursuant to separate financing agreements, a majority of these properties are pledged or encumbered to support or otherwise provide the security for the related subsidiary debt. BHE or its affiliates own or have interests in the following types of electric generating facilities at December 31, 2017:
| Energy Source | Entity | Location by Significance | Facility Net Capacity (MW) (1) | Net Owned Capacity (MW) (1) | ||||||||
| Natural gas | PacifiCorp, MEC, NV Energy and BHE Renewables | Nevada, Utah, Iowa, Illinois, Washington, Oregon, Texas, New York, and Arizona | 10,919 | 10,640 | ||||||||
| Coal | PacifiCorp, MEC and NV Energy | Wyoming, Iowa, Utah, Arizona, Nevada, Colorado and Montana | 16,232 | 9,158 | ||||||||
| Wind | PacifiCorp, MEC and BHE Renewables | Iowa, Wyoming, Nebraska, Washington, California, Texas, Oregon, Illinois and Kansas | 6,533 | 6,524 | ||||||||
| Solar | BHE Renewables and NV Energy | California, Texas, Arizona, Minnesota and Nevada | 1,675 | 1,527 | ||||||||
| Hydroelectric | PacifiCorp, MEC and BHE Renewables | Washington, Oregon, The Philippines, Idaho, California, Utah, Hawaii, Montana, Illinois and Wyoming | 1,299 | 1,277 | ||||||||
| Nuclear | MEC | Illinois | 1,820 | 455 | ||||||||
| Geothermal | PacifiCorp and BHE Renewables | California and Utah | 370 | 370 | ||||||||
| Total | 38,848 | 29,951 | ||||||||||
| (1) | Facility Net Capacity (MW) represents the lesser of nominal ratings or any limitations under applicable interconnection, power purchase, or other agreements for intermittent resources and the total net dependable capability available during summer conditions for all other units. An intermittent resource’s nominal rating is the manufacturer’s contractually specified capability (in MW) under specified conditions. Net Owned Capacity indicates BHE’s ownership of Facility Net Capacity. |
|---|
As of December 31, 2017, BHE’s subsidiaries also have electric generating facilities that are under construction in Iowa, Illinois and Minnesota having total Facility Net Capacity and Net Owned Capacity of 1,902 MW.
PacifiCorp, MEC and NV Energy own electric transmission and distribution systems, including approximately 24,800 miles of transmission lines and approximately 1,690 substations, gas distribution facilities, including approximately 26,800 miles of gas mains and service lines, and an estimated 39 million tons of recoverable coal reserves in mines owned or leased in Wyoming and Colorado.
The electricity distribution network of Northern Powergrid (Northeast) and Northern Powergrid (Yorkshire) includes approximately 17,400 miles of overhead lines, approximately 42,000 miles of underground cables and approximately 750 major substations. AltaLink’s electricity transmission system includes approximately 8,100 miles of transmission lines and approximately 310 substations.
K-26
Table of Contents
Northern Natural’s pipeline system consists of approximately 14,700 miles of natural gas pipelines, including approximately 6,300 miles of mainline transmission pipelines and approximately 8,400 miles of branch and lateral pipelines. Northern Natural’s end-use and distribution market area includes points in Iowa, Nebraska, Minnesota, Wisconsin, South Dakota, Michigan and Illinois and its natural gas supply and delivery service area includes points in Kansas, Texas, Oklahoma and New Mexico. Storage services are provided through the operation of one underground natural gas storage field in Iowa, two underground natural gas storage facilities in Kansas and two liquefied natural gas storage peaking units, one in Iowa and one in Minnesota.
Kern River’s system consists of approximately 1,700 miles of natural gas pipelines, including approximately 1,400 miles of mainline section, including 100 miles of lateral pipelines, and approximately 300 miles of common facilities. Kern River owns the entire mainline section, which extends from the system’s point of origination in Wyoming through the Central Rocky Mountains into California.
Other Segments
The physical properties used by Berkshire’s other significant business segments are summarized below:
| Business | Country | Location | Type of Property/Facility | Number of Properties | Owned/ Leased | |||||||||||
| Insurance: | ||||||||||||||||
| GEICO | U.S. | Chevy Chase, MD and 5 other states | Offices | 12 | Owned | |||||||||||
| Various locations in 38 states | Offices | 108 | Leased | |||||||||||||
| Berkshire Hathaway Reinsurance Group | U.S. | Stamford, CT | Offices | 1 | Owned | |||||||||||
| Various locations | Offices | 31 | Leased | |||||||||||||
| Non-U.S. | Cologne, Germany | Offices | 1 | Owned | ||||||||||||
| Various locations in 22 countries | Offices | 35 | Leased | |||||||||||||
| Berkshire Hathaway Primary Group | U.S. | Omaha, NE, Fort Wayne, IN, Princeton, NJ, Wilkes-Barre, PA and Oklahoma City, OK | Offices | 7 | Owned | |||||||||||
| Various locations in 23 states | Offices | 74 | Leased | |||||||||||||
| Non-U.S | Locations in 7 countries | Offices | 10 | Leased | ||||||||||||
| Manufacturing | U.S. | Various locations | Manufacturing plants Manufacturing plants Offices/Warehouses Offices/Warehouses Retail/Showroom Retail/Showroom | 481 143 223 403 16 49 | Owned Leased Owned Leased Owned Leased | |||||||||||
| Non-U.S. | Various locations in over 60 countries | Manufacturing plants Manufacturing plants Offices/Warehouses Offices/Warehouses Retail/Showroom | 202 132 78 526 5 | Owned Leased Owned Leased Leased |
K-27
Table of Contents
| Business | Country | Location | Type of Property/Facility | Number of Properties | Owned/ Leased | |||||||||
| Service | U.S. | Various locations | Training facilities/Hangars Training facilities/Hangars Offices/Distribution Offices/Distribution Production facilities Production facilities | 19 130 56 159 26 3 | Owned Leased Owned Leased Owned Leased | |||||||||
| Non-U.S. | Various locations in 33 countries | Offices/Distribution/ Hangars/Training facilities Offices/Distribution/ Hangars/Training facilities | 19 129 | Owned Leased | ||||||||||
| McLane Company | U.S. | Various locations | Distribution centers/Offices Distribution centers/Offices | 54 33 | Owned Leased | |||||||||
| Retailing | U.S. | Various locations | Offices/Warehouses/Plants Offices/Warehouses Retail/Showroom Retail/Showroom | 29 27 143 546 | Owned Leased Owned Leased | |||||||||
| Non-U.S. | Germany Locations in 6 countries | Office/Warehouse Retail/Offices | 1 97 | Owned Leased | ||||||||||
| Finance & Financial Products | U.S. | Various locations | Manufacturing plants Manufacturing plants Offices/Warehouses Offices/Warehouses Leasing/Showroom/Retail Leasing/Showroom/Retail Housing communities | 67 6 22 73 234 255 118 | Owned Leased Owned Leased Owned Leased Owned | |||||||||
| Non-U.S. | Various locations in 12 countries | Manufacturing plants Manufacturing plants Offices/Warehouses Offices/Warehouses | 22 32 3 25 | Owned Leased Owned Leased |
K-28
Table of Contents
Item 3. Legal Proceedings
| --- | --- |
Berkshire and its subsidiaries are parties in a variety of legal actions that routinely arise out of the normal course of business, including legal actions seeking to establish liability directly through insurance contracts or indirectly through reinsurance contracts issued by Berkshire subsidiaries. Plaintiffs occasionally seek punitive or exemplary damages. We do not believe that such normal and routine litigation will have a material effect on our financial condition or results of operations. Berkshire and certain of its subsidiaries are also involved in other kinds of legal actions, some of which assert or may assert claims or seek to impose fines and penalties. We believe that any liability that may arise as a result of other pending legal actions will not have a material effect on our consolidated financial condition or results of operations.
Item 4. Mine Safety Disclosures
| --- | --- |
Information regarding the Company’s mine safety violations and other legal matters disclosed in accordance with Section 1503 (a) of the Dodd-Frank Reform Act is included in Exhibit 95 to this Form 10-K.
Executive Officers of the Registrant
Following is a list of the Registrant’s named executive officers:
| Name | Age | Position with Registrant | Since | |||
| Warren E. Buffett | 87 | Chairman and Chief Executive Officer | 1970 | |||
| Charles T. Munger | 94 | Vice Chairman | 1978 | |||
| Gregory E. Abel | 55 | Vice Chairman – Non-Insurance Operations | 2018 | |||
| Ajit Jain | 66 | Vice Chairman – Insurance Operations | 2018 | |||
| Marc D. Hamburg | 68 | Senior Vice-President – Chief Financial Officer | 1992 |
Each executive officer serves, in accordance with the by-laws of the Registrant, until the first meeting of the Board of Directors following the next annual meeting of shareholders and until a successor is chosen and qualified or until such executive officer sooner dies, resigns, is removed or becomes disqualified.
FORWARD-LOOKING STATEMENTS
Investors are cautioned that certain statements contained in this document as well as some statements in periodic press releases and some oral statements of Berkshire officials during presentations about Berkshire or its subsidiaries are “forward-looking” statements within the meaning of the Private Securities Litigation Reform Act of 1995 (the “Act”). Forward-looking statements include statements which are predictive in nature, which depend upon or refer to future events or conditions, which include words such as “expects,” “anticipates,” “intends,” “plans,” “believes,” “estimates” or similar expressions. In addition, any statements concerning future financial performance (including future revenues, earnings or growth rates), ongoing business strategies or prospects and possible future Berkshire actions, which may be provided by management, are also forward-looking statements as defined by the Act. Forward-looking statements are based on current expectations and projections about future events and are subject to risks, uncertainties and assumptions about Berkshire and its subsidiaries, economic and market factors and the industries in which we do business, among other things. These statements are not guarantees of future performance and we have no specific intention to update these statements.
Actual events and results may differ materially from those expressed or forecasted in forward-looking statements due to a number of factors. The principal risk factors that could cause our actual performance and future events and actions to differ materially from such forward-looking statements include, but are not limited to, changes in market prices of our investments in fixed maturity and equity securities, losses realized from derivative contracts, the occurrence of one or more catastrophic events, such as an earthquake, hurricane, act of terrorism or cyber attack that causes losses insured by our insurance subsidiaries and/or losses to our business operations, changes in laws or regulations affecting our insurance, railroad, utilities and energy and finance subsidiaries, changes in federal income tax laws, and changes in general economic and market factors that affect the prices of securities or the industries in which we do business.
K-29
Table of Contents
Part II
Item 5. Market for Registrant’s Common Equity, Related Security Holder Matters and Issuer Purchases of Equity Securities
| --- | --- |
Market Information
Berkshire’s Class A and Class B common stock are listed for trading on the New York Stock Exchange, trading symbol: BRK.A and BRK.B. The following table sets forth the high and low sales prices per share, as reported on the New York Stock Exchange Composite List during the periods indicated:
| 2017 | 2016 | |||||||||||||||||||||||||||||||
| Class A | Class B | Class A | Class B | |||||||||||||||||||||||||||||
| High | Low | High | Low | High | Low | High | Low | |||||||||||||||||||||||||
| First Quarter | $ | 266,445 | $ | 237,983 | $ | 177.86 | $ | 158.61 | $ | 215,130 | $ | 186,900 | $ | 143.40 | $ | 123.55 | ||||||||||||||||
| Second Quarter | 257,944 | 242,180 | 171.95 | 160.93 | 221,985 | 205,074 | 148.03 | 136.65 | ||||||||||||||||||||||||
| Third Quarter | 275,945 | 252,254 | 184.00 | 168.00 | 226,490 | 211,500 | 151.05 | 140.95 | ||||||||||||||||||||||||
| Fourth Quarter | 301,000 | 270,250 | 200.50 | 180.44 | 250,786 | 213,030 | 167.25 | 141.92 |
Shareholders
Berkshire had approximately 2,100 record holders of its Class A common stock and 19,800 record holders of its Class B common stock at February 12, 2018. Record owners included nominees holding at least 410,000 shares of Class A common stock and 1,339,000,000 shares of Class B common stock on behalf of beneficial-but-not-of-record owners.
Dividends
Berkshire has not declared a cash dividend since 1967.
Common Stock Repurchase Program
Berkshire’s Board of Directors has approved a common stock repurchase program permitting Berkshire to repurchase its Class A and Class B shares at prices no higher than a 20% premium over the book value of the shares. The program allows share repurchases in the open market or through privately negotiated transactions and does not specify a maximum number of shares to be repurchased. There were no share repurchases under the program in 2017.
Stock Performance Graph
The following chart compares the subsequent value of $100 invested in Berkshire common stock on December 31, 2012 with a similar investment in the Standard & Poor’s 500 Stock Index and in the Standard & Poor’s Property – Casualty Insurance Index.**
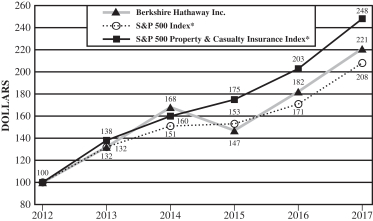
| * | Cumulative return for the Standard & Poor’s indices based on reinvestment of dividends. |
|---|
| ** | It would be difficult to develop a peer group of companies similar to Berkshire. The Corporation owns subsidiaries engaged in a number of diverse business activities of which the most important is the property and casualty insurance business and, accordingly, management has used the Standard & Poor’s Property—Casualty Insurance Index for comparative purposes. |
|---|
K-30
Table of Contents
Item 6. Selected Financial Data
| --- | --- |
Selected Financial Data for the Past Five Years
(dollars in millions except per-share data)
| 2017 | 2016 | 2015 | 2014 | 2013 | ||||||||||||||||
| Revenues: | ||||||||||||||||||||
| Insurance premiums earned | $ | 60,597 | $ | 45,881 | $ | 41,294 | $ | 41,253 | $ | 36,684 | ||||||||||
| Sales and service revenues | 125,963 | 119,489 | 107,001 | 97,097 | 92,993 | |||||||||||||||
| Railroad, utilities and energy revenues | 39,943 | 37,542 | 40,004 | 40,690 | 34,757 | |||||||||||||||
| Interest, dividend and other investment income | 5,144 | 4,725 | 5,357 | 5,052 | 5,196 | |||||||||||||||
| Finance and financial products sales and service revenues and interest and dividend income | 8,362 | 7,663 | 6,940 | 6,526 | 6,109 | |||||||||||||||
| Investment and derivative gains/losses | 2,128 | 8,304 | 10,347 | 4,081 | 6,673 | |||||||||||||||
| Total revenues | $ | 242,137 | $ | 223,604 | $ | 210,943 | $ | 194,699 | $ | 182,412 | ||||||||||
| Earnings: | ||||||||||||||||||||
| Net earnings attributable to Berkshire Hathaway (1) | $ | 44,940 | $ | 24,074 | $ | 24,083 | $ | 19,872 | $ | 19,476 | ||||||||||
| Net earnings per share attributable to Berkshire Hathaway shareholders (2) | $ | 27,326 | $ | 14,645 | $ | 14,656 | $ | 12,092 | $ | 11,850 | ||||||||||
| Year-end data: | ||||||||||||||||||||
| Total assets | $ | 702,095 | $ | 620,854 | $ | 552,257 | $ | 525,867 | $ | 484,624 | ||||||||||
| Notes payable and other borrowings: | ||||||||||||||||||||
| Insurance and other | 27,324 | 27,175 | 14,599 | 11,854 | 12,396 | |||||||||||||||
| Railroad, utilities and energy | 62,178 | 59,085 | 57,739 | 55,306 | 46,399 | |||||||||||||||
| Finance and financial products | 13,085 | 15,384 | 11,951 | 12,730 | 13,122 | |||||||||||||||
| Berkshire Hathaway shareholders’ equity (3) | 348,296 | 282,070 | 254,619 | 239,239 | 220,959 | |||||||||||||||
| Class A equivalent common shares outstanding, in thousands | 1,645 | 1,644 | 1,643 | 1,643 | 1,644 | |||||||||||||||
| Berkshire Hathaway shareholders’ equity per outstanding Class A equivalent common share (3) | $ | 211,750 | $ | 171,542 | $ | 154,935 | $ | 145,619 | $ | 134,407 |
| (1) | Includes after-tax investment and derivative gains/losses of $1.4 billion in 2017, $6.5 billion in 2016, $6.7 billion in 2015, $3.3 billion in 2014 and $4.3 billion in 2013. Net earnings in 2017 includes a one-time net benefit of $29.1 billion attributable to the enactment of the Tax Cuts and Jobs Act of 2017. |
|---|
| (2) | Represents net earnings per average equivalent Class A share outstanding. Net earnings per average equivalent Class B common share outstanding is equal to 1/1,500 of such amount. |
|---|
| (3) | Beginning in 2017, discounting of certain workers’ compensation claim liabilities for financial reporting purposes was discontinued. The effect of the change was immaterial to the Consolidated Statements of Earnings from 2013 through 2016, and such amounts were not restated. The after-tax net discount as of December 31, 2016 of $931 million was charged to retained earnings as of the earliest period presented. Accordingly, shareholders’ equity and shareholders’ equity per Class A equivalent common share for the years 2013-2016 have been restated from the amounts previously reported. |
|---|
K-31
Table of Contents
Item 7. Management’s Discussion and Analysis of Financial Condition and Results of Operations
Results of Operations
Net earnings attributable to Berkshire Hathaway shareholders for each of the past three years are disaggregated in the table that follows. Amounts are after deducting income taxes and exclude earnings attributable to noncontrolling interests (in millions).
| 2017 | 2016 | 2015 | ||||||||||
| Insurance – underwriting | $ | (2,219 | ) | $ | 1,370 | $ | 1,162 | |||||
| Insurance – investment income | 3,917 | 3,636 | 3,725 | |||||||||
| Railroad | 3,959 | 3,569 | 4,248 | |||||||||
| Utilities and energy | 2,083 | 2,287 | 2,132 | |||||||||
| Manufacturing, service and retailing | 6,208 | 5,631 | 4,683 | |||||||||
| Finance and financial products | 1,335 | 1,427 | 1,378 | |||||||||
| Investment and derivative gains/losses | 1,377 | 6,497 | 6,725 | |||||||||
| Other | (826 | ) | (343 | ) | 30 | |||||||
| Tax Cuts and Jobs Act of 2017 | 29,106 | — | — | |||||||||
| Net earnings attributable to Berkshire Hathaway shareholders | $ | 44,940 | $ | 24,074 | $ | 24,083 | ||||||
Through our subsidiaries, we engage in a number of diverse business activities. We manage our operating businesses on an unusually decentralized basis. There are essentially no centralized or integrated business functions and there is minimal involvement by our corporate headquarters in the day-to-day business activities of the operating businesses. Our senior corporate management team participates in and is ultimately responsible for significant capital allocation decisions, investment activities and the selection of the Chief Executive to head each of the operating businesses. It also is responsible for establishing and monitoring Berkshire’s corporate governance practices. The business segment data (Note 23 to the accompanying Consolidated Financial Statements) should be read in conjunction with this discussion.
Our net earnings in 2017 included approximately $29.1 billion attributable to a one-time net benefit from the enactment of the Tax Cuts and Jobs Act (“TCJA”) on December 22, 2017. See Note 16 to the Consolidated Financial Statements. This benefit included approximately $29.6 billion related to a one-time non-cash reduction of our net deferred income tax liabilities that arose from the reduction in the statutory U.S. corporate income tax rate from 35% to 21%, as well as a net benefit of approximately $900 million primarily from our earnings from Kraft Heinz, partly offset by a one-time income tax expense of approximately $1.4 billion payable over eight years on the deemed repatriation of certain accumulated undistributed earnings of foreign subsidiaries. Due to their significance, we presented these one-time effects as a distinct item in the preceding table. Accordingly, the after-tax figures presented in the discussion of our various operating businesses and other activities in this section exclude the one-time effects of the TCJA.
Our insurance businesses generated after-tax losses from underwriting of $2.2 billion in 2017 compared to after-tax gains of $1.4 billion in 2016 and $1.2 billion in 2015. Underwriting results for 2017 included estimated pre-tax losses of approximately $3.0 billion ($1.95 billion after-tax), primarily attributable to three major hurricanes in the U.S. and Puerto Rico and wildfires in California. Underwriting results in each year also included after-tax foreign currency exchange rate gains and losses from the revaluation of certain non-U.S. Dollar denominated reinsurance liabilities. In 2017, such after-tax losses were $295 million compared to after-tax gains of $458 million in 2016 and $164 million in 2015.
After-tax earnings of our railroad business in 2017 were $4.0 billion, an increase of 10.9% compared to 2016, reflecting increased unit volume. Our railroad business generated lower net earnings in 2016 compared to 2015, primarily due to a 5.0% decline in unit volume. After-tax earnings of our utility and energy business in 2017 declined $204 million compared to 2016. Earnings in 2017 were negatively affected by losses from the prepayment of certain long-term debt. After-tax earnings of our utilities and energy businesses increased in 2016 compared to 2015, attributable to increased pre-tax earnings and a lower effective income tax rate.
After-tax earnings of our manufacturing, service and retailing businesses in 2017 were $6.2 billion, an increase of 10.2% compared to 2016. Earnings in 2017 reflected comparatively higher earnings from several of our larger operations and the impact of businesses acquired in 2016 and 2017. After-tax earnings in 2016 of our manufacturing, service and retailing businesses increased compared to 2015, primarily due to earnings from Precision Castparts, which was acquired on January 29, 2016, partly offset by comparatively lower overall earnings from the other businesses within this group.
K-32
Table of Contents
Management’s Discussion and Analysis (Continued)
Results of Operations (Continued)
After-tax investment and derivative gains were approximately $1.4 billion in 2017, $6.5 billion in 2016 and $6.7 billion in 2015. The gains in 2016 included approximately $2.7 billion from the redemptions of our Wrigley and Kraft Heinz preferred stock investments, sales of Dow Chemical common stock that we received upon conversion of our Dow Chemical preferred stock investment and a non-cash gain of approximately $1.9 billion related to the exchange of Procter & Gamble (“P&G”) common stock for 100% of the common stock of Duracell. Gains in 2015 included non-cash holding gains of approximately $4.4 billion in connection with our investment in Kraft Heinz common stock.
After-tax unrealized gains in 2017 related to our investments in equity securities included in other comprehensive income were approximately $19 billion. Beginning in 2018, unrealized gains and losses on equity securities will be included in net earnings due to a new accounting standard. We believe that investment and derivative gains/losses, whether realized from sales or unrealized from changes in market prices, are often meaningless in terms of understanding our reported results or evaluating our periodic economic performance. Investment and derivative gains and losses have caused and will continue to cause significant volatility in our earnings.
Other earnings in 2017 and 2016 included after-tax foreign currency exchange rate gains and losses related to parent company Euro-denominated debt. After-tax foreign exchange losses on our Euro-denominated debt were $655 million in 2017 compared to after-tax gains of $159 million in 2016. In addition, other earnings includes earnings from our investment in Kraft Heinz.
Insurance—Underwriting
We engage in both primary insurance and reinsurance of property/casualty, life and health risks. In primary insurance activities, we assume defined portions of the risks of loss from persons or organizations that are directly subject to the risks. In reinsurance activities, we assume defined portions of similar or dissimilar risks that other insurers or reinsurers have subjected themselves to in their own insuring activities. Our insurance and reinsurance businesses are GEICO, Berkshire Hathaway Reinsurance Group (“BHRG”) and Berkshire Hathaway Primary Group.
Our management views insurance businesses as possessing two distinct operations – underwriting and investing. Underwriting decisions are the responsibility of the unit managers, while investing decisions are the responsibility of Berkshire’s Chairman and CEO, Warren E. Buffett and Berkshire’s corporate investment managers. Acco
Showing the first 8K of 152K characters. Open the full section
Item 7A. Quantitative and Qualitative Disclosures About Market Risk
| --- | --- |
See “Market Risk Disclosures” contained in Item 7 “Management’s Discussion and Analysis of Financial Condition and Results of Operations.”
Management’s Report on Internal Control Over Financial Reporting
Management of Berkshire Hathaway Inc. is responsible for establishing and maintaining adequate internal control over financial reporting, as such term is defined in the Securities Exchange Act of 1934 Rule 13a-15(f). Under the supervision and with the participation of our management, including our principal executive officer and principal financial officer, we conducted an evaluation of the effectiveness of the Company’s internal control over financial reporting as of December 31, 2017 as required by the Securities Exchange Act of 1934 Rule 13a-15(c). In making this assessment, we used the criteria set forth in the framework in Internal Control—Integrated Framework (2013) issued by the Committee of Sponsoring Organizations of the Treadway Commission. Based on our evaluation under the framework in Internal Control—Integrated Framework (2013), our management concluded that our internal control over financial reporting was effective as of December 31, 2017.
The effectiveness of our internal control over financial reporting as of December 31, 2017 has been audited by Deloitte & Touche LLP, an independent registered public accounting firm, as stated in their report which appears on page K-61.
Berkshire Hathaway Inc.
February 23, 2018
K-60
Table of Contents
Item 8. Financial Statements and Supplementary Data
REPORT OF INDEPENDENT REGISTERED PUBLIC ACCOUNTING FIRM
To the Board of Directors and Shareholders of
Berkshire Hathaway Inc.
Omaha, Nebraska
Opinions on the Financial Statements and Internal Control over Financial Reporting
We have audited the accompanying consolidated balance sheets of Berkshire Hathaway Inc. and subsidiaries (the “Company”) as of December 31, 2017 and 2016, the related consolidated statements of earnings, comprehensive income, changes in shareholders’ equity, and cash flows for each of the three years in the period ended December 31, 2017, and the related notes (collectively referred to as the “financial statements”). We also have audited the Company’s internal control over financial reporting as of December 31, 2017, based on criteria established in Internal Control — Integrated Framework (2013) issued by the Committee of Sponsoring Organizations of the Treadway Commission (COSO).
In our opinion, the financial statements referred to above present fairly, in all material respects, the financial position of the Company as of December 31, 2017 and 2016, and the results of its operations and its cash flows for each of the three years in the period ended December 31, 2017, in conformity with accounting principles generally accepted in the United States of America. Also, in our opinion, the Company maintained, in all material respects, effective internal control over financial reporting as of December 31, 2017, based on criteria established in Internal Control — Integrated Framework (2013) issued by COSO.
Basis for Opinions
The Company’s management is responsible for these financial statements, for maintaining effective internal control over financial reporting, and for its assessment of the effectiveness of internal control over financial reporting, included in the accompanying Management’s Report on Internal Control over Financial Reporting. Our responsibility is to express an opinion on these financial statements and an opinion on the Company’s internal control over financial reporting based on our audits. We are a public accounting firm registered with the Public Company Accounting Oversight Board (United States) (PCAOB) and are required to be independent with respect to the Company in accordance with the U.S. federal securities laws and the applicable rules and regulations of the Securities and Exchange Commission and the PCAOB.
We conducted our audits in accordance with the standards of the PCAOB. Those standards require that we plan and perform the audits to obtain reasonable assurance about whether the financial statements are free of material misstatement, whether due to error or fraud, and whether effective internal control over financial reporting was maintained in all material respects.
Our audits of the financial statements included performing procedures to assess the risks of material misstatement of the financial statements, whether due to error or fraud, and performing procedures to respond to those risks. Such procedures included examining, on a test basis, evidence regarding the amounts and disclosures in the financial statements. Our audits also included evaluating the accounting principles used and significant estimates made by management, as well as evaluating the overall presentation of the financial statements. Our audit of internal control over financial reporting included obtaining an understanding of internal control over financial reporting, assessing the risk that a material weakness exists, and testing and evaluating the design and operating effectiveness of internal control based on the assessed risk. Our audits also included performing such other procedures as we considered necessary in the circumstances. We believe that our audits provide a reasonable basis for our opinions.
Definition and Limitations of Internal Control over Financial Reporting
A company’s internal control over financial reporting is a process designed to provide reasonable assurance regarding the reliability of financial reporting and the preparation of financial statements for external purposes in accordance with generally accepted accounting principles. A company’s internal control over financial reporting includes those policies and procedures that (1) pertain to the maintenance of records that, in reasonable detail, accurately and fairly reflect the transactions and dispositions of the assets of the company; (2) provide reasonable assurance that transactions are recorded as necessary to permit preparation of financial statements in accordance with generally accepted accounting principles, and that receipts and expenditures of the company are being made only in accordance with authorizations of management and directors of the company; and (3) provide reasonable assurance regarding prevention or timely detection of unauthorized acquisition, use, or disposition of the company’s assets that could have a material effect on the financial statements.
Because of its inherent limitations, internal control over financial reporting may not prevent or detect misstatements. Also, projections of any evaluation of effectiveness to future periods are subject to the risk that controls may become inadequate because of changes in conditions, or that the degree of compliance with the policies or procedures may deteriorate.
/s/ Deloitte & Touche LLP
Omaha, Nebraska
February 23, 2018
We have served as the Company’s auditor since 1985.
K-61
Table of Contents
BERKSHIRE HATHAWAY INC.
and Subsidiaries
CONSOLIDATED BALANCE SHEETS
(dollars in millions)
| December 31, | ||||||||
| 2017 | 2016 | |||||||
| ASSETS | ||||||||
| Insurance and Other: | ||||||||
| Cash and cash equivalents | $ | 25,460 | $ | 23,581 | ||||
| Short-term investments in U.S. Treasury Bills | 78,515 | 47,338 | ||||||
| Investments in fixed maturity securities | 21,353 | 23,432 | ||||||
| Investments in equity securities | 164,026 | 134,835 | ||||||
| Investments in The Kraft Heinz Company (Fair Value: 2017 – $25,306; 2016 – $28,418) | 17,635 | 15,345 | ||||||
| Receivables | 28,578 | 27,097 | ||||||
| Inventories | 16,187 | 15,727 | ||||||
| Property, plant and equipment | 20,104 | 19,325 | ||||||
| Goodwill | 54,985 | 53,994 | ||||||
| Other intangible assets | 32,518 | 33,481 | ||||||
| Deferred charges under retroactive reinsurance contracts | 15,278 | 8,047 | ||||||
| Other | 11,158 | 7,126 | ||||||
| 485,797 | 409,328 | |||||||
| Railroad, Utilities and Energy: | ||||||||
| Cash and cash equivalents | 2,910 | 3,939 | ||||||
| Property, plant and equipment | 128,184 | 123,759 | ||||||
| Goodwill | 24,780 | 24,111 | ||||||
| Regulatory assets | 2,950 | 4,457 | ||||||
| Other | 15,589 | 13,550 | ||||||
| 174,413 | 169,816 | |||||||
| Finance and Financial Products: | ||||||||
| Cash and cash equivalents | 3,213 | 528 | ||||||
| Short-term investments in U.S. Treasury Bills | 5,856 | 10,984 | ||||||
| Loans and finance receivables | 13,748 | 13,300 | ||||||
| Property, plant and equipment and assets held for lease | 9,931 | 9,689 | ||||||
| Goodwill | 1,493 | 1,381 | ||||||
| Other | 7,644 | 5,828 | ||||||
| 41,885 | 41,710 | |||||||
| $ | 702,095 | $ | 620,854 | |||||
_See accompanying Notes to Consolidated Financial St
Showing the first 8K of 221K characters. Open the full section
Item 9. Changes in and Disagreements with Accountants on Accounting and Financial Disclosure
| --- | --- |
None
Item 9A. Controls and Procedures
| --- | --- |
At the end of the period covered by this Annual Report on Form 10-K, the Corporation carried out an evaluation, under the supervision and with the participation of the Corporation’s management, including the Chairman (Chief Executive Officer) and the Senior Vice President (Chief Financial Officer), of the effectiveness of the design and operation of the Corporation’s disclosure controls and procedures pursuant to Exchange Act Rule 13a-15. Based upon that evaluation, the Chairman (Chief Executive Officer) and the Senior Vice President (Chief Financial Officer) concluded that the Corporation’s disclosure controls and procedures are effective in timely alerting them to material information relating to the Corporation (including its consolidated subsidiaries) required to be included in the Corporation’s periodic SEC filings. The report called for by Item 308(a) of Regulation S-K is incorporated herein by reference to Management’s Report on Internal Control Over Financial Reporting, included on page K-60 of this report. The attestation report called for by Item 308(b) of Regulation S-K is incorporated herein by reference to Report of Independent Registered Public Accounting Firm, included on page K-61 of this report. There has been no change in the Corporation’s internal control over financial reporting during the quarter ended December 31, 2017 that has materially affected, or is reasonably likely to materially affect, the Corporation’s internal control over financial reporting.
Item 9B. Other Information
| --- | --- |
None
Part III
Except for the information set forth under the caption “Executive Officers of the Registrant” in Part I hereof, information required by this Part (Items 10, 11, 12, 13 and 14) is incorporated by reference from the Registrant’s definitive proxy statement, filed pursuant to Regulation 14A, for the Annual Meeting of Shareholders of the Registrant to be held on May 5, 2018, which meeting will involve the election of directors.
K-104
Table of Contents
Part IV
Item 15. Exhibits and Financial Statement Schedules
| --- | --- |
(a)1. Financial Statements
The following Consolidated Financial Statements, as well as the Report of Independent Registered Public Accounting Firm, are included in Part II Item 8 of this report:
(b) Exhibits
See the “Exhibit Index” at page K-108.
REPORT OF INDEPENDENT REGISTERED PUBLIC ACCOUNTING FIRM
To the Shareholders and the Board of Directors of
Berkshire Hathaway Inc.
Omaha, Nebraska
We have audited the consolidated financial statements of Berkshire Hathaway Inc. and subsidiaries (the “Company”) as of December 31, 2017 and 2016, and for each of the three years in the period ended December 31, 2017, and the Company’s internal control over financial reporting as of December 31, 2017, and have issued our report thereon dated February 23, 2018; such consolidated financial statements and reports are included elsewhere in this Form 10-K. Our audits also included the financial statement schedule of the Company listed in the Index at Item 15. This financial statement schedule is the responsibility of the Company’s management. Our responsibility is to express an opinion on the Company’s financial statements schedules based on our audits. In our opinion, such financial statement schedules, when considered in relation to the financial statements taken as a whole, present fairly, in all material respects, the information set forth therein.
/s/ Deloitte & Touche LLP
Omaha, Nebraska
February 23, 2018
K-105
Table of Contents
BERKSHIRE HATHAWAY INC.
(Parent Company)
Condensed Financial Information
(Dollars in millions)
Schedule I
Balance Sheets
| December 31, | ||||||||
| 2017 | 2016 | |||||||
| Assets: | ||||||||
| Cash and cash equivalents | $ | 4,039 | $ | 3,221 | ||||
| Short-term investments in U.S. Treasury Bills | 13,132 | 8,220 | ||||||
| Investments in fixed maturity and equity securities and other assets | 79 | 59 | ||||||
| Investments in and advances to/from consolidated subsidiaries | 335,668 | 276,467 | ||||||
| Investments in The Kraft Heinz Company | 17,635 | 15,345 | ||||||
| $ | 370,553 | $ | 303,312 | |||||
| Liabilities and Shareholders’ Equity: | ||||||||
| Accounts payable, accrued interest and other liabilities | $ | 196 | $ | 182 | ||||
| Income taxes, principally deferred | 3,294 | 3,357 | ||||||
| Notes payable and other borrowings | 18,767 | 17,703 | ||||||
| 22,257 | 21,242 | |||||||
| Berkshire Hathaway shareholders’ equity | 348,296 | 282,070 | ||||||
| $ | 370,553 | $ | 303,312 | |||||
Statements of Earnings and Comprehensive Income
| Year ended December 31, | ||||||||||||
| 2017 | 2016 | 2015 | ||||||||||
| Income items: | ||||||||||||
| From consolidated subsidiaries: | ||||||||||||
| Dividends | $ | 5,367 | $ | 9,862 | $ | 10,519 | ||||||
| Undistributed earnings | 37,832 | 13,264 | 8,508 | |||||||||
| 43,199 | 23,126 | 19,027 | ||||||||||
| Investment gains/losses | (1 | ) | 700 | 16 | ||||||||
| Investment holding gain in The Kraft Heinz Company | — | — | 6,838 | |||||||||
| Equity in net earnings of The Kraft Heinz Company | 2,938 | 923 | (122 | ) | ||||||||
| Other income | 350 | 262 | 963 | |||||||||
| 46,486 | 25,011 | 26,722 | ||||||||||
| Cost and expense items: | ||||||||||||
| General and administrative | 159 | 80 | 73 | |||||||||
| Interest expense | 1,530 | 208 | 302 | |||||||||
| Income taxes | (143 | ) | 649 | 2,264 | ||||||||
| 1,546 | 937 | 2,639 | ||||||||||
| Net earnings attributable to Berkshire Hathaway shareholders | 44,940 | 24,074 | 24,083 | |||||||||
| Other comprehensive income attributable to Berkshire Hathaway shareholders | 21,273 | 3,316 | (8,750 | ) | ||||||||
| Comprehensive income attributable to Berkshire Hathaway shareholders | $ | 66,213 | $ | 27,390 | $ | 15,333 | ||||||
See Note to Condensed Financial Information
K-106
Table of Contents
BERKSHIRE HATHAWAY INC.
(Parent Company)
Condensed Financial Information
(Dollars in millions)
Schedule I (continued)
Statements of Cash Flows
| Year ended December 31, | ||||||||||||
| 2017 | 2016 | 2015 | ||||||||||
| Cash flows from operating activities: | ||||||||||||
| Net earnings attributable to Berkshire Hathaway shareholders | $ | 44,940 | $ | 24,074 | $ | 24,083 | ||||||
| Adjustments to reconcile net earnings to cash flows from operating activities: | ||||||||||||
| Investment gains/losses | 1 | (700 | ) | (6,854) | ||||||||
| Undistributed earnings of consolidated subsidiaries | (37,832 | ) | (13,264 | ) | (8,508) | |||||||
| Non-cash dividends from consolidated subsidiaries | — | — | (3,938) | |||||||||
| Income taxes payable | (135 | ) | 629 | 2,227 | ||||||||
| Other | (1,234 | ) | (161 | ) | 222 | |||||||
| Net cash flows from operating activities | 5,740 | 10,578 | 7,232 | |||||||||
| Cash flows from investing activities: | ||||||||||||
| Redemption (purchase) of Kraft Heinz Company investments | — | 8,320 | (5,258) | |||||||||
| Investments in and advances to/repayments from consolidated subsidiaries, net | (239 | ) | (26,398 | ) | (2,274) | |||||||
| Purchases of U.S. Treasury Bills | (19,663 | ) | (9,350 | ) | — | |||||||
| Sales and maturities of U.S. Treasury Bills | 14,847 | 1,145 | — | |||||||||
| Net cash flows from investing activities | (5,055 | ) | (26,283 | ) | (7,532) | |||||||
| Cash flows from financing activities: | ||||||||||||
| Proceeds from borrowings | 1,201 | 9,278 | 3,165 | |||||||||
| Repayments of borrowings | (1,145 | ) | (1,125 | ) | (1,775) | |||||||
| Other | 77 | 164 | 70 | |||||||||
| Net cash flows from financing activities | 133 | 8,317 | 1,460 | |||||||||
| Increase (decrease) in cash and cash equivalents | 818 | (7,388 | ) | 1,160 | ||||||||
| Cash and cash equivalents at beginning of year | 3,221 | 10,609 | 9,449 | |||||||||
| Cash and cash equivalents at end of year | $ | 4,039 | $ | 3,221 | $ | 10,609 | ||||||
| Other cash flow information: | ||||||||||||
| Income taxes paid | $ | 2,076 | $ | 3,583 | $ | 3,180 | ||||||
| Interest paid | 386 | 307 | 206 | |||||||||
| Non-cash investments in consolidated subsidiaries | — | — | 3,938 |
Note to Condensed Financial Information
In December 2017, the Tax Cuts and Jobs Act of 2017 (“TCJA”) was enacted, which reduced the Parent Company’s income tax expense in 2017 by $550 million, primarily due to the reduction in deferred tax liabilities attributable to the lower U.S. statutory rate, partly offset by a one-time income tax expense on certain accumulated undistributed earnings of foreign subsidiaries. The effects of the TCJA on income tax expense of consolidated subsidiaries is included in undistributed earnings in consolidated subsidiaries.
In 2013, the Parent Company invested $12.25 billion in H.J. Heinz Holding Corporation (“Heinz Holding”), an entity formed to acquire H.J. Heinz Company, which included common stock and warrants and cumulative compounding preferred stock. After a series of transactions in 2015, Berkshire’s interests in Heinz Holding became a 26.8% ownership of outstanding common stock of The Kraft Heinz Company (“Kraft Heinz”) and is currently 26.7% of such shares. Reference is made to Note 5 to the Consolidated Financial Statements for additional information concerning Berkshire’s investments in Kraft Heinz.
In January 2017, Berkshire issued €1.1 billion in senior notes consisting of €550 million of 0.25% notes due in 2021 and €550 million of 0.625% notes due in 2023, which increased Euro denominated notes to €6.85 billion. In 2017, the carrying value of Berkshire’s Euro denominated senior notes increased $990 million due to changes in the Euro/U.S. Dollar exchange rates. This increase produced a corresponding charge to pre-tax earnings of $990 million in 2017. Parent Company debt maturities over the next five years are as follows: 2018—$1,550 million; 2019—$753 million; 2020—$1,203 million; 2021—$2,160 million and 2022—$613 million. Berkshire guarantees debt obligations of certain of its subsidiaries, which as of December 31, 2017, totaled approximately $14.8 billion. Such guarantees are an absolute, unconditional and irrevocable guarantee for the full and prompt payment when due of all present and future payment obligations. Berkshire also provides guarantees in connection with equity index put option contracts and certain retroactive reinsurance contracts of subsidiaries. The amounts of subsidiary payments under these contracts, if any, is contingent upon the outcome of future events.
K-107
Table of Contents
EXHIBIT INDEX
| Exhibit No. | ||
| 2(i) | Agreement and Plan of Merger dated as of June 19, 1998 between Berkshire and General Re Corporation. | |
| Incorporated by reference to Annex I to Registration Statement No. 333-61129 filed on Form S-4. | ||
| 2(ii) | Agreement and Plan of Merger dated as of November 2, 2009 by and among Berkshire, R Acquisition Company, LLC and BNSF. Incorporated by reference to Annex A to Registration Statement No. 333-163343 on Form S-4. | |
| 2(iii) | Agreement and Plan of Merger dated August 8, 2015, by and among Berkshire, NW Merger Sub Inc. and Precision Castparts Corporation (“PCC”) | |
| Incorporated by reference to Exhibit 2.1 to PCC’s Current Report on Form 8-K filed on August 10, 2015 (SEC File No. 001-10348) | ||
| 3(i) | Restated Certificate of Incorporation | |
| Incorporated by reference to Exhibit 3(i) to Form 10-K filed on March 2, 2015. | ||
| 3(ii) | By-Laws | |
| Incorporated by reference to Exhibit 3(ii) to Form 8-K filed on May 4, 2016. | ||
| 4.1 | Indenture, dated as of December 22, 2003, between Berkshire Hathaway Finance Corporation, Berkshire Hathaway Inc. and The Bank of New York Mellon Trust Company, N.A. (as successor to J.P. Morgan Trust Company, National Association), as trustee. | |
| Incorporated by reference to Exhibit 4.1 on Form S-4 of Berkshire Hathaway Finance Corporation and Berkshire Hathaway Inc. filed on February 4, 2004. SEC File No. 333-112486 | ||
| 4.2 | Indenture, dated as of February 1, 2010, among Berkshire Hathaway Inc., Berkshire Hathaway Finance Corporation and The Bank of New York Mellon Trust Company, N.A., as trustee. | |
| Incorporated by reference to Exhibit 4.1 to Berkshire’s Registration Statement on Form S-3 filed on February 1, 2010. SEC File No. 333-164111 | ||
| 4.3 | Indenture, dated as of January 26, 2016, by and among Berkshire Hathaway Inc., Berkshire Hathaway Finance Corporation and The Bank of New York Mellon Trust Company, N.A., as trustee. | |
| Incorporated by reference to Exhibit 4.1 to Berkshire’s Registration Statement on Form S-3 filed on January 26, 2016. SEC File No. 333-209122 | ||
| 4.4 | Indenture, dated as of December 1, 1995, between BNSF and The First National Bank of Chicago, as trustee. | |
| Incorporated by reference to Exhibit 4 on Form S-3 of BNSF filed on February 8, 1999. | ||
| 4.5 | Indenture, dated as of October 4, 2002, by and between MidAmerican Energy Holdings Company and The Bank of New York, Trustee. | |
| Incorporated by reference to Exhibit 4.1 to the Berkshire Hathaway Energy Company Registration Statement No. 333-101699 dated December 6, 2002. | ||
| Other instruments defining the rights of holders of long-term debt of Registrant and its subsidiaries are not being filed since the total amount of securities authorized by all other such instruments does not exceed 10% of the total assets of the Registrant and its subsidiaries on a consolidated basis as of December 31, 2017. The Registrant hereby agrees to furnish to the Commission upon request a copy of any such debt instrument to which it is a party. | ||
| 10.1 | Equity Commitment Letter of Berkshire Hathaway Inc. with Hawk Acquisition Holding Corporation dated February 13, 2013. Incorporated by reference to Exhibit 10.1 on Form 8-K of Berkshire Hathaway Inc. filed on February 14, 2013. | |
| 12 | Calculation of Ratio of Consolidated Earnings to Consolidated Fixed Charges | |
| 14 | Code of Ethics | |
| Berkshire’s Code of Business Conduct and Ethics is posted on its Internet website at www.berkshirehathaway.com | ||
| 18 | Letter re change in accounting principle | |
| 21 | Subsidiaries of Registrant | |
| 23 | Consent of Independent Registered Public Accounting Firm | |
| 31.1 | Rule 13a—14(a)/15d-14(a) Certification | |
| 31.2 | Rule 13a—14(a)/15d-14(a) Certification | |
| 32.1 | Section 1350 Certification | |
| 32.2 | Section 1350 Certification | |
| 95 | Mine Safety Disclosures | |
| 101 | The following financial information from Berkshire Hathaway Inc.’s Annual Report on Form 10-K for the year ended December 31, 2017, formatted in XBRL (Extensible Business Reporting Language) includes: (i) the Consolidated Balance Sheets as of December 31, 2017 and 2016, (ii) the Consolidated Statements of Earnings for each of the three years ended December 31, 2017, 2016 and 2015, (iii) Consolidated Statements of Comprehensive Income for each of the three years ended December 31, 2017, 2016 and 2015, (iv) the Consolidated Statements of Changes in Shareholders’ Equity for each of the three years ended December 31, 2017, 2016 and 2015, (v) the Consolidated Statements of Cash Flows for each of the three years ended December 31, 2017, 2016 and 2015 and (vi) the Notes to Consolidated Financial Statements and Schedule I, tagged in summary and detail. |
K-108
Table of Contents
SIGNATURES
Pursuant to the requirements of Section 13 or 15(d) of the Securities Exchange Act of 1934, the Registrant has duly caused this report to be signed on its behalf by the undersigned thereunto duly authorized.
| BERKSHIRE HATHAWAY INC. | ||
| Date: February 23, 2018 | /S/ MARC D. HAMBURG | |
| Marc D. Hamburg Senior Vice President and Principal Financial Officer |
Pursuant to the requirements of the Securities Exchange Act of 1934, this report has been signed below by the following persons on behalf of the Registrant and in the capacities and on the dates indicated.
| /S/ WARREN E. BUFFETT Warren E. Buffett | Chairman of the Board of Directors—Chief Executive Officer | February 23, 2018 Date | ||
| /S/ GREGORY E. ABEL Gregory E. Abel | Director—Vice Chairman—Non Insurance Operations | February 23, 2018 Date | ||
| /S/ HOWARD G. BUFFETT Howard G. Buffett | Director | February 23, 2018 Date | ||
| /S/ STEPHEN B. BURKE Stephen B. Burke | Director | February 23, 2018 Date | ||
| /S/ SUSAN L. DECKER Susan L. Decker | Director | February 23, 2018 Date | ||
| /S/ WILLIAM H. GATES III William H. Gates III | Director | February 23, 2018 Date | ||
| /S/ DAVID S. GOTTESMAN David S. Gottesman | Director | February 23, 2018 Date | ||
| /S/ CHARLOTTE GUYMAN Charlotte Guyman | Director | February 23, 2018 Date | ||
| /S/ AJIT JAIN Ajit Jain | Director—Vice Chairman—Insurance Operations | February 23, 2018 Date | ||
| /S/ CHARLES T. MUNGER Charles T. Munger | Director—Vice Chairman | February 23, 2018 Date | ||
| /S/ THOMAS S. MURPHY Thomas S. Murphy | Director | February 23, 2018 Date | ||
| /S/ RONALD L. OLSON Ronald L. Olson | Director | February 23, 2018 Date | ||
| /S/ WALTER SCOTT, JR. Walter Scott, Jr. | Director | February 23, 2018 Date | ||
| /S/ MERYL B. WITMER Meryl B. Witmer | Director | February 23, 2018 Date | ||
| /S/ MARC D. HAMBURG Marc D. Hamburg | Senior Vice President—Principal Financial Officer | February 23, 2018 Date | ||
| /S/ DANIEL J. JAKSICH Daniel J. Jaksich | Vice President—Principal Accounting Officer | February 23, 2018 Date |
K-109