 filings.tools
Berkshire Hathaway (BRK-B) 10-K risk factor changes: FY2018 vs FY2017
The 2018-12-31 10-K against the 2017-12-31 one, compared heading by heading and sentence by sentence. One of these filings carries no fiscal year tag, so its year is the calendar year of the period end.
Item 1A35 rewritten12 added13 removed67 unchanged
All filing items1,424 rewritten1,093 added839 removed2,460 unchanged
Summary
counted, not written
- Item 1A lists 11 risk factor headings: 0 new, 0 reworded and 11 unchanged since FY2017. 1 heading from FY2017 no longer appears.
- Sentence by sentence, 1,093 added, 839 removed, 1,424 rewritten and 2,460 unchanged across 13 items that differ.
New Item 1A headings (0)
No risk factor heading in this filing is absent from FY2017.
Removed Item 1A headings (1)
- The past growth rate in Berkshire’s book value per share is not an indication of future results.
A heading is new when no FY2017 heading matches it after ignoring case and punctuation, and reworded when it shares at least 60 percent of its words with one that went away. All current risk factor headings.
Sentences by item
16 items, with every count and a link to each item that changed
| Item | Added | Removed | Rewritten | Unchanged |
|---|---|---|---|---|
| Item 1A. Risk Factors | 12 | 13 | 35 | 67 |
| Item 7. Management’s Discussion and Analysis of Financial Condition and Results of Operations | 374 | 333 | 354 | 524 |
| Item 7A. Quantitative and Qualitative Disclosures About Market Risk | 2 | 3 | 3 | 6 |
| Item 1. Business Description | 64 | 48 | 179 | 537 |
| Item 3. Legal Proceedings | 0 | 0 | 0 | 6 |
| Cover and table of contents | 7 | 6 | 44 | 43 |
| Item 1B. Unresolved Staff Comments | 0 | 0 | 0 | 2 |
| Item 2. Description of Properties | 24 | 17 | 21 | 44 |
| Item 4. Mine Safety Disclosures | 1 | 1 | 5 | 18 |
| Item 5. Market for Registrant’s Common Equity, Related Security Holder Matters and Issuer Purchases of Equity Securities | 17 | 12 | 6 | 13 |
| Item 6. Selected Financial Data | 9 | 9 | 11 | 20 |
| Item 8. Financial Statements and Supplementary Data | 558 | 373 | 660 | 1,034 |
| Item 9. Changes in and Disagreements with Accountants on Accounting and Financial Disclosure | 0 | 0 | 0 | 2 |
| Item 9A. Controls and Procedures | 0 | 0 | 3 | 3 |
| Item 9B. Other Information | 1 | 1 | 1 | 5 |
| Item 15. Exhibits and Financial Statement Schedules | 24 | 23 | 102 | 136 |
Underlined words on a shaded ground are new in FY2018; struck-through words were in FY2017. Sentences that are wholly new or wholly gone are labelled rather than marked.
Item 1A. Risk Factors
35 rewritten, 12 added, 13 removed, 67 unchanged
Buffett, Chairman of the Board of Directors and Chief Executive Officer, age [removed: 87,] [added: 88,] in consultation with Charles T.
Munger, Vice Chairman of the Board of Directors, age [removed: 94.][added: 95.]
A significant decline in the fair values of our larger investments [added: in equity securities] may produce a material decline in our consolidated shareholders’ equity and our consolidated [removed: book value per share.][added: statement of earnings.]
Since a large percentage of our equity securities are held by our insurance subsidiaries, significant decreases in the fair values of these investments will produce significant declines in [added: their] statutory surplus.
Our large statutory surplus is a competitive advantage, and a [added: long-term] material decline could have [removed: a materially] [added: an] adverse effect on our claims-paying ability ratings and our ability to write new insurance business thus potentially reducing our future underwriting profits.
Each of our operating businesses face intense [removed: competitive pressures] [added: competition] within markets in which they operate.
While we manage our businesses with the objective of achieving long-term sustainable growth by developing and strengthening competitive advantages, many factors, including [removed: market and technology] [added: technological] changes, may erode or prevent the strengthening of competitive advantages.
Accordingly, [added: our] future operating results will depend to some degree on [removed: whether] our operating units [removed: are successful in] [added: successfully] protecting [removed: or] [added: and] enhancing their competitive advantages.
Our operating businesses are subject to normal economic [removed: cycles affecting] [added: cycles, which affect] the [removed: economy in] general [added: economy] or the [added: specific] industries in which they operate.
In addition, our utilities and energy businesses and our railroad business regularly utilize debt as a component of their capital [removed: structures.][added: structures, and depend on having access to borrowed funds through the capital markets at reasonable rates.]
Our business operations could be adversely affected [removed: directly] [added: from such acts] through the loss of human resources or destruction of production facilities and information systems.
[removed: This is a risk that we] [added: We] share [added: the risk] with all businesses.
[removed: In recent years, partially] [added: Over time,] in response to financial markets crises, global economic recessions, and social and environmental issues, regulatory initiatives [removed: have accelerated] [added: were adopted] in the United States and [removed: abroad.][added: elsewhere.]
Such initiatives [removed: address] [added: addressed] for example, the regulation of banks and other major financial [removed: institutions,] [added: institutions and] environmental and global-warming [removed: matters and health care reform.][added: matters.]
Increased regulatory compliance costs could have a significant negative impact on our operating businesses, as well as on the businesses in which we have a [removed: significant] [added: significant,] but not controlling economic [removed: interest.][added: interests.]
We rely on [removed: information] technology in virtually all aspects of our business.
Like those of many large businesses, certain of our information [removed: technology] systems have been subject to computer viruses, malicious codes, unauthorized access, phishing efforts, denial-of-service attacks and other cyber attacks and we expect to be subject to similar attacks in the future as such attacks become more sophisticated and frequent.
A significant disruption or failure of our [removed: information] technology systems could result in service interruptions, safety failures, security [removed: violations,] [added: events,] regulatory compliance failures, an inability to protect information and assets against [removed: intruders,] [added: unauthorized users,] and other operational difficulties.
Attacks perpetrated against our [removed: information] systems could result in loss of assets and critical information and expose us to remediation costs and reputational damage.
Although we have taken steps intended to mitigate these risks, including business continuity planning, disaster recovery planning and business impact analysis, a significant disruption or cyber intrusion could [removed: lead to misappropriation of assets or data corruption and could] adversely affect our results of operations, financial condition and liquidity.
Additionally, if we are unable to acquire, [removed: implement] [added: develop, implement, adopt] or protect rights around new technology, we may suffer a competitive disadvantage, which could also have an adverse effect on our results of operations, financial condition and liquidity.
Political, economic, social or financial market instability or damage to or interference with our operating assets, customers or suppliers [added: from cyber attacks] may result in business interruptions, lost revenues, higher commodity prices, disruption in fuel supplies, lower energy consumption, unstable markets, increased security, repair or other costs, [added: or] may materially adversely affect us in ways that cannot be predicted at this time.
[removed: These are risks we] [added: We] share [added: these risks] with all businesses.
[removed: We have] [added: Over ten years ago, we] assumed the risk of potentially significant losses under [added: a number of] equity index put option contracts.
Risks of losses under [removed: our equity index put option] [added: these] contracts are based on declines in equity prices of stocks comprising certain major [added: U.S. and international] stock indexes.
We attempt to take into account all possible correlations and avoid writing groups of policies from which pre-tax losses [added: from a single event] might aggregate above $10 billion.
Our tolerance for significant insurance losses may result in lower reported earnings [removed: (or net losses)] in a future period.
Our estimated unpaid losses arising under contracts covering property and casualty insurance risks are large [removed: ($104] [added: ($110] billion at December 31, [removed: 2017) so even] [added: 2018), and a] small percentage [removed: increases] [added: increase] to [removed: the aggregate liability estimate] [added: those liabilities] can result in materially lower [removed: future periodic] reported earnings.
Our railroad business conducted through BNSF is also subject to a significant number of [removed: governmental] laws and regulations with respect to rates and practices, taxes, railroad operations and a variety of health, safety, labor, environmental and other matters.
Governments may change the legislative and/or regulatory framework within which BNSF [removed: operates] [added: operates,] without providing any recourse for any adverse effects that the change may have on the business.
For example, [added: enacted] federal legislation [removed: enacted in 2008 and amended in 2015 mandates] [added: mandated] the implementation of positive train control [added: (“PTC”)] technology by December 31, 2018, on certain mainline track where inter-city and commuter passenger railroads operate and where toxic-by-inhalation (“TIH”) hazardous materials are transported.
[removed: An accidental] [added: A] release of hazardous materials could expose BNSF to significant claims, losses, penalties and environmental remediation obligations.
These laws and regulations are complex, dynamic and subject to new interpretations [removed: and/or] [added: or] change.
Regulations broadly apply and may limit management’s ability to independently make and implement decisions regarding numerous matters [removed: including] [added: including:] acquiring businesses; constructing, acquiring or disposing of operating assets; operating and maintaining generating facilities and transmission and distribution system assets; complying with pipeline safety and integrity and environmental requirements; setting rates charged to customers; establishing capital structures and issuing debt or equity securities; transacting between our domestic utilities and our other subsidiaries and affiliates; and paying dividends or similar distributions.
Failure to comply with or reinterpretations of existing regulations and new legislation or regulations, such as those relating to air and water quality, renewable portfolio standards, [removed: cyber security,] emissions performance standards, climate change, coal combustion byproduct disposal, hazardous and solid waste disposal, protected species and other environmental matters, or changes in the nature of the regulatory process may have a significant adverse impact on our financial results.
In 2018, Berkshire’s Board of Directors appointed Mr. Gregory Abel as Vice Chairman of Berkshire’s non-insurance operations and Mr. Ajit Jain as Vice Chairman of Berkshire’s insurance operations.
Mr. Abel and Mr. Jain each report directly to Mr. Buffett and Mr. Buffett continues to be responsible for major capital allocation and investment decisions.
Significant deteriorations of economic conditions over a prolonged period could produce a material adverse effect on one or more of our significant operations.
These initiatives impact all of our businesses, albeit in varying ways.
Data privacy regulations have recently been enacted in various jurisdictions in the U.S. and throughout the world.
These regulations address numerous aspects related to the security of personal information that is stored in our information systems, networks and facilities.
Failure to comply with these regulations could result in reputational damage and significant penalties.
The contracts remaining at year end 2018 will expire from 2019 through 2025.
We received considerable cash premiums as compensation for accepting these risks.
Absent major reductions in future equity securities prices, our ultimate payment obligations are not likely to be significant.
Nevertheless, there can be no assurance that equity securities prices will not decline significantly resulting in settlement payments that significantly exceed the year end 2018 intrinsic value of the contracts ($1.7 billion), recorded fair value ($2.45 billion) or the premiums we received at inception ($4.0 billion).
Due to the Federal Railroad Administration’s (“FRA”) interpretation of the PTC mandate as requiring all railroads that run on our tracks to be compliant before we can be deemed compliant, the FRA has confirmed an extension of the deadline for the Company to December 31, 2020.
The past growth rate in Berkshire’s book value per share is not an indication of future results.
In the years since present management acquired control of Berkshire, our book value per share has grown at a highly satisfactory rate.
Because of the large size of our capital base (Berkshire shareholders’ equity was approximately $348 billion as of December 31, 2017), our book value per share will very likely _not_ increase in the future at a rate close to its past rate.
Beginning in 2018, all changes in the fair values of equity securities (whether realized or unrealized) will be recognized as gains or losses in our consolidated statement of earnings.
Accordingly, significant declines in the fair values of these securities will produce significant declines in our reported earnings.
To the extent that the economy deteriorates for a prolonged period of time, one or more of our significant operations could be materially harmed.
These businesses depend on having access to borrowed funds through the capital markets at reasonable rates.
These initiatives impact not only our regulated insurance, energy and railroad transportation businesses, but also our manufacturing, services, retailing and financing businesses.
Although we received considerable premiums as compensation for accepting these risks, there is no assurance that the premiums we received will exceed our aggregate settlement payments.
When these contracts expire beginning in 2018, we could be required to make significant payments if equity index prices are significantly below the strike prices specified in the contracts.
Equity index put option contracts are recorded at fair value in our Consolidated Balance Sheet and the periodic changes in fair values are reported in earnings.
Currently, the valuations of these contracts are primarily dependent on the related index values.
Material decreases in index values may result in material losses in periodic earnings.
Item 7. Management’s Discussion and Analysis of Financial Condition and Results of Operations
354 rewritten, 374 added, 333 removed, 524 unchanged
| | | [removed: 2017] [added: 2018] | | | | [removed: 2016] [added: 2017] | | | | [removed: 2015] [added: 2016] | | |
| Insurance – underwriting | | $ | [removed: (2,219] [added: 1,566] | [removed: )] | | $ | [removed: 1,370] [added: (2,219] | [added: )] | | $ | [removed: 1,162] [added: 1,370] | |
| Insurance – investment income | | | [removed: 3,917] [added: 4,554] | | | | [removed: 3,636] [added: 3,887] | | | | [removed: 3,725] [added: 3,636] | |
| Railroad | | | [removed: 3,959] [added: 5,219] | | | | [removed: 3,569] [added: 3,959] | | | | [removed: 4,248] [added: 3,569] | |
[removed: | Manufacturing, service] [added: _Manufacturing, Service] and [removed: retailing | | | 6,208 | | | | 5,631 | | | | 4,683 | |][added: Retailing_ _(Continued)_]
| Investment and derivative gains/losses | | | [removed: 1,377] [added: (17,737] | [added: )] | | | [removed: 6,497] [added: 1,377] | | | | [removed: 6,725] [added: 6,497] | |
| Tax Cuts and Jobs Act of 2017 | | | [removed: 29,106] [added: —] | | | | [removed: —] [added: 29,106] | | | | — | |
| Net earnings attributable to Berkshire Hathaway shareholders | | $ | [removed: 44,940] [added: 4,021] | | | $ | [removed: 24,074] [added: 44,940] | | | $ | [removed: 24,083] [added: 24,074] | |
The business segment data (Note [removed: 23] [added: 26] to the accompanying Consolidated Financial Statements) should be read in conjunction with this discussion.
[removed: Our net] [added: Net] earnings in 2017 included approximately $29.1 billion attributable to a one-time net benefit from the enactment of the Tax Cuts and Jobs Act [added: of 2017] (“TCJA”) on December 22, 2017.
See Note [removed: 16] [added: 18] to the Consolidated Financial Statements.
This benefit included approximately $29.6 billion related to a one-time non-cash reduction of [removed: our] net deferred income tax liabilities [removed: that arose] from the reduction in the statutory U.S. corporate income tax rate from 35% to 21%, [removed: as well as] [added: and] a net benefit of approximately $900 million primarily [removed: from] [added: attributable to] our earnings from Kraft Heinz, partly offset by a one-time income tax expense of approximately $1.4 billion [removed: payable over eight years] on the deemed repatriation of certain accumulated undistributed earnings of foreign subsidiaries.
Accordingly, the after-tax figures presented [added: for 2017] in the discussion of our various operating businesses and other activities [removed: in this section] exclude the one-time effects of the TCJA.
After-tax earnings of our utility and energy [removed: business] [added: businesses] in 2017 declined [removed: $204] [added: $197] million compared to [removed: 2016.][added: 2016, reflecting the debt prepayment losses in 2017.]
After-tax earnings [added: in 2017] of our manufacturing, service and retailing businesses [removed: in 2017] were [removed: $6.2] [added: $7.3] billion, an increase of [removed: 10.2%] [added: 7.0%] compared to [removed: 2016.][added: 2016, reflecting comparatively higher earnings from several of our larger operations and the impact of businesses acquired in 2016 and 2017.]
After-tax investment and derivative gains were approximately $1.4 billion in [removed: 2017, $6.5 billion in 2016] [added: 2017] and [removed: $6.7] [added: $6.5] billion in [removed: 2015.][added: 2016.]
[removed: The] [added: Investment] gains in 2016 included approximately $2.7 billion from the redemptions of our Wrigley and Kraft Heinz preferred stock investments, [added: and] sales of Dow Chemical common stock [removed: that] we received [removed: upon] [added: in the] conversion of [removed: our] [added: the] Dow Chemical preferred stock [removed: investment and a non-cash gain of approximately $1.9 billion related to the exchange of Procter & Gamble (“P&G”) common stock for 100% of the common stock of Duracell.][added: investment.]
[removed: After-tax] [added: In 2017, we recorded after-tax] unrealized gains [removed: in 2017 related to] [added: on] our investments in equity securities [removed: included] [added: of approximately $19 billion] in other comprehensive [removed: income were approximately $19 billion.][added: income.]
Beginning in 2018, [added: our periodic net earnings include changes in] unrealized gains and losses on [removed: equity securities will be included] [added: our investments] in [removed: net earnings due to a new accounting standard.][added: equity securities.]
We believe that investment [removed: and derivative] gains/losses, whether realized from sales or unrealized from changes in market prices, are often meaningless in terms of understanding our reported [removed: results] [added: consolidated earnings] or evaluating our periodic economic performance.
[removed: Investment and derivative] [added: These] gains and losses have caused and will continue to cause significant volatility in our [added: periodic] earnings.
Other earnings [removed: in 2017 and 2016] included after-tax foreign currency exchange rate gains [removed: and] [added: of $289 million in 2018,] losses [added: of $655 million in 2017 and gains of $159 million in 2016] related to parent company Euro-denominated debt.
Our management views [added: our] insurance businesses as possessing two distinct [removed: operations] [added: activities] – underwriting and investing.
Accordingly, we believe that such gains and losses are not [removed: predictable or] necessarily meaningful in understanding the operating results of our insurance operations.
Generally, we consider [removed: pre-tax] catastrophe losses in excess of $100 million [added: (pre-tax)] from a current year event as [removed: significant, and we had six such events in 2017.][added: significant.]
There were no significant [added: catastrophe loss] events in [removed: either 2016 or 2015.][added: 2016.]
Changes in estimates for unpaid losses and loss adjustment expenses, including amounts established for occurrences in prior [removed: years] [added: years,] can also significantly affect our periodic underwriting results.
Unpaid loss estimates, including estimates under retroactive reinsurance [removed: contracts] [added: contracts, were approximately $110 billion] as of December 31, [removed: 2017 were approximately $104 billion.][added: 2018.]
Underwriting results of our insurance businesses are summarized below [removed: (in] [added: (dollars in] millions).
| GEICO | | $ | [removed: (310] [added: 2,449] | [removed: )] | | $ | [removed: 462] [added: (310] | [added: )] | | $ | [removed: 460] [added: 462] | |
| Berkshire Hathaway Reinsurance Group | | | [removed: (3,648] [added: (1,109)] | [removed: )] | | | [removed: 1,012] [added: (3,648] | [added: )] | | | [removed: 553] [added: 1,012] | |
| Berkshire Hathaway Primary Group | | | [removed: 719] [added: 670] | | | | [removed: 657] [added: 719] | | | | [removed: 824] [added: 657] | |
| Pre-tax underwriting gain (loss) | | | [removed: (3,239] [added: 2,010] | [removed: )] | | | [removed: 2,131] [added: (3,239] | [added: )] | | | [removed: 1,837] [added: 2,131] | |
| Income taxes and noncontrolling interests | | | [removed: (1,020] [added: 444] | [removed: )] | | | [removed: 761] [added: (1,020] | [added: )] | | | [removed: 675] [added: 761] | |
| Net underwriting gain (loss) | | $ | [removed: (2,219] [added: 1,566] | [removed: )] | | $ | [removed: 1,370] [added: (2,219] | [added: )] | | $ | [removed: 1,162] [added: 1,370] | |
| | | [removed: 2017] [added: 2018] | | | | [added: 2017] | | | | 2016 | | | [removed: | | | | | 2015 | | | | | | |]
| Premiums written | | $ | [removed: 30,547] [added: 34,123] | | | | | | | $ | [removed: 26,309] [added: 30,547] | | | | | | | $ | [removed: 23,378] [added: 26,309] | | | | | |
| Premiums earned | | $ | [removed: 29,441] [added: 33,363] | | | | 100.0 | | | $ | [removed: 25,483] [added: 29,441] | | | | 100.0 | | | $ | [removed: 22,718] [added: 25,483] | | | | 100.0 | |
| Losses and loss adjustment expenses | | | [removed: 25,497] [added: 26,278] | | | | [removed: 86.6] [added: 78.8] | | | | [removed: 21,044] [added: 25,497] | | | | [removed: 82.6] [added: 86.6] | | | | [removed: 18,647] [added: 21,044] | | | | [removed: 82.1] [added: 82.6] | |
| Underwriting expenses | | | [removed: 4,254] [added: 4,636] | | | | [removed: 14.5] [added: 13.9] | | | | [removed: 3,977] [added: 4,254] | | | | [removed: 15.6] [added: 14.5] | | | | [removed: 3,611] [added: 3,977] | | | | [removed: 15.9] [added: 15.6] | |
| Utilities and energy | | | 2,621 | | | | 2,033 | | | | 2,230 | |
| Manufacturing, service and retailing | | | 9,364 | | | | 7,282 | | | | 6,803 | |
| Other | | | (1,566 | ) | | | (485 | ) | | | (31 | ) |
These gains and losses are likely to be very significant given the size of our current holdings and the inherent volatility in securities prices.
Prior to 2018, the changes in unrealized gains and losses pertaining to such investments were recorded in other comprehensive income.
The new accounting treatment has no effect on our consolidated shareholders’ equity.
After-tax earnings of our business operations in 2018 were favorably affected by lower U.S. income tax expense, primarily attributable to a reduction in the statutory U.S. corporate income tax rate from 35% to 21%.
The effect of the lower U.S. statutory income tax rate in 2018 on the comparative after-tax earnings of our various business operations varied, reflecting the differences in the mix of earnings subject to income tax, income tax credits and the effects of state and local income taxes.
After-tax earnings from insurance underwriting were approximately $1.6 billion in 2018 compared to after-tax losses of approximately $2.2 billion in 2017.
Results in 2018 included reductions of estimated ultimate liabilities for prior years’ property/casualty loss events, gains from foreign currency exchange rate changes on certain non-U.S. Dollar denominated liabilities of U.S subsidiaries of $207 million and a lower effective income tax rate, partly offset by losses from significant catastrophe events of approximately $1.6 billion ($1.3 billion after-tax).
After-tax losses from insurance underwriting in 2017 included estimated pre-tax losses of approximately $3.0 billion ($1.95 billion after-tax) from significant catastrophe events.
Underwriting results in 2017 also included after-tax foreign currency exchange rate losses of $295 million.
Our railroad business generated a 31.8% increase in after-tax earnings in 2018 compared to 2017, reflecting an increase in unit volume, higher average revenue per car/unit and a lower effective income tax rate, partly offset by increased fuel and other operating costs.
Our utilities and energy businesses produced higher after-tax earnings in 2018 compared to 2017, primarily due to a lower overall effective income tax rate and the effects of losses incurred in 2017 in connection with the prepayment of certain long-term debt, partially offset by lower pre-tax earnings in certain of the regulated utilities.
After-tax earnings in 2018 of our manufacturing, service and retailing businesses increased 29% over 2017, due to lower effective income tax rates and a 13% increase in pre-tax earnings.
After-tax losses from investments and derivative contracts were $17.7 billion in 2018, which included after-tax losses of approximately $18 billion from changes in market values of our investments in equity securities held at December 31, 2018.
Prior to 2018, after-tax investment gains or losses on equity securities arose from the sale of securities during the period based on the cost of the disposed security or through the recording of other-than-temporary impairment losses.
Investment gains in 2016 also included a non-cash after-tax gain of approximately $1.9 billion related to the exchange of Procter & Gamble (“P&G”) common stock for 100% of the common stock of Duracell.
We believe that investment and derivative gains/losses, whether realized from dispositions or unrealized from changes in market prices of equity securities, are generally meaningless in understanding our reported results or evaluating the economic performance of our businesses.
In addition, other earnings in 2018 included losses from equity method investments due to Kraft Heinz, partly offset by earnings from other equity method investments.
Other earnings in 2018 also reflected increased interest income from short-term investments.
We incurred estimated pre-tax losses of approximately $1.6 billion in 2018 and $3.0 billion in 2017 from significant catastrophe events.
| Effective income tax rate | | | 21.4% | | | | 32.0% | | | | 34.8% | |
Premiums written were $34.1 billion in 2018, an increase of 11.7% compared to 2017.
The increase in premiums per policy was attributable to rate increases, coverage changes and changes in state and risk mix.
The rate increases were in response to accelerating claim costs in recent years.
Although policies-in-force increased 540,000 during 2018, the rate of increase slowed, as voluntary auto new business sales decreased 4.7% compared to 2017.
Pre-tax underwriting gains in 2018 were $2,449 million compared to losses of $310 million in 2017.
Underwriting results in 2018 reflected the effects of lower losses from significant catastrophe events and from prior years’ loss events, as well as increased average premiums per policy.
Losses and loss adjustment expenses were $26.3 billion in 2018, an increase of $781 million (3.1%) compared to 2017.
GEICO’s ratio of losses and loss adjustment expenses to premiums earned (the “loss ratio”) for 2018 was 78.8%, a decline of 7.8 percentage points compared to 2017.
Losses from significant catastrophe events were $105 million in 2018 (Hurricanes Florence and Michael and the wildfires in California) and approximately $450 million in 2017 (Hurricanes Harvey and Irma).
Losses and loss adjustment expenses regularly include gains or losses for the decreases or increases in the ultimate claim loss estimates during the period for prior years’ loss events.
These gains or losses produce corresponding increases or decreases to pre-tax underwriting gains.
GEICO’s losses and loss adjustment expenses included gains of $222 million in 2018 and losses of $517 million in 2017 with respect to prior years’ loss events.
In addition, claims frequencies in 2018 for property damage, collision, and bodily and personal injury protection coverages declined (two to four percent range) compared to 2017.
_GEICO (Continued)_
Underwriting expenses were approximately $4.6 billion in 2018, an increase of $382 million (9.0%) over 2017.
GEICO’s expense ratio (underwriting expenses to premiums earned) in 2018 was 13.9%, a decrease of 0.6 percentage points compared to 2017.
The underwriting expense increase was primarily attributable to increases in advertising expenses, insurance premium taxes and employee-related costs, which reflected wage and staffing increases.
| Utilities and energy | | | 2,083 | | | | 2,287 | | | | 2,132 | |
| Finance and financial products | | | 1,335 | | | | 1,427 | | | | 1,378 | |
| Other | | | (826 | ) | | | (343 | ) | | | 30 | |
It also is responsible for establishing and monitoring Berkshire’s corporate governance practices.
Our insurance businesses generated after-tax losses from underwriting of $2.2 billion in 2017 compared to after-tax gains of $1.4 billion in 2016 and $1.2 billion in 2015.
Underwriting results for 2017 included estimated pre-tax losses of approximately $3.0 billion ($1.95 billion after-tax), primarily attributable to three major hurricanes in the U.S. and Puerto Rico and wildfires in California.
Underwriting results in each year also included after-tax foreign currency exchange rate gains and losses from the revaluation of certain non-U.S. Dollar denominated reinsurance liabilities.
In 2017, such after-tax losses were $295 million compared to after-tax gains of $458 million in 2016 and $164 million in 2015.
Our railroad business generated lower net earnings in 2016 compared to 2015, primarily due to a 5.0% decline in unit volume.
Earnings in 2017 were negatively affected by losses from the prepayment of certain long-term debt.
After-tax earnings of our utilities and energy businesses increased in 2016 compared to 2015, attributable to increased pre-tax earnings and a lower effective income tax rate.
Earnings in 2017 reflected comparatively higher earnings from several of our larger operations and the impact of businesses acquired in 2016 and 2017.
After-tax earnings in 2016 of our manufacturing, service and retailing businesses increased compared to 2015, primarily due to earnings from Precision Castparts, which was acquired on January 29, 2016, partly offset by comparatively lower overall earnings from the other businesses within this group.
Gains in 2015 included non-cash holding gains of approximately $4.4 billion in connection with our investment in Kraft Heinz common stock.
After-tax foreign exchange losses on our Euro-denominated debt were $655 million in 2017 compared to after-tax gains of $159 million in 2016.
In addition, other earnings includes earnings from our investment in Kraft Heinz.
These estimates will be revised upward or downward in future periods, which could produce significant decreases or increases to pre-tax earnings.
Foreign currency exchange rates can be volatile and the resulting impact on our underwriting earnings can be relatively significant.
Premiums earned in 2017 were $29.4 billion, exceeding 2016 by approximately $4.0 billion (15.5%).
We incurred pre-tax underwriting losses in 2017, which included approximately $450 million from hurricanes Harvey and Irma.
Our underwriting results in 2017 were also affected by increased average claims severities.
The largest components of underwriting expenses are employee-related (salaries and benefits) and advertising, which increased at lower rates than premiums earned.
Premiums written in 2016 increased 12.5% to $26.3 billion and premiums earned increased approximately $2.8 billion (12.2%) to $25.5 billion, compared to 2015.
Voluntary auto new business sales in 2016 increased 10.9% compared to the prior year.
Voluntary auto new business growth accelerated over the last half of 2016 and, for the year, voluntary auto policies-in-force increased 974,000.
Losses and loss adjustment expenses incurred in 2016 increased $2.4 billion (12.9%) to $21.0 billion and our loss ratio in 2016 increased 0.5 percentage points compared to 2015.
In 2016, we experienced increases in storm losses (primarily from hail and flooding) and claims severity, partly offset by the effects of premium rate increases.
Claims frequencies in 2016 were relatively unchanged from 2015 for property damage, collision, bodily injury and personal injury protection coverages.
Underwriting expenses in 2016 were $4.0 billion, an increase of $366 million (10.1%) over 2015.
The increase in underwriting expenses in 2016 reflected the increase in policies-in-force.
In addition, the BHLN Group writes periodic payment annuity contracts.
| | | | | | | | | | | | | | | | | | | | | | | | | | | | | | | | | | | | | |
| --- | --- | --- | --- | --- | --- | --- | --- | --- | --- | --- | --- | --- | --- | --- | --- | --- | --- | --- | --- | --- | --- | --- | --- | --- | --- | --- | --- | --- | --- | --- | --- | --- | --- | --- | --- | --- |
| | | | 18,468 | | | | 8,247 | | | | 7,432 | | | | 18,307 | | | | 8,472 | | | | 7,226 | | | | (2,925) | | | | 835 | | | | 625 | |
| | | | 5,744 | | | | 5,670 | | | | 5,951 | | | | 5,706 | | | | 5,669 | | | | 5,956 | | | | (723) | | | | 177 | | | | (72) | |
| NICO Group | | $ | 4,371 | | | $ | 4,433 | | | $ | 4,702 | | | $ | 4,451 | | | $ | 4,649 | | | $ | 4,416 | | | | $(1,044) | | | $ | 767 | | | $ | 944 | |
| General Re Group | | | 3,342 | | | | 2,560 | | | | 2,725 | | | | 3,101 | | | | 2,569 | | | | 2,805 | | | | (551) | | | | 128 | | | | 151 | |
| | | $ | 7,713 | | | $ | 6,993 | | | $ | 7,427 | | | $ | 7,552 | | | $ | 7,218 | | | $ | 7,221 | | | | $(1,595) | | | | 895 | | | | 1,095 | |
NICO Group’s premiums earned were $4.4 billion, a decrease of $198 million (4%) in 2017 compared to 2016, while premiums written declined slightly.
General Re Group’s premiums earned were $3.1 billion in 2017, an increase of $532 million (21%) compared to 2016.
An excerpt. Shown here: 40 of 354 rewritten, 40 of 374 added and 40 of 333 removed. The counts are complete. For every sentence, read Item 7. Management’s Discussion and Analysis of Financial Condition and Results of Operations in the FY2018 filing and the FY2017 filing.
Item 7A. Quantitative and Qualitative Disclosures About Market Risk
3 rewritten, 2 added, 3 removed, 6 unchanged
Under the supervision and with the participation of our management, including our principal executive officer and principal financial officer, we conducted an evaluation of the effectiveness of the Company’s internal control over financial reporting as of December 31, [removed: 2017] [added: 2018] as required by the Securities Exchange Act of 1934 Rule 13a-15(c).
Based on our evaluation under the framework in _Internal Control—Integrated Framework_ (2013), our management concluded that our internal control over financial reporting was effective as of December 31, [removed: 2017.][added: 2018.]
The effectiveness of our internal control over financial reporting as of December 31, [removed: 2017] [added: 2018] has been audited by Deloitte & Touche LLP, an independent registered public accounting firm, as stated in their report which appears on page [removed: K-61.][added: K-62.]
February 23, 2019
K-61
| --- | --- |
February 23, 2018
K-60
Item 1. Business Description
179 rewritten, 64 added, 48 removed, 537 unchanged
Berkshire and its consolidated subsidiaries employ approximately [removed: 377,000] [added: 389,000] people worldwide.
Berkshire’s insurance businesses provide insurance and reinsurance of property and casualty [removed: risks] and [removed: also reinsure] life, accident and health risks worldwide.
In reinsurance activities, the reinsurer assumes defined portions of risks that other direct insurers or reinsurers [removed: have] assumed in their own insuring activities.
Collectively, the combined statutory surplus of Berkshire’s U.S. based insurers was approximately [removed: $170] [added: $162] billion at December 31, [removed: 2017.][added: 2018.]
Under TRIA, the Department of the Treasury is charged with certifying “acts of terrorism.” [removed: During 2018, coverage] [added: Coverage] under TRIA [removed: will occur] [added: occurs] if the industry insured loss for certified events occurring during the calendar year exceeds [removed: $160 million.][added: $180 million in 2019 and $200 million in 2020, or any calendar year thereafter.]
During [removed: 2018,] [added: 2019,] in the event of a certified act of terrorism, the federal government will reimburse insurers (conditioned on their satisfaction of policyholder notification requirements) for [removed: 82%] [added: 81%] of their insured losses in excess of an insurance group’s deductible.
Under the 2015 TRIA Reauthorization, the federal government’s reimbursement obligation will be reduced [removed: annually by 1% per year until the level of reimbursement is reduced] to 80% in [removed: 2020.][added: 2020 and thereafter.]
The aggregate deductible in [removed: 2018] [added: 2019] for Berkshire’s insurance group is expected to approximate [removed: $1.1] [added: $1.3] billion.
Some jurisdictions impose comprehensive regulatory requirements on insurance businesses, such as in the United Kingdom, where insurers are subject to regulation by the Prudential Regulation Authority and the Financial Conduct Authority [removed: and] in Germany where insurers are subject to regulation by the Federal Financial Supervisory Authority [removed: (BaFin).][added: (BaFin) and in Australia where insurers are subject to regulation by the Australian Prudential Regulatory Authority.]
Berkshire’s insurance businesses employ approximately [removed: 47,000] [added: 49,000] people.
[removed: GEICO—GEICO is headquartered in Chevy Chase, Maryland and its] [added: GEICO’s] insurance subsidiaries consist [removed: of:] [added: of] Government Employees Insurance Company, GEICO General Insurance Company, GEICO Indemnity Company, GEICO Casualty Company, GEICO Advantage Insurance Company, GEICO Choice Insurance Company, GEICO Secure Insurance Company, GEICO County Mutual Insurance Company and GEICO Marine Insurance Company.
[removed: These] [added: GEICO] companies primarily offer private passenger automobile insurance to individuals in all 50 states and the District of Columbia.
[removed: In addition,] GEICO [added: also] insures motorcycles, all-terrain vehicles, recreational vehicles, boats and small commercial fleets and acts as an agent for other insurers who offer homeowners, renters, boat, life and identity [added: management insurance to individuals who desire insurance coverages other than those offered by GEICO.]
[removed: GEICO markets its policies] [added: GEICO’s marketing is] primarily through direct response methods in which applications for insurance are submitted directly to the companies via the Internet or by telephone.
[removed: As a result of an aggressive] [added: Significant] advertising [removed: campaign] [added: campaigns] and competitive [removed: rates,] [added: rates contributed to a cumulative increase in] voluntary policies-in-force [removed: have increased about 41%] [added: of approximately 35%] over the past five years.
According to most recently published A.M. Best data for [removed: 2016,] [added: 2017,] the five largest automobile insurers had a combined market share in [removed: 2016] [added: 2017] of approximately [removed: 55%,] [added: 56%,] with GEICO’s market share being second largest at approximately [removed: 11.9%.][added: 12.8%.]
Since the publication of that data, [added: GEICO’s] management estimates [removed: that GEICO’s] [added: its] current market share [removed: has grown to] [added: is] approximately [removed: 12.8%.][added: 13.3%.]
[removed: Private] [added: State insurance departments stringently regulate private] passenger auto [removed: insurance is strictly regulated by state insurance departments.][added: insurance.]
Reinsurance business is written through National Indemnity Company (“NICO”), domiciled in Nebraska, its subsidiaries and various other insurance subsidiaries wholly owned by Berkshire (collectively, the “NICO Group”) and General [removed: Reinsurance Corporation (“GRC”),] [added: Re Corporation,] domiciled in Delaware, and its subsidiaries (collectively the “General Re Group”).
[removed: BHRG’s underwriting operations in the U.S. are headquartered in Stamford, Connecticut and it] [added: BHRG] also conducts business activities globally in 23 countries.
[removed: Contracts] [added: Reinsurance contracts] are written on both a quota-share and excess basis for multiple lines of business.
General Re [removed: Group’s] [added: Group conducts] business in North America [removed: is] primarily [removed: conducted] through [removed: GRC,] [added: General Reinsurance Corporation (“GRC”),] which is licensed in the District of Columbia and all states, except Hawaii, where it is an accredited reinsurer.
[removed: Operations] [added: GRC conducts operations] in North America [removed: are conducted] from its headquarters in Stamford, Connecticut and through 13 branch offices in the U.S. and Canada.
In North America, the General Re Group [removed: also] includes General Star National Insurance Company, General Star Indemnity Company and Genesis Insurance Company, which [removed: underwrite] [added: offer] a broad array of specialty and surplus lines and property, casualty and professional liability [removed: coverages through a select group of wholesale brokers, manage general underwriters and program administrators, and offer solutions for the unique needs of public entity, commercial and captive customers.][added: coverages.]
General Re Group’s international reinsurance business is conducted on a direct basis through General Reinsurance AG [removed: (“GRAG”)] [added: (“GRAG”), based in Cologne Germany,] and through several other subsidiaries and branches in [removed: 17] [added: 23] countries.
International business is also written through brokers, [removed: primarily via] [added: including] Faraday, a wholly-owned subsidiary.
Faraday owns the managing agent of Syndicate 435 at Lloyd’s [added: of London,] and provides capacity and participates in 100% of the results of Syndicate 435.
The concept of time-value-of-money is an important element in establishing retroactive reinsurance contract prices and terms, since [removed: the payment of losses are often expected to] [added: loss payments may] occur over decades.
[removed: Expected] [added: Normally, expected] ultimate losses payable under these policies are [removed: normally] expected to exceed premiums, thus producing underwriting losses.
[removed: This] [added: Nevertheless, this] business is [removed: accepted,] [added: written,] in part, because of the large amounts of policyholder funds generated for investment, the economic benefit of which will be reflected through investment results in future periods.
In [removed: 2017,] [added: 2018, the General Re Group wrote] approximately [removed: 33%] [added: 29%] of life/health net premiums [removed: were written] in the United States, [removed: 23%] [added: 20%] in Western Europe and the remaining [removed: 44%] [added: 51%] throughout the rest of the world.
These policies, generally relate to the settlement of underlying personal injury or workers’ compensation cases of other insurers, [removed: and are] known as structured settlements.
NICO and certain affiliates (“NICO Primary”) underwrite [added: commercial] motor vehicle and general liability insurance [removed: to commercial enterprises] on [removed: both] an admitted [added: basis] and [added: on an] excess and surplus basis.
The “Berkshire Hathaway Homestate Companies” (“BHHC”) is a group of insurers offering workers’ compensation, commercial auto and commercial property [removed: coverages.][added: coverages to a diverse client base.]
[removed: BH] [added: Berkshire Hathaway] Specialty [added: Insurance (“BH Specialty”)] provides [removed: primary and excess] commercial property, casualty, healthcare professional liability, executive and professional lines, [removed: surety and travel insurance] [added: surety, travel, medical stop loss] and [removed: other] [added: homeowners] insurance.
BH Specialty writes business on both an excess and surplus lines basis and an admitted basis in the U.S., and on a locally admitted basis outside the U.S. BH Specialty is based in Boston, Massachusetts, with regional offices currently in several cities in the U.S. and international offices [added: located] in Australia, New Zealand, [removed: Hong Kong, Singapore, Canada, Germany, United Kingdom] [added: Canada] and [removed: Macau.][added: several countries in Asia and Europe.]
MedPro Group (“MedPro”) is a [removed: national leader in offering] [added: leading provider of] customized healthcare liability insurance, claims, patient safety and risk solutions to physicians, surgeons, dentists and other healthcare professionals, as well as hospitals, senior care and other healthcare [removed: facilities.][added: facilities in the United States.]
[removed: Its insurance] [added: MedPro distributes] policies [removed: are distributed] primarily through a nationwide network of appointed agents and brokers.
U.S. Investment Corporation (“USIC”) and its subsidiaries are specialty insurers that underwrite commercial, professional and personal lines insurance on an admitted [removed: and] [added: basis, as well as an] excess and surplus basis.
[removed: Policies are marketed] [added: USIC markets policies] in all 50 states and the District of Columbia through wholesale and retail insurance agents.
GEICO—GEICO is headquartered in Chevy Chase, Maryland.
GEICO conducts business through regional service centers and claims adjustment and other facilities in 39 states.
BHRG’s underwriting operations in the U.S. are based in Stamford, Connecticut.
Such business is marketed through a select group of wholesale brokers, managing general underwriters and program administrators, and offer solutions for the unique needs of public entity, commercial and captive customers.
Insurance coverages are offered nationwide primarily through insurance agents and brokers.
NICO Primary and BHHC are each based in Omaha, Nebraska.
MedPro currently offers coverage options to healthcare providers in the other countries as well as student health insurance, through its subsidiaries and other Berkshire affiliates.
MedPro is based in Fort Wayne, Indiana.
USIC is based in Wayne, Pennsylvania.
Applied is based in Omaha, Nebraska.
Guard also provides complementary commercial auto and professional liability in an expanding number of states.
Guard is based in Wilkes-Barre, Pennsylvania.
On October 1, 2018, NICO acquired MLMIC Insurance Company (“MLMIC”).
MLMIC has been the leading writer of medical professional liability insurance in New York State for over 40 years.
MLMIC distributes its policies on a direct basis to medical and dental professionals, health care providers and hospitals.
Investment portfolios are managed by Berkshire’s Chief Executive Officer and other in-house investment managers.
The cost of float can be measured as the net pre-tax underwriting loss as a percentage of average float.
BNSF Logistics, LLC, a wholly-owned subsidiary of BNSF, provides non-asset based logistics services to third parties.
BNSF Logistics’ services include transportation strategy and execution, managed transportation services, supply chain consulting, project management, engineering, reverse logistics, warehousing and cross-docking, and customs house brokerage services.
The final Clean Power Plan compliance obligations were scheduled to begin in 2022, and extend through 2030.
On August 21, 2018, the EPA proposed the Affordable Clean Energy rule, which would replace the Clean Power Plan.
The Affordable Clean Energy rule would determine that the best system of emissions reduction for existing coal fueled power plants is heat rate improvements and proposes a set of candidate technologies and measures that could improve heat rates.
Measures taken to meet the standards of performance must be achieved at the source itself.
The EPA received comments on the proposal through October 2018 and anticipates finishing the rule in spring 2019.
For example, through December 31, 2018, BHE’s cumulative investment in wind, solar, geothermal and biomass generation is approximately $25 billion.
In April 2018, HomeServices acquired the remaining 33.3% interest.
Marmon Holdings, Inc. (“Marmon”) is a global industrial organization comprising 13 diverse business sectors and more than 100 autonomous manufacturing and service businesses.
Marmon’s business sectors are described as follows.
_Beverage Technologies_ manufactures beverage dispensing and cooling equipment, and related products for global brand owners and foodservice retailers.
Operations are based in the U.S. with manufacturing in China, India, the U.K. and Germany.
Products are sold primarily throughout the U.S., Europe, and Asia.
_Foodservice Technologies_ manufactures hot and cold food preparation and holding equipment for restaurants, cafeterias, hotels, caterers, and other foodservice providers worldwide.
Operations are based in the U.S., with manufacturing in China and Italy.
Products are sold primarily throughout the U.S., Europe, and Asia.
_Water Technologies_ manufactures water treatment equipment for residential, commercial, and industrial applications worldwide.
Operations are based primarily in the U.S., Canada, China, Singapore, India, and Mexico with business centers located in Belgium, France, Poland, Germany, the U.K., Italy, Switzerland, and U.A.E.
_Transportation Products_ serves the automotive, heavy-duty highway transportation, and aerospace industries with precision-molded plastic components; fastener thread solutions; metal tubing; auto aftermarket transmission and chassis products; platform trailers; and truck and trailer components.
Operations and business are conducted primarily in the U.S., Mexico, Canada, Europe, and Asia.
Operations are based in the U.S. and conducted primarily in the U.S., U.K., Czech Republic, and China.
Operations are based in the U.S., Canada, and Mexico and conducted primarily in those countries.
Under the 2015 TRIA Reauthorization, the level of insured losses for certified events occurring during the calendar year required to trigger coverage under TRIA will increase annually by $20 million per year until the level of insured losses required to trigger coverage reaches $200 million in 2020.
management insurance to individuals who desire insurance coverages other than those offered by GEICO.
Some insurance companies may exacerbate price competition by selling their products for a period of time at less than adequate rates.
GEICO will not knowingly follow that strategy.
Reinsurance activities are primarily marketed directly to clients without involving a broker or intermediary.
In 2014, NICO entered into a reinsurance contract with Liberty Mutual Insurance Company (“LMIC”).
Under the agreement, NICO reinsures substantially all of LMIC’s unpaid losses and allocated loss adjustment expense liabilities related to (a) asbestos and environmental claims from policies incepting prior to January 1, 2005, and (b) workers’ compensation claims occurrences arising prior to January 1, 2014, subject to an aggregate retention of approximately $12.5 billion and subject to an aggregate limit of $6.5 billion.
This business is written nationwide primarily through insurance agents and brokers and is based in Omaha, Nebraska.
BHHC serves a diverse client base.
The BHHC business is generated primarily through independent agents and brokers.
Berkshire Hathaway Specialty Insurance (“BH Specialty”) was formed in April 2013.
MedPro recently began offering coverage options to healthcare providers in the United Kingdom, France and Singapore, as well as insurance and reinsurance options related to student health insurance programs.
Investment portfolios are primarily managed by Berkshire’s corporate senior management group.
Based on weekly reporting by the Association of American Railroads, BNSF’s share of the western United States rail traffic in 2017 was approximately 50.9%.
On December 28, 2017, the EPA issued an Advance Notice of Proposed Rulemaking regarding the Clean Power Plan to solicit comment from the public as the agency considers proposing a future rule establishing emission guidelines for greenhouse gas emissions from existing electric generating units.
For example, as of December 31, 2017, BHE has invested $21 billion in solar, wind, geothermal and biomass generation.
Berkshire currently owns 99.75% of Marmon Holdings, Inc. (“Marmon”), a holding company comprised of three autonomous companies consisting of Marmon Engineered Components Company (“Engineered Components”), Marmon Retail Technologies Company (“Retail Technologies”) and Marmon Energy Services Company (“Energy Services”).
Energy Services includes the transportation equipment manufacturing, repair, and leasing businesses (UTLX Company), which is discussed in the Finance and Financial Products businesses section of this Item.
Engineered Components, Retail Technologies and the Engineered Wire and Cable sector of Energy Services comprise “Marmon manufacturing”.
Engineered Components:
_Construction Fasteners_ _& Safety Products_ supplies fasteners and hand and arm protective wear to the construction, industrial and other markets.
_Highway Technologies_ serves the heavy-duty highway transportation industry with trailers, truck and trailer components including fifth wheel coupling solutions, wheel-end products, undercarriage products, and fenders, as well as truck modification services.
Retail Technologies:
_Retail Food Technologies_ and _Restaurant_ _& Catering Technologies_ supplies commercial food preparation and holding equipment for restaurants, fast food chains, hotels and caterers.
_Beverage Technologies_ produces beverage dispensing and cooling equipment for foodservice retailers as well as on-shelf management systems for single-serve beverages and pre-tooled stock solutions for in-store applications.
_Water Technologies_ manufactures and markets residential water softening, purification, and refrigeration filtration systems, treatment systems for industrial markets including power generation, oil and gas, chemical, and pulp and paper, gear drives for irrigation systems and cooling towers and air-cooled heat exchangers.
The Engineered Wire & Cable sector supplies electrical and electronic wire and cable for energy related markets and other industries.
JM’s operations are subject to a variety of federal, state and local environmental laws and regulations.
These orders may be picked up at the customer’s nearest dealer.
Fruit of the Loom (“FOL”) is headquartered in Bowling Green, Kentucky.
In 2015, FOL exited an unprofitable intimate apparel business in Europe.
In 2017, a significant portion of FOL’s sales were to Walmart.
Forest River is a leading manufacturer of RVs with brand names such as Berkshire, Cardinal, Cedar Creek, Cherokee, Coachman, Dynamax, Flagstaff, Forester, Georgetown, Palomino, Prime Time Manufacturing, Puma, Rockwood, Salem, Sandpiper, Sierra, Sunseeker, Surveyor, Viking RV and Wildwood.
Buses are sold under the Battisti, Berkshire Coach, Elkhart Coach, Glaval Bus, Starcraft Bus, and Startrans Bus brand names.
Information concerning these activities follows.
Sager Electrical Supply Company, Inc. is a subsidiary of TTI located in Massachusetts whose additional focus is the distribution of power components within the electronics distribution market.
The Colony, Texas store opened in 2015 and includes retail space of approximately 560,000 square feet.
Finance and Financial Products
Berkshire’s finance and financial products activities include an integrated manufactured housing and finance business, transportation equipment leasing and furniture leasing.
Berkshire’s finance and financial products businesses employ approximately 25,600 people in the aggregate.
An excerpt. Shown here: 40 of 179 rewritten, 40 of 64 added and 40 of 48 removed. The counts are complete. For every sentence, read Item 1. Business Description in the FY2018 filing and the FY2017 filing.
Cover and table of contents
44 rewritten, 7 added, 6 removed, 43 unchanged
[added: ☑] ANNUAL REPORT PURSUANT TO SECTION 13 OR 15(d) OF THE SECURITIES EXCHANGE ACT OF 1934
For the fiscal year ended December 31, [removed: 2017][added: 2018]
Indicate by check mark whether the Registrant (1) has filed all reports required to be filed by Section 13 or 15(d) of the Securities Exchange Act of 1934 during the preceding 12 [removed: months,] [added: months (or for such shorter period that the registrant was required to file such reports),] and (2) has been subject to such filing requirements for the past 90 days.
Indicate by check mark whether the Registrant has submitted electronically [removed: and posted on its corporate Website, if any,] every Interactive Data File required to be submitted [removed: and posted] pursuant to Rule 405 of [removed: Regulations] [added: Regulation] S-T [added: (§232.405 of this chapter)] during the preceding 12 [removed: months.][added: months (or for such shorter period that the registrant was required to submit such files).]
Indicate by check mark if disclosure of delinquent filers pursuant to Item 405 of Regulation S-K [added: (§229.405 of this chapter)] is not contained herein, and will not be contained, to the best of Registrant’s knowledge, in definitive proxy or information statements incorporated by reference in Part III of this Form 10-K or any amendment to this Form 10-K.
Indicate by check mark whether the Registrant is a large accelerated filer, an accelerated filer, a non-accelerated filer, [added: a] smaller reporting company, or an emerging growth company.
See the definitions of “large accelerated filer,” “accelerated filer,” “smaller reporting company,” and “emerging growth company” in Rule 12b-2 of the Exchange [removed: Act.: Large accelerated filer ☑ Accelerated filer ☐ Non-accelerated filer ☐ Smaller reporting company ☐ Emerging growth company ☐][added: Act.]
Indicate by check mark whether the Registrant is a shell company (as defined in Rule 12b-2 of the [removed: Exchange] Act).
State the aggregate market value of the voting stock held by non-affiliates of the Registrant as of June 30, [removed: 2017: $327,898,000,000*][added: 2018: $367,009,000,000*]
Indicate [added: the] number of shares outstanding of each of the Registrant’s classes of common stock:
| February [removed: 13, 2018—Class] [added: 14, 2019—Class] A common stock, $5 par value | | [removed: 748,745] [added: 725,807] shares |
| February [removed: 13, 2018—Class] [added: 14, 2019—Class] B common stock, $0.0033 par value | | [removed: 1,344,332,039] [added: 1,372,751,831] shares |
[removed: |] [added: Portions of the] Proxy Statement for [added: the] Registrant’s Annual Meeting to be held May [removed: 5, 2018 | |] [added: 4, 2019 are incorporated in] Part [removed: III |][added: III.]
| | * | This aggregate value is computed at the last sale price of the common stock [added: as reported] on [added: the New York Stock Exchange on] June 30, [removed: 2017.] [added: 2018.] It does not include the value of Class A common stock [removed: (312,306] [added: (294,660] shares) and Class B common stock [removed: (64,664,309] [added: (57,946,850] shares) held by Directors and Executive Officers of the Registrant and members of their immediate families, some of whom may not constitute “affiliates” for purpose of the Securities Exchange Act of 1934. |
| [removed: Part I] [added: [Part I](#toc678758_1)] | | | | | | [added: [](#toc678758_1)] |
| Item 1. | | [Business [removed: Description](#toc437858_2)] [added: Description](#toc678758_2)] | | | K-1 | |
| Item 1A. | | [Risk [removed: Factors](#toc437858_3)] [added: Factors](#toc678758_3)] | | | K-22 | |
| Item 1B. | | [Unresolved Staff [removed: Comments](#toc437858_4)] [added: Comments](#toc678758_4)] | | | K-25 | |
| Item 2. | | [Description of [removed: Properties](#toc437858_5)] [added: Properties](#toc678758_5)] | | | K-25 | |
| Item 3. | | [Legal [removed: Proceedings](#toc437858_6)] [added: Proceedings](#toc678758_6)] | | | [removed: K-29] [added: K-28] | |
| Item 4. | | [Mine Safety [removed: Disclosures](#toc437858_7)] [added: Disclosures](#toc678758_7)] | | | [removed: K-29] [added: K-28] | |
| [removed: Part II] [added: [Part II](#toc678758_8)] | | | | | | |
| Item 5. | | [Market for Registrant’s Common Equity, Related Security Holder Matters and Issuer Purchases [removed: of Equity Securities](#toc437858_9)] [added: of](#toc678758_9) [Equity Securities](#toc678758_9)] | | | [removed: K-30] [added: K-29] | |
| Item 6. | | [Selected Financial [removed: Data](#toc437858_10)] [added: Data](#toc678758_10)] | | | K-31 | |
| Item 7. | | [Management’s Discussion and Analysis of Financial Condition and Results of [removed: Operations](#toc437858_11)] [added: Operations](#toc678758_11)] | | | K-32 | |
| Item 7A. | | [Quantitative and Qualitative Disclosures About Market [removed: Risk](#toc437858_12)] [added: Risk](#toc678758_12)] | | | [removed: K-60] [added: K-61] | |
| Item 8. | | [Financial Statements and Supplementary [removed: Data](#toc437858_13)] [added: Data](#toc678758_13)] | | | [removed: K-61] [added: K-62] | |
| | | [Consolidated Balance Sheets— December 31, [removed: 2017] [added: 2018] and December 31, [removed: 2016](#toc437858_14)] [added: 2017](#toc678758_14)] | | [added: K-64] | [removed: K-62] | |
| | | [Consolidated Statements of Earnings— Years Ended December 31, [removed: 2017,] [added: 2018,] December 31, [removed: 2016,] [added: 2017,] and December 31, [removed: 2015](#toc437858_15)] [added: 2016](#toc678758_15)] | | [added: K-66] | [removed: K-64] | |
| | | [Consolidated Statements of Comprehensive Income— Years Ended December 31, [removed: 2017,] [added: 2018,] December 31, [removed: 2016,] [added: 2017,] and December 31, [removed: 2015](#toc437858_16)] [added: 2016](#toc678758_16)] | | [added: K-67] | [removed: K-65] | |
| | | [Consolidated Statements of Changes in Shareholders’ Equity— Years Ended December 31, [removed: 2017,] [added: 2018,] December 31, [removed: 2016,] [added: 2017,] and December 31, [removed: 2015](#toc437858_17)] [added: 2016](#toc678758_17)] | | [added: K-67] | [removed: K-65] | |
| | | [Consolidated Statements of Cash Flows— Years Ended December 31, [removed: 2017,] [added: 2018,] December 31, [removed: 2016,] [added: 2017,] and December 31, [removed: 2015](#toc437858_18)] [added: 2016](#toc678758_18)] | | [added: K-68] | [removed: K-66] | |
| | | [Notes to Consolidated Financial [removed: Statements](#toc437858_19)] [added: Statements](#toc678758_19)] | | [added: K-69] | [removed: K-67] | |
| Item 9. | | [Changes in and Disagreements with Accountants on Accounting and Financial [removed: Disclosure](#toc437858_20)] [added: Disclosure](#toc678758_20)] | | | [removed: K-104] [added: K-109] | |
| Item 9A. | | [Controls and [removed: Procedures](#toc437858_21)] [added: Procedures](#toc678758_21)] | | | [removed: K-104] [added: K-109] | |
| Item 9B. | | [Other [removed: Information](#toc437858_22)] [added: Information](#toc678758_22)] | | | [removed: K-104] [added: K-109] | |
| [removed: Part III] [added: [Part III](#toc678758_23)] | | | | | | |
| Item 10. | | [Directors, Executive Officers and Corporate [removed: Governance](#toc437858_24)] [added: Governance](#toc678758_23)] | | | [removed: K-104] [added: K-109] | |
| Item 11. | | [Executive [removed: Compensation](#toc437858_25)] [added: Compensation](#toc678758_23)] | | | [removed: K-104] [added: K-109] | |
| Item 12. | | [Security Ownership of Certain Beneficial Owners and Management and Related Stockholder [removed: Matters](#toc437858_26)] [added: Matters](#toc678758_23)] | | | [removed: K-104] [added: K-109] | |
10-K 1 d678758d10k.htm 10-K
OR
☐ TRANSITION REPORT PURSUANT TO SECTION 13 OR 15(d) OF THE SECURITIES EXCHANGE ACT OF 1934
For the transition period from to
Large accelerated filer ☑ Accelerated filer ☐ Non-accelerated filer ☐ Smaller reporting company ☐ Emerging growth company ☐
| [Exhibit Index](#toc678758_31) | | | | | K-113 | |
| [Signatures](#toc678758_32) | | | | | K-114 | |
10-K 1 d437858d10k.htm 10-K
| | | |
| --- | --- | --- |
| Document | | Incorporated In |
| [Exhibit Index](#toc437858_32) | | | | | K-108 | |
| [Signatures](#toc437858_31) | | | | | K-109 | |
An excerpt. Shown here: 40 of 44 rewritten, all 7 added and all 6 removed. The counts are complete. For every sentence, read Cover and table of contents in the FY2018 filing and the FY2017 filing.
Item 2. Description of Properties
21 rewritten, 24 added, 17 removed, 44 unchanged
BNSF owns or holds under non-cancelable leases exceeding one year approximately 8,000 locomotives and [removed: 71,000] [added: 70,000] freight cars, in addition to maintenance of way and other equipment.
In [removed: 2017,] [added: 2018,] BNSF recorded approximately $2 billion in repairs and maintenance expense.
BHE or its affiliates own or have interests in the following types of electric generating facilities at December 31, [removed: 2017:][added: 2018:]
| Natural gas | | PacifiCorp, MEC, NV Energy and BHE Renewables | | Nevada, Utah, Iowa, Illinois, Washington, Oregon, Texas, New York, and Arizona | | | [removed: 10,919] [added: 10,920] | | | | [removed: 10,640] [added: 10,641] | |
| Coal | | PacifiCorp, MEC and NV Energy | | Wyoming, Iowa, Utah, Arizona, Nevada, Colorado and Montana | | | [removed: 16,232] [added: 16,181] | | | | [removed: 9,158] [added: 9,138] | |
| Wind | | PacifiCorp, MEC and BHE Renewables | | Iowa, Wyoming, [added: Texas,] Nebraska, Washington, California, [removed: Texas, Oregon, Illinois] [added: Illinois, Oregon] and Kansas | | | [removed: 6,533] [added: 7,862] | | | | [removed: 6,524] [added: 7,853] | |
| Solar | | BHE Renewables and NV Energy | | California, Texas, Arizona, Minnesota and Nevada | | | [removed: 1,675] [added: 1,699] | | | | [removed: 1,527] [added: 1,551] | |
| Nuclear | | MEC | | Illinois | | | [removed: 1,820] [added: 1,823] | | | | [removed: 455] [added: 456] | |
As of December 31, [removed: 2017,] [added: 2018,] BHE’s subsidiaries also have electric generating facilities that are under construction in [removed: Iowa, Illinois] [added: Iowa] and [removed: Minnesota] [added: Wyoming] having total Facility Net Capacity and Net Owned Capacity of [removed: 1,902] [added: 2,390] MW.
PacifiCorp, MEC and NV Energy own electric transmission and distribution systems, including approximately 24,800 miles of transmission lines and approximately 1,690 substations, gas distribution facilities, including approximately [removed: 26,800] [added: 27,400] miles of gas mains and service lines, and an estimated [removed: 39] [added: 25] million tons of recoverable coal reserves in mines owned or leased in Wyoming and Colorado.
The electricity distribution network of Northern Powergrid (Northeast) and Northern Powergrid (Yorkshire) includes approximately 17,400 miles of overhead lines, approximately [removed: 42,000] [added: 42,300] miles of underground cables and approximately [removed: 750] [added: 780] major substations.
AltaLink’s electricity transmission system includes approximately [removed: 8,100] [added: 8,200] miles of transmission lines and approximately 310 substations.
| Business | | Country | | [removed: Location | |] [added: Locations] | | [removed: Type of Property/Facility] [added: Property/Facility type] | | [removed: Number of Properties] [added: Owned] | | | | [removed: Owned/ Leased] [added: Leased] | | |
| Insurance: | | | | | | | | | | | | | | | [removed: | |]
| | | [added: Non-U.S.] | | [removed: Various locations] [added: Locations] in [removed: 22] [added: 23] countries | | [removed: | |] Offices | | | [removed: 35] [added: 1] | | | | [removed: Leased] [added: 35] | |
| [added: BHRG] | | [added: U.S.] | | [removed: Various locations] [added: Locations] in [removed: 23] [added: 15] states | | [removed: | |] Offices | | | [removed: 74] [added: 1] | | | | [removed: Leased] [added: 28] | |
| | | [removed: Non-U.S] [added: Non-U.S.] | | Locations in [removed: 7] [added: 8] countries | | [removed: | |] Offices | | | [removed: 10] [added: —] | | | | [removed: Leased] [added: 12] | |
| Service | | U.S. | | [removed: Various locations | |] [added: Locations in 38 states] | | Training facilities/Hangars [removed: Training facilities/Hangars Offices/Distribution Offices/Distribution Production facilities Production facilities] | | | 19 [removed: 130 56 159 26 3] | | | [removed: Owned Leased Owned Leased Owned Leased] | [added: 130 | |]
| | | Non-U.S. | | [removed: Various locations] [added: Locations] in [removed: 33] [added: 34] countries | | [added: Training facilities/Hangars] | | [removed: Offices/Distribution/ Hangars/Training facilities Offices/Distribution/ Hangars/Training facilities] | [added: 18] | | [removed: 19 129] | | [added: 35] | [removed: Owned Leased] |
| McLane Company | | U.S. | | [removed: Various locations | |] [added: Locations in 28 states] | | Distribution centers/Offices [removed: Distribution centers/Offices] | | | [removed: 54 33] [added: 57] | | | [removed: Owned Leased] | [added: 33 | |]
| | | Non-U.S. | | [removed: Germany] Locations in 6 countries | | [added: Offices/Warehouses] | | [removed: Office/Warehouse Retail/Offices] | [added: 1] | | [removed: 1 97] | | [added: 12] | [removed: Owned Leased] |
| | | | | Total | | | 40,154 | | | | 31,286 | |
| | | | | | | | | Number of Properties | | | | | | |
| GEICO | | U.S. | | Locations in 39 states | | Offices and claims centers | | | 12 | | | | 108 | |
| | | Non-U.S. | | Locations in one country | | Offices | | | — | | | | 2 | |
| BH Primary | | U.S. | | Locations in 23 states | | Offices | | | 9 | | | | 79 | |
| | | | | | | | | | | | | | | |
| Manufacturing | | U.S. | | Locations in 48 states | | Manufacturing facility | | | 543 | | | | 167 | |
| | | | | | | Offices/Warehouses | | | 240 | | | | 443 | |
| | | | | | | Retail/Showroom | | | 225 | | | | 226 | |
| | | | | | | Housing communities | | | 280 | | | | — | |
| | | Non-U.S. | | Locations in 65 countries | | Manufacturing facility | | | 241 | | | | 172 | |
| | | | | | | Offices/Warehouses | | | 59 | | | | 540 | |
| | | | | | | Retail/Showroom | | | — | | | | 5 | |
| | | | | | | | | | | | | | | |
| | | | | | | Offices/Distribution | | | 52 | | | | 207 | |
| | | | | | | Production facilities | | | 24 | | | | 3 | |
| | | | | | | Leasing/Showroom/Retail | | | 40 | | | | 91 | |
| | | | | | | Offices/Distribution | | | — | | | | 115 | |
| | | | | | | Leasing/Showroom/Retail | | | — | | | | 1 | |
| | | | | | | | | | | | | | | |
| | | | | | | | | | | | | | | |
| Retailing | | U.S. | | Locations in 42 states | | Offices/Warehouses | | | 32 | | | | 27 | |
| | | | | | | Retail/Showroom | | | 143 | | | | 564 | |
| | | | | | | Retail/Offices | | | — | | | | 87 | |
##### [Table of Contents](#toc)
| | | | | Total | | | 38,848 | | | | 29,951 | |
| | | | | | | | | | | | | | | | | |
| --- | --- | --- | --- | --- | --- | --- | --- | --- | --- | --- | --- | --- | --- | --- | --- | --- |
| GEICO | | U.S. | | Chevy Chase, MD and 5 other states | | | | Offices | | | 12 | | | | Owned | |
| | | | | Various locations in 38 states | | | | Offices | | | 108 | | | | Leased | |
| Berkshire Hathaway Reinsurance Group | | U.S. | | Stamford, CT | | | | Offices | | | 1 | | | | Owned | |
| | | | | Various locations | | | | Offices | | | 31 | | | | Leased | |
| | | Non-U.S. | | Cologne, Germany | | | | Offices | | | 1 | | | | Owned | |
| Berkshire Hathaway Primary Group | | U.S. | | Omaha, NE, Fort Wayne, IN, Princeton, NJ, Wilkes-Barre, PA and Oklahoma City, OK | | | | Offices | | | 7 | | | | Owned | |
| Manufacturing | | U.S. | | Various locations | | | | Manufacturing plants Manufacturing plants Offices/Warehouses Offices/Warehouses Retail/Showroom Retail/Showroom | | | 481 143 223 403 16 49 | | | | Owned Leased Owned Leased Owned Leased | |
| | | Non-U.S. | | Various locations in over 60 countries | | | | Manufacturing plants Manufacturing plants Offices/Warehouses Offices/Warehouses Retail/Showroom | | | 202 132 78 526 5 | | | | Owned Leased Owned Leased Leased | |
| Business | | Country | | Location | | | | Type of Property/Facility | | Number of Properties | | | | Owned/ Leased |
| Retailing | | U.S. | | Various locations | | | | Offices/Warehouses/Plants Offices/Warehouses Retail/Showroom Retail/Showroom | | | 29 27 143 546 | | | Owned Leased Owned Leased |
| Finance & Financial Products | | U.S. | | Various locations | | | | Manufacturing plants Manufacturing plants Offices/Warehouses Offices/Warehouses Leasing/Showroom/Retail Leasing/Showroom/Retail Housing communities | | | 67 6 22 73 234 255 118 | | | Owned Leased Owned Leased Owned Leased Owned |
| | | Non-U.S. | | Various locations in 12 countries | | | | Manufacturing plants Manufacturing plants Offices/Warehouses Offices/Warehouses | | | 22 32 3 25 | | | Owned Leased Owned Leased |
K-28
Item 4. Mine Safety Disclosures
5 rewritten, 1 added, 1 removed, 18 unchanged
| Warren E. Buffett | | [removed: 87] [added: 88] | | Chairman and Chief Executive Officer | | 1970 |
| Charles T. Munger | | [removed: 94] [added: 95] | | Vice Chairman | | 1978 |
| Gregory E. Abel | | [removed: 55] [added: 56] | | Vice Chairman – Non-Insurance Operations | | 2018 |
| Ajit Jain | | [removed: 66] [added: 67] | | Vice Chairman – Insurance Operations | | 2018 |
| Marc D. Hamburg | | [removed: 68] [added: 69] | | Senior Vice-President – Chief Financial Officer | | 1992 |
K-28
K-29
Item 5. Market for Registrant’s Common Equity, Related Security Holder Matters and Issuer Purchases of Equity Securities
6 rewritten, 17 added, 12 removed, 13 unchanged
Berkshire’s Class A and Class B common stock are listed for trading on the New York Stock Exchange, trading symbol: BRK.A and [removed: BRK.B.][added: BRK.B, respectively.]
Berkshire had approximately [removed: 2,100] [added: 2,000] record holders of its Class A common stock and [removed: 19,800] [added: 19,500] record holders of its Class B common stock at February [removed: 12, 2018.][added: 15, 2019.]
Record owners included nominees holding at least [removed: 410,000] [added: 417,000] shares of Class A common stock and [removed: 1,339,000,000] [added: 1,374,000,000] shares of Class B common stock on behalf of beneficial-but-not-of-record owners.
[removed: Berkshire’s Board of Directors has approved] [added: For several years, Berkshire had] a common stock repurchase [removed: program permitting] [added: program, which permitted] Berkshire to repurchase its Class A and Class B shares at prices no higher than a 20% premium over the book value of the shares.
The following chart compares the subsequent value of $100 invested in Berkshire common stock on December 31, [removed: 2012] [added: 2013] with a similar investment in the Standard & Poor’s 500 Stock Index and in the Standard & Poor’s Property – Casualty Insurance Index.
[removed: 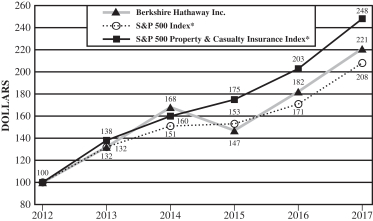][added: 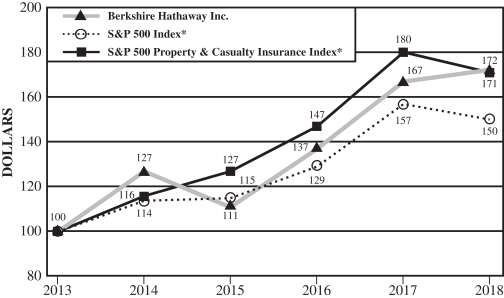]
On July 17, 2018, Berkshire’s Board of Directors authorized an amendment to the program, permitting Berkshire to repurchase shares any time that Warren Buffett, Berkshire’s Chairman of the Board and Chief Executive Officer, and Charles Munger, Vice Chairman of the Board, believe that the repurchase price is below Berkshire’s intrinsic value, conservatively determined.
Repurchases may be in the open market or through privately negotiated transactions.
Information with respect to Berkshire’s Class A and Class B common stock repurchased during the fourth quarter of 2018 follows.
| | | | | | | | | | | | | | | |
| --- | --- | --- | --- | --- | --- | --- | --- | --- | --- | --- | --- | --- | --- | --- |
| Period | | Total number of shares purchased | | | | Average price paid per share | | | | Total number of shares purchased as part of publicly announced program | | | | Maximum number or value of shares that yet may be repurchased under the program |
| October 11 through October 18: | | | | | | | | | | | | | | |
| Class A common stock | | | 202 | | | $ | 310,762.79 | | | | 202 | | | * |
| Class B common stock | | | 589,955 | | | $ | 205.09 | | | | 589,955 | | | * |
| | | | | | | | | | | | | | | |
| December 13 through December 24: | | | | | | | | | | | | | | |
| Class A common stock | | | 790 | | | $ | 295,953.99 | | | | 790 | | | * |
| | _*_ | _The program does not specify a maximum number of shares to be repurchased or obligate Berkshire to repurchase any specific dollar amount or number of Class A or Class B shares and there is no expiration date to the repurchase program. Berkshire will not repurchase its common stock if the repurchases reduce the total value of Berkshire’s consolidated cash, cash equivalents and U.S. Treasury Bills holdings to less than $20 billion._ |
| --- | --- | --- |
K-29
Market for Registrant’s Common Equity, Related Security Holder Matters and Issuer Purchases of Equity Securities _(Continued)_
##### [Table of Contents](#toc)
The following table sets forth the high and low sales prices per share, as reported on the New York Stock Exchange Composite List during the periods indicated:
| | | | | | | | | | | | | | | | | | | | | | | | | | | | | | | | | |
| --- | --- | --- | --- | --- | --- | --- | --- | --- | --- | --- | --- | --- | --- | --- | --- | --- | --- | --- | --- | --- | --- | --- | --- | --- | --- | --- | --- | --- | --- | --- | --- | --- |
| | | 2017 | | | | | | | | | | | | | | | | 2016 | | | | | | | | | | | | | | |
| | | Class A | | | | | | | | Class B | | | | | | | | Class A | | | | | | | | Class B | | | | | | |
| | | High | | | | Low | | | | High | | | | Low | | | | High | | | | Low | | | | High | | | | Low | | |
| First Quarter | | $ | 266,445 | | | $ | 237,983 | | | $ | 177.86 | | | $ | 158.61 | | | $ | 215,130 | | | $ | 186,900 | | | $ | 143.40 | | | $ | 123.55 | |
| Second Quarter | | | 257,944 | | | | 242,180 | | | | 171.95 | | | | 160.93 | | | | 221,985 | | | | 205,074 | | | | 148.03 | | | | 136.65 | |
| Third Quarter | | | 275,945 | | | | 252,254 | | | | 184.00 | | | | 168.00 | | | | 226,490 | | | | 211,500 | | | | 151.05 | | | | 140.95 | |
| Fourth Quarter | | | 301,000 | | | | 270,250 | | | | 200.50 | | | | 180.44 | | | | 250,786 | | | | 213,030 | | | | 167.25 | | | | 141.92 | |
The program allows share repurchases in the open market or through privately negotiated transactions and does not specify a maximum number of shares to be repurchased.
There were no share repurchases under the program in 2017.
Item 6. Selected Financial Data
11 rewritten, 9 added, 9 removed, 20 unchanged
| | | [removed: 2017] [added: 2018] | | | | [removed: 2016] [added: 2017] | | | | [removed: 2015] [added: 2016] | | | | [removed: 2014] [added: 2015] | | | | [removed: 2013] [added: 2014] | | |
| Insurance premiums earned | | $ | [removed: 60,597] [added: 57,418] | | | $ | [removed: 45,881] [added: 60,597] | | | $ | [removed: 41,294] [added: 45,881] | | | $ | [removed: 41,253] [added: 41,294] | | | $ | [removed: 36,684] [added: 41,253] | |
| [removed: Investment] [added: Investment] and derivative [removed: gains/losses] [added: gains/losses] | | [added: $] | [removed: 2,128] [added: (22,455] | [added: )] | | [added: $] | [removed: 8,304] [added: 2,128] | | | [added: $] | [removed: 10,347] [added: 8,304] | | | [added: $] | [removed: 4,081] [added: 10,347] | | | [added: $] | [removed: 6,673] [added: 4,081] | |
| Net earnings attributable to Berkshire Hathaway _(1)_ | | $ | [removed: 44,940] [added: 4,021] | | | $ | [removed: 24,074] [added: 44,940] | | | $ | [removed: 24,083] [added: 24,074] | | | $ | [removed: 19,872] [added: 24,083] | | | $ | [removed: 19,476] [added: 19,872] | |
| Net earnings per share attributable to Berkshire Hathaway shareholders _(2)_ | | $ | [removed: 27,326] [added: 2,446] | | | $ | [removed: 14,645] [added: 27,326] | | | $ | [removed: 14,656] [added: 14,645] | | | $ | [removed: 12,092] [added: 14,656] | | | $ | [removed: 11,850] [added: 12,092] | |
| Total assets | | $ | [removed: 702,095] [added: 707,794] | | | $ | [removed: 620,854] [added: 702,095] | | | $ | [removed: 552,257] [added: 620,854] | | | $ | [removed: 525,867] [added: 552,257] | | | $ | [removed: 484,624] [added: 525,867] | |
| Railroad, utilities and energy | | | [removed: 62,178] [added: 62,515] | | | | [removed: 59,085] [added: 62,178] | | | | [removed: 57,739] [added: 59,085] | | | | [removed: 55,306] [added: 57,739] | | | | [removed: 46,399] [added: 55,306] | |
| Berkshire Hathaway shareholders’ equity [removed: _(3)_] | | | [removed: 348,296] [added: 348,703] | | | | [removed: 282,070] [added: 348,296] | | | | [removed: 254,619] [added: 282,070] | | | | [removed: 239,239] [added: 254,619] | | | | [removed: 220,959] [added: 239,239] | |
| Class A equivalent common shares outstanding, in thousands | | | [removed: 1,645] [added: 1,641] | | | | [removed: 1,644] [added: 1,645] | | | | [removed: 1,643] [added: 1,644] | | | | 1,643 | | | | [removed: 1,644] [added: 1,643] | |
| Berkshire Hathaway shareholders’ equity per outstanding Class A equivalent common share [removed: _(3)_] | | $ | [removed: 211,750] [added: 212,503] | | | $ | [removed: 171,542] [added: 211,750] | | | $ | [removed: 154,935] [added: 171,542] | | | $ | [removed: 145,619] [added: 154,935] | | | $ | [removed: 134,407] [added: 145,619] | |
| | _(1)_ | _Includes after-tax investment and derivative gains/losses of [added: $(17.7) billion in 2018,] $1.4 billion in 2017, $6.5 billion in 2016, $6.7 billion in [removed: 2015,] [added: 2015 and] $3.3 billion in [removed: 2014 and $4.3 billion] [added: 2014. Beginning] in [removed: 2013.] [added: 2018, investment gains/losses include the changes in fair values of equity securities during the period. Previously, investment gains/losses of equity securities were recognized in earnings when securities were sold or were other-than-temporarily impaired.] Net earnings in 2017 includes a one-time net benefit of $29.1 billion attributable to the enactment of the Tax Cuts and Jobs Act of 2017._ |
| Sales and service revenues | | | 133,336 | | | | 130,243 | | | | 123,053 | | | | 110,811 | | | | 100,606 | |
| Leasing revenue | | | 5,732 | | | | 2,552 | | | | 2,553 | | | | 1,546 | | | | 1,463 | |
| Railroad, utilities and energy revenues | | | 43,673 | | | | 40,005 | | | | 37,447 | | | | 39,923 | | | | 40,610 | |
| Interest, dividend and other investment income | | | 7,678 | | | | 6,536 | | | | 6,180 | | | | 6,867 | | | | 6,484 | |
| Total revenues | | $ | 247,837 | | | $ | 239,933 | | | $ | 215,114 | | | $ | 200,441 | | | $ | 190,416 | |
| | | | | | | | | | | | | | | | | | | | | |
| | | | | | | | | | | | | | | | | | | | | |
| Insurance and other | | | 34,975 | | | | 40,409 | | | | 42,559 | | | | 26,550 | | | | 24,584 | |
| | | | | | | | | | | | | | | | | | | | | |
| Sales and service revenues | | | 125,963 | | | | 119,489 | | | | 107,001 | | | | 97,097 | | | | 92,993 | |
| Railroad, utilities and energy revenues | | | 39,943 | | | | 37,542 | | | | 40,004 | | | | 40,690 | | | | 34,757 | |
| Interest, dividend and other investment income | | | 5,144 | | | | 4,725 | | | | 5,357 | | | | 5,052 | | | | 5,196 | |
| Finance and financial products sales and service revenues and interest and dividend income | | | 8,362 | | | | 7,663 | | | | 6,940 | | | | 6,526 | | | | 6,109 | |
| Total revenues | | $ | 242,137 | | | $ | 223,604 | | | $ | 210,943 | | | $ | 194,699 | | | $ | 182,412 | |
| Insurance and other | | | 27,324 | | | | 27,175 | | | | 14,599 | | | | 11,854 | | | | 12,396 | |
| Finance and financial products | | | 13,085 | | | | 15,384 | | | | 11,951 | | | | 12,730 | | | | 13,122 | |
| --- | --- | --- |
| | _(3)_ | _Beginning in 2017, discounting of certain workers’ compensation claim liabilities for financial reporting purposes was discontinued. The effect of the change was immaterial to the Consolidated Statements of Earnings from 2013 through 2016, and such amounts were not restated. The after-tax net discount as of December 31, 2016 of $931 million was charged to retained earnings as of the earliest period presented. Accordingly, shareholders’ equity and shareholders’ equity per Class A equivalent common share for the years 2013-2016 have been restated from the amounts previously reported._ |
Item 8. Financial Statements and Supplementary Data
660 rewritten, 558 added, 373 removed, 1,034 unchanged
To the [added: Shareholders and the] Board of Directors [removed: and Shareholders] of
We have audited the accompanying consolidated balance sheets of Berkshire Hathaway Inc. and subsidiaries (the “Company”) as of December 31, [removed: 2017] [added: 2018] and [removed: 2016,] [added: 2017,] the related consolidated statements of earnings, comprehensive income, changes in shareholders’ equity, and cash [removed: flows] [added: flows,] for each of the three years in the period ended December 31, [removed: 2017,] [added: 2018,] and the related notes (collectively referred to as the “financial statements”).
We also have audited the Company’s internal control over financial reporting as of December 31, [removed: 2017,] [added: 2018,] based on criteria established in _Internal Control — Integrated Framework (2013)_ issued by the Committee of Sponsoring Organizations of the Treadway Commission (COSO).
In our opinion, the financial statements referred to above present fairly, in all material respects, the financial position of the Company as of December 31, [removed: 2017] [added: 2018] and [removed: 2016,] [added: 2017,] and the results of its operations and its cash flows for each of the three years in the period ended December 31, [removed: 2017,] [added: 2018,] in conformity with accounting principles generally accepted in the United States of America.
Also, in our opinion, the Company maintained, in all material respects, effective internal control over financial reporting as of December 31, [removed: 2017,] [added: 2018,] based on criteria established in _Internal Control — Integrated Framework (2013)_ issued by COSO.
| | [added: 2018 | | | |] 2017 | | | | 2016 | | | |
| Cash and cash [removed: equivalents] [added: equivalents*] | | $ | [removed: 25,460] [added: 27,749] | | | $ | [removed: 23,581] [added: 28,673] | |
| Short-term investments in U.S. Treasury Bills | | | [removed: 78,515] [added: 81,506] | | | | [removed: 47,338] [added: 84,371] | |
| Investments in fixed maturity securities | | | [removed: 21,353] [added: 19,898] | | | | [removed: 23,432] [added: 21,353] | |
| [removed: Investments in equity securities] | [removed: | | 164,026 | | |] [added: _(e)_] | [removed: 134,835] | [added: _Investments in equity securities_] |
| [removed: Property, plant and equipment] | [removed: | | 20,104 | | |] [added: _(l)_] | [removed: 19,325] | [added: _Property, plant and equipment_] |
| Other intangible assets | | | [removed: 32,518] [added: 31,499] | | | | [removed: 33,481] [added: 32,518] | |
| Deferred charges under retroactive reinsurance contracts | | | [removed: 15,278] [added: 14,104] | | | | [removed: 8,047] [added: 15,278] | |
| Cash and cash [removed: equivalents] [added: equivalents*] | | | [removed: 2,910] [added: 2,612] | | | | [removed: 3,939] [added: 2,910] | |
| Property, plant and equipment | | | [removed: 128,184] [added: 131,780] | | | | [removed: 123,759] [added: 128,184] | |
| Goodwill | | | [removed: 24,780] [added: 24,702] | | | | [removed: 24,111] [added: 24,780] | |
| Regulatory assets | | | [removed: 2,950] [added: 3,067] | | | | [removed: 4,457] [added: 2,950] | |
| Loans and finance receivables | | | [removed: 13,748] [added: 16,280] | | | | [removed: 13,300] [added: 13,748] | |
| [removed: Property,] [added: Purchases of property,] plant and equipment and [removed: assets] [added: equipment] held for lease | | | [removed: 9,931] [added: (14,537] | [added: )] | | | [removed: 9,689] [added: (11,708] | [added: )] | [added: | | (12,954) | |]
| | | [added: | | | | | | | | | | | |] $ | [added: 707,794 | | | $ |] 702,095 | | | $ | 620,854 | |
| Unpaid losses and loss adjustment expenses | | $ | [removed: 61,122] [added: 68,458] | | | $ | [removed: 53,379] [added: 61,122] | |
| Unpaid losses and loss adjustment expenses under retroactive reinsurance contracts | | | [removed: 42,937] [added: 41,834] | | | | [removed: 24,972] [added: 42,937] | |
| Unearned premiums | | | [removed: 16,040] [added: 18,093] | | | | [removed: 14,245] [added: 16,040] | |
| Life, annuity and health insurance benefits | | | [removed: 17,608] [added: 18,632] | | | | [removed: 15,977] [added: 17,608] | |
| Other policyholder liabilities | | | [removed: 7,654] [added: 7,675] | | | | [removed: 6,714] [added: 7,654] | |
| Accounts payable, accruals and other liabilities | | | [removed: 23,099] [added: 25,776] | | | | [removed: 22,164] [added: 24,569] | |
| [removed: Notes] [added: (17) | Notes] payable and other [removed: borrowings | | | 27,324 | | | | 27,175 |] [added: borrowings] |
| Accounts payable, accruals and other liabilities | | | [removed: 11,334] [added: 11,410] | | | | [removed: 11,434] [added: 11,334] | |
| Regulatory liabilities | | | [removed: 7,511] [added: 7,506] | | | | [removed: 3,121] [added: 7,511] | |
| Notes payable and other borrowings | | | [removed: 62,178] [added: 62,515] | | | | [removed: 59,085] [added: 62,178] | |
| Derivative contract liabilities | | | [removed: 2,172] [added: 2,452] | | | | [removed: 2,890] [added: 2,172] | |
| [removed: Notes] [added: (17) | Notes] payable and other [removed: borrowings | | | 13,085 | | | | 15,384 |] [added: borrowings _(Continued)_] |
| Income taxes, principally deferred | | | [removed: 56,607] [added: 51,375] | | | | [removed: 77,442] [added: 56,607] | |
| Total liabilities | | | [removed: 350,141] [added: 355,294] | | | | [removed: 335,426] [added: 350,141] | |
| Capital in excess of par value | | | [removed: 35,694] [added: 35,707] | | | | [removed: 35,681] [added: 35,694] | |
| Accumulated other comprehensive income | | | [removed: 58,571] [added: (5,015] | [added: )] | | | [removed: 37,298] [added: 58,571] | |
| Retained earnings | | | [removed: 255,786] [added: 321,112] | | | | [removed: 210,846] [added: 255,786] | |
| Treasury stock, at cost | | | [removed: (1,763] [added: (3,109] | ) | | | (1,763 | ) |
| Berkshire Hathaway shareholders’ equity | | | [removed: 348,296] [added: 348,703] | | | | [removed: 282,070] [added: 348,296] | |
| Noncontrolling interests | | | [removed: 3,658] [added: 3,797] | | | | [removed: 3,358] [added: 3,658] | |
Change in Accounting Principle
As discussed in Note 1 to the financial statements, the Company has changed its method of accounting for investments in equity securities (excluding equity method investments) in 2018 due to the adoption of ASU 2016-01 “Financial Instruments – Recognition and Measurement of Financial Assets and Financial Liabilities.”
REPORT OF INDEPENDENT REGISTERED PUBLIC ACCOUNTING FIRM _(Continued)_
February 23, 2019
| | 2018 | | | | 2017 | | | |
| Investments in equity securities | | | 172,757 | | | | 170,540 | |
| Equity method investments | | | 17,325 | | | | 21,024 | |
| Other receivables | | | 31,564 | | | | 29,392 | |
| Inventories | | | 19,069 | | | | 17,366 | |
| Property, plant and equipment | | | 20,628 | | | | 19,868 | |
| Equipment held for lease | | | 14,298 | | | | 10,167 | |
| Goodwill | | | 56,323 | | | | 56,478 | |
| Other | | | 9,307 | | | | 9,391 | |
| | | | 532,307 | | | | 530,167 | |
| Receivables | | | 3,666 | | | | 3,531 | |
| Other | | | 9,660 | | | | 9,573 | |
| | | | 175,487 | | | | 171,928 | |
| | | $ | 707,794 | | | $ | 702,095 | |
| _*_ | _Cash and cash equivalents includes U.S. Treasury Bills with maturities of three months or less when purchased of $3.9 billion at December 31, 2018 and $5.7 billion at December 31, 2017._ |
| | 2018 | | | | 2017 | | | |
| Aircraft repurchase liabilities and unearned lease revenues | | | 4,593 | | | | — | |
| | | | 222,488 | | | | 212,511 | |
| | | | 81,431 | | | | 81,023 | |
| | | $ | 707,794 | | | $ | 702,095 | |
| Sales and service revenues | | | 133,336 | | | | 130,343 | | | | 123,053 | |
| Leasing revenues | | | 5,732 | | | | 2,452 | | | | 2,553 | |
| | | | 204,164 | | | | 199,928 | | | | 177,667 | |
| Freight rail transportation revenues | | | 23,703 | | | | 21,080 | | | | 19,683 | |
| Energy operating revenues | | | 15,555 | | | | 15,155 | | | | 14,621 | |
| Service revenues and other income | | | 4,415 | | | | 3,770 | | | | 3,143 | |
| | | | 43,673 | | | | 40,005 | | | | 37,447 | |
| Total revenues | | | 247,837 | | | | 239,933 | | | | 215,114 | |
| | | | (22,455) | | | | 2,128 | | | | 8,304 | |
| Cost of sales and services | | | 106,083 | | | | 104,343 | | | | 97,867 | |
| Cost of leasing | | | 4,061 | | | | 1,455 | | | | 1,335 | |
| Interest expense | | | 1,035 | | | | 1,132 | | | | 1,099 | |
| | | | 184,815 | | | | 189,949 | | | | 162,024 | |
| Freight rail transportation expenses | | | 16,045 | | | | 14,031 | | | | 13,134 | |
| Utilities and energy cost of sales and other expenses | | | 11,641 | | | | 10,772 | | | | 10,471 | |
| Other expenses | | | 3,895 | | | | 3,231 | | | | 2,589 | |
February 23, 2018
K-61
| Investments in The Kraft Heinz Company (Fair Value: 2017 – $25,306; 2016 – $28,418) | | | 17,635 | | | | 15,345 | |
| Receivables | | | 28,578 | | | | 27,097 | |
| Inventories | | | 16,187 | | | | 15,727 | |
| Goodwill | | | 54,985 | | | | 53,994 | |
| Other | | | 11,158 | | | | 7,126 | |
| | | | 485,797 | | | | 409,328 | |
| Other | | | 15,589 | | | | 13,550 | |
| | | | 174,413 | | | | 169,816 | |
| _Finance and Financial Products:_ | | | | | | | | |
| Cash and cash equivalents | | | 3,213 | | | | 528 | |
| Short-term investments in U.S. Treasury Bills | | | 5,856 | | | | 10,984 | |
| Goodwill | | | 1,493 | | | | 1,381 | |
| Other | | | 7,644 | | | | 5,828 | |
| | | | 41,885 | | | | 41,710 | |
| | | | 195,784 | | | | 164,626 | |
| | | | 81,023 | | | | 73,640 | |
| Accounts payable, accruals and other liabilities | | | 1,470 | | | | 1,444 | |
| | | | 16,727 | | | | 19,718 | |
| Sales and service revenues | | | 125,963 | | | | 119,489 | | | | 107,001 | |
| | | | 192,906 | | | | 175,223 | | | | 163,015 | |
| _Finance and Financial Products:_ | | | | | | | | | | | | |
| Sales and service revenues | | | 6,924 | | | | 6,208 | | | | 5,430 | |
| Interest, dividend and other investment income | | | 1,438 | | | | 1,455 | | | | 1,510 | |
| Investment gains/losses | | | 208 | | | | 2,425 | | | | 10 | |
| | | | 9,288 | | | | 10,839 | | | | 7,924 | |
| Total revenues | | | 242,137 | | | | 223,604 | | | | 210,943 | |
| Cost of sales and services | | | 101,748 | | | | 95,754 | | | | 87,029 | |
| Interest expense | | | 1,740 | | | | 445 | | | | 460 | |
| | | | 183,559 | | | | 156,427 | | | | 140,669 | |
| Cost of sales and operating expenses | | | 28,034 | | | | 26,194 | | | | 27,650 | |
| Cost of sales and services | | | 4,050 | | | | 3,448 | | | | 2,915 | |
| Selling, general and administrative expenses | | | 1,940 | | | | 1,739 | | | | 1,586 | |
| Interest expense | | | 400 | | | | 410 | | | | 402 | |
| | | | 6,390 | | | | 5,597 | | | | 4,903 | |
| Earnings before income taxes and equity in earnings of The Kraft Heinz Company | | | 20,900 | | | | 32,744 | | | | 35,068 | |
| Equity in earnings (loss) of The Kraft Heinz Company | | | 2,938 | | | | 923 | | | | (122 | ) |
| Balance December 31, 2014 | | | $ 35,581 | | | | $42,732 | | | | $ 162,689 | | | | $ (1,763 | ) | | | $ 2,857 | | | | $ 242,096 | |
| Net earnings | | | — | | | | — | | | | 24,083 | | | | — | | | | 331 | | | | 24,414 | |
An excerpt. Shown here: 40 of 660 rewritten, 40 of 558 added and 40 of 373 removed. The counts are complete. For every sentence, read Item 8. Financial Statements and Supplementary Data in the FY2018 filing and the FY2017 filing.
Item 9A. Controls and Procedures
3 rewritten, 0 added, 0 removed, 3 unchanged
The report called for by Item 308(a) of Regulation S-K is incorporated herein by reference to Management’s Report on Internal Control Over Financial Reporting, included on page [removed: K-60] [added: K-61] of this report.
The attestation report called for by Item 308(b) of Regulation S-K is incorporated herein by reference to Report of Independent Registered Public Accounting Firm, included on page [removed: K-61] [added: K-62] of this report.
There has been no change in the Corporation’s internal control over financial reporting during the quarter ended December 31, [removed: 2017] [added: 2018] that has materially affected, or is reasonably likely to materially affect, the Corporation’s internal control over financial reporting.
Item 9B. Other Information
1 rewritten, 1 added, 1 removed, 5 unchanged
Except for the information set forth under the caption “Executive Officers of the Registrant” in Part I hereof, information required by this Part (Items 10, 11, 12, 13 and 14) is incorporated by reference from the Registrant’s definitive proxy statement, filed pursuant to Regulation 14A, for the Annual Meeting of Shareholders of the Registrant to be held on May [removed: 5, 2018,] [added: 4, 2019,] which meeting will involve the election of directors.
K-109
K-104
Item 15. Exhibits and Financial Statement Schedules
102 rewritten, 24 added, 23 removed, 136 unchanged
| [Report of Independent Registered Public Accounting [removed: Firm](#tx437858_1)] [added: Firm](#tx678758_1)] | | | [removed: K-61] [added: K-62] | |
| [Consolidated Balance [removed: Sheets—](#tx437858_2) [December] [added: Sheets— December] 31, [removed: 2017] [added: 2018] and December 31, [removed: 2016](#tx437858_2)] [added: 2017](#tx678758_2)] | | | [removed: K-62] [added: K-64] | |
| [Consolidated Statements of [removed: Earnings—](#tx437858_3) [Years] [added: Earnings— Years] Ended December 31, [removed: 2017,] [added: 2018,] December 31, [removed: 2016,] [added: 2017,] and December 31, [removed: 2015](#tx437858_3)] [added: 2016](#tx678758_3)] | | | [removed: K-64] [added: K-66] | |
| [Consolidated Statements of Comprehensive [removed: Income—](#tx437858_4) [Years] [added: Income— Years] Ended December 31, [removed: 2017,] [added: 2018,] December 31, [removed: 2016,] [added: 2017,] and December 31, [removed: 2015](#tx437858_4)] [added: 2016](#tx678758_4)] | | | [removed: K-65] [added: K-67] | |
| [Consolidated Statements of Changes in Shareholders’ [removed: Equity—](#tx437858_5) [Years] [added: Equity— Years] Ended December 31, [removed: 2017,] [added: 2018,] December 31, [removed: 2016,] [added: 2017,] and December 31, [removed: 2015](#tx437858_5)] [added: 2016](#tx678758_5)] | | | [removed: K-65] [added: K-67] | |
| [Consolidated Statements of Cash [removed: Flows—](#tx437858_6) [Years] [added: Flows— Years] Ended December 31, [removed: 2017,] [added: 2018,] December 31, [removed: 2016,] [added: 2017,] and December 31, [removed: 2015](#tx437858_6)] [added: 2016](#tx678758_6)] | | | [removed: K-66] [added: K-68] | |
| [Notes to Consolidated Financial [removed: Statements](#tx437858_7)] [added: Statements](#tx678758_7)] | | | [removed: K-67] [added: K-69] | |
| [Report of Independent Registered Public Accounting [removed: Firm](#tx437858_8)] [added: Firm](#tx678758_9)] | | | [removed: K-105] [added: K-110] | |
| [Balance Sheets as of December 31, [removed: 2017] [added: 2018] and [removed: 2016,] [added: 2017,] Statements of Earnings and Comprehensive Income and Cash Flows for the years ended December 31, [removed: 2017,] [added: 2018,] December 31, [removed: 2016] [added: 2017] and December 31, [removed: 2015] [added: 2016] and Note to Condensed Financial [removed: Information](#tx437858_9)] [added: Information](#tx678758_11)] | | | [removed: K-106] [added: K-111] | |
See the “Exhibit Index” at page [removed: K-108.][added: K-113.]
We have audited the consolidated financial statements of Berkshire Hathaway Inc. and subsidiaries (the “Company”) as of December 31, [removed: 2017] [added: 2018] and [removed: 2016,] [added: 2017,] and for each of the three years in the period ended December 31, [removed: 2017,] [added: 2018,] and the Company’s internal control over financial reporting as of December 31, [removed: 2017,] [added: 2018,] and have issued our report thereon dated February 23, [removed: 2018;] [added: 2019;] such consolidated financial statements and [removed: reports] [added: report] are included elsewhere in this Form 10-K.
Our responsibility is to express an opinion on the Company’s financial [removed: statements schedules] [added: statement schedule] based on our audits.
In our opinion, such financial statement [removed: schedules,] [added: schedule,] when considered in relation to the financial statements taken as a whole, [removed: present] [added: presents] fairly, in all material respects, the information set forth therein.
| | | [added: 2018 | | | |] 2017 | | | | 2016 | | |
| Cash and cash equivalents | | $ | [removed: 4,039] [added: 3,437] | | | $ | [removed: 3,221] [added: 4,039] | |
| Short-term investments in U.S. Treasury Bills | | | [removed: 13,132] [added: 22,957] | | | | [removed: 8,220] [added: 13,132] | |
| Investments in and advances to/from consolidated subsidiaries | | | [removed: 335,668] [added: 328,898] | | | | [removed: 276,467] [added: 335,668] | |
| [removed: Investments] [added: Investment] in The Kraft Heinz Company | | | [removed: 17,635] [added: 13,813] | | | | [removed: 15,345] [added: 17,635] | |
| Accounts payable, accrued interest and other liabilities | | $ | [removed: 196] [added: 1,507] | | | $ | [removed: 182] [added: 196] | |
| Income taxes, principally deferred | | | [removed: 3,294] [added: 2,104] | | | | [removed: 3,357] [added: 3,294] | |
| Notes payable and other borrowings | | | [removed: 18,767] [added: 16,871] | | | | [removed: 17,703] [added: 18,767] | |
| Berkshire Hathaway shareholders’ equity | | | [removed: 348,296] [added: 348,703] | | | | [removed: 282,070] [added: 348,296] | |
| | | [removed: 2017] [added: 2018] | | | | [removed: 2016] [added: 2017] | | | | [removed: 2015] [added: 2016] | | |
| Dividends | | $ | [removed: 5,367] [added: 9,658] | | | $ | [removed: 9,862] [added: 5,367] | | | $ | [removed: 10,519] [added: 9,862] | |
| Undistributed earnings [added: (losses)] | | | [removed: 37,832] [added: (3,952] | [added: )] | | | [removed: 13,264] [added: 37,832] | | | | [removed: 8,508] [added: 13,264] | |
| | | | [removed: 43,199] [added: 5,706] | | | | [removed: 23,126] [added: 43,199] | | | | [removed: 19,027] [added: 23,126] | |
| Investment [removed: gains/losses] [added: gains (losses)] | | | [removed: (1] [added: (4] | ) | | | [removed: 700] [added: (1] | [added: )] | | | [removed: 16] [added: 700] | |
| Equity in net earnings [added: (losses)] of The Kraft Heinz Company | | | [removed: 2,938] [added: (2,730] | [added: )] | | | [removed: 923] [added: 2,938] | | | | [removed: (122] [added: 923] | [removed: )] |
| Other income | | | [removed: 350] [added: 649] | | | | [removed: 262] [added: 350] | | | | [removed: 963] [added: 262] | |
| | | | [removed: 46,486] [added: 3,621] | | | | [removed: 25,011] [added: 46,486] | | | | [removed: 26,722] [added: 25,011] | |
| General and administrative | | | [removed: 159] [added: 216] | | | | [removed: 80] [added: 159] | | | | [removed: 73] [added: 80] | |
| | | | [removed: 1,546] [added: (400] | [added: )] | | | [removed: 937] [added: 1,546] | | | | [removed: 2,639] [added: 937] | |
| Net earnings attributable to Berkshire Hathaway shareholders | | | [removed: 44,940] [added: 4,021] | | | | [removed: 24,074] [added: 44,940] | | | | [removed: 24,083] [added: 24,074] | |
| Other comprehensive income attributable to Berkshire Hathaway shareholders | | | [removed: 21,273] [added: (2,211] | [added: )] | | | [removed: 3,316] [added: 21,273] | | | | [removed: (8,750] [added: 3,316] | [removed: )] |
| Comprehensive income attributable to Berkshire Hathaway shareholders | | $ | [removed: 66,213] [added: 1,810] | | | $ | [removed: 27,390] [added: 66,213] | | | $ | [removed: 15,333] [added: 27,390] | |
| Net earnings attributable to Berkshire Hathaway shareholders | | $ | [removed: 44,940] [added: 4,021] | | | $ | [removed: 24,074] [added: 44,940] | | | $ | [removed: 24,083] [added: 24,074] | |
| Investment [removed: gains/losses] [added: gains (losses)] | | | [removed: 1] [added: 4] | | | | [removed: (700] [added: 1] | [removed: )] | | | [removed: (6,854)] [added: (700] | [added: )] |
| Undistributed earnings of consolidated subsidiaries | | | [removed: (37,832] [added: 3,952] | [removed: )] | | | [removed: (13,264] [added: (37,832] | ) | | | [removed: (8,508)] [added: (13,264] | [added: )] |
| Income taxes payable | | | [removed: (135] [added: (972] | ) | | | [removed: 629] [added: (135] | [added: )] | | | [removed: 2,227] [added: 629] | |
| Other | | | [removed: (1,234] [added: 3,062] | [removed: )] | | | [removed: (161] [added: (1,234] | ) | | | [removed: 222] [added: (161] | [added: )] |
Opinion on the Financial Statement Schedule
Change in Accounting Principle
As discussed in Note 1 to the financial statements of the Company, the Company has changed its method of accounting for investments in equity securities (excluding equity method investments) in 2018 due to the adoption of ASU 2016-01 “Financial Instruments – Recognition and Measurement of Financial Assets and Financial Liabilities.”
February 23, 2019
K-110
| | | 2018 | | | | 2017 | | |
| Other assets | | | 80 | | | | 79 | |
| | | $ | 369,185 | | | $ | 370,553 | |
| | | | 20,482 | | | | 22,257 | |
| | | $ | 369,185 | | | $ | 370,553 | |
| Interest expense | | | 601 | | | | 522 | | | | 452 | |
| Foreign exchange (gains) losses Euro-denominated senior notes | | | (366 | ) | | | 1,008 | | | | (244 | ) |
| Income tax expense (benefit) | | | (851 | ) | | | (143 | ) | | | 649 | |
K-111
| Acquisition of treasury stock | | | (1,346 | ) | | | — | | | | — | |
Berkshire acquired 50% of the outstanding common stock of Heinz Holding Company in 2013.
Berkshire currently owns 26.7% of the outstanding shares of Kraft Heinz common stock.
Prior to 2018, the Parent Company issued Euro-denominated senior notes and the aggregate par amount outstanding of these borrowings was €6.85 billion as of December 31, 2018 and 2017.
The gains and losses from the periodic remeasurement of the Euro notes due to changes in foreign currency exchange rates are included in earnings.
K-112
| 3(i) | | [Restated Certificate of Incorporation](http://www.sec.gov/Archives/edgar/data/1067983/000119312515070966/d820461dex3i.htm) |
| | | Incorporated by reference to Exhibit 3(ii) to Form 8-K filed on May 4, 2016. |
K-113
K-114
February 23, 2018
K-105
| Investments in fixed maturity and equity securities and other assets | | | 79 | | | | 59 | |
| | | $ | 370,553 | | | $ | 303,312 | |
| | | | 22,257 | | | | 21,242 | |
| Investment holding gain in The Kraft Heinz Company | | | — | | | | — | | | | 6,838 | |
| Interest expense | | | 1,530 | | | | 208 | | | | 302 | |
| Income taxes | | | (143 | ) | | | 649 | | | | 2,264 | |
K-106
| Non-cash dividends from consolidated subsidiaries | | | — | | | | — | | | | (3,938) | |
| Non-cash investments in consolidated subsidiaries | | | — | | | | — | | | | 3,938 | |
In 2013, the Parent Company invested $12.25 billion in H.J. Heinz Holding Corporation (“Heinz Holding”), an entity formed to acquire H.J. Heinz Company, which included common stock and warrants and cumulative compounding preferred stock.
In January 2017, Berkshire issued €1.1 billion in senior notes consisting of €550 million of 0.25% notes due in 2021 and €550 million of 0.625% notes due in 2023, which increased Euro denominated notes to €6.85 billion.
In 2017, the carrying value of Berkshire’s Euro denominated senior notes increased $990 million due to changes in the Euro/U.S. Dollar exchange rates.
This increase produced a corresponding charge to pre-tax earnings of $990 million in 2017.
K-107
| | | |
| 3(i) | | Restated Certificate of Incorporation |
| 3(ii) | | By-Laws |
| 12 | | [Calculation of Ratio of Consolidated Earnings to Consolidated Fixed Charges](https://www.sec.gov/Archives/edgar/data/1067983/000119312518057033/d437858dex12.htm) |
| 18 | | [Letter re change in accounting principle](https://www.sec.gov/Archives/edgar/data/1067983/000119312518057033/d437858dex18.htm) |
K-108
K-109
An excerpt. Shown here: 40 of 102 rewritten, all 24 added and all 23 removed. The counts are complete. For every sentence, read Item 15. Exhibits and Financial Statement Schedules in the FY2018 filing and the FY2017 filing.