 filings.tools
Brown & Brown (BRO) 10-K risk factor changes: FY2016 vs FY2015
The 2016-12-31 10-K against the 2015-12-31 one, compared heading by heading and sentence by sentence. One of these filings carries no fiscal year tag, so its year is the calendar year of the period end.
Item 1A40 rewritten4 added25 removed195 unchanged
All filing items873 rewritten477 added306 removed1,637 unchanged
Summary
counted, not written
- Item 1A headings could not be compared: only 0 carried over between the two years, which usually means one filing was read wrongly, so none is reported as new or removed.
- Sentence by sentence, 477 added, 306 removed, 873 rewritten and 1,637 unchanged across 18 items that differ.
- New this year: Item 16. Form 10-K Summary..
Sentences by item
22 items, with every count and a link to each item that changed
Underlined words on a shaded ground are new in FY2016; struck-through words were in FY2015. Sentences that are wholly new or wholly gone are labelled rather than marked.
Item 1A. Risk Factors.
40 rewritten, 4 added, 25 removed, 195 unchanged
Capacity could also be reduced by insurance companies failing or withdrawing from writing certain coverages that we offer our [removed: clients.][added: customers.]
To the extent that reinsurance becomes less widely available, we may not be able to procure the amount or types of coverage that our customers desire and the coverage we are able to procure [added: for our customers] may be more expensive or limited.
OUR GROWTH STRATEGY [removed: PARTIALLY DEPENDS] [added: DEPENDS, IN PART,] ON THE ACQUISITION OF OTHER INSURANCE INTERMEDIARIES, WHICH MAY NOT BE AVAILABLE ON ACCEPTABLE TERMS IN THE FUTURE AND WHICH, IF CONSUMMATED, MAY NOT BE ADVANTAGEOUS TO US.
Our ability to successfully identify suitable acquisition candidates, complete acquisitions, integrate acquired businesses into our operations, and expand into new markets requires us to implement and [added: continuously] improve our operations and our financial and management information systems.
Acquisitions also involve a number of special risks, such as: diversion of management’s attention; difficulties in the integration of acquired operations and retention of personnel; increase in expenses and working capital requirements, which could reduce our return on invested capital; entry into unfamiliar [removed: markets;] [added: markets or lines of business;] unanticipated problems or legal liabilities; estimation of the acquisition earn-out payables; and tax and accounting issues, some or all of which could have a material adverse effect on the results of our operations, financial condition and cash flows.
BECAUSE OUR BUSINESS IS HIGHLY CONCENTRATED IN [added: ARIZONA,] CALIFORNIA, FLORIDA, GEORGIA, ILLINOIS, INDIANA, KANSAS, KENTUCKY, MASSACHUSETTS, MICHIGAN, NEW JERSEY, NEW YORK, [removed: NORTH CAROLINA,] OREGON, PENNSYLVANIA, TEXAS, VIRGINIA AND WASHINGTON, ADVERSE ECONOMIC CONDITIONS, NATURAL DISASTERS, OR REGULATORY CHANGES IN THESE STATES COULD ADVERSELY AFFECT OUR FINANCIAL CONDITION.
A significant portion of our business is concentrated in [added: Arizona,] California, Florida, Georgia, Illinois, Indiana, Kansas, Kentucky Massachusetts, Michigan, New Jersey, New York, [removed: North Carolina,] Oregon, Pennsylvania, Texas, Virginia and Washington.
For the years ended December 31, [removed: 2015, 2014] [added: 2016, 2015] and [removed: 2013,] [added: 2014,] we derived [removed: $1,468.7] [added: $1,571.9] million or [removed: 88.4%, $1,386.2] [added: 89.0%, $1,465.9] million or [removed: 88.0%] [added: 88.3%] and [removed: $1,182.2] [added: $1,376.5] million or [removed: 86.7%,] [added: 87.4%,] of our revenues, respectively, from our operations located in these states.
[removed: We are susceptible to losses and interruptions caused by hurricanes (particularly in Florida, where our headquarters and several offices are located),] [added: headquarters),] earthquakes (including California, where we maintain a number of offices), power shortages, telecommunications failures, water shortages, floods, fire, extreme weather conditions, geopolitical events such as terrorist acts and other natural or man-made disasters.
For the year ended December 31, [removed: 2015,] [added: 2016,] no insurance company accounted for more than [removed: 7.3%] [added: 6.0%] of our total core commissions.
For the years ended December 31, [removed: 2014] [added: 2015] and [removed: 2013,] [added: 2014,] approximately [removed: 7.0%] [added: 7.3%] and [removed: 8.0%] [added: 7.0%] respectively, of our total core commissions was derived from insurance policies underwritten by one insurance company.
Quarterly and annual fluctuations in revenues based [removed: on] [added: upon] increases and decreases associated with the timing of policy renewals may adversely affect our financial condition, results of operations and cash flows.
These commissions generally have been in the range of 3.0% to 5.0% of our previous year’s total [removed: annual revenues] [added: core commissions and fees] over the last three years.
Override commissions are paid by insurance companies based [removed: on] [added: upon] the volume of business that we place with them and are generally paid over the course of the year.
OUR BUSINESS PRACTICES AND COMPENSATION ARRANGEMENTS ARE SUBJECT TO UNCERTAINTY DUE TO [removed: INVESTIGATIONS BY GOVERNMENTAL AUTHORITIES AND] POTENTIAL [removed: RELATED PRIVATE LITIGATION.][added: CHANGES IN REGULATIONS.]
[removed: As disclosed in prior years, certain] [added: Certain] of our offices are parties to profit-sharing contingent commission agreements with certain insurance companies, including agreements providing for potential payment of revenue-sharing commissions by insurance companies based primarily on the overall profitability of the aggregate business written with those insurance companies and/or additional factors such as retention ratios and the overall volume of business that an office or offices place with those insurance companies.
Various state departments of insurance may also adopt new regulations addressing these [removed: matters.][added: matters which could adversely affect our results of operations.]
We conduct business in [removed: all] [added: each of the fifty] states [added: of the United States of America] and are subject to comprehensive regulation and supervision by government agencies in [removed: the states in which we do business.][added: each of those states.]
The primary purpose of such regulation and supervision is to provide safeguards for policyholders rather than to protect the interests of our [removed: stockholders.][added: shareholders.]
As a result, such regulation and supervision could reduce our profitability or growth by increasing compliance costs, restricting the products or services we may sell, the markets we may enter, the methods by which we may sell our products and services, or the prices we may charge for our services and the form of compensation we may accept from our [removed: clients,] [added: customers,] carriers and third parties.
In response to the requirements of these Acts, the SEC and the New York Stock Exchange have promulgated and [removed: will likely] [added: may] continue to promulgate new rules on a variety of subjects.
These developments have increased (and may increase in the future) our compliance costs, may make it more difficult and more expensive for us to obtain director and officer liability [removed: insurance,] [added: insurance] and may make it more difficult for us to attract and retain qualified members of our Board of Directors or qualified executive officers.
Legislative developments that could adversely affect us include: changes in our business compensation model as a result of regulatory developments (for example, the [removed: 2010] Affordable Care Act); and federal and state governments establishing programs to provide health insurance or, [removed: in certain cases, property insurance in catastrophe-prone areas or other alternative market types of coverage, that compete with, or completely replace, insurance products offered by insurance carriers.]
Also, the failure of an insurer with whom we place business could result in errors and omissions claims against us by our [removed: clients,] [added: customers,] which could adversely affect our results of operations and financial condition.
Such claims, lawsuits and other proceedings could, for example, include claims for damages based [removed: on] [added: upon] allegations that our employees or sub-agents failed to procure coverage, report claims on behalf of customers, provide insurance companies with complete and accurate information relating to the risks being insured or appropriately apply funds that we hold for our customers on a fiduciary basis.
At December 31, [removed: 2015,] [added: 2016,] we [added: believe we] were in compliance with the financial covenants and other limitations contained in each of these agreements.
As of the date of the filing of our Annual Report on Form 10-K for the [removed: 2015] [added: 2016] fiscal year, we have [removed: $2,586.7] [added: $2,675.4] million of goodwill recorded on our Consolidated Balance Sheet.
We completed our most recent evaluation of impairment for goodwill as of November 30, [removed: 2015] [added: 2016] and determined that the fair value of goodwill exceeded the carrying value of such assets.
Additionally, the carrying value of amortizable intangible assets attributable to each business or asset group comprising [removed: Brown & Brown] [added: the Company] is periodically reviewed by management to determine if there are events or changes in circumstances that would indicate that its carrying amount may not be recoverable.
Accordingly, if there are any such circumstances that occur during the year, we assess the carrying value of our amortizable intangible assets by considering the estimated future undiscounted cash flows generated by the corresponding business or asset [added: group.]
Any impairment identified through this assessment may require that the carrying value of related amortizable intangible assets be adjusted; however, no impairments have been recorded for the years ended December 31, [removed: 2015, 2014] [added: 2016, 2015] and [removed: 2013.][added: 2014.]
Also, if general economic conditions are poor, some of our [removed: clients] [added: customers] may cease operations completely or be acquired by other companies, which could have an adverse effect on our results of operations and financial condition.
If these [removed: clients] [added: customers] are affected by poor economic conditions but yet remain in existence, they may face liquidity problems or other financial difficulties which could result in delays or defaults in payments owed to us, which could have a significant adverse impact on our consolidated financial condition and results of operations.
We have not determined, however, [removed: the amount of] [added: if additional] resources and [removed: the] time [removed: that this] [added: for] development and implementation may [removed: require,] [added: be required,] which [added: if required,] may result in short-term, unexpected interruptions or impacts to our business, or may result in a competitive disadvantage in price and/or efficiency, as we develop or implement new technologies.
CERTAIN OF OUR EXISTING [removed: STOCKHOLDERS] [added: SHAREHOLDERS] HAVE SIGNIFICANT CONTROL OF THE COMPANY.
At December 31, [removed: 2015,] [added: 2016,] our executive officers, directors and certain of their family members collectively beneficially owned approximately [removed: 17.3%] [added: 16.0%] of our outstanding common stock, of which J.
Powell Brown, our President and Chief Executive Officer, beneficially owned approximately [removed: 16.2%.][added: 15.1%.]
As a result, our executive officers, directors and certain of their family members have significant influence over (1) the election of our Board of Directors, (2) the approval or disapproval of any other matters requiring [removed: stockholder approval,] [added: shareholder approval] and (3) our affairs and policies.
A control system, no matter how well [removed: conceived] [added: conceived, operated] and [removed: operated,] [added: tested,] can provide only reasonable, not absolute, assurance that the objectives of the control system are met.
The market price of our common stock may be subject to significant fluctuations in response to various factors, including: quarterly fluctuations in our operating results; changes in securities analysts’ estimates of our future earnings; changes in securities analysts’ predictions regarding the short-term and long-term future of our industry; [added: changes to the tax code;] and our loss of significant customers or significant business developments [added: relating to us or our competitors.]
We present these risk factors grouped by macroeconomic factors, market factors, and operational factors and not in any order of potential magnitude of impact.
We are susceptible to losses and interruptions caused by hurricanes (particularly in Florida, where we have 41 offices and our
in certain cases, property insurance in catastrophe-prone areas or other alternative market types of coverage, that compete with, or completely replace, insurance products offered by insurance carriers.
We are currently underway with a multi-year plan to upgrade much of our technology platforms and anticipate investing $30 million to $40 million, which will have an impact on our margins during this period.
INFLATION MAY ADVERSELY AFFECT OUR BUSINESS OPERATIONS IN THE FUTURE.
Given the current macroeconomic environment, it is possible that U.S. government actions, in the form of a monetary stimulus, a fiscal stimulus, or both, to the U.S. economy, could lead to inflationary conditions that would adversely affect our cost base, resulting in an increase in our employee compensation and benefits and our other operating expenses.
This could harm our margins and profitability if we are unable to increase revenues or cut costs enough to offset the effects of inflation on our cost base.
CONSOLIDATION IN THE INDUSTRIES THAT WE SERVE COULD ADVERSELY AFFECT OUR BUSINESS.
Companies that we serve may seek to achieve economies of scale and other synergies by combining with or acquiring other companies.
If two or more of our current customers merge or consolidate and combine their operations, it may decrease the overall amount of work that we perform for these customers.
If one of our current customers merges or consolidates with a company that relies on another provider for its services, we may lose work from that customer or lose the opportunity to gain additional work.
The increased market power of larger companies could also increase pricing and competitive pressures on us.
Likewise, larger companies may establish internal risk management functions lessening the services they seek from us.
Any of these possible results of industry consolidation could adversely affect our business.
The Company has not chosen to discontinue receiving profit-sharing contingent commissions or override commissions.
While we cannot predict the outcome of the governmental inquiries and investigations into the insurance industry’s commission payment practices or the responses by the market and government regulators, any unfavorable resolution of these matters could adversely affect our results of operations.
Further, if such resolution included a material decrease in our profit-sharing contingent commissions and override commissions, it would likely adversely affect our results of operations.
HEALTHCARE REFORM AND INCREASED COSTS OF CURRENT EMPLOYEES’ MEDICAL AND OTHER BENEFITS COULD HAVE A MATERIAL ADVERSE EFFECT ON OUR BUSINESS.
Our profitability is affected by the cost of current employees’ medical and other benefits.
In recent years, we have experienced significant increases in these costs as a result of economic factors beyond our control.
Although we have actively sought to contain increases in these costs, there can be no assurance we will succeed in limiting future cost increases, and continued upward pressure in these costs could reduce our profitability.
In addition, we believe that increased healthcare costs resulting from the 2010 Affordable Care Act could have a material adverse impact on our business, cash flows, financial condition or results of operations.
group.
IF WE RECEIVE OTHER THAN AN UNQUALIFIED OPINION ON THE ADEQUACY OF OUR INTERNAL CONTROL OVER FINANCIAL REPORTING IN FUTURE YEAR-ENDS AS REQUIRED BY SECTION 404 OF SARBANES-OXLEY, INVESTORS COULD LOSE CONFIDENCE IN THE RELIABILITY OF OUR FINANCIAL STATEMENTS, WHICH COULD RESULT IN A DECREASE IN THE VALUE OF OUR SHARES.
As directed by Section 404 of Sarbanes-Oxley, the SEC adopted rules requiring public companies to include an annual report on internal control over financial reporting on Form 10-K that contains an assessment by management of the effectiveness of our internal control over financial reporting.
We continuously conduct a rigorous review of our internal controls over financial reporting in order to assure compliance with the Section 404 requirements.
However, if our independent auditors interpret the Section 404 requirements and the related rules and regulations differently than we do, or if our independent auditors are not satisfied with our internal control over financial reporting or with the level at which it is documented, operated or reviewed, they may issue a report other than an unqualified opinion.
A report other than an unqualified opinion could result in an adverse reaction in the financial markets due to a loss of confidence in the reliability of our financial statements.
relating to us or our competitors.
Item 7. Management’s Discussion and Analysis of Financial Condition and Results of Operations.
239 rewritten, 98 added, 75 removed, 240 unchanged
Insurance companies establish these premium rates based upon many factors, including loss experience, risk [removed: profile,] [added: profile] and reinsurance rates paid by such insurance companies, none of which we control.
We have increased revenues every year from 1993 to [removed: 2015,] [added: 2016,] with the exception of 2009, when our revenues dropped 1.0%.
Our revenues grew from $95.6 million in 1993 to [removed: $1.7] [added: $1.8] billion in [removed: 2015,] [added: 2016,] reflecting a compound annual growth rate of [removed: 13.9%.][added: 13.5%.]
In the same [removed: 22-year] [added: 23-year] period, we increased net income from $8.1 million to [removed: $243.3] [added: $257.5] million in [removed: 2015,] [added: 2016,] a compound annual growth rate of [removed: 16.7%.][added: 16.2%.]
Conversely, [removed: the] increasing costs of litigation settlements and awards [removed: have caused] [added: could cause] some customers to seek higher levels of insurance coverage.
The term [removed: “core organic commissions and fees”] [added: “Organic Revenue”, a non-GAAP measure,] is our core commissions and fees less (i) the core commissions and fees earned for the first twelve months by newly-acquired operations and (ii) divested business (core commissions and fees generated from offices, books of business or niches sold or terminated during the comparable period).
[removed: “Core organic commissions and fees”, a non-GAAP measure, are] [added: “Organic Revenue” is] reported in this manner in order to express the current year’s core commissions and fees on a comparable basis with the prior year’s core commissions and fees.
The resulting net change reflects the aggregate changes attributable to (i) net new and lost accounts, (ii) net changes in our [removed: clients’] [added: customers’] exposure units, [removed: and] (iii) net changes in insurance premium rates or the commission rate paid to us by our carrier [removed: partners.][added: partners; and (iv) the net change in fees paid to us by our customers.]
These commissions are primarily received in the first and second quarters of each year, based [removed: on] [added: upon] the aforementioned considerations for the prior year(s).
Over the last three years, profit-sharing contingent commissions have averaged approximately [removed: 4.0%] [added: 3.6%] of the previous year’s total commissions and fees revenue.
Since GSCs are not subject to the uncertainty of loss ratios, they are accrued throughout the year based [removed: on] [added: upon] actual premiums written.
For the [removed: twelve-month period ending] [added: year ended] December 31, [removed: 2015,] [added: 2016,] we had earned [removed: $10.0] [added: $11.5] million of GSCs, of which [removed: $7.6] [added: $9.2] million remained accrued at December 31, [removed: 2015] [added: 2016] as most of this will be collected in the first quarter of [removed: 2016.][added: 2017.]
For the [removed: twelve\-month periods] [added: years] ended December 31, [added: 2016,] 2015, [removed: 2014,] and [removed: 2013,] [added: 2014,] we earned [removed: $10.0] [added: $11.5] million, [removed: $9.9] [added: $10.0] million and [removed: $8.3] [added: $9.9] million, respectively, from GSCs.
Fee revenues have historically been generated primarily by: (1) our Services Segment, which provides insurance-related services, including third-party claims administration and comprehensive medical utilization management services in both the workers’ compensation and all-lines liability arenas, as well as Medicare Set-aside services, Social Security disability and Medicare benefits advocacy services, and claims adjusting [removed: services,] [added: services;] (2) our National Programs and Wholesale Brokerage Segments, which earn fees primarily for the issuance of insurance policies on behalf of insurance [removed: companies,] [added: companies] and to a lesser extent (3) our Retail Segment in our large-account customer base.
[removed: These] [added: Our] services are provided over a period of time, [added: which is] typically one year.
Fee revenues, on a consolidated basis, as a percentage of our total commissions and fees, represented [removed: 30.6%] [added: 31.3%] in [removed: 2015,] [added: 2016,] 30.6% in [removed: 2014] [added: 2015] and [removed: 26.6%] [added: 30.6%] in [removed: 2013.][added: 2014.]
Additionally, our profit-sharing contingent commissions and GSCs for the year ended December 31, [removed: 2015 decreased] [added: 2016 increased] by [removed: $5.8] [added: $3.7] million over [removed: 2014] [added: 2015] primarily as a result of [removed: increased loss ratios] [added: an increase] in [removed: our National Programs] [added: profit-sharing contingent commissions] and [added: GSCs in the Retail Segment, partially offset by a decrease in profit-sharing contingent commissions in the] Wholesale Brokerage [removed: Segment.][added: Segment as a result of increased loss ratios.]
Other income decreased by [removed: $5.0] [added: $0.2] million primarily as a result of a reduction in the gains on the sale of books of business when compared to [removed: 2014] [added: 2015] and the change in where this activity is presented in the financial statements as described in the results of operations section below.
For the years ended December 31, [removed: 2015] [added: 2016] and [removed: 2014,] [added: 2015,] our consolidated [removed: internal] [added: organic] revenue growth rate was [removed: 2.6%] [added: 3.0%] and [removed: 2.0%] [added: 2.6%] respectively.
Additionally, each of our four segments recorded positive [removed: internal] [added: organic] revenue growth for the year ended December 31, [removed: 2015.][added: 2016.]
In the event that the gradual increases in insurable exposure units that occurred in the past few years continues through [removed: 2016] [added: 2017] and premium rate changes are similar with [removed: 2015,] [added: 2016,] we believe we will continue to see positive quarterly [removed: internal] [added: organic] revenue growth rates in [removed: 2016.][added: 2017.]
Income before income taxes for the [removed: year] [added: years] ended December 31, [removed: 2015] [added: 2016] increased over [removed: 2014] [added: 2015] by [removed: $62.8] [added: $20.9] million, primarily as a result of acquisitions completed in the past twelve months and net new [removed: business, partially offset by the incremental interest expense associated with our inaugural public debt offering completed in 2014 along with incremental investments in revenue producing teammates.][added: business.]
In the discussion and analysis of our results of operations, in addition to reporting financial results in accordance with GAAP, we provide information regarding [removed: core commissions and fees, core organic commissions and fees, and our internal growth rate, which is] the [removed: growth rate of our core organic commissions and fees, and adjusted calculations of core commissions and fees, core organic commissions and fees] [added: following non-GAAP measures: Organic Revenue, Organic Revenue growth,] and [removed: our internal] [added: Organic Revenue] growth [removed: rate] after adjusting for the significant revenue recorded at our [added: former] Colonial Claims operation in the first half of 2013 attributable to Superstorm [removed: Sandy.][added: Sandy (“2014 Total core commissions and fees-adjusted”).]
These measures are not in accordance with, or an alternative to [removed: (including any adjusted internal growth rate)] the GAAP information provided in this Annual Report on Form 10-K.
Tabular reconciliations of this supplemental non-GAAP financial information to our most comparable GAAP information are contained in this Annual Report on Form [removed: 10-K.][added: 10-K under “Results of Operation - Segment Information.”]
From 1993 through the fourth quarter of [removed: 2015,] [added: 2016,] we acquired [removed: 472] [added: 479] insurance intermediary operations, excluding acquired books of business (customer accounts).
We continually evaluate our estimates, which are based [removed: on] [added: upon] historical experience and on assumptions that we believe to be reasonable under the circumstances.
We believe that of our significant accounting and reporting policies, the more critical policies include our accounting for revenue recognition, business combinations and purchase price allocations, intangible asset [removed: impairments] [added: impairments, non-cash stock-based compensation] and reserves for litigation.
Commission revenues are recognized as of the effective date of the insurance policy or the date on which the policy premium is processed into our [removed: systems,] [added: systems and invoiced to the customer,] whichever is later.
[removed: Profit-sharing] contingent commissions are recognized when determinable, which is generally when such commissions are received from insurance companies, or periodically when we receive formal notification of the amount of such payments.
All of our business combinations initiated after June 30, 2001 have been accounted for using the [removed: purchase] [added: acquisition] method.
Non-compete agreements are valued based [removed: on] [added: upon] their duration and any unique features of the particular agreements.
Purchased customer accounts and non-compete agreements are amortized on a straight-line basis over the related estimated lives and contract periods, which range from [removed: 5] [added: 3] to 15 years.
Acquisition purchase prices are typically based [removed: on] [added: upon] a multiple of average annual operating profit earned over a [removed: one-to] [added: one to] three-year period within a minimum and maximum price range.
The fair value of earn-out obligations is based [removed: on] [added: upon] the present value of the expected future payments to be made to the sellers of the acquired businesses in accordance with the provisions contained in the respective purchase agreements.
Amortizable intangible assets are amortized over their useful lives and are subject to an impairment review based [removed: on] [added: upon] an estimate of the undiscounted future cash flows resulting from the use of the assets.
Fair value is estimated based [removed: on] [added: upon] multiples of earnings before interest, income taxes, depreciation, amortization and change in estimated acquisition earn-out payables (“EBITDAC”), or on a discounted cash flow basis.
Any of the following factors, if present, may trigger an impairment review: (i) a significant underperformance relative to historical or projected future operating results; (ii) a significant negative industry or economic [removed: trends;] [added: trend;] and (iii) a significant decline in our market capitalization.
We completed our most recent evaluation of impairment for goodwill as of November 30, [removed: 2015] [added: 2016] and determined that the fair value of goodwill exceeded the carrying value of such assets.
Additionally, there have been no impairments recorded for amortizable intangible assets for the years ended December 31, [removed: 2015, 2014] [added: 2016, 2015] and [removed: 2013.][added: 2014.]
Organic Revenue is reported in the Results of Operations and in the Results of Operations - Segment sections of this form 10-K.
We view each of these non-GAAP measures as important indicators when assessing and evaluating our performance on a consolidated basis and for each of our segments because they allow us to determine a comparable, but non-GAAP, measurement of revenue growth that is associated with the revenue sources that were a part of our business in both the current and prior year and that are expected to continue in the future.
We believe that presenting these non-GAAP measures allows readers of our financial statements to measure, analyze and compare our consolidated growth, and the growth of each of our segments, in a meaningful and consistent manner.
Our industry peers may provide similar supplemental non-GAAP information with respect to one or more of these measures, although they may not use the same or comparable terminology and may not make identical adjustments.
During the year ended December 31, 2016, the Company acquired the assets and assumed certain liabilities of seven insurance intermediaries, all of the stock of one insurance intermediary and three books of business (customer accounts).
Collectively, these acquired business that had annualized revenues of approximately $56 million.
Profit-sharing
As a result of the awarding of these shares, the grantees became eligible to receive payments of dividends and exercise voting privileges after the awarding date.
During the first quarter of 2017, the performance conditions for approximately 169,000 shares of the Company’s common stock granted under the Company’s Stock Incentive Plan were determined by the Compensation Committee to have been satisfied relative to performance-based grants issued in 2012.
These grants had a performance measurement period that concluded on December 31, 2016.
The vesting condition for these grants requires continuous employment for a period of up to ten years from the January 2012 grant date in order for the awarded shares to become fully vested and nonforfeitable.
| Employee compensation and benefits | 925,217 | | | | 8.0 | % | | 856,952 | | | | 5.7 | % | | 811,112 | | |
| Organic revenue growth rate(1) | 3.0 | | % | | | | | 2.6 | | % | | | | | 2.0 | | % |
| Employee compensation and benefits relative to total revenues | 52.4 | | % | | | | | 51.6 | | % | | | | | 51.5 | | % |
| Total assets at December 31 | $ | 5,287,343 | | | | | | $ | 5,004,479 | | | | | | $ | 4,946,560 | |
(1) A non-GAAP measure
The net increase of $3.7 million was mainly driven by an increase in profit-sharing contingent commissions and GSCs in the Retail Segment, partially offset by a decrease in profit-sharing contingent commissions in the Wholesale Brokerage Segment as a result of increased loss ratios.
Investment income increased to $1.5 million in 2016, compared with $1.0 million in 2015 due to additional interest income driven by higher average invested cash balances.
Other income consists primarily of legal settlements and other miscellaneous income for 2016 and 2015.
This underlying employee compensation and benefits expense increase was primarily related to (i) an increase in producer commissions correlated to increased revenue; (ii) increased staff salaries that included severance cost; (iii) increased profit center bonuses due to increased revenue and operating profit; (iv) the increased cost of health insurance; and (v) an increase in non-cash stock-based compensation expense due to forfeiture credits recognized in 2015.
As a percentage of total revenues, other operating expenses represented 14.9% in 2016, 15.1% in 2015, and 14.9% in 2014.
Other operating expenses in 2016 increased $11.8 million, or 4.7%, over 2015, of which $9.5 million was related to acquisitions that had no comparable costs in the same period of 2015.
The other operating expenses for those offices that existed in the same periods in both 2016 and 2015 increased by $2.3 million or 0.9%, which was primarily attributable to increased data processing related to the information technology spend for our multi-year investment program, partially offset by the receipt of certain premium tax refunds by our National Flood Program business.
In 2014 the Company recognized $5.3 million in gains from sales on books of business (customer accounts) reported as Other Income.
The decrease for 2016 is a result of certain intangibles becoming fully amortized or otherwise written off as part of disposed businesses, partially offset with amortization of new intangibles from recently acquired businesses.
The increase for 2015 is a result of the amortization of newly acquired intangibles being greater than the decrease associated with intangibles that became fully amortized or otherwise written off as part of disposed businesses during 2015.
These changes were due primarily to the addition of fixed assets resulting from acquisitions completed in 2015 and 2016, net of assets which became fully depreciated.
The increase in 2016 versus 2015 is due to the rise in the floating interest rate of our Credit Facility term loan, partially offset by the scheduled amortized principal payments on the Credit Facility term loan which has reduced the Company’s average debt balance.
The decrease in the effective tax rate is driven by several permanent tax differences along with the apportionment of taxable income in the states where we operate.
| (in thousands) | 2016 | | | | 2015 | | |
| Total commissions and fees | $ | 1,762,787 | | | $ | 1,656,951 | |
| Less guaranteed supplemental commissions | 11,479 | | | | 10,026 | | |
| Less acquisition revenues | 61,713 | | | | — | | |
| Organic Revenue | $ | 1,635,595 | | | $ | 1,588,549 | |
| Retail(1) | $ | 881,090 | | | $ | 834,197 | | | $ | 46,893 | | | 5.6 | % | | $ | 31,151 | | | $ | 15,742 | | | 1.9 | % |
| National Programs | 430,479 | | | | 411,589 | | | | 18,890 | | | | 4.6 | % | | 1,680 | | | | 17,210 | | | | 4.2 | % |
| Wholesale Brokerage | 229,657 | | | | 200,835 | | | | 28,822 | | | | 14.4 | % | | 20,164 | | | | 8,658 | | | | 4.3 | % |
| Services | 156,082 | | | | 141,928 | | | | 14,154 | | | | 10.0 | % | | 8,718 | | | | 5,436 | | | | 3.8 | % |
| Total core commissions and fees | $ | 1,697,308 | | | $ | 1,588,549 | | | $ | 108,759 | | | 6.8 | % | | $ | 61,713 | | | $ | 47,046 | | | 3.0 | % |
| Less acquisition revenues | 76,632 | | | | — | | |
Non-Cash Stock-Based Compensation
The shares are expected to be awarded during the first quarter of 2016, pursuant to review and certification of the performance measurements against the stated grant targets by the Compensation Committee in accordance with the Stock Incentive Plan.
| Employee compensation and benefits | 841,439 | | | | 6.3 | % | | 791,749 | | | | 15.9 | % | | 683,000 | | |
| Non-cash stock-based compensation | 15,513 | | | | (19.9 | )% | | 19,363 | | | | (14.3 | )% | | 22,603 | | |
| Net internal growth rate – core organic commissions and fees | 2.6 | | % | | | | | 2.0 | | % | | | | | 6.7 | | % |
| Employee compensation and benefits ratio | 50.7 | | % | | | | | 50.2 | | % | | | | | 50.1 | | % |
| Total assets at December 31 | $ | 5,012,739 | | | | | | $ | 4,956,458 | | | | | | $ | 3,649,508 | |
NMF = Not a meaningful figure
The net increase was due primarily to $4.9 million, $1.3 million, and $1.8 million increases in profit-sharing contingent commissions and GSCs in our Retail, National Programs and Wholesale Brokerage Segments, respectively.
Investment income increased to $0.7 million in 2014, compared with $0.6 million in 2013 mainly due to higher average daily invested balances in 2014 than in 2013.
In 2014 and 2013, other income included legal settlements and gains and loss on the sale and disposition of fixed assets as well as gains and losses from the sale on books of business (customer accounts).
The $5.0 million change in 2015 other income from the comparable period in 2014 was primarily due to prior year book of business sales and to a lesser extent, the change to the presentation of this activity in the financial statements.
The employee compensation and benefit increases from these offices were primarily related to increases in staff and management salaries of $13.8 million, new salaried producers of $4.8 million, profit center and other related bonuses of $6.7 million, compensation to our commissioned producers of $0.9 million and health insurance costs of $4.8 million.
These increases were partially offset by net reductions in temporary employees, employer 401(k) plan matching contributions and accrued vacation expense.
This slight increase was driven by continued investment in new teammates.
The Company has an employee stock purchase plan, grants non-vested stock awards, and to a lesser extent grants stock options under other equity-based plans to its employees.
Compensation expense for all share-based awards is recognized in the financial statements based upon the grant-date fair value of those awards.
For 2015, 2014 and 2013, the non-cash stock-based compensation expense incorporated the costs related to each of the Company’s four stock-based plans as explained in Note 11 of the Notes to the Consolidated Financial Statements.
Non-cash stock-based compensation expense decreased $3.9 million, or 19.9% in 2015 over 2014.
The decrease was the result of: (i) older grants attaining the vesting requirements and therefore being fully expensed in prior periods; (ii) some forfeitures driven by certain grants not achieving all vesting requirements; and (iii) underlying participation levels; all of which were partially offset by the additional expense attributable to the new grants issued in 2015.
Non-cash stock-based compensation expense decreased $3.2 million, or 14.3% in 2014 over 2013, primarily as a result of forfeitures due to the non-achievement of certain performance criteria, partially offset by an increase associated with new, non-vested stock awards granted on July 1, 2013 under our Stock Incentive Plan (“SIP”).
Other operating expenses in 2014 increased $39.7 million, or 20.3%, over 2013, of which $39.0 million was related to acquisitions.
Therefore, other operating expenses attributable to offices that existed in the same periods in both 2014 and 2013 (including the new acquisitions that “folded in” to those offices) increased by $0.7 million.
The $0.7 million net increase includes increases of $2.0 million related to increased data processing and software licensing expense, $1.2 million related to increased inspection and consulting fees, $0.8 million related to office rent, and $0.9 million related to increased employee sales meeting costs, offset by decreases of $3.0 million for legal claims and litigation expenses, $1.0 million for insurance expenses, and $0.2 million in other various expense decreases.
The increases were due primarily to the amortization of additional intangible assets as the result of acquisitions completed in those years.
The increased effective tax rate was largely the result of more income in states with a higher average effective state income tax rate, which was primarily New York State.
| Retail(1) | $ | 706,525 | | | $ | 619,057 | | | $ | 87,468 | | | 14.1 | % | | $ | 79,455 | | | $ | 8,013 | | | 1.3 | % |
| National Programs | 280,695 | | | | 240,550 | | | | 40,145 | | | | 16.7 | % | | 7,099 | | | | 33,046 | | | | 13.7 | % |
| Wholesale Brokerage | 177,725 | | | | 152,961 | | | | 24,764 | | | | 16.2 | % | | 4,332 | | | | 20,432 | | | | 13.4 | % |
| Services | 131,032 | | | | 116,247 | | | | 14,785 | | | | 12.7 | % | | 657 | | | | 14,128 | | | | 12.2 | % |
| (in thousands) | 2013 | | | | 2012 | | |
| Total core commissions and fees | $ | 1,295,977 | | | $ | 1,128,815 | |
| Total commissions and fees | $ | 1,355,503 | | | $ | 1,189,081 | |
| Employee compensation and benefits | 445,242 | | | | 7.1 | % | | 415,876 | | | | 13.0 | % | | 368,164 | | |
| Non-cash stock-based compensation | 12,109 | | | | (25.7 | )% | | 16,293 | | | | 58.5 | % | | 10,281 | | |
| Net internal growth rate – core organic commissions and fees | 1.4 | | % | | | | | 2.0 | | % | | | | | 1.3 | | % |
| Employee compensation and benefits ratio | 51.2 | | % | | | | | 50.5 | | % | | | | | 49.9 | | % |
Profit-sharing contingent commissions and GSCs in 2014 increased 20.3%, or $5.0 million, over 2013, to $29.3 million, primarily due to improved loss ratios resulting in increased profitability for insurance companies in 2013.
The Retail Segment’s internal growth rate for core organic commissions and fees revenue was 2.0% for 2014, and was driven by net new customers, increasing insurable exposure units in certain areas of the United States, and was partially offset by continued pressure on property and casualty rates, especially in coastal areas.
This decrease was primarily due to a higher interest charge of $8.8 million corresponding to capital utilized for acquisitions in 2014 and $8.9 million related to the year-on-year changes in the estimated earn-out payable.
An excerpt. Shown here: 40 of 239 rewritten, 40 of 98 added and 40 of 75 removed. The counts are complete. For every sentence, read Item 7. Management’s Discussion and Analysis of Financial Condition and Results of Operations. in the FY2016 filing and the FY2015 filing.
Item 7A. Quantitative and Qualitative Disclosures About Market Risk.
4 rewritten, 0 added, 0 removed, 7 unchanged
The fair values of our invested assets at December 31, [removed: 2015] [added: 2016] and December 31, [removed: 2014,] [added: 2015,] approximated their respective carrying values due to their short-term duration and therefore, such market risk is not considered to be material.
As of December 31, [removed: 2015] [added: 2016] we had [removed: $529.4] [added: $481.3] million of borrowings outstanding under our term loan which bears interest on a floating basis tied to the London Interbank Offered Rate (LIBOR) and therefore subject to changes in the associated interest expense.
We are subject to exchange rate risk primarily in our [removed: U.K based] [added: U.K-based] wholesale brokerage business that has a cost base principally denominated in British pounds and a revenue base in several other currencies, but principally in U.S. dollars.
Based [removed: on] [added: upon] our foreign currency rate exposure as of December 31, [removed: 2015,] [added: 2016,] an immediate 10% hypothetical changes of foreign currency exchange rates would not have a material effect on our Consolidated Financial Statements.
Item 1. Business.
52 rewritten, 21 added, 14 removed, 189 unchanged
[removed: We market] [added: The Company markets] and [removed: sell to our customers] [added: sells] insurance products and services, primarily in the property, casualty and employee benefits areas.
As an agent and broker, we do not assume underwriting risks with the exception of the activity in The Wright Insurance Group, LLC [removed: (“Wright”), which was acquired in May 2014.][added: (“Wright”).]
Within Wright, we operate a write-your-own flood insurance carrier, Wright National Flood Insurance Company [removed: (“WNFIC”), which is a Wright subsidiary.][added: (“WNFIC”).]
The amount of our revenues from commissions and fees is a function [removed: of, among other] [added: of several] factors, [added: including] continued new business production, retention of existing customers, acquisitions and fluctuations in insurance premium rates and “insurable exposure units,” which are units that insurance companies use to measure or express insurance exposed to risk (such as property values, sales and payroll levels) to determine what premium to charge the insured.
As of December 31, [removed: 2015,] [added: 2016,] our activities were conducted in [removed: 236] [added: 237] locations in 41 states as follows, as well as in England, Bermuda, and the Cayman Islands:
| New York | [removed: 18] [added: 19] | | | Michigan | 4 | | [removed: Rhode Island] [added: Tennessee] | 2 |
| New Jersey | [removed: 13] [added: 14] | | | Minnesota | 4 | | Delaware | 1 |
| [removed: Washington] [added: Texas] | [removed: 13] [added: 11] | | | Virginia | 4 | | Maryland | 1 |
| Georgia | [removed: 11] [added: 10] | | | Arkansas | 3 | | Mississippi | 1 |
| Louisiana | [removed: 7] [added: 8] | | | New Mexico | 3 | | Nevada | 1 |
| [removed: Pennsylvania] [added: Oregon] | 7 | | | South Carolina | 3 | | Utah | 1 |
Premium pricing within the property and casualty insurance underwriting (risk-bearing) industry has historically been cyclical in nature, and has varied widely based [removed: on] [added: upon] market conditions with a “hard” market in which premium rates are [removed: stable or] increasing or a “soft” market, characterized by stable or declining premium rates in many lines and geographic areas.
Premium pricing is influenced by many factors including loss experience, interest rates and the availability of capital being deployed into the [added: insurance] market in search of returns.
The following table summarizes (1) the commissions and fees revenue generated by each of our reportable operating segments for [removed: 2015, 2014 and, 2013,] [added: 2016, 2015] and [added: 2014, and] (2) the percentage of our total commissions and fees revenue represented by each segment for each such period:
| (in thousands, except percentages) | [removed: 2015] [added: 2016] | | | | % | | | [removed: 2014] [added: 2015] | | | | % | | | [removed: 2013] [added: 2014] | | | | % | |
| Retail Segment | $ | [removed: 867,762] [added: 916,723] | | | [removed: 52.4] [added: 52.0] | % | | $ | [removed: 823,211] [added: 867,762] | | | [removed: 52.5] [added: 52.4] | % | | $ | [removed: 732,114] [added: 823,211] | | | [removed: 53.9] [added: 52.5] | % |
| National Programs Segment | [removed: 428,473] [added: 447,808] | | | | [removed: 25.9] [added: 25.4] | % | | [removed: 397,326] [added: 428,473] | | | | [removed: 25.3] [added: 25.9] | % | | [removed: 300,262] [added: 397,326] | | | | [removed: 22.2] [added: 25.3] | % |
| Wholesale Brokerage Segment | [removed: 216,638] [added: 242,813] | | | | [removed: 13.1] [added: 13.8] | % | | [removed: 211,512] [added: 216,638] | | | | [removed: 13.5] [added: 13.1] | % | | [removed: 193,291] [added: 211,512] | | | | [removed: 14.3] [added: 13.5] | % |
| Services Segment | [removed: 145,375] [added: 156,082] | | | | 8.8 | % | | [removed: 136,482] [added: 145,375] | | | | [removed: 8.7] [added: 8.8] | % | | [removed: 131,032] [added: 136,482] | | | | [removed: 9.7] [added: 8.7] | % |
| Other | [removed: (1,297] [added: (639] | | ) | | [removed: (0.2] [added: —] | [removed: )%] [added: %] | | [removed: (1,071] [added: (1,297] | | ) | | [removed: —] [added: (0.2] | [removed: %] [added: )%] | | [removed: (1,196] [added: (1,071] | | ) | | [removed: (0.1] [added: —] | [removed: )%] [added: %] |
| Total | $ | [removed: 1,656,951] [added: 1,762,787] | | | 100 | % | | $ | [removed: 1,567,460] [added: 1,656,951] | | | 100 | % | | $ | [removed: 1,355,503] [added: 1,567,460] | | | 100 | % |
These operations generated [removed: $13.4] [added: $14.5] million, [removed: $13.3] [added: $13.4] million and [removed: $12.2] [added: $13.3] million of revenues for the years ended December 31, [removed: 2015, 2014] [added: 2016, 2015] and [removed: 2013,] [added: 2014,] respectively.
Our retail insurance agency business provides a broad range of insurance products and services to commercial, public and quasi-public [removed: entity,] [added: entities,] professional and individual customers.
The categories of insurance we principally sell include: property insurance relating to physical damage to property and resultant interruption of business or extra expense caused by fire, windstorm or other perils; casualty insurance relating to legal liabilities, [added: professional liability including directors and officers,] cyber-liability, workers’ compensation, commercial and private passenger automobile coverages; and fidelity and surety bonds.
During [removed: 2015,] [added: 2016,] commissions and fees from our largest single Retail Segment customer represented [removed: less than four] [added: three] tenths of one percent [removed: (0.4%)] [added: (0.3%)] of the Retail Segment’s total commissions and fees revenue.
As of December 31, [removed: 2015,] [added: 2016,] our National Programs Segment employed [removed: 1,822 people.][added: 1,863 full-time equivalent employees.]
Professional Programs affiliate with professional groups, including but not limited to, dentists, oral surgeons, hygienists, lawyers, [removed: CPA’s,] [added: CPAs,] optometrists, opticians, ophthalmologists, insurance agents, financial advisors, registered representatives, securities broker-dealers, benefit administrators, real estate brokers, real estate title agents and escrow agents.
In addition, Professional Programs encompasses supplementary [removed: insurance related] [added: insurance-related] products to include weddings, events, medical facilities and [removed: cyber liability.][added: cyber-liability.]
| | Professional Risk Specialty Group: Professional Risk Specialty Group (“PRSG”) has been providing Errors & Omissions/Professional Liability/Malpractice Insurance for over 22 years both in a direct retail sales and brokering capacity. PRSG has been an exclusive State Administrator for a Lawyers Professional Liability Program since 1994 in Florida, Louisiana, and Puerto Rico, and has state appointments in [removed: 23] [added: 34] other states. The admitted Lawyers Program focuses on law firms with fewer than 20 attorneys, and the non-admitted program is for firms with 20 or more attorneys and is available for primary or excess coverage. PRSG is also involved in direct sales and brokering for other professionals, such as accountants, architects & engineers, medical malpractice, directors & officers, employment practices liability, title agency E&O and miscellaneous E&O. |
[removed: | |] Automotive Aftermarket: launched in 2012, writes commercial package insurance for non-dealership automotive services such as [removed: auto recyclers, brake shops, equipment dealers,] mechanical repair shops, [added: brake shops, transmissions shops,] oil and lube shops, parts retailers and wholesalers, tire retailers and [removed: wholesalers] [added: wholesalers,] and [removed: transmission mechanics. |][added: auto recyclers.]
| | Personal Property: [removed: provides a variety of coverages] [added: mono-line property coverage] for homeowners and renters in numerous states. |
[removed: | |] Residential Earthquake: specializes in [removed: monoline] [added: mono-line] residential earthquake coverage for California home and condominium owners. [removed: |]
The auto product is written in several states including California, Georgia, Michigan, and [removed: Alabama.][added: Alabama, South Carolina and Tennessee.]
American Specialty Insurance & Risk Services, [removed: Inc.: provides] [added: Inc.:provides] insurance and risk management services for customers in professional sports, motor sports, amateur sports, and the entertainment industry.
[removed: | |] Fabricare: Irving Weber Associates, Inc. (“IWA”) has specialized in this niche since 1946, providing package insurance including workers’ compensation to dry cleaners, linen supply and uniform rental operations. [removed: IWA also offers insurance programs for independent grocery stores and restaurants. |]
[removed: | |] [added: Railroad: The] Railroad Protector [removed: Plan®:] [added: Plan®] (“RRPP®”) provides insurance products for contractors, manufacturers and wholesalers supporting the railroad industry (not the [removed: railroads)] [added: railroads themselves)] in 47 states. [removed: The RRPP insurance coverages include general liability, property, commercial auto, umbrella and inland marine. |]
Public Risk Underwriters of The Northwest, Inc.: doing business as [removed: Canfield & Associates is] [added: Clear Risk Solutions,] a program administrator of insurance trusts offering tailored property and casualty insurance products, risk management consulting, third-party administration and related services designed for cities, counties, municipalities, school boards and non-profit organizations in the State of Washington.
At December 31, [removed: 2015,] [added: 2016,] our Wholesale Brokerage Segment employed [removed: 1,013 people.][added: 1,074 full-time equivalent employees.]
Our Wholesale Brokerage Segment markets and sells excess and surplus commercial insurance products and services to retail insurance agencies (including [removed: our] [added: Brown & Brown] retail offices).
During [removed: 2015,] [added: 2016,] commissions and fees from our largest Wholesale Brokerage Segment customer represented approximately [removed: 0.9%] [added: 1.2%] of the Wholesale Brokerage Segment’s total commissions and fees revenue.
| Florida | 41 | | | Connecticut | 4 | | New Hampshire | 2 |
| California | 25 | | | Indiana | 4 | | Rhode Island | 2 |
| Washington | 12 | | | Oklahoma | 4 | | Kansas | 1 |
| Pennsylvania | 7 | | | Hawaii | 2 | | Vermont | 1 |
| Colorado | 6 | | | Kentucky | 2 | | West Virginia | 1 |
| Illinois | 6 | | | Missouri | 2 | | Wisconsin | 1 |
| Arizona | 4 | | | Montana | 2 | | | |
As of December 31, 2016, our Retail Segment employed 3,981 full-time equivalent employees.
All Risk: is a program writing all risks meaning that any risk that the contract does not specifically omit is automatically covered.
The coverages usually include commercial earthquake, wind, fire and flood.
The All Risk program writes insurance on both a primary and excess, shared and layered programs.
| | Commercial Auto: for vehicles owned by a business (no heavy vehicles or livery operations) in California, Texas and Georgia. |
| | Tribal: provides tailored solutions across multiple lines of business to sovereign Indian nations. |
Manufactured Housing: package policies in all states for manufactured home communities, including mobile home parks, manufactured home dealers and RV parks.
Forestry: logging equipment specialist for mobile equipment typically to the logging industry in Southeast U.S.
Affinity programs: Programs provided for package coverage to booksellers and security alarm installers.
| | Bellingham Underwriters Inc.: was established in 1997 and has primarily focused on the commercial transportation industry and those that are in the business of supporting it. The trucking program is specifically designed to handle all coverages a trucker on the road might need. Other programs include specialty auto, repair services, forest products and commercial ambulance. |
IWA also offers insurance programs for independent grocery stores and restaurants.
| | Sigma Underwriting Managers: is the nationwide wind catastrophic property insurance specialists for commercial and habitational properties and has over 100 years of combined underwriting experience. The commercial nationwide program is designed to write all types of low to medium-hazard properties including adult living facilities, hotels/motels, medical offices, shopping centers, restaurants, warehouses and churches. The Florida habitational property program is a high-valued property program for commercial residential accounts in Florida. |
The insurance coverages include general liability, property, inland marine, commercial auto, and umbrella.
For the purposes of measuring full-time equivalent employees, those working more than 30 hours per week are counted as a full-time equivalent employee and those working less than 30 hours per week are counted as half of a full-time equivalent employee.
| Florida | 41 | | | Oklahoma | 5 | | Missouri | 2 |
| California | 24 | | | Arizona | 4 | | New Hampshire | 2 |
| Texas | 11 | | | Indiana | 3 | | Montana | 1 |
| Colorado | 6 | | | Tennessee | 3 | | Vermont | 1 |
| Illinois | 6 | | | Hawaii | 2 | | West Virginia | 1 |
| Oregon | 6 | | | Kansas | 2 | | Wisconsin | 1 |
| Connecticut | 5 | | | Kentucky | 2 | | | |
As of December 31, 2015, our Retail Segment employed 3,963 people.
| | |
| --- | --- |
| | Commercial: is a program that offers three distinct products to commercial operations, primarily in California: commercial auto, commercial package and general liability. |
| | OnPoint: is an MGA with underwriting programs for tribal nations, manufactured housing, contractors’ equipment and various affinity programs. The largest program is the tribal business, which provides tailored risk management and insurance solutions for U.S. tribal nations. |
| | Colonial Claims provides insurance claims adjusting and related services, including education and training services, throughout the United States. Colonial Claims handles property and casualty insurers’ multi-line and catastrophic claims needs, including auto, earthquake, flood, hail, homeowners and wind claims. Colonial Claims’ adjusters are approved by the National Flood Insurance Program and are certified in each classification of loss, which includes dwelling, mobile home, condominium association, commercial and large losses. The Colonial Claims business was divested in the fourth quarter of 2015. |
employment with us.
An excerpt. Shown here: 40 of 52 rewritten, all 21 added and all 14 removed. The counts are complete. For every sentence, read Item 1. Business. in the FY2016 filing and the FY2015 filing.
Cover and table of contents
36 rewritten, 10 added, 5 removed, 123 unchanged
For the fiscal year ended December 31, [removed: 2015][added: 2016]
| Florida | | [removed: ] [added: ] | | 59-0864469 |
The aggregate market value of the voting common stock held by non-affiliates of the registrant, computed by reference to the price at which the stock was last sold on June 30, [removed: 2015] [added: 2016] (the last business day of the registrant’s most recently completed second fiscal quarter) was [removed: $3,818,857,004.][added: $4,352,838,341.]
The number of shares of the Registrant’s common stock, $0.10 par value, outstanding as of February [removed: 22, 2016] [added: 23, 2017] was [removed: 138,616,818.][added: 139,986,178.]
Portions of Brown & Brown, Inc.’s Proxy Statement for the [removed: 2016] [added: 2017] Annual Meeting of Shareholders are incorporated by reference into Part III of this Report.
| Item 1. | [removed: [Business](#s47a0655e30394155b19f0ba736ac6a3e)] [added: [Business](#s7CB89076037D53AD81989ACA1B4731FD)] | [removed: [4](#s47a0655e30394155b19f0ba736ac6a3e)] [added: [4](#s7CB89076037D53AD81989ACA1B4731FD)] |
| Item 1A. | [Risk [removed: Factors](#s13d5c11c04194a0da86c0b7ddc85e9e9)] [added: Factors](#s4169FAE312405AEF96F86AEF80E75D90)] | [removed: [10](#s13d5c11c04194a0da86c0b7ddc85e9e9)] [added: [11](#s4169FAE312405AEF96F86AEF80E75D90)] |
| Item 1B. | [Unresolved Staff [removed: Comments](#s0099e651503f4cf3aad6a85c6e6d95c6)] [added: Comments](#s9CE1D78F773D573FB993229547A64728)] | [removed: [19](#s0099e651503f4cf3aad6a85c6e6d95c6)] [added: [18](#s9CE1D78F773D573FB993229547A64728)] |
| Item 2. | [removed: [Properties](#s77630d2e46bd41b3a4aab9d5f89a28ac)] [added: [Properties](#sC64D68C775C15054BE614BFA6EBEA92D)] | [removed: [19](#s77630d2e46bd41b3a4aab9d5f89a28ac)] [added: [18](#sC64D68C775C15054BE614BFA6EBEA92D)] |
| Item 3. | [Legal [removed: Proceedings](#sdaefb808eaaf4162a2436c41b241f554)] [added: Proceedings](#sA64A24F38DFF5F6E8F5B614C8C767C06)] | [removed: [19](#sdaefb808eaaf4162a2436c41b241f554)] [added: [18](#sA64A24F38DFF5F6E8F5B614C8C767C06)] |
| Item 4. | [Mine Safety [removed: Disclosures](#s4f592fe3c3fa490fb2d5c60a3bc0a020)] [added: Disclosures](#s929FF5EDFAA95A6BB5EE0DFA0515A551)] | [removed: [19](#s4f592fe3c3fa490fb2d5c60a3bc0a020)] [added: [18](#s929FF5EDFAA95A6BB5EE0DFA0515A551)] |
| Item 5. | [Market for Registrant’s Common Equity, Related Stockholder Matters and Issuer Purchases of Equity [removed: Securities](#s4501b98c0c1b4aa88f02598612f33d95)] [added: Securities](#sA25BB601E9BC5423AE87DD5E89B498B8)] | [removed: [19](#s4501b98c0c1b4aa88f02598612f33d95)] [added: [19](#sA25BB601E9BC5423AE87DD5E89B498B8)] |
| Item 6. | [Selected Financial [removed: Data](#s9fa98a4f68a54137934cfa643e8fb6bd)] [added: Data](#sC967A9CE0BF256CA98830868E210A001)] | [removed: [23](#s9fa98a4f68a54137934cfa643e8fb6bd)] [added: [22](#sC967A9CE0BF256CA98830868E210A001)] |
| Item 7. | [Management’s Discussion and Analysis of Financial Condition and Results of [removed: Operations](#sEAD9E922AE9D5A42AD7D701DF731D734)] [added: Operations](#sC1858678AE475D95B36FF9BCD7D65FBA)] | [removed: [24](#sEAD9E922AE9D5A42AD7D701DF731D734)] [added: [23](#sC1858678AE475D95B36FF9BCD7D65FBA)] |
| Item 7A. | [Quantitative and Qualitative Disclosures About Market [removed: Risk](#sC4FA56E2320451F5B6970964980D5FEA)] [added: Risk](#sD521F75D791153AFB1706CBF7FA07C7F)] | [removed: [41](#sC4FA56E2320451F5B6970964980D5FEA)] [added: [40](#sD521F75D791153AFB1706CBF7FA07C7F)] |
| Item 8. | [Financial Statements and Supplementary [removed: Data](#sD8777191B01C5CD6A32700246FB7E3AB)] [added: Data](#s3A1CAC7E6E125194BFCB426100873485)] | [removed: [42](#sD8777191B01C5CD6A32700246FB7E3AB)] [added: [41](#s3A1CAC7E6E125194BFCB426100873485)] |
| Item 9. | [Changes in and Disagreements With Accountants on Accounting and Financial [removed: Disclosure](#s05e5786096e945d698c499e76e094dd9)] [added: Disclosure](#s0A7F882C0E3E5A5695DD8F92FAB70200)] | [removed: [75](#s05e5786096e945d698c499e76e094dd9)] [added: [75](#s0A7F882C0E3E5A5695DD8F92FAB70200)] |
| Item 9A. | [Controls and [removed: Procedures](#sD2C20CD466EC59DB84E57B2D068BFF8D)] [added: Procedures](#s545A4F95CC0053F4845EEE34DC38F849)] | [removed: [75](#sD2C20CD466EC59DB84E57B2D068BFF8D)] [added: [75](#s545A4F95CC0053F4845EEE34DC38F849)] |
| Item 9B. | [Other [removed: Information](#saee633f0568f4899944d131b363afebb)] [added: Information](#sE055897141DE57DC81F0F87EC092A5CC)] | [removed: [78](#saee633f0568f4899944d131b363afebb)] [added: [78](#sE055897141DE57DC81F0F87EC092A5CC)] |
| [Part [removed: III](#s92802DA857745411832EB13B6536E16D)] [added: III](#sE09EFD8A332853C19EC69712A594027C)] | | |
| Item 10. | [Directors, Executive Officers and Corporate [removed: Governance](#s1A0D7F9C1BEB57FDB9C6882E82CB0811)] [added: Governance](#s849DC94DD9C955D884C42E34DBA51B8C)] | [removed: [78](#s1A0D7F9C1BEB57FDB9C6882E82CB0811)] [added: [78](#s849DC94DD9C955D884C42E34DBA51B8C)] |
| Item 11. | [Executive [removed: Compensation](#s099C3A1CF98F5C8F957F9D98DF13A7CE)] [added: Compensation](#s36C8C1C773BA5370A556E5BE5A75F0FE)] | [removed: [78](#s099C3A1CF98F5C8F957F9D98DF13A7CE)] [added: [79](#s36C8C1C773BA5370A556E5BE5A75F0FE)] |
| Item 12. | [Security Ownership of Certain Beneficial Owners and Management and Related Stockholder [removed: Matters](#sBD5DFF8183A95D29BAF065DF0C357764)] [added: Matters](#sF5FA12DC89CD585DAEC151AC7BF7B4F2)] | [removed: [78](#sBD5DFF8183A95D29BAF065DF0C357764)] [added: [79](#sF5FA12DC89CD585DAEC151AC7BF7B4F2)] |
| Item 13. | [Certain Relationships and Related Transactions, and Director [removed: Independence](#sa2638e9fdc474c0d9af1d18534490121)] [added: Independence](#s047139CBF08D56AEAA4CD38A9F876082)] | [removed: [78](#sa2638e9fdc474c0d9af1d18534490121)] [added: [79](#s047139CBF08D56AEAA4CD38A9F876082)] |
| Item 14. | [Principal Accounting Fees and [removed: Services](#saaaedd914bf64d02bf9085317ec219d7)] [added: Services](#sC0D0A34858F855FF97B21E66B0C3F1C8)] | [removed: [78](#saaaedd914bf64d02bf9085317ec219d7)] [added: [79](#sC0D0A34858F855FF97B21E66B0C3F1C8)] |
| Item 15. | [Exhibits, Financial Statement [removed: Schedules](#sBD003DF1FCC256239434FD97C2502E0C)] [added: Schedules](#sF0311825188858878D0852CAEB61A160)] | [removed: [78](#sBD003DF1FCC256239434FD97C2502E0C)] [added: [79](#sF0311825188858878D0852CAEB61A160)] |
| Exhibit Index | | [removed: [81](#s4C44C016487455E9BCD648079815023C)] [added: [83](#sD3443D87E5B059EBA8B295763FEFC8D3)] |
Although we believe the expectations expressed in the forward-looking statements included in this Form 10-K and the reports, statements, information and announcements incorporated by reference into this report are based [removed: on] [added: upon] reasonable assumptions within the bounds of our knowledge of our business, a number of factors could cause actual results to differ materially from those expressed in any forward-looking statements, whether oral or written, made by us or on our behalf.
| • | The occurrence of adverse economic conditions, an adverse regulatory climate, or a disaster in [added: Arizona,] California, Florida, Georgia, Illinois, Indiana, Kansas, Kentucky, Massachusetts, Michigan, New Jersey, New York, [removed: North Carolina,] Oregon, Pennsylvania, Texas, Virginia and Washington, because a significant portion of business written by us is for customers located in these states; |
| • | Competition from others in [added: or entering into] the insurance agency, wholesale brokerage, insurance programs and [added: related] service business; |
| • | [removed: Exposure units, and premium] [added: Premium] rates set by insurance companies [added: and insurable exposure units,] which have traditionally varied and are difficult to predict; |
| • | Our ability to forecast liquidity needs through at least the end of [removed: 2016;] [added: 2017;] |
| • | Policy [removed: cancellations,] [added: cancellations and renewal terms,] which can be unpredictable; |
| • | Our ability to effectively [removed: apply] [added: utilize] technology [removed: in providing] [added: to provide] improved value for our customers [added: or carrier partners] as well as applying effective internal controls and efficiencies in operations; and |
Assumptions as to any of the foregoing and all statements are not based [removed: on] [added: upon] historical fact, but rather reflect our current expectations concerning future results and events.
Forward-looking statements that we make or that are made by others on our behalf are based [removed: on] [added: upon] a knowledge of our business and the environment in which we operate, but because of the factors listed above, among others, actual results may differ from those in the forward-looking statements.
10-K 1 bro-20161231x10k.htm 10-K
FOR THE FISCAL YEAR ENDED DECEMBER 31, 2016
| [Part I](#s1411946DE8275BD69DE6E315CEF166F2) | | |
| [Part II](#s7F6B35E91AA854259A092D5FD095665E) | | |
| [Part IV](#sDFF17A3165D05DC79E31B32FD5C38F54) | | |
| Item 16. | [Form 10-K Summary](#sc1268936159f42e7a7d09be4a07b07bb) | [82](#sc1268936159f42e7a7d09be4a07b07bb) |
| [Signatures](#sD3443D87E5B059EBA8B295763FEFC8D3) | | [83](#sD3443D87E5B059EBA8B295763FEFC8D3) |
| • | The integration of our operations with those of businesses or assets we have acquired or may acquire in the future and the failure to realize the expected benefits of such integration; |
| | |
| --- | --- |
10-K 1 bro-20151231x10k.htm 10-K
| [Part I](#s7EA6A62EDC08549BB8404E8EEAA96EC4) | | |
| [Part II](#s14a725dd01a04cf882fbfb1eae4a8548) | | |
| [Part IV](#s21d2c84be043442b8d887ca5493adf59) | | |
| [Signatures](#s4C44C016487455E9BCD648079815023C) | | [81](#s4C44C016487455E9BCD648079815023C) |
Item 2. Properties.
2 rewritten, 0 added, 0 removed, 9 unchanged
We lease offices at each of our [removed: 239] [added: 241] locations.
These leases generally contain renewal options and rent escalation clauses based [removed: on] [added: upon] increases in the lessors’ operating expenses and other charges.
Item 5. Market for Registrant’s Common Equity, Related Stockholder Matters and Issuer Purchases of Equity Securities.
22 rewritten, 20 added, 20 removed, 40 unchanged
On February [removed: 22, 2016,] [added: 23, 2017,] there were [removed: 138,616,818] [added: 139,986,178] shares of our common stock outstanding, held by approximately [removed: 1,119] [added: 1,218] shareholders of record.
We intend to continue to pay quarterly dividends, subject to continued capital availability and determination by our Board of Directors that cash dividends continue to be in the best interests of our [removed: stockholders.][added: shareholders.]
[added: Our dividend policy may be affected by, among other items, our] views on potential future capital requirements, including those relating to the creation and expansion of sales distribution channels and investments and acquisitions, legal risks, stock repurchase programs and challenges to our business model.
The following table sets forth information as of December 31, [removed: 2015,] [added: 2016,] with respect to compensation plans under which the Company’s equity securities are authorized for issuance:
| Plan Category | Number of securities to be issued upon exercise of outstanding options, warrants and rights(a)(1) | | | Weighted-average exercise price of outstanding options, warrants and rights(b)(2) | | | | Number of securities remaining available for future issuance under equity compensation plans (excluding securities reflected in column (a))(c)(3) | | [added: |]
| Equity compensation plans approved by shareholders: | | | | | | | | | | [added: |]
| Brown & Brown, Inc. 2000 Incentive Stock Option Plan | [removed: 269,589] [added: 175,000] | | | $ | 18.48 | | | — | | [added: |]
| Brown & Brown, Inc. 2010 Stock Incentive Plan | N/A | | | N/A | | | | [removed: 2,793,832] [added: 3,729,566] | | [added: (4) |]
| Brown & Brown, Inc. 1990 Employee Stock Purchase Plan | N/A | | | N/A | | | | [removed: 5,194,928] [added: 4,680,263] | | [added: |]
| Brown & Brown, Inc. Performance Stock Plan | N/A | | | N/A | | | | — | | [added: |]
| Equity compensation plans not approved by shareholders | — | | | — | | | | — | | [added: |]
| (1) | In addition to the number of securities listed in this column, [removed: 2,724,208] [added: 3,404,569] shares are issuable upon the vesting of restricted stock granted under the Brown & Brown, Inc. Performance Stock Plan and the Brown & Brown, Inc. 2010 Stock Incentive Plan, which represents the maximum number of shares that can vest based [removed: on] [added: upon] the achievement of certain performance criteria. |
We did not sell any unregistered securities during [removed: 2015.][added: 2016.]
On November 11, 2015, the Company entered into [removed: a] another ASR with an investment bank to purchase an aggregate $75 million of the Company’s common stock.
The Company received an initial delivery of 1,985,981 shares of the Company’s common stock with a fair market [added: value of approximately $63.75 million.]
The following table presents information with respect to our purchases of our common stock during the three months ended December 31, [removed: 2015.][added: 2016.]
| Period | | Total Number of Shares [removed: Purchased(1)] [added: Purchased (1)] | | | Average Price Paid per Share | | | | Total Number of Shares Purchased as Part of Publicly Announced Plans or Programs | | | Approximate Dollar Value of Shares that May Yet Be Purchased Under the Plans or Programs | | |
[removed: |] (1) [removed: |] With the exception of [removed: the 1,985,981] [added: 209,618] shares purchased in [removed: November 2015 as part of the initial share delivery of an accelerated share repurchase program,] [added: open market transactions,] all [removed: of the] [added: other] shares reported above are attributable to shares withheld for employees’ payroll [removed: taxes and] withholding taxes pertaining to the vesting of restricted shares awarded under our Performance Stock Plan and Incentive Stock Option Plan. [removed: |]
The following graph is a comparison of five-year cumulative total [removed: stockholder] [added: shareholder] returns for our common stock as compared with the cumulative total [removed: stockholder] [added: shareholder] return for the NYSE Composite Index, and a group of peer insurance broker and agency companies (Aon plc, Arthur J.
The returns of each company have been weighted according to such companies’ respective stock market capitalizations as of December 31, [removed: 2010] [added: 2011] for the purposes of arriving at a peer group average.
The total return calculations are based upon an assumed $100 investment on December 31, [removed: 2010,] [added: 2011,] with all dividends reinvested.
[removed: 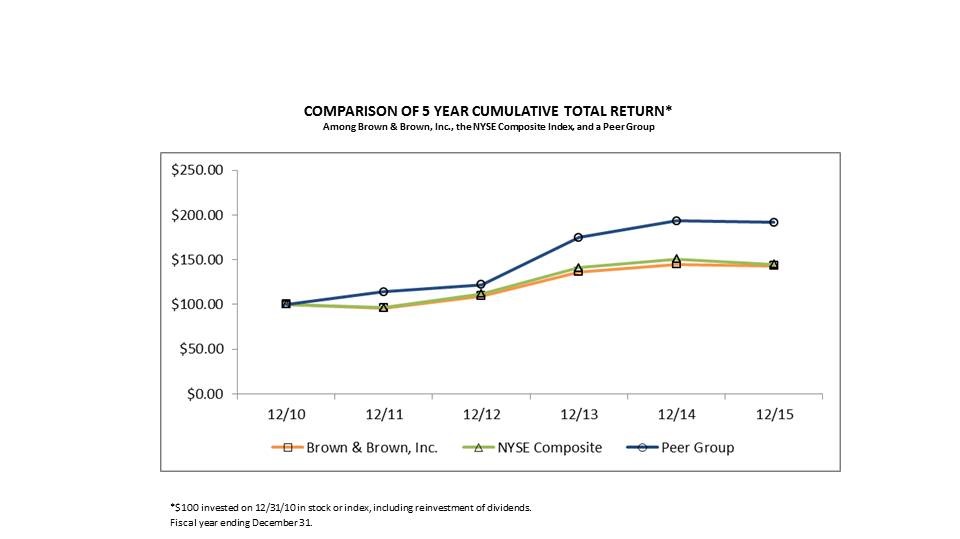][added: 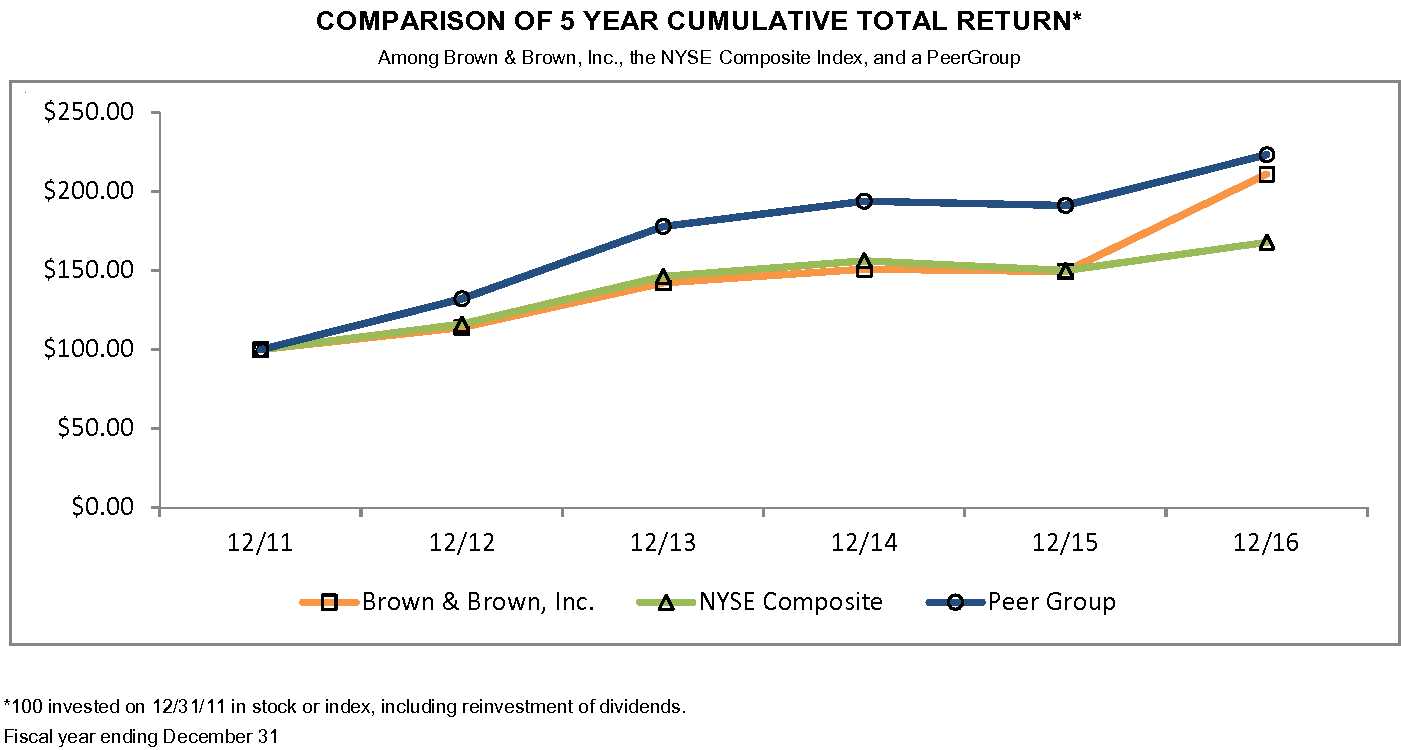]
| 2016 | | | | | |
| First Quarter | $35.91 | | $28.41 | | $0.12 |
| Second Quarter | $37.49 | | $34.23 | | $0.12 |
| Third Quarter | $38.11 | | $35.81 | | $0.12 |
| Fourth Quarter | $45.62 | | $36.05 | | $0.14 |
| | | | | | | | | | | |
| --- | --- | --- | --- | --- | --- | --- | --- | --- | --- | --- |
| | | | | | | | | | | |
| Total | 175,000 | | | $ | 18.48 | | | 8,409,829 | | |
| (4) | The payout for 321,955 shares of our outstanding performance-based restricted stock grants may be increased up to 200% of the target or decreased to zero, subject to the level of performance attained. The amount reflected in the table is calculated assuming the maximum payout for all restricted stock grants. |
Between October 25, 2016 and November 4, 2016, the Company made share repurchases in the open market in total of 209,618 shares at a total cost of $7.7 million.
After completing these open market share repurchases, the Company’s outstanding Board approved share repurchase authorization is $367.3 million.
| October 1, 2016 to October 31, 2016 | | 105 | | | $ | 37.34 | | | — | | | $ | 375,000,000 | |
| November 1, 2016 to November 30, 2016 | | 210,943 | | | 36.57 | | | | 209,618 | | | 367,342,175 | | |
| December 1, 2016 to December 31, 2016 | | 930 | | | 43.62 | | | | — | | | 367,342,175 | | |
| Total | | 211,978 | | | $ | 36.60 | | | 209,618 | | | $ | 367,342,175 | |
| | 12/11 | | | 12/12 | | | 12/13 | | | 12/14 | | | 12/15 | | | 12/16 | |
| Brown & Brown, Inc. | 100.00 | | | 114.03 | | | 142.25 | | | 150.99 | | | 149.35 | | | 211.06 | |
| NYSE Composite | 100.00 | | | 116.03 | | | 146.27 | | | 156.21 | | | 150.15 | | | 167.91 | |
| Peer Group | 100.00 | | | 132.13 | | | 177.92 | | | 193.88 | | | 191.20 | | | 223.36 | |
| 2014 | | | | | |
| First Quarter | $32.88 | | $27.77 | | $0.10 |
| Second Quarter | $31.29 | | $28.27 | | $0.10 |
| Third Quarter | $33.46 | | $30.02 | | $0.10 |
| Fourth Quarter | $33.40 | | $30.96 | | $0.11 |
Our dividend policy may be affected by, among other items, our
| | | | | | | | | | |
| --- | --- | --- | --- | --- | --- | --- | --- | --- | --- |
| Total | 269,589 | | | $ | 18.48 | | | 7,988,760 | |
At the conclusion of this contract the Company had authorization for $50.0 million of share repurchases under the original Board authorization.
value of approximately $63.75 million.
After completion of this third ASR, and as of December 31, 2015, the Company has approval to repurchase up to $375.0 million, in the aggregate, of the Company’s outstanding common stock.
| October 1, 2015 to October 31, 2015 | | 2,711 | | | $ | 30.74 | | | — | | | $ | 450,000,000 | |
| November 1, 2015 to November 30, 2015 | | 2,028,950 | | | 32.10 | | | | 1,985,981 | | | 375,000,000 | | |
| December 1, 2015 to December 31, 2015 | | 3,496 | | | 31.79 | | | | — | | | 375,000,000 | | |
| Total | | 2,035,157 | | | $ | 32.10 | | | 1,985,981 | | | $ | 375,000,000 | |
| | 12/10 | | | 12/11 | | | 12/12 | | | 12/13 | | | 12/14 | | | 12/15 | |
| Brown & Brown, Inc. | 100.00 | | | 95.89 | | | 109.34 | | | 136.39 | | | 144.78 | | | 143.21 | |
| NYSE Composite | 100.00 | | | 96.52 | | | 112.00 | | | 141.19 | | | 150.78 | | | 144.91 | |
| Peer Group | 100.00 | | | 114.10 | | | 122.00 | | | 174.63 | | | 193.51 | | | 191.50 | |
Item 6. Selected Financial Data.
31 rewritten, 6 added, 6 removed, 17 unchanged
| (in thousands, except per share data, number of employees and percentages | | Year Ended December 31 | | | | | | | | | | | | | | | | | | | [added: |]
| | [added: 2016 | | | |] 2015 | | | | 2014 | | | | 2013 | | | | 2012 | | | | [removed: 2011] | [removed: | | |]
| REVENUES | | | | | | | | | | | | | | | | | | | | | [added: |]
| Commissions and fees | | $ | [removed: 1,656,951] [added: 1,762,787] | | | $ | [removed: 1,567,460] [added: 1,656,951] | | | $ | [removed: 1,355,503] [added: 1,567,460] | | | $ | [removed: 1,189,081] [added: 1,355,503] | | | $ | [removed: 1,005,962] [added: 1,189,081] | | [added: |]
| Investment income | | [added: 1,456 | | | |] 1,004 | | | | 747 | | | | 638 | | | | 797 | | | | [removed: 1,267 | | |]
| Other income, net | | [added: 2,386 | | | |] 2,554 | | | | 7,589 | | | | 7,138 | | | | 10,154 | | | | [removed: 6,313 | | |]
| Total revenues | | [added: 1,766,629 | | | |] 1,660,509 | | | | 1,575,796 | | | | 1,363,279 | | | | 1,200,032 | | | | [removed: 1,013,542 | | |]
| EXPENSES | | | | | | | | | | | | | | | | | | | | | [added: |]
| Other operating expenses | | [added: 262,872 | | | |] 251,055 | | | | 235,328 | | | | 195,677 | | | | 174,389 | | | | [removed: 144,079 | | |]
| Loss/(gain) on disposal | | [removed: (619] [added: (1,291] | | ) | | [removed: 47,425] [added: (619] | | [added: )] | | [removed: —] [added: 47,425] | | | | — | | | | — | | | [added: |]
| Amortization | | [added: 86,663 | | | |] 87,421 | | | | 82,941 | | | | 67,932 | | | | 63,573 | | | | [removed: 54,755 | | |]
| Depreciation | | [added: 21,003 | | | |] 20,890 | | | | 20,895 | | | | 17,485 | | | | 15,373 | | | | [removed: 12,392 | | |]
| Interest | | [added: 39,481 | | | |] 39,248 | | | | 28,408 | | | | 16,440 | | | | 16,097 | | | | [removed: 14,132 | | |]
| Change in estimated acquisition earn-out payables | | [added: 9,185 | | | |] 3,003 | | | | 9,938 | | | | 2,533 | | | | 1,418 | | | | [removed: (2,206 | | ) |]
| Total expenses | | [added: 1,343,130 | | | |] 1,257,950 | | | | 1,236,047 | | | | 1,005,670 | | | | 895,221 | | | | [removed: 743,021 | | |]
| Income before income taxes | | [added: 423,499 | | | |] 402,559 | | | | 339,749 | | | | 357,609 | | | | 304,811 | | | | [removed: 270,521 | | |]
| Income taxes | | [added: 166,008 | | | |] 159,241 | | | | 132,853 | | | | 140,497 | | | | 120,766 | | | | [removed: 106,526 | | |]
| Net income | | $ | [removed: 243,318] [added: 257,491] | | | $ | [removed: 206,896] [added: 243,318] | | | $ | [removed: 217,112] [added: 206,896] | | | $ | [removed: 184,045] [added: 217,112] | | | $ | [removed: 163,995] [added: 184,045] | | [added: |]
| EARNINGS PER SHARE INFORMATION | | | | | | | | | | | | | | | | | | | | | [added: |]
| Net income per share - diluted | | $ | [removed: 1.70] [added: 1.82] | | | $ | [removed: 1.41] [added: 1.70] | | | $ | [removed: 1.48] [added: 1.41] | | | $ | [removed: 1.26] [added: 1.48] | | | $ | [removed: 1.13] [added: 1.26] | | [added: |]
| [removed: Weighted average] [added: Weighted-average] number of shares outstanding - diluted | | [added: 137,804 | | | |] 140,112 | | | | 142,891 | | | | 142,624 | | | | 142,010 | | | | [removed: 140,264 | | |]
| Dividends declared per share | | $ | [removed: 0.45] [added: 0.50] | | | $ | [removed: 0.41] [added: 0.45] | | | $ | [removed: 0.37] [added: 0.41] | | | $ | [removed: 0.35] [added: 0.37] | | | $ | [removed: 0.33] [added: 0.35] | | [added: |]
| YEAR-END FINANCIAL POSITION | | | | | | | | | | | | | | | | | | | | | [added: |]
| Total shareholders’ equity | | $ | [removed: 2,149,776] [added: 2,360,211] | | | $ | [removed: 2,113,745] [added: 2,149,776] | | | $ | [removed: 2,007,141] [added: 2,113,745] | | | $ | [removed: 1,807,333] [added: 2,007,141] | | | $ | [removed: 1,643,963] [added: 1,807,333] | | [added: |]
| Total shares outstanding at [removed: year-end] [added: year end] | | [added: 140,104 | | | |] 138,985 | | | | 143,486 | | | | 145,419 | | | | 143,878 | | | | [removed: 143,352 | | |]
| OTHER INFORMATION | | | | | | | | | | | | | | | | | | | | | [added: |]
| Number of full-time equivalent employees at [removed: year-end] [added: year end] | | [added: 8,297 | | | |] 7,807 | | | | 7,591 | | | | 6,992 | | | | 6,438 | | | | [removed: 5,557 | | |]
| Total revenues per average number of employees(2) | | $ | [added: 219,403 | | | $ |] 215,679 | | | $ | 216,114 | | | $ | 203,020 | | | $ | 191,729 | | (3) | [removed: $ | 186,949 | |]
| Stock price at [removed: year-end] [added: year end] | | $ | [removed: 32.10] [added: 44.86] | | | $ | [removed: 32.91] [added: 32.10] | | | $ | [removed: 31.39] [added: 32.91] | | | $ | [removed: 25.46] [added: 31.39] | | | $ | [removed: 22.63] [added: 25.46] | | [added: |]
| Stock price earnings multiple at year-end(4) | | [added: 24.6 | | | |] 18.9 | | | | 23.3 | | | | 21.2 | | | | 20.2 | | | | [removed: 20.0 | | |]
| Return on beginning shareholders’ equity(5) | | 12 | | % | | [removed: 10] [added: 12] | | % | | [removed: 12] [added: 10] | | % | | [removed: 11] [added: 12] | | % | | 11 | | % | [added: |]
| | | | | | | | | | | | | | | | | | | | | | |
| --- | --- | --- | --- | --- | --- | --- | --- | --- | --- | --- | --- | --- | --- | --- | --- | --- | --- | --- | --- | --- | --- |
| | | | | | | | | | | | | | | | | | | | | | |
| Employee compensation and benefits | | 925,217 | | | | 856,952 | | | | 811,112 | | | | 705,603 | | | | 624,371 | | | |
| Total assets | | $ | 5,287,343 | | | $ | 5,004,479 | | | $ | 4,946,560 | | | $ | 3,648,679 | | | $ | 3,127,194 | | |
| Long-term debt(1) | | $ | 1,018,372 | | | $ | 1,071,618 | | | $ | 1,142,948 | | | $ | 379,171 | | | $ | 449,136 | | |
| | | | | | | | | | | | | | | | | | | | | |
| --- | --- | --- | --- | --- | --- | --- | --- | --- | --- | --- | --- | --- | --- | --- | --- | --- | --- | --- | --- | --- |
| Employee compensation and benefits | | 841,439 | | | | 791,749 | | | | 683,000 | | | | 608,506 | | | | 508,675 | | |
| Non-cash stock-based compensation | | 15,513 | | | | 19,363 | | | | 22,603 | | | | 15,865 | | | | 11,194 | | |
| Total assets | | $ | 5,012,739 | | | $ | 4,956,458 | | | $ | 3,649,508 | | | $ | 3,128,058 | | | $ | 2,607,011 | |
| Long-term debt(1) | | $ | 1,079,878 | | | $ | 1,152,846 | | | $ | 380,000 | | | $ | 450,000 | | | $ | 250,033 | |
Item 8. Financial Statements and Supplementary Data.
424 rewritten, 187 added, 128 removed, 664 unchanged
| Consolidated Statements of Income for the years ended December 31, [removed: 2015, 2014] [added: 2016, 2015] and [removed: 2013] [added: 2014] | [removed: [42](#s41C4BB692BCC5E218E70F0BBE8D057F9)] [added: [42](#sFB8D62EE73CC5DABBCFA7FF1F4E2D7C0)] |
| Consolidated Balance Sheets as of December 31, [removed: 2015] [added: 2016] and [removed: 2014] [added: 2015] | [removed: [44](#s8569628FF29C5909A5B79428164E9B2B)] [added: [43](#s22C00237A74F53749DB9E47CDD8FD66D)] |
| Consolidated Statements of Shareholders’ Equity for the years ended December 31, [removed: 2015, 2014] [added: 2016, 2015] and [removed: 2013] [added: 2014] | [removed: [45](#s297cabb04d1a439cb1e4addb3a4a093a)] [added: [44](#s5BC45955230450E38D20F40587856C46)] |
| Consolidated Statements of Cash Flows for the years ended December 31, [removed: 2015, 2014] [added: 2016, 2015] and [removed: 2013] [added: 2014] | [removed: [45](#sB024AE70EE575FF2BA846628D6674124)] [added: [45](#sE753870871EE5DF791E73B0C6FFC4CCA)] |
| Notes to Consolidated Financial Statements for the years ended December 31, [removed: 2015, 2014] [added: 2016, 2015] and [removed: 2013] [added: 2014] | [removed: [47](#sD41E7B41E31A58DE880456D97486C62A)] [added: [46](#s10D6B76A29EC55ACB6875EF5A09E6CD1)] |
| Note 1: Summary of Significant Accounting Policies | [removed: [47](#s52C050BA90505785A06A3D9C571EA88D)] [added: [46](#sB88F81A9CBC65CA08D5ED4E12EFDB440)] |
| Note 2: Business Combinations | [removed: [51](#sA1AB162B87B252149812D1803642ECD9)] [added: [50](#s1019EA25351550D6AC106D5B9AA8F309)] |
| Note 3: Goodwill | [removed: [57](#s04D627C6F5365898B8A161B8426CD9E0)] [added: [56](#sF950CA717F2F5526887A78DDC90D3B91)] |
| Note 4: Amortizable Intangible Assets | [removed: [57](#s6E0FEC2141745431A946EF4D3657905F)] [added: [57](#s832E8FB776215B4386B148246B1BC6F3)] |
| Note 5: Investments | [removed: [58](#sAA500002C86E5ECFAA0364E4C91A9A71)] [added: [57](#s2E4A91E62890599AA9660F42F909D82F)] |
| Note 6: Fixed Assets | [removed: [59](#s3FE64AAF88F75B6DB2BC63411818D31D)] [added: [59](#s0FA08A009C8D505487D41796A95B6146)] |
| Note 7: Accrued Expenses and Other Liabilities | [removed: [60](#se99b419d336747ff8d0f625270c0bfa4)] [added: [59](#s080F9F7B32A95DBEAB37EB22316864FF)] |
| Note 8: Long-Term Debt | [removed: [61](#sA1138C643E575A7B94E15143AAC3DDE1)] [added: [60](#s14904F92B22559EDA136FBA2F87646A4)] |
| Note 9: Income Taxes | [removed: [62](#s567da5c1312746b9b3bdd5cf6feb38e0)] [added: [61](#sACE02673BE8C5F69A7899AC703A8F2F4)] |
| Note 10: Employee Savings Plan | [removed: [64](#sbbe4cc6aafd64bad90874668affd0465)] [added: [63](#s646F13DDEAE853D298E5B8AB24AE4518)] |
| Note 11: Stock-Based Compensation | [removed: [64](#s52816dbea7724ab6850262e7a9d4a240)] [added: [63](#sC3C17C96E4FB586E820DACA80B072AF4)] |
| Note 12: Supplemental Disclosures of Cash Flow Information | [removed: [68](#s36CB759680985B76A60AF65F89B08501)] [added: [68](#sD4C2A54FF0445F14964ADF6C7A6D5246)] |
| Note 13: Commitments and Contingencies | [removed: [69](#sE9EB28E310715824A061B9035113B8D0)] [added: [69](#s0B807F26170E57CE9DF95076B2349D95)] |
| Note 14: Quarterly Operating Results (Unaudited) | [removed: [70](#sf65eaf84b1784bf9893ac121600b137d)] [added: [70](#s1C1A8199D2315B52B7AC4D945B2ADFE9)] |
| Note 15: Segment Information | [removed: [70](#s352F935DFE255340977F92467F3FD1AD)] [added: [70](#s0D86783912B5574EA2794ED558C58089)] |
| [removed: Note 16:] Losses and [removed: Loss Adjustment Reserve] [added: loss adjustment reserve] | [removed: [71](#s312DE56B312459F99C23A6E2CB594BF4)] [added: 78,083] | [added: | | | 31,968 | | |]
| Note 17: Statutory Financial Information | [removed: [72](#sD2D1191FD1F15B598B9C2E36C0416D6F)] [added: [72](#sB33C250B8B4B5C20A09ED31C06F53ACE)] |
| Note 18: Subsidiary Dividend Restrictions | [removed: [72](#s7A4E78E6E6305D3C9994F46052A3FD03)] [added: [72](#sB6DF74F2221E571CB8E189F94C18AC27)] |
| Note 19: Shareholders’ Equity | [removed: [72](#s9F91137E1A315207B0E1A56EACCE47D6)] [added: [72](#s10869F199AB15706B08F670B1DD897B6)] |
| Report of Independent Registered Public Accounting Firm | [removed: [74](#sff72569228ca47b0ac32e829062a5260)] [added: [74](#s6829875346A157178141F4FA71ADAB3B)] |
| | [removed: 2015] [added: 2016] | | | | [removed: 2014] [added: 2015] | | | | [removed: 2013] [added: 2014] | | |
| Commissions and fees | $ | [removed: 1,656,951] [added: 1,762,787] | | | $ | [removed: 1,567,460] [added: 1,656,951] | | | $ | [removed: 1,355,503] [added: 1,567,460] | |
| Investment income | [removed: 1,004] [added: 1,456] | | | | [removed: 747] [added: 1,004] | | | | [removed: 638] [added: 747] | | |
| Other income, net | [removed: 2,554] [added: 2,386] | | | | [removed: 7,589] [added: 2,554] | | | | [removed: 7,138] [added: 7,589] | | |
| Total revenues | [removed: 1,660,509] [added: 1,766,629] | | | | [removed: 1,575,796] [added: 1,660,509] | | | | [removed: 1,363,279] [added: 1,575,796] | | |
| Non-cash stock-based compensation | [removed: 15,513] [added: 16,052] | | | | [removed: 19,363] [added: 15,513] | | | | [removed: 22,603] [added: 19,363] | | |
| Other operating expenses | [removed: 251,055] [added: 262,872] | | | | [removed: 235,328] [added: 251,055] | | | | [removed: 195,677] [added: 235,328] | | |
| [removed: Loss/(gain)] [added: (Gain)/loss] on disposal | [removed: (619] [added: (1,291] | | ) | | [removed: 47,425] [added: (619] | | [added: )] | | [removed: —] [added: 47,425] | | |
| Amortization | [removed: 87,421] [added: 86,663] | | | | [removed: 82,941] [added: 87,421] | | | | [removed: 67,932] [added: 82,941] | | |
| Depreciation | [removed: 20,890] [added: 21,003] | | | | [removed: 20,895] [added: 20,890] | | | | [removed: 17,485] [added: 20,895] | | |
| Interest | [removed: 39,248] [added: 39,481] | | | | [removed: 28,408] [added: 39,248] | | | | [removed: 16,440] [added: 28,408] | | |
| Change in estimated acquisition earn-out payables | [removed: 3,003] [added: 9,185] | | | | [removed: 9,938] [added: 3,003] | | | | [removed: 2,533] [added: 9,938] | | |
| Total expenses | [removed: 1,257,950] [added: 1,343,130] | | | | [removed: 1,236,047] [added: 1,257,950] | | | | [removed: 1,005,670] [added: 1,236,047] | | |
| Income before income taxes | [removed: 402,559] [added: 423,499] | | | | [removed: 339,749] [added: 402,559] | | | | [removed: 357,609] [added: 339,749] | | |
| Income taxes | [removed: 159,241] [added: 166,008] | | | | [removed: 132,853] [added: 159,241] | | | | [removed: 140,497] [added: 132,853] | | |
| Note 16: Reinsurance | [72](#sB4C6C49B307151AABAF57A176A77C572) |
| Employee compensation and benefits | 925,217 | | | | 856,952 | | | | 811,112 | | |
| Cash and cash equivalents | $ | 515,646 | | | $ | 443,420 | |
| Other assets | 44,895 | | | | 35,882 | | |
| Total assets | $ | 5,287,343 | | | $ | 5,004,479 | |
| Long-term debt less unamortized discount and debt issuance costs | 1,018,372 | | | | 1,071,618 | | |
| Total liabilities and shareholders’ equity | $ | 5,287,343 | | | $ | 5,004,479 | |
| Net income | | | | | | | | | | | | | | | 257,491 | | | | 257,491 | | |
| Purchase of treasury stock | | | | | | | 11,250 | | | | (18,908 | | ) | | | | | | (7,658 | | ) |
| Common stock issued to directors | 17 | | 2 | | | | 498 | | | | | | | | | | | | 500 | | |
| Balance at December 31, 2016 | 148,107 | | $ | 14,811 | | | $ | 468,443 | | | $ | (257,683 | ) | | $ | 2,134,640 | | | $ | 2,360,211 | |
| Net income | $ | 257,491 | | | $ | 243,318 | | | $ | 206,896 | |
| Amortization | 86,663 | | | | 87,421 | | | | 82,941 | | |
| Depreciation | 21,003 | | | | 20,890 | | | | 20,895 | | |
| Change in estimated acquisition earn-out payables | 9,185 | | | | 3,003 | | | | 9,938 | | |
| Amortization and disposal of deferred financing costs | 1,597 | | | | — | | | | — | | |
| Accretion of discounts and premiums, investments | 39 | | | | — | | | | — | | |
In November 2016, the Financial Accountings Standards Board (“FASB”) issued Accounting Standards Update (“ASU”) 2016-18, “Statement of Cash Flows (Topic 230)”: Restricted Cash (“ASU 2016-18”), which requires that the Statement of Cash Flows explain the changes during the period of cash and cash equivalents inclusive of amounts categorized as Restricted Cash.
As such, upon adoption, the Company’s Statement of Cash Flows will show the sources and uses of cash that explain the movement in the balance of cash and cash equivalents, inclusive of restricted cash, over the period presented.
In August 2016, the FASB issued ASU 2016-15, "Statement of Cash Flows (Topic 230)": Classification of Certain Cash Receipts and Cash Payments (a consensus of the Emerging Issues Task Force) ("ASU 2016-15"), which addresses eight specific cash flow issues with the objective of reducing the existing diversity in practice in how certain cash receipts and cash payments are presented and classified and applies to all entities, including both business entities and not-for-profit entities that are required to present a statement of cash flows under Topic 230.
The Company has evaluated the impact of ASU 2016-15 and has determined the impact to be immaterial.
The Company already presents cash paid on contingent consideration in business combination as prescribed by ASU 2016-15 and does not, at this time, engage in the other activities being addressed.
In March 2016, the FASB issued ASU 2016-09, "Improvements to Employee Share Based Payment Accounting" ("ASU 2016-09"), which amends guidance issued in Accounting Standards Codification ("ASC") Topic 718, Compensation - Stock Compensation.
ASU 2016-09 simplifies several aspects of the accounting for share-based payment transactions, including the income tax consequences, classification of awards as either equity or liabilities, and classification on the statement of cash flows.
The Company has evaluated the impact of adoption of the ASU on its Consolidated Financial Statements.
The principal impact will be that the tax benefit or expense from stock compensation will be presented in the income tax line of the Statement of Income rather than the current presentation as a component of equity on the Balance Sheet.
Also the tax benefit or expense will be presented as activity in Cash Flow from Operating Activity rather than the current presentation as Cash Flow from Financing Activity in the Statement of Cash Flows.
The Company will also continue to estimate forfeitures of stock grants as allowed by ASU 2016-09.
In March 2016, the FASB issued ASU 2016-08, "Principal Versus Agent Considerations (Reporting Revenue Gross Versus Net)" ("ASU 2016-08") to clarify certain aspects of the principal-versus-agent guidance included in the new revenue standard ASU 2014-09 "Revenue from Contracts with Customers" ("ASU 2014-09").
The FASB issued the ASU in response to concerns identified by stakeholders, including those related to (1) determining the appropriate unit of account under the revenue standard’s principal-versus-agent guidance and (2) applying the indicators of whether an entity is a principal or an agent in accordance with the revenue standard’s control principle.
ASU 2016-08 is effective contemporaneous with ASU 2014-09 beginning January 1, 2018.
The impact of ASU 2016-08 is currently being evaluated along with ASU 2014-09.
At this point in our evaluation the potential impact would be limited to the claims administering activities within our Services Segment and therefore not material to the Company.
The Company continues to evaluate the impact of this pronouncement with the principal impact being that the present
value of the remaining lease payments be presented as a liability on the Balance Sheet as well as an asset of similar value representing the “Right of Use” for those leased properties.
As detailed in Note 13, the undiscounted contractual cash payments remaining on leased properties is $213 million as of December 31, 2016.
Specifically in situations where multiple performance obligations exist within the contract, the use of estimates is required to allocate the transaction price to each separate performance obligation.
Historically 70% or more of the Company’s revenue is in the form of commissions paid by insurance carriers.
Commission are earned upon the effective date of bound coverage and no significant performance obligation remains in those arrangements after coverage is bound.
Fees are predominantly in our National Programs and Services Segments, and to a lesser extent in the large accounts business within our Retail Segment.
| Employee compensation and benefits | 841,439 | | | | 791,749 | | | | 683,000 | | |
| Total assets | $ | 5,012,739 | | | $ | 4,956,458 | |
| Long-term debt | 1,079,878 | | | | 1,152,846 | | |
| Total liabilities and shareholders’ equity | $ | 5,012,739 | | | $ | 4,956,458 | |
| Balance at January 1, 2013 | 143,878 | | $ | 14,388 | | | $ | 335,872 | | | $ | — | | | $ | 1,457,073 | | | $ | 1,807,333 | |
| Net income | | | | | | | | | | | | | | | 217,112 | | | | 217,112 | | |
| Losses and loss adjustment reserve increase (decrease) | 18,940 | | | | (12,210 | | ) | | — | | |
| Cash and cash equivalents at beginning of period | 470,048 | | | | 202,952 | | | | 219,821 | | |
In addition, as the result of our acquisition of The Wright Insurance Group, LLC (“Wright”) in May 2014, we own a flood insurance carrier, Wright National Flood Insurance Company (“Wright Flood”), that is a Wright subsidiary.
Wright Flood’s business consists of policies written pursuant to the National Flood Insurance Program, the program administered by the Federal Emergency Management Agency (“FEMA”), and several excess flood insurance policies, all of which are fully reinsured.
In September 2015, FASB issued ASU No. 2015-16, “Business Combinations (Topic 805): Simplifying the Accounting for Measurement-Period Adjustments” (“ASU 2015-16”), which requires that an acquirer recognize adjustments to provisional amounts that are identified during the measurement period in the reporting period in which the adjustment amounts are determined.
The Company has determined that the impact of the adoption of this guidance on the Consolidated Financial Statements would not be material.
In August 2015, FASB issued ASU No. 2015-15, “Interest-Imputation of Interest (Subtopic 835-30): Presentation and Subsequent Measurement of Debt Issuance Costs Associated with Line-of-Credit Arrangements”.
This standard is in addition to ASU No. 2015-03 and adds SEC paragraphs pursuant to an SEC Staff Announcement that the SEC staff would not object to an entity deferring and presenting debt issuance costs associated with a line-of-credit arrangement as an asset and subsequently amortizing the costs ratably over the term of the arrangement.
The Company plans to adopt ASU 2015-03 in the first quarter of 2016.
As the Company’s debt issuance costs are not material, implementation of this update is not expected to have a material impact on the Company’s Consolidated Financial Statements.
In April 2015, FASB issued ASU No. 2015-05, “Intangibles-Goodwill and Other-Internal-Use Software (Subtopic 350-40): Customer’s Accounting for Fees Paid in a Cloud Computing Arrangement” (“ASU 2015-05”), which issues guidance on determining whether a cloud computing arrangement contains a software license that should be accounted for as internal-use software.
If a cloud computing arrangement does not contain a software license, it should be accounted for as a service contract.
The Company has to this point not been a party to any material cloud computing arrangements and as such has determined the impact of the adoption of this guidance on the Consolidated Financial Statements to be immaterial.
In April 2015, FASB issued ASU No. 2015-03, “Simplifying the Presentation of Debt Issuance Costs” (“ASU 2015-03”), which requires that debt issuance costs related to a recognized debt liability be presented in the balance sheet as a direct deduction from the carrying amount of
that debt liability, consistent with debt discounts, and not recorded as separate assets.
This update is effective for reporting periods beginning after December 15, 2015, and is to be applied on a retrospective basis.
In August 2014, FASB issued ASU No. 2014-15, “Disclosure of Uncertainties About an Entity’s Ability to Continue as a Going Concern” (“ASU 2014-15”), which addresses management’s responsibility in evaluating whether there is substantial doubt about a company’s ability to continue as a going concern and to provide related footnote disclosures.
The Company does not expect to early adopt this guidance, and it believes the adoption of this guidance will not have an impact on the Consolidated Financial Statements.
These may include identifying performance obligations in the contract, estimating the amount of variable consideration to include in the transaction price and allocating the transaction price to each separate performance obligation.
The Company is currently evaluating its revenue streams against the requirements of this pronouncement.
These restricted funds are
Of the $623.6 million, $25.0 million is related to short-term notes which approximates its carrying value due to its proximity to maturity.
shares expected to vest.
| | | | | | | | | | | | | | | | | | | | | | | | |
| --- | --- | --- | --- | --- | --- | --- | --- | --- | --- | --- | --- | --- | --- | --- | --- | --- | --- | --- | --- | --- | --- | --- | --- |
| | | | | | | | | | | | | | | | | | | | |
| --- | --- | --- | --- | --- | --- | --- | --- | --- | --- | --- | --- | --- | --- | --- | --- | --- | --- | --- | --- |
Acquisitions in 2013
(“ASC 805”).
| The Rollins Agency, Inc. | Retail | | June 1, 2013 | | $ | 13,792 | | | $ | 50 | | | $ | 2,321 | | | $ | 16,163 | | | $ | 4,300 | |
| Beecher Carlson Holdings, Inc. | Retail; National Programs | | July 1, 2013 | | 364,256 | | | | — | | | | — | | | | 364,256 | | | | — | | |
| ICA, Inc. | Services | | December 31, 2013 | | 19,770 | | | | — | | | | 727 | | | | 20,497 | | | | 5,000 | | |
| Other | Various | | Various | | 10,254 | | | | 502 | | | | 2,043 | | | | 12,799 | | | | 7,468 | | |
| Total | | | | | $ | 408,072 | | | $ | 552 | | | $ | 5,091 | | | $ | 413,715 | | | $ | 16,768 | |
An excerpt. Shown here: 40 of 424 rewritten, 40 of 187 added and 40 of 128 removed. The counts are complete. For every sentence, read Item 8. Financial Statements and Supplementary Data. in the FY2016 filing and the FY2015 filing.
Item 9. Changes in and Disagreements with Accountants and Financial Disclosure.
1 rewritten, 0 added, 0 removed, 0 unchanged
There were no changes in or disagreements with accountants on accounting and financial disclosure in [removed: 2015.][added: 2016.]
Item 9A. Controls and Procedures.
13 rewritten, 2 added, 2 removed, 45 unchanged
We carried out an evaluation (the “Evaluation”) required by Rules 13a-15 and 15d-15 under the Securities Exchange Act of 1934, as amended (the “Exchange Act”), under the supervision and with the participation of our Chief Executive Officer (“CEO”) and Chief Financial Officer (“CFO”), of the effectiveness of our disclosure controls and procedures as defined in Rule 13a-15 and 15d-15 under the Exchange Act (“Disclosure Controls”) as of December 31, [removed: 2015.][added: 2016.]
Based [removed: on] [added: upon] the Evaluation, our CEO and CFO concluded that the design and operation of our Disclosure Controls were effective to ensure that information required to be disclosed by us in reports that we file or submit under the Exchange Act is (i) recorded, processed, summarized and reported within the time periods specified in SEC rules and forms and (ii) accumulated and communicated to our senior management, including our CEO and CFO, to allow timely decisions regarding required disclosures.
There has not been any change in our internal control over financial reporting identified in connection with the Evaluation that occurred during the quarter ended December 31, [removed: 2015,] [added: 2016,] that has materially affected, or is reasonably likely to materially affect, our internal control over financial reporting.
This Item 9A of this Annual Report on Form 10-K [removed: is] [added: contains] the information concerning the evaluation referred to in the Section 302 Certifications and this information should be read in conjunction with the Section 302 Certifications for a more complete understanding of the topics presented.
We have audited the internal control over financial reporting of Brown & Brown, Inc. and subsidiaries (the “Company”) as of December 31, [removed: 2015,] [added: 2016,] based on criteria established in Internal Control-Integrated Framework (2013) issued by the Committee of Sponsoring Organizations of the Treadway Commission.
As described in Management’s Report on Internal Control [removed: Over] [added: over] Financial Reporting, management excluded from its assessment the internal control over financial reporting at [removed: Spain Agency, Inc, Strategic Benefit Advisors,] [added: Social Security Advocates for the Disabled,] LLC, [removed: Bellingham Underwriters,] [added: Morstan General Agency,] Inc., [removed: MBA Insurance Agency of Arizona, Inc.] and [removed: Smith Insurance,] [added: The Insurance House,] Inc. (collectively the [removed: “2015] [added: “2016] Excluded Acquisitions”), which were acquired during [removed: 2015] [added: 2016] and whose financial statements constitute [removed: 2.91%] [added: 3.0%] of total assets, [removed: 1.03%] [added: 1.5%] of revenues, and [removed: (0.03%)] [added: 0.9%] of net income of the consolidated financial statement amounts as of and for the year ended December 31, [removed: 2015.][added: 2016.]
Accordingly, our audit did not include the internal control over financial reporting of the [removed: 2015] [added: 2016] Excluded Acquisitions.
In our opinion, the Company maintained, in all material respects, effective internal control over financial reporting as of December 31, [removed: 2015,] [added: 2016,] based on the criteria established in Internal Control-Integrated Framework (2013) issued by the Committee of Sponsoring Organizations of the Treadway Commission.
We have also audited, in accordance with the standards of the Public Company Accounting Oversight Board (United States), the consolidated financial statements as of and for the year ended December 31, [removed: 2015] [added: 2016] of the Company and our report dated February [removed: 25, 2016] [added: 24, 2017] expressed an unqualified opinion on those financial statements.
Under the supervision and with the participation of management, including Brown & Brown’s principal executive officer and principal financial officer, Brown & Brown conducted an evaluation of the effectiveness of internal control over financial reporting based [removed: on] [added: upon] the framework in Internal Control-Integrated Framework (2013) issued by the Committee of Sponsoring Organizations of the Treadway Commission (“COSO”).
In conducting Brown & Brown’s evaluation of the effectiveness of its internal control over financial reporting, Brown & Brown has excluded the following acquisitions completed during [removed: 2015: Spain Agency, Inc, Strategic Benefit Advisors,] [added: 2016: Social Security Advocates for the Disabled,] LLC, [removed: Bellingham Underwriters,] [added: Morstan General Agency,] Inc., [removed: MBA Insurance Agency of Arizona, Inc.] and [removed: Smith Insurance,] [added: The Insurance House,] Inc. (collectively the [removed: “2015] [added: “2016] Excluded Acquisitions”), which were acquired during [removed: 2015] [added: 2016] and whose financial statements constitute [removed: 2.91%] [added: 3.0%] of total assets, [removed: 1.03%] [added: 1.5%] of revenues, and [removed: (0.03%)] [added: 0.9%] of net income of the [removed: Consolidated Financial Statement] [added: consolidated financial statement] amounts as of and for the year ended December 31, [removed: 2015.][added: 2016.]
Based [removed: on] [added: upon] Brown & Brown’s evaluation under the framework in Internal Control-Integrated Framework (2013) issued by the Committee of Sponsoring Organizations of the Treadway Commission, management concluded that internal control over financial reporting was effective as of December 31, [removed: 2015.][added: 2016.]
Management’s internal control over financial reporting as of December 31, [removed: 2015] [added: 2016] has been audited by Deloitte & Touche LLP, an independent registered public accounting firm, as stated in their report which is included herein.
| February 24, 2017 |
February 24, 2017
| February 25, 2016 |
February 25, 2016
Item 10. Directors, Executive Officers and Corporate Governance.
2 rewritten, 62 added, 0 removed, 1 unchanged
The [added: additional] information required by this item regarding directors and executive officers is incorporated herein by reference to our definitive Proxy Statement to be filed with the SEC in connection with the Annual Meeting of Shareholders to be held in [removed: 2016] [added: 2017] (the [removed: “2016] [added: “2017] Proxy Statement”) under the headings [removed: “Management”] [added: “Board] and [removed: “Section 16(a) Beneficial Ownership Reporting.”] [added: Corporate Governance Matters” and “Other Important Information.”] We have adopted a code of ethics that applies to our principal executive officer, principal financial officer, and controller.
A copy of our Code of Ethics for our Chief Executive Officer and our Senior Financial Officers and a copy of our Code of Business Conduct and Ethics applicable to all employees are posted on our Internet website, at www.bbinsurance.com, and are also available upon written request directed to Corporate Secretary, 220 Brown & Brown, Inc., South Ridgewood Avenue, Daytona Beach, Florida 32114, or by telephone to [removed: (386)-239-5752.][added: (386) 252-9601.]
Set forth below is certain information concerning our executive officers as of February 27, 2017.
All officers hold office for one-year terms or until their successors are elected and qualified.
| | | |
| --- | --- | --- |
| | | |
| Richard A. Freebourn, Sr. | Executive Vice President - Internal Operations | 69 |
| Robert W. Lloyd | Executive Vice President; Secretary and General Counsel | 52 |
| J. Scott Penny | Executive Vice President; Chief Acquisitions Officer | 50 |
| Anthony T. Strianese | Executive Vice President; President - Wholesale Brokerage Division | 55 |
| Chris L. Walker | Executive Vice President; President - Programs Division | 59 |
| R. Andrew Watts | Executive Vice President; Chief Financial Officer and Treasurer | 48 |
Richard A.
Freebourn, Sr. Mr. Freebourn was appointed Executive Vice President - Internal Operations, and People Officer, respectively, in September 2014.
Prior to that he had served as Vice President, Internal Operations since 2004 after serving as Director, Internal Operations commencing in 2002.
He has been responsible for acquisition due diligence from 2002 through the present.
From 2000 until 2002, he served as our Director of Internal Audit, and from 1998 until 2000, he was Vice President and Operations Leader of the Indianapolis, Indiana office of one of our Retail Division subsidiaries.
Mr. Freebourn has been employed by us since 1984.
He originally joined the Company as part of an acquisition in Fort Myers, Florida, where he was the Accounting Leader and eventually the Personal Lines, Commercial Lines and Operations Leader through 1997.
In his role as People Officer, Mr. Freebourn is responsible for developing recruiting and mentoring strategies in the areas of sales, finance, human resources, information technology and insurance operations.
He is also responsible for the oversight of all traditional human resources functions.
Robert W.
Lloyd.
Mr. Lloyd has served as our General Counsel since 2009 and as Executive Vice President and Corporate Secretary since 2014.
He previously served as Vice President from 2006 to 2014, Chief Litigation Officer from 2006 until 2009 and as Assistant General Counsel from 2001 until 2006.
Prior to that, he worked as sales manager and marketing manager, respectively, in our Daytona Beach, Florida retail office.
While working in a sales role, Mr. Lloyd qualified for the Company’s top producer honors (Tangle B) in 2001 and earned his Certified Insurance Counselor (CIC) designation.
Before joining us, Mr. Lloyd practiced law and served as outside counsel to the Company with the law firm of Cobb & Cole, P.A. in Daytona Beach, Florida.
Mr. Lloyd is a Rotarian and a member of the Executive Board of the Central Florida Council, Boy Scouts of America.
In 2015, Mr. Lloyd was appointed as an independent director of Raydon Corporation, a private company based in Port Orange, Florida.
J.
Scott Penny.
Mr. Penny has been our Chief Acquisitions Officer since 2011, and he serves as director and as an executive officer for several of our subsidiaries.
He served as a Regional President from 2010 to 2014 and Regional Executive Vice President from 2002 to July 2010.
From 1999 until January 2003, Mr. Penny served as profit center leader of our Indianapolis, Indiana retail office.
Prior to that, Mr. Penny served as profit center leader of our Jacksonville, Florida retail office from 1997 to 1999.
From 1989 to 1997, Mr. Penny was employed as an account executive and marketing representative in our Daytona Beach, Florida office.
Anthony T.
Strianese.
Mr. Strianese has served as President of our Wholesale Brokerage Division since 2014.
He served as Regional President from 2012 to 2014 and Regional Executive Vice President from July 2007 to January 2012, and serves as director and as an executive officer for several of our subsidiaries.
An excerpt. Shown here: all 2 rewritten, 40 of 62 added and all 0 removed. The counts are complete. For every sentence, read Item 10. Directors, Executive Officers and Corporate Governance. in the FY2016 filing and the FY2015 filing.
Item 11. Executive Compensation.
1 rewritten, 0 added, 0 removed, 0 unchanged
The information required by this item is incorporated herein by reference to the [removed: 2016] [added: 2017] Proxy Statement under the heading [removed: “Executive Compensation.”][added: “Compensation Matters.”]
Item 12. Security Ownership of Certain Beneficial Owners and Management and Related Stockholders Matters.
1 rewritten, 0 added, 0 removed, 1 unchanged
The information required by this item is incorporated herein by reference to the [removed: 2016] [added: 2017] Proxy Statement under the heading “Security Ownership of Management and Certain Beneficial Owners.”
Item 13. Certain Relationships and Related Transactions, and Director Independence.
1 rewritten, 0 added, 0 removed, 0 unchanged
The information required by this item is incorporated herein by reference to the [removed: 2016] [added: 2017] Proxy Statement under the [removed: heading “Management-Certain Relationships] [added: headings “Director Independence,” “Related Party Transactions Policy”] and [removed: Related Transactions.”][added: “Relationships and Transactions with Affiliated Parties.”]
Item 14. Principal Accounting Fees and Services.
1 rewritten, 0 added, 0 removed, 1 unchanged
The information required by this item is incorporated herein by reference to the [removed: 2016] [added: 2017] Proxy Statement under the heading “Fees Paid to Deloitte & Touche LLP.”
Item 15. Exhibits and Financial Statements Schedules.
3 rewritten, 8 added, 31 removed, 98 unchanged
| 3.2 | Bylaws (incorporated by reference to Exhibit 3.2 to Form 8-K filed on [removed: March 2, 2012).] [added: October 12, 2016).] |
| 10.7 | Registrant’s 2010 Stock Incentive [removed: Plan] [added: Plan, as amended] (incorporated by reference to Exhibit 10.1 to Form 8-K filed on [removed: February 24,] [added: May 5,] 2016).* |
| [removed: 10.8(c)] [added: 10.8(e)] | Form of Director Stock Grant Agreement |
| 10.4(e) | Employment Agreement, dated as of January 9, 2012, between the Registrant and Chris L. Walker (incorporated by reference to Exhibit 10.1 to Form 10-Q for the quarter ended March 31, 2013).* |
| 10.4(f) | Transition Agreement dated and effective as of July 1, 2016 between the Registrant and Charles H. Lydecker (incorporated by reference to Exhibit 10.3 to Form 10-Q for the quarter ended November 30, 2016).* |
| 10.4(g) | Consulting Agreement dated and effective as of July 1, 2016 between the Registrant and Charles H. Lydecker (incorporated by reference to Exhibit 10.3 to Form 10-Q for the quarter ended November 30, 2016).* |
| 10.8(c) | Form of Performance Stock Award Agreement under the 2010 Stock Incentive Plan (incorporated by reference to Exhibit 10.1 to Form 8-K filed on March 23, 2016).* |
| 10.8(d) | Form of Restricted Stock Award Agreement under the 2010 Stock Incentive Plan (incorporated by reference to Exhibit 10.2 to Form 8-K filed on March 23, 2016).* |
| | |
| | |
| | |
| --- | --- |
SIGNATURE
Pursuant to the requirements of Section 13 or 15(d) of the Securities Exchange Act of 1934, the registrant has duly caused this report to be signed on its behalf by the undersigned, thereunto duly authorized.
| | | | | |
| --- | --- | --- | --- | --- |
| | | BROWN & BROWN, INC. Registrant | | |
| Date: February 25, 2016 | | By: | /s/ J. Powell Brown | |
| | | | J. Powell Brown | |
| | | | Chief Executive Officer | |
Pursuant to the requirements of the Securities Exchange Act of 1934, this report has been signed below by the following persons on behalf of the registrant and in the capacities and on the date indicated.
| Signature | | Title | | Date |
| /s/ J. Powell Brown | | Director; President and Chief Executive Officer (Principal Executive Officer) | | February 25, 2016 |
| J. Powell Brown | | | | |
| /s/ R. Andrew Watts | | Executive Vice President, Chief Financial Officer and Treasurer (Principal Financial and Accounting Officer) | | February 25, 2016 |
| R. Andrew Watts | | | | |
| * | | Chairman of the Board | | February 25, 2016 |
| J. Hyatt Brown | | | | |
| * | | Director | | February 25, 2016 |
| Samuel P. Bell, III | | | | |
| Hugh M. Brown | | | | |
| Bradley Currey, Jr. | | | | |
| Theodore J. Hoepner | | | | |
| James S. Hunt | | | | |
| Toni Jennings | | | | |
| * | | Director | | |
| Timothy R.M. Main | | | February 25, 2016 | |
| H. Palmer Proctor, Jr. | | | | |
| Wendell Reilly | | | | |
| Chilton D. Varner | | | | |
| *By: | /s/ Robert W. Lloyd |
| | Robert W. Lloyd Attorney-in-Fact |
Item 16. Form 10-K Summary.
0 rewritten, 59 added, 0 removed, 0 unchanged
New section this year
None
SIGNATURE
Pursuant to the requirements of Section 13 or 15(d) of the Securities Exchange Act of 1934, the registrant has duly caused this report to be signed on its behalf by the undersigned, thereunto duly authorized.
| | | | | |
| --- | --- | --- | --- | --- |
| | | | | |
| | | BROWN & BROWN, INC. Registrant | | |
| Date: February 27, 2017 | | By: | /s/ J. Powell Brown | |
| | | | J. Powell Brown | |
| | | | Chief Executive Officer | |
Pursuant to the requirements of the Securities Exchange Act of 1934, this report has been signed below by the following persons on behalf of the registrant and in the capacities and on the date indicated.
| | | | | |
| --- | --- | --- | --- | --- |
| | | | | |
| Signature | | Title | | Date |
| | | | | |
| /s/ J. Powell Brown | | Director; President and Chief Executive Officer (Principal Executive Officer) | | February 27, 2017 |
| J. Powell Brown | | | | |
| | | | | |
| /s/ R. Andrew Watts | | Executive Vice President, Chief Financial Officer and Treasurer (Principal Financial and Accounting Officer) | | February 27, 2017 |
| R. Andrew Watts | | | | |
| | | | | |
| * | | Chairman of the Board | | February 27, 2017 |
| J. Hyatt Brown | | | | |
| | | | | |
| * | | Director | | February 27, 2017 |
| Samuel P. Bell, III | | | | |
| | | | | |
| * | | Director | | February 27, 2017 |
| Hugh M. Brown | | | | |
| | | | | |
| * | | Director | | February 27, 2017 |
| Bradley Currey, Jr. | | | | |
| | | | | |
| * | | Director | | February 27, 2017 |
| Theodore J. Hoepner | | | | |
| | | | | |
| * | | Director | | February 27, 2017 |
| James S. Hunt | | | | |
| | | | | |
An excerpt. Shown here: all 0 rewritten, 40 of 59 added and all 0 removed. The counts are complete. For every sentence, read Item 16. Form 10-K Summary. in the FY2016 filing.