 filings.tools
Item 2. Management’s Discussion and Analysis of Financial Condition and Results of Operations
238K characters. Original on sec.gov ·
Item 2. Management’s Discussion and Analysis of Financial Condition and Results of Operations
The following discussion and analysis should be read in conjunction with Blackstone Inc.’s condensed consolidated financial statements and the related notes included within this Quarterly Report on
Form 10-Q.
In this report, references to “Blackstone,” the “Company,” “we,” “us” or “our” refer to Blackstone Inc. and its consolidated subsidiaries.
Our Business
Blackstone is one of the world’s leading investment firms. We generate revenue from fees earned pursuant to contractual arrangements with funds, fund investors and fund portfolio companies (including management, transaction and monitoring fees), and from capital markets services. We also invest in the funds we manage and we are entitled to a
pro-rata
share of the income of the fund
(a “pro-rata
allocation”). In addition to a
pro-rata
allocation, and assuming certain investment returns are achieved, we are entitled to a disproportionate allocation of the income otherwise allocable to the limited partners, commonly referred to as carried interest (“Performance Allocations”). In certain structures, we receive a contractual incentive fee from an investment fund based on achieving certain investment returns (an “Incentive Fee,” and together with Performance Allocations, “Performance Revenues”). The composition of our revenues will vary based on market conditions and the cyclicality of the different businesses in which we operate. Net investment gains and investment income generated by the Blackstone Funds are driven by the performance of the underlying investments as well as overall market conditions. Fair values are affected by changes in the fundamentals of our portfolio company and other investments, the industries in which they operate, the overall economy and other market conditions.
Our business is organized into four segments:
Real Estate
Our Real Estate business is a global leader in real estate investing. Our Real Estate segment operates as one globally integrated business, with investments across the globe, including in the Americas, Europe and Asia. Our real estate investment teams seek to utilize our global expertise and presence to generate attractive risk-adjusted returns for our investors.
Our Blackstone Real Estate Partners (“BREP”) business is geographically diversified and targets a broad range of opportunistic real estate and real estate-related investments. The BREP funds include global funds as well as funds focused specifically on Europe or Asia investments. BREP seeks to invest thematically in high-quality assets, focusing where we see outsized growth potential driven by global economic and demographic trends. BREP has made significant investments in logistics, office, rental housing, hospitality and retail properties around the world, as well as in a variety of real estate operating companies.
Our Core+ strategy invests in substantially stabilized real estate globally primarily through perpetual capital vehicles. These include our (a) Blackstone Property Partners funds (“BPP”), which are focused on high-quality assets in the Americas, Europe and Asia and (b) Blackstone Real Estate Income Trust, Inc. (“BREIT”) and our Blackstone European Property Income (“BEPIF”) funds, which provide income-focused individual investors access to institutional quality real estate primarily in the Americas and Europe, respectively.
Our Blackstone Real Estate Debt Strategies (“BREDS”) vehicles primarily target real estate-related debt investment opportunities. BREDS invests in both public and private markets, primarily in the U.S. and Europe. BREDS’ scale and investment mandates enable it to provide a variety of lending options for our borrowers and investment options for our investors, including commercial real estate and mezzanine loans, residential mortgage loan pools and liquid real estate-related debt securities. The BREDS platform includes high-yield real estate debt funds, liquid real estate debt funds and Blackstone Mortgage Trust, Inc. (“BXMT”), a NYSE-listed real estate investment trust (“REIT”). The BREDS platform also includes real estate credit products managed on behalf of insurance companies.
Private Equity
Our Private Equity segment includes our corporate private equity business, which consists of: (a) our global private equity funds, Blackstone Capital Partners (“BCP”), (b) our sector-focused funds, including our energy- and energy transition-focused funds, Blackstone Energy Transition Partners (“BETP”), (c) our Asia-focused private equity funds, Blackstone Capital Partners Asia and (d) our core private equity funds, Blackstone Core Equity Partners (“BCEP”). Our Private Equity segment also includes (a) our opportunistic investment platform that invests globally across asset classes, industries and geographies, Blackstone Tactical Opportunities (“Tactical Opportunities”), (b) our secondary fund of funds business, Strategic Partners Fund Solutions (“Strategic Partners”), (c) our infrastructure-focused funds, Blackstone Infrastructure Partners (“BIP”), (d) our life sciences investment platform, Blackstone Life Sciences (“BXLS”), (e) our growth equity investment platform, Blackstone Growth (“BXG”), (f) our multi-asset investment program for eligible high net worth investors offering exposure to certain of Blackstone’s key illiquid investment strategies through a single commitment, Blackstone Total Alternatives Solution (“BTAS”) and (g) our capital markets services business, Blackstone Capital Markets (“BXCM”).
We are a global leader in private equity investing. Our corporate private equity business pursues transactions across industries on a global basis. It strives to create value by investing in great businesses where our capital, strategic insight, global relationships and operational support can drive transformation. Our corporate private equity business’s investment strategies and core themes continually evolve in anticipation of, or in response to, changes in the global economy, local markets, regulation, capital flows and geopolitical trends. We seek to construct a differentiated portfolio of investments with a well-defined, post-acquisition value creation strategy. Similarly, we seek investments that can generate strong unlevered returns regardless of entry or exit cycle timing. Blackstone Core Equity Partners pursues control-oriented investments in high-quality companies with durable businesses and seeks to offer a lower level of risk and a longer hold period than traditional private equity.
Tactical Opportunities pursues a thematically driven, opportunistic investment strategy. Our flexible, global mandate enables us to find differentiated opportunities across asset classes, industries, and geographies and invest behind them with the frequent use of structure to generate attractive risk-adjusted returns. With a focus on businesses and/or asset-backed investments in market sectors that are benefitting from long-term transformational tailwinds, Tactical Opportunities seeks to leverage the full power of Blackstone to help those businesses grow and improve. Tactical Opportunities’ ability to dynamically shift focus to the most compelling opportunities in any market environment, combined with the business’ expertise in structuring complex transactions, enables Tactical Opportunities to invest behind attractive market areas often with securities that provide downside protection and maintain upside return.
Strategic Partners, our secondary fund of funds business, is a total fund solutions provider. As a secondary investor it acquires interests in high-quality private funds from original holders seeking liquidity. Strategic Partners focuses on a range of opportunities in underlying funds such as private equity, real estate, infrastructure, venture and growth capital, credit and other types of funds, as well as general
partner-led
transactions and primary investments and
co-investments
with financial sponsors. Strategic Partners also provides investment advisory services to separately managed account clients investing in primary and secondary investments in private funds and
co-investments.
BIP targets a diversified mix of core+, core and public-private partnership investments across all infrastructure sectors, including energy infrastructure, transportation, digital infrastructure, and water and waste with a primary focus in the U.S. BIP applies a disciplined, operationally intensive investment approach to investments, seeking to apply a long-term
buy-and-hold
strategy to large-scale infrastructure assets with a focus on delivering stable, long-term capital appreciation together with a predictable annual cash flow yield.
BXLS is our investment platform with capabilities to invest across the life cycle of companies and products within the life sciences sector. BXLS primarily focuses on investments in life sciences products in late stage clinical development within the pharmaceutical and biotechnology sectors.
BXG is our growth equity platform that seeks to deliver attractive risk-adjusted returns by investing in dynamic, growth-stage businesses, with a focus on the consumer, consumer technology, enterprise solutions, financial services and healthcare sectors.
Credit & Insurance
Our Credit & Insurance segment includes Blackstone Credit (“BXC”). BXC is one of the largest credit-oriented managers and CLO managers in the world. The investment portfolios of the funds BXC manages or
sub-advises
consist primarily of loans and securities of
non-investment
and investment grade companies spread across the capital structure including senior debt, subordinated debt, preferred stock and common equity.
BXC is organized into two overarching strategies: private credit and liquid credit. BXC’s private credit strategies include mezzanine and direct lending funds, private placement strategies, stressed/distressed strategies and energy strategies (including our sustainable resources platform). BXC’s direct lending funds include Blackstone Private Credit Fund (“BCRED”) and Blackstone Secured Lending Fund (“BXSL”), both of which are business development companies (“BDCs”). BXC’s liquid credit strategies consist of CLOs, closed-ended funds, open-ended funds, systematic strategies and separately managed accounts.
Our Credit & Insurance segment also includes our insurer-focused platform, Blackstone Insurance Solutions (“BIS”). BIS focuses on providing full investment management services for insurers’ general accounts, seeking to deliver customized and diversified portfolios that include allocations to Blackstone managed products and strategies across asset classes and Blackstone’s private credit origination capabilities. BIS provides its clients tailored portfolio construction and strategic asset allocation, seeking to generate risk-managed, capital-efficient returns, diversification and capital preservation that meets clients’ objectives. BIS also provides similar services to clients through separately managed accounts or by
sub-managing
assets for certain insurance-dedicated funds and special purpose vehicles. BIS currently manages assets for clients that include Corebridge Financial Inc., Everlake Life Insurance Company, Fidelity & Guaranty Life Insurance Company and Resolution Life Group, among others.
In addition, our Credit & Insurance segment includes our asset-based finance platform and our publicly traded midstream energy infrastructure, listed infrastructure and master limited partnership (“MLP”) investment platform, which is managed by Harvest Fund Advisors LLC (“Harvest”). Harvest primarily invests capital raised from institutional investors in separately managed accounts and pooled vehicles, investing in publicly traded energy infrastructure, listed infrastructure, renewables and MLPs holding primarily midstream energy assets in North America.
Hedge Fund Solutions
The principal component of our Hedge Fund Solutions segment is Blackstone Alternative Asset Management (“BAAM”). BAAM is the world’s largest discretionary allocator to hedge funds, managing a broad range of commingled and customized fund solutions since its inception in 1990. The Hedge Fund Solutions segment also includes (a) our GP Stakes business (“GP Stakes”), which targets minority investments in the general partners of private equity and other private-market alternative asset management firms globally, with a focus on delivering a combination of recurring annual cash flow yield and long-term capital appreciation, (b) investment platforms that invest directly, including our Blackstone Strategic Opportunity Fund, which seeks to produce long-term, risk-adjusted returns by investing in a wide variety of securities, assets and instruments, often sourced and/or managed by third party subadvisors or affiliated Blackstone managers, (c) our hedge fund seeding business and (d) registered funds that provide alternative asset solutions through daily liquidity products. Hedge Fund Solutions’ overall investment philosophy is to seek to grow investors’ assets through both commingled and custom-tailored investment strategies designed to deliver compelling risk-adjusted returns. Diversification, risk management and due diligence are key tenets of our approach.
Business Environment
Blackstone’s businesses are materially affected by conditions in the financial markets and economic conditions in the U.S., Europe, Asia and, to a lesser extent, elsewhere in the world.
The first quarter of 2023 represented a turbulent period for markets, driven by concerns over slowing economic growth and exacerbated by stress in the U.S. and European banking systems. While the CBOE Volatility Index fell 14% in the first quarter, equity market volatility remained at elevated levels. In public markets, the S&P 500 increased 7.5% in the first quarter, largely driven by a few large technology companies. The median increase of all stocks in the S&P 500 was approximately 2.0% in the first quarter. There was wide dispersion in sector performance, with the best performing sector in the quarter, information technology, up 21.8%. The worst performing sector in the quarter, financials, declined 5.6% amid market concerns regarding liquidity and capital strength and the failure of multiple U.S. regional banks. In credit markets, the S&P leveraged loan index increased by 3.2% and the Credit Suisse high yield bond index increased by 3.9% in the first quarter. High yield spreads tightened by 18 basis points sequentially, while issuance decreased 18% compared to the first quarter of 2022.
Inflation has moderated in the U.S., where the rate of inflation saw a year-over-year increase in the CPI in March of 5.0%, down from a prior peak of 9.1% in June 2022 and down from 6.5% in December 2022. The Federal Reserve further raised the federal funds target range by 50 basis points in the first quarter of 2023 to
4.75%-5.00%
and another 25 basis points in May 2023 - the tenth consecutive rate hike. The current target range of 5.00%-5.25% marks the first time rates are above 5.00% in over 15 years. However, inflation still remains well above the Federal Reserve’s
long-run
target of 2%. The
ten-year
U.S. Treasury yield decreased 41 basis points to 3.47% in the first quarter of 2023 and has continued to decline to 3.42% as of April 28, 2023. Meanwhile, short-term yields remained on an upward trajectory, as three-month LIBOR increased 43 basis points to 5.19% in the first quarter and has since increased to 5.30% as of April 28, 2023.
Globally, central banks continued to tighten monetary policy, driving fears of slowing economic growth and a potential recession in certain geographies. In Europe, the European Central Bank raised its deposit facility rate by 100 basis points in the quarter to 3.0%. Eurozone inflation slowed to 6.9% year over year in March, down from a peak of 10.6% in October of 2022 and down from 9.2% in December of 2022.
Despite the tightening, the economy has remained resilient to date with the U.S. unemployment rate near historically low levels, including 3.5% in March - unchanged since December 2022 and in line with early 2020, immediately prior to the coronavirus pandemic. Wages increased 4.2% year-over-year in March, while retail sales rose 2.9% year-over-year. In manufacturing, however, the ISM Manufacturing PMI decreased to 46.3 in March 2023, down from 48.4 in the fourth quarter of 2022, signaling a continued contraction in the U.S. manufacturing sector since November 2022.
In energy, the price of West Texas Intermediate crude oil was relatively well-contained in the first quarter, trading within a tight range of $73-$82 per barrel until mid-March and ending the quarter down ~6% versus the fourth quarter of 2022. Henry Hub natural gas prices steadily declined in the first quarter, save for a brief spike in late February, ending the quarter at $2.22/MMBtu, a decrease of 50% versus the fourth quarter of 2022 level of $4.48/MMBtu.
Overall market activity levels remained muted in the first quarter. U.S. initial public offering volumes declined 77% compared to the first quarter of 2022 and U.S. announced merger and acquisition deal volumes were down 44% over the same period.
The U.S. economy has shown signs of resilience and inflation has continued to moderate. Nevertheless, economic consensus forecasts suggest that a further deceleration of the U.S. economy is likely, driven in part by historically elevated interest rates and the potential for capital constraints arising from recent stress in the global banking system.
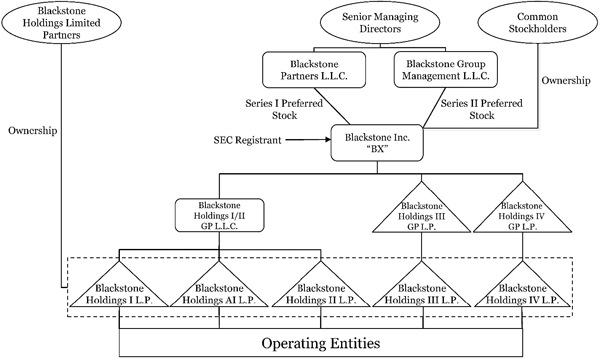
Organizational Structure
The simplified diagram below depicts our current organizational structure. The diagram does not depict all of our subsidiaries, including intermediate holding companies through which certain of the subsidiaries depicted are held.
Key Financial Measures and Indicators
We manage our business using certain financial measures and key operating metrics since we believe these metrics measure the productivity of our investment activities. We prepare our Consolidated Financial Statements in accordance with accounting principles generally accepted in the United States of America (“GAAP”). See “— Item 1. Financial Statements — Notes to Condensed Consolidated Financial Statements — Note 2. Summary of Significant Accounting Policies” and “— Critical Accounting Policies.” Our key non-GAAP financial measures and operating indicators and metrics are discussed below.
Distributable Earnings
Distributable Earnings is derived from Blackstone’s segment reported results. Distributable Earnings is used to assess performance and amounts available for dividends to Blackstone stockholders, including Blackstone personnel and others who are limited partners of the Blackstone Holdings Partnerships. Distributable Earnings is the sum of Segment Distributable Earnings plus Net Interest and Dividend Income (Loss) less Taxes and Related Payables. Distributable Earnings excludes unrealized activity and is derived from and reconciled to, but not equivalent to, its most directly comparable GAAP measure of Income (Loss) Before Provision (Benefit) for Taxes. See
“— Non-GAAP
Financial Measures” for our reconciliation of Distributable Earnings.
Net Interest and Dividend Income (Loss) is presented on a segment basis and is equal to Interest and Dividend Revenue less Interest Expense, adjusted for the impact of consolidation of Blackstone Funds, and interest expense associated with the Tax Receivable Agreement.
Taxes and Related Payables represent the total GAAP tax provision adjusted to include only the current tax provision (benefit) calculated on Income (Loss) Before Provision (Benefit) for Taxes and including the Payable under the Tax Receivable Agreement. Further, the current tax provision utilized when calculating Taxes and Related Payables and Distributable Earnings reflects the benefit of deductions available to the company on certain expense items that are excluded from the underlying calculation of Segment Distributable Earnings and Total Segment Distributable Earnings, such as equity-based compensation charges and certain Transaction-Related Charges where there is a current tax provision or benefit. The economic assumptions and methodologies that impact the implied income tax provision are the same as those methodologies and assumptions used in calculating the current income tax provision for Blackstone’s Consolidated Statements of Operations under GAAP, excluding the impact of divestitures and accrued tax contingencies and refunds which are reflected when paid or received. Management believes that including the amount payable under the Tax Receivable Agreement and utilizing the current income tax provision adjusted as described above when calculating Distributable Earnings is meaningful as it increases comparability between periods and more accurately reflects earnings that are available for distribution to stockholders.
Segment Distributable Earnings
Segment Distributable Earnings is Blackstone’s segment profitability measure used to make operating decisions and assess performance across Blackstone’s four segments. Blackstone believes it is useful to stockholders to review the measure that management uses in assessing segment performance. Segment Distributable Earnings represents the net realized earnings of Blackstone’s segments and is the sum of Fee Related Earnings and Net Realizations for each segment. Blackstone’s segments are presented on a basis that deconsolidates Blackstone Funds, eliminates
non-controlling
ownership interests in Blackstone’s consolidated operating partnerships, removes the amortization of intangible assets and removes Transaction-Related Charges. Transaction-Related Charges arise from corporate actions including acquisitions, divestitures and Blackstone’s initial public offering. They consist primarily of equity-based compensation charges, gains and losses on contingent consideration arrangements, changes in the balance of the Tax Receivable Agreement resulting from a change in tax law or similar event, transaction costs and any gains or losses associated with these corporate actions. Segment Distributable Earnings excludes unrealized activity and is derived from and reconciled to, but not equivalent to, its most directly comparable GAAP measure of Income (Loss) Before Provision (Benefit) for Taxes. See “—
Non-GAAP
Financial Measures” for our reconciliation of Segment Distributable Earnings.
Net Realizations is presented on a segment basis and is the sum of Realized Principal Investment Income and Realized Performance Revenues (which refers to Realized Performance Revenues excluding Fee Related Performance Revenues), less Realized Performance Compensation (which refers to Realized Performance Compensation excluding Fee Related Performance Compensation and Equity-Based Performance Compensation).
Realized Performance Compensation reflects an increase in the aggregate Realized Performance Compensation paid to certain of our professionals above the amounts allocable to them based upon the percentage participation in the relevant performance plans previously awarded to them. The expectation is that for the full year 2023, Fee Related Compensation will be decreased by the total amount of additional Performance Compensation awarded for the year. For the three months ended March 31, 2023, Realized Performance Compensation was increased by an aggregate of $35.0 million and Fee Related Compensation was decreased by $16.3 million. These changes to Realized Performance Compensation and Fee Related Compensation reduced Net Realizations, increased Fee Related Earnings and had a negative impact to Income Before Provision (Benefit) for Taxes and Distributable Earnings in the three months ended March 31, 2023. These changes are not expected to impact Income Before Provision (Benefits) for Taxes and Distributable Earnings
for the year ending December 31, 2023. These changes had an impact on individual quarters in 2022 but did not impact Income Before Provision (Benefits) for Taxes and Distributable Earnings for the year ended December 31, 2022.
Fee Related Earnings
Fee Related Earnings is a performance measure used to assess Blackstone’s ability to generate profits from revenues that are measured and received on a recurring basis and not subject to future realization events. Blackstone believes Fee Related Earnings is useful to stockholders as it provides insight into the profitability of the portion of Blackstone’s business that is not dependent on realization activity. Fee Related Earnings equals management and advisory fees (net of management fee reductions and offsets) plus Fee Related Performance Revenues, less (a) Fee Related Compensation on a segment basis, and (b) Other Operating Expenses. Fee Related Earnings is derived from and reconciled to, but not equivalent to, its most directly comparable GAAP measure of Income (Loss) Before Provision (Benefit) for Taxes. See “—
Non-GAAP
Financial Measures” for our reconciliation of Fee Related Earnings.
Fee Related Compensation is presented on a segment basis and refers to the compensation expense, excluding Equity-Based Compensation, directly related to (a) Management and Advisory Fees, Net and (b) Fee Related Performance Revenues, referred to as Fee Related Performance Compensation.
Fee Related Performance Revenues refers to the realized portion of Performance Revenues from Perpetual Capital that are (a) measured and received on a recurring basis, and (b) not dependent on realization events from the underlying investments.
Other Operating Expenses is presented on a segment basis and is equal to General, Administrative and Other Expenses, adjusted to (a) remove the amortization of transaction-related intangibles, (b) remove certain expenses reimbursed by the Blackstone Funds which are netted against Management and Advisory Fees, Net in Blackstone’s segment presentation, and (c) give effect to an administrative fee collected on a quarterly basis from certain holders of Blackstone Holdings Partnership Units. The administrative fee is accounted for as a capital contribution under GAAP, but is reflected as a reduction of Other Operating Expenses in Blackstone’s segment presentation.
Adjusted Earnings Before Interest, Taxes and Depreciation and Amortization
Adjusted Earnings Before Interest, Taxes and Depreciation and Amortization (“Adjusted EBITDA”), is a supplemental measure used to assess performance derived from Blackstone’s segment results and may be used to assess its ability to service its borrowings. Adjusted EBITDA represents Distributable Earnings plus the addition of (a) Interest Expense on a segment basis, (b) Taxes and Related Payables, and (c) Depreciation and Amortization. Adjusted EBITDA is derived from and reconciled to, but not equivalent to, its most directly comparable GAAP measure of Income (Loss) Before Provision (Benefit) for Taxes. See “—
Non-GAAP
Financial Measures” for our reconciliation of Adjusted EBITDA.
Net Accrued Performance Revenues
Net Accrued Performance Revenues is a
non-GAAP
financial measure Blackstone believes is useful to stockholders as an indicator of potential future realized performance revenues based on the current investment portfolio of the funds and vehicles we manage. Net Accrued Performance Revenues represents the accrued performance revenues receivable by Blackstone, net of the related accrued performance compensation payable by Blackstone, excluding performance revenues that have been realized but not yet distributed as of the reporting date and clawback amounts, if any. Net Accrued Performance Revenues is derived from and reconciled to, but not
equivalent to, its most directly comparable GAAP measure of Investments. See “—
Non-GAAP
Financial Measures” for our reconciliation of Net Accrued Performance Revenues and Note 2. “Summary of Significant Accounting Policies — Equity Method Investments” in the “Notes to Consolidated Financial Statements” in “— Item 1. Financial Statements” for additional information on the calculation of Investments — Accrued Performance Allocations.
Operating Metrics
The alternative asset management business is primarily based on managing third party capital and does not require substantial capital investment to support rapid growth. Since our inception, we have developed and used various key operating metrics to assess and monitor the operating performance of our various alternative asset management businesses in order to monitor the effectiveness of our value creating strategies.
Total and
Fee-Earning
Assets Under Management
“Total Assets Under Management” refers to the assets we manage. We believe this measure is useful to stockholders as it represents the total capital for which we provide investment management services. Our Total Assets Under Management equals the sum of:
| (a) | the fair value of the investments held by our carry funds and our side-by-side and co-investment entities managed by us plus the capital that we are entitled to call from investors in those funds and entities pursuant to the terms of their respective capital commitments, including capital commitments to funds that have yet to commence their investment periods, |
|---|
| (b) | the net asset value of (1) our hedge funds, real estate debt carry funds, BPP, certain co-investments managed by us, certain credit-focused funds, and our Hedge Fund Solutions drawdown funds (plus, in each case, the capital that we are entitled to call from investors in those funds, including commitments yet to commence their investment periods), and (2) our funds of hedge funds, our Hedge Fund Solutions registered investment companies, BREIT, and BEPIF, |
|---|
| (c) | the invested capital, fair value or net asset value of assets we manage pursuant to separately managed accounts, |
|---|
| (d) | the amount of debt and equity outstanding for our CLOs during the reinvestment period, |
|---|
| (e) | the aggregate par amount of collateral assets, including principal cash, for our CLOs after the reinvestment period, |
|---|
| (f) | the gross or net amount of assets (including leverage where applicable) for our credit-focused registered investment companies and BDCs, |
|---|
| (g) | the fair value of common stock, preferred stock, convertible debt, term loans or similar instruments issued by BXMT, and |
|---|
| (h) | borrowings under and any amounts available to be borrowed under certain credit facilities of our funds. |
|---|
Our carry funds are commitment-based drawdown structured funds that do not permit investors to redeem their interests at their election. Our funds of hedge funds, hedge funds, funds structured like hedge funds and other open-ended funds in our Real Estate, Credit & Insurance and Hedge Fund Solutions segments generally have structures that afford an investor the right to withdraw or redeem their interests on a periodic basis (for example, annually, quarterly or monthly), typically with 2 to 95 days’ notice, depending on the fund and the liquidity profile of the underlying assets. In our Perpetual Capital vehicles where redemption rights exist, Blackstone has the ability to fulfill redemption requests only (a) in Blackstone’s or the vehicles’ board’s discretion, as applicable, or (b) to the extent there is sufficient new capital. Investment advisory agreements related to certain separately managed accounts in our Credit & Insurance and Hedge Fund Solutions segments, excluding our BIS separately managed accounts, may generally be terminated by an investor on 30 to 90 days’ notice. Our BIS separately managed accounts can generally only be terminated for long-term underperformance, cause and certain other limited circumstances, in each case subject to Blackstone’s right to cure.
“Fee-Earning
Assets Under Management” refers to the assets we manage on which we derive management fees and/or performance revenues. We believe this measure is useful to stockholders as it provides insight into the capital base upon which we can earn management fees and/or performance revenues. Our
Fee-Earning
Assets Under Management equals the sum of:
| (a) | for our Private Equity segment funds, Real Estate segment carry funds including certain BREDS funds, and certain Hedge Fund Solutions funds, the amount of capital commitments, remaining invested capital, fair value, net asset value or par value of assets held, depending on the fee terms of the fund, |
|---|
| (b) | for our credit-focused carry funds, the amount of remaining invested capital (which may include leverage) or net asset value, depending on the fee terms of the fund, |
|---|
| (c) | the remaining invested capital or fair value of assets held in co-investment vehicles managed by us on which we receive fees, |
|---|
| (d) | the net asset value of our funds of hedge funds, hedge funds, BPP, certain co-investments managed by us, certain registered investment companies, BREIT, BEPIF, and certain of our Hedge Fund Solutions drawdown funds, |
|---|
| (e) | the invested capital, fair value of assets or the net asset value we manage pursuant to separately managed accounts, |
|---|
| (f) | the net proceeds received from equity offerings and accumulated distributable earnings of BXMT, subject to certain adjustments, |
|---|
| (g) | the aggregate par amount of collateral assets, including principal cash, of our CLOs, and |
|---|
| (h) | the gross amount of assets (including leverage) or the net assets (plus leverage where applicable) for certain of our credit-focused registered investment companies and BDCs. |
|---|
Each of our segments may include certain
Fee-Earning
Assets Under Management on which we earn performance revenues but not management fees.
Our calculations of Total Assets Under Management and
Fee-Earning
Assets Under Management may differ from the calculations of other asset managers, and as a result this measure may not be comparable to similar measures presented by other asset managers. In addition, our calculation of Total Assets Under Management includes commitments to, and the fair value of, invested capital in our funds from Blackstone and our personnel, regardless of whether such commitments or invested capital are subject to fees. Our definitions of Total Assets Under Management and
Fee-Earning
Assets Under Management are not based on any definition of Total Assets Under Management and
Fee-Earning
Assets Under Management that is set forth in the agreements governing the investment funds that we manage.
For our carry funds, Total Assets Under Management includes the fair value of the investments held and uncalled capital commitments, whereas
Fee-Earning
Assets Under Management may include the total amount of capital commitments or the remaining amount of invested capital at cost depending on whether the investment period has expired or as specified by the fee terms of the fund. As such, in certain carry funds
Fee-Earning
Assets Under Management may be greater than Total Assets Under Management when the aggregate fair value of the remaining investments is less than the cost of those investments.
Perpetual Capital
Perpetual Capital refers to the component of assets under management with an indefinite term, that is not in liquidation, and for which there is no requirement to return capital to investors through redemption requests in the ordinary course of business, except where funded by new capital inflows. Perpetual Capital includes
co-investment
capital with an investor right to convert into Perpetual Capital. We believe this measure is useful to stockholders as it represents capital we manage that has a longer duration and the ability to generate recurring revenues in a different manner than traditional fund structures.
Dry Powder
Dry Powder represents the amount of capital available for investment or reinvestment, including general partner and employee capital, and is an indicator of the capital we have available for future investments. We believe this measure is useful to stockholders as it provides insight into the extent to which capital is available for Blackstone to deploy capital into investment opportunities as they arise.
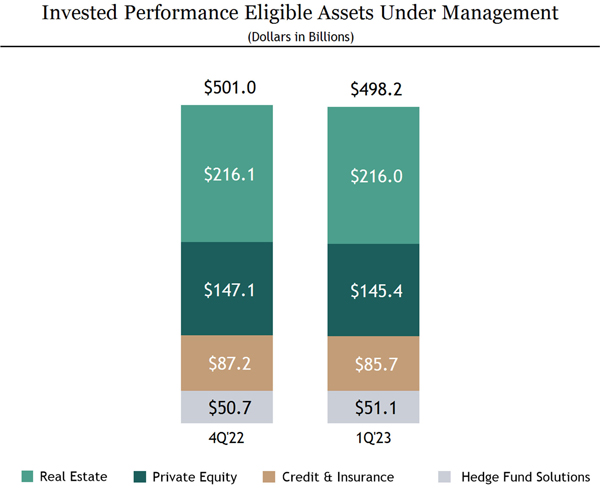
Invested Performance Eligible Assets Under Management
Invested Performance Eligible Assets Under Management represents invested capital at fair value, including capital closed for funds whose investment period has not yet commenced, on which performance revenues could be earned if certain hurdles are met. We believe Invested Performance Eligible Assets Under Management is useful to stockholders as it provides insight into the capital deployed that has the potential to generate performance revenues.
Consolidated Results of Operations
Following is a discussion of our consolidated results of operations. For a more detailed discussion of the factors that affected the results of our four business segments (which are presented on a basis that deconsolidates the investment funds, eliminates
non-controlling
ownership interests in Blackstone’s consolidated operating partnerships and removes the amortization of intangibles assets and Transaction-Related Charges) in these periods, see “— Segment Analysis” below.
The following table sets forth information regarding our consolidated results of operations and certain key operating metrics for the three months ended March 31, 2023 and 2022:
| Three Months Ended | ||||||||||||||||
| March 31, | 2023 vs. 2022 | |||||||||||||||
| 2023 | 2022 | $ | % | |||||||||||||
| (Dollars in Thousands) | ||||||||||||||||
| Revenues | ||||||||||||||||
| Management and Advisory Fees, Net | $ | 1,658,315 | $ | 1,475,936 | $ | 182,379 | 12 | % | ||||||||
| Incentive Fees | 142,876 | 104,489 | 38,387 | 37 | % | |||||||||||
| Investment Income (Loss) | ||||||||||||||||
| Performance Allocations | ||||||||||||||||
| Realized | 646,894 | 1,766,386 | (1,119,492 | ) | -63 | % | ||||||||||
| Unrealized | (759,212 | ) | 1,293,050 | (2,052,262 | ) | n/m | ||||||||||
| Principal Investments | ||||||||||||||||
| Realized | 108,058 | 285,104 | (177,046 | ) | -62 | % | ||||||||||
| Unrealized | (491,417 | ) | 73,961 | (565,378 | ) | n/m | ||||||||||
| Total Investment Income (Loss) | (495,677 | ) | 3,418,501 | (3,914,178 | ) | n/m | ||||||||||
| Interest and Dividend Revenue | 90,485 | 54,485 | 36,000 | 66 | % | |||||||||||
| Other | (14,154 | ) | 72,869 | (87,023 | ) | n/m | ||||||||||
| Total Revenues | 1,381,845 | 5,126,280 | (3,744,435 | ) | -73 | % | ||||||||||
| Expenses | ||||||||||||||||
| Compensation and Benefits | ||||||||||||||||
| Compensation | 716,285 | 656,505 | 59,780 | 9 | % | |||||||||||
| Incentive Fee Compensation | 63,281 | 41,019 | 22,262 | 54 | % | |||||||||||
| Performance Allocations Compensation | ||||||||||||||||
| Realized | 296,794 | 717,601 | (420,807 | ) | -59 | % | ||||||||||
| Unrealized | (313,249 | ) | 472,284 | (785,533 | ) | n/m | ||||||||||
| Total Compensation and Benefits | 763,111 | 1,887,409 | (1,124,298 | ) | -60 | % | ||||||||||
| General, Administrative and Other | 273,394 | 240,674 | 32,720 | 14 | % | |||||||||||
| Interest Expense | 104,441 | 66,747 | 37,694 | 56 | % | |||||||||||
| Fund Expenses | 48,399 | 2,192 | 46,207 | n/m | ||||||||||||
| Total Expenses | 1,189,345 | 2,197,022 | (1,007,677 | ) | -46 | % | ||||||||||
| Other Income | ||||||||||||||||
| Change in Tax Receivable Agreement Liability | (5,208 | ) | 761 | (5,969 | ) | n/m | ||||||||||
| Net Gains from Fund Investment Activities | 71,064 | 50,876 | 20,188 | 40 | % | |||||||||||
| Total Other Income | 65,856 | 51,637 | 14,219 | 28 | % | |||||||||||
| Income Before Provision for Taxes | 258,356 | 2,980,895 | (2,722,539 | ) | -91 | % | ||||||||||
| Provision for Taxes | 47,675 | 483,281 | (435,606 | ) | -90 | % | ||||||||||
| Net Income | 210,681 | 2,497,614 | (2,286,933 | ) | -92 | % | ||||||||||
| Net Income (Loss) Attributable to Redeemable Non-Controlling Interests in Consolidated Entities | (6,700 | ) | 5,052 | (11,752 | ) | n/m | ||||||||||
| Net Income Attributable to Non-Controlling Interests in Consolidated Entities | 74,869 | 216,375 | (141,506 | ) | -65 | % | ||||||||||
| Net Income Attributable to Non-Controlling Interests in Blackstone Holdings | 56,700 | 1,059,313 | (1,002,613 | ) | -95 | % | ||||||||||
| Net Income Attributable to Blackstone Inc. | $ | 85,812 | $ | 1,216,874 | $ | (1,131,062 | ) | -93 | % | |||||||
n/m Not meaningful.
Three Months Ended March 31, 2023 Compared to Three Months Ended March 31, 2022
Revenues
Revenues were $1.4 billion for the three months ended March 31, 2023, a decrease of $3.7 billion compared to $5.1 billion for the three months ended March 31, 2022. The decrease in Revenues was primarily attributable to a decrease of $3.9 billion in Investment Income (Loss), which is composed of decreases of $2.6 billion in Unrealized Investment Income (Loss) and $1.3 billion in Realized Investment Income Loss, partially offset by an increase of $182.4 million in Management and Advisory Fees, Net.
The $2.6 billion decrease in Unrealized Investment Income was primarily attributable to net unrealized depreciation of investments in the three months ended March 31, 2023 compared to net unrealized appreciation of investment holdings in the three months ended March 31, 2022 in the segments. Principal drivers of the decrease were:
| • | A decrease of $1.7 billion in our Real Estate segment, primarily attributable to net unrealized depreciation of investments in BREP and Core+ in the three months ended March 31, 2023 compared to the three months ended March 31, 2022. BREP and Core+ carrying value decreased 0.4% and 1.6%, respectively, in the three months ended March 31, 2023 compared to increases of 10.3% and 7.9%, respectively, in the three months ended March 31, 2022. |
|---|
| • | A decrease of $433.7 million in our Private Equity segment was primarily attributable to net unrealized depreciation of investments in BIP and lower net unrealized appreciation in Strategic Partners in the three months ended March 31, 2023 compared to net unrealized appreciation of investments in the three months ended March 31, 2022. BIP and Strategic Partners carrying value decreased 2.6% and increased 1.4%, respectively, in the three months ended March 31, 2023 compared to increases of 13.8% and 8.5%, respectively, in the three months ended March 31, 2022. |
|---|
| • | A decrease of $336.4 million in our Credit & Insurance segment was primarily attributable to an unrealized loss on the ownership of Corebridge common stock based on the publicly traded price as of March 31, 2023. |
|---|
| • | The decrease of $55.4 million in our Hedge Fund Solutions segment was primarily attributable to lower net unrealized appreciation of investment holdings in liquid and specialized solutions in the three months ended March 31, 2023 compared to the three months ended March 31, 2022. |
|---|
The $1.3 billion decrease in Realized Investment Income was primarily attributable to lower realized gains in our Real Estate segment.
The $182.4 million increase in Management and Advisory Fees, Net was primarily due to increases in our Real Estate and Private Equity segments of $95.8 million and $58.1 million, respectively. The increase in our Real Estate segment was primarily due to
Fee-Earning
Assets Under Management growth in BREP, Core+ real estate and BREDS. The increase in our Private Equity segment was primarily due to an increase in Strategic Partners and BIP.
Expenses
Expenses were $1.2 billion for the three months ended March 31, 2023, a decrease of $1.0 billion compared to $2.2 billion for the three months ended March 31, 2022. The decrease was primarily attributable to decreases of $1.1 billion in Total Compensation and Benefits, which is composed of a decrease of $1.2 billion in Performance Allocations Compensation and an increase of $59.8 million in Compensation. The decrease in Performance Allocations Compensation was primarily due to the decrease in Investment Income (Loss) – Performance Allocations, on which a portion of Performance Allocations Compensation is based.
Other Income
Other Income was $65.9 million for the three months ended March 31, 2023, an increase of $14.2 million compared to $51.6 million for the three months ended March 31, 2022. The increase in Other Income was primarily due to an increase of $20.2 million in Net Gains from Fund Investment Activities, partially offset by a decrease of $6.0 million in Change in Tax Receivable Agreement Liability.
The increase in Net Gains from Fund Investment Activities was principally driven by increases of $51.3 million and $20.5 million in our Private Equity and Hedge Fund Solutions segments, respectively, partially offset by a decrease of $56.9 million in our Real Estate segment. The increases in our Private Equity and Hedge Fund Solutions segments were primarily due to unrealized appreciation of investments in our consolidated private equity and hedge fund solutions funds, as applicable. The decrease in our Real Estate segment was primarily due to unrealized depreciation of investments in our consolidated real estate funds.
The decrease in Change in Tax Receivable Agreement Liability was primarily attributable to a change in our state tax apportionment.
Provision (Benefit) for Taxes
Blackstone’s Provision (Benefit) for Taxes for the three months ended March 31, 2023 was $47.7 million, a decrease of $435.6 million, compared to $483.3 million for the three months ended March 31, 2022. This resulted in an effective tax rate of 18.5% and 16.2%, based on our Income Before Provision (Benefit) for Taxes of $258.4 million and $3.0 billion for the three months ended March 31, 2023 and 2022, respectively.
The increase in Blackstone’s effective tax rate for the three months ended March 31, 2023, compared to the three months ended March 31, 2022, resulted primarily from recent increases in Blackstone’s state tax provisions for the jurisdictions in which it operates.
Blackstone expects to have a corporate alternative minimum tax (“CAMT”) liability for the year ending December 31, 2023 based on the recently-enacted Inflation Reduction Act. Blackstone will continue to assess the overall impact to its Provision for Income Tax upon the issuance of applicable additional guidance by the U.S. Treasury Department related to interpretations of CAMT. For the three months ended March 31, 2023, there is no meaningful CAMT impact reflected in the Provision for Income Taxes given current year tax payments made under CAMT are permitted to be carried forward and used as credits in future years resulting in a deferred tax benefit.
Additional information regarding our income taxes can be found in Note 13. “Income Taxes” in the “Notes to Condensed Consolidated Financial Statements” in “Part I. Item 1. Financial Statements” of this filing.
Non-Controlling
Interests in Consolidated Entities
The Net Income Attributable to Redeemable
Non-Controlling
Interests in Consolidated Entities and Net Income Attributable to
Non-Controlling
Interests in Consolidated Entities is attributable to the consolidated Blackstone Funds. The amounts of these items vary directly with the performance of the consolidated Blackstone Funds and largely eliminate the amount of Other Income (Loss) – Net Gains (Losses) from Fund Investment Activities from the Net Income (Loss) Attributable to Blackstone Inc.
Net Income Attributable to
Non-Controlling
Interests in Blackstone Holdings is derived from the Income Before Provision (Benefit) for Taxes at the Blackstone Holdings level, excluding the Net Gains (Losses) from Fund Investment Activities and the percentage allocation of the income between Blackstone personnel and others who are limited partners of Blackstone Holdings and Blackstone after considering any contractual arrangements that govern the allocation of income such as fees allocable to Blackstone.
For the three months ended March 31, 2023 and 2022, the Net Income Before Taxes allocated to Blackstone personnel and others who are limited partners of Blackstone Holdings was 39.4% and 39.8%, respectively. The decrease of 0.4% was primarily due to the conversion of Blackstone Holdings Partnership Units to shares of common stock and the vesting of shares of common stock.
The Other Income (Loss) — Change in Tax Receivable Agreement Liability was entirely allocated to Blackstone Inc.
Operating Metrics
Total and
Fee-Earning
Assets Under Management
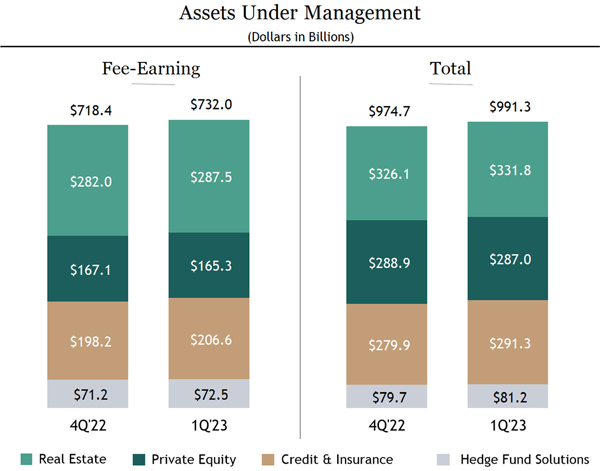
The following graphs and tables summarize the
Fee-Earning
Assets Under Management by Segment and Total Assets Under Management by Segment, followed by a rollforward of activity for the three months ended March 31, 2023 and 2022. For a description of how Assets Under Management and
Fee-Earning
Assets Under Management are determined, please see “— Key Financial Measures and Indicators — Operating Metrics — Total and
Fee-Earning
Assets Under Management.”
| Note: | Totals may not add due to rounding. |
|---|
| Three Months Ended | ||||||||||||||||||||||||||||||||||||||||
| March 31, 2023 | March 31, 2022 | |||||||||||||||||||||||||||||||||||||||
| Private | Credit & | Hedge Fund | Private | Credit & | Hedge Fund | |||||||||||||||||||||||||||||||||||
| Real Estate | Equity | Insurance | Solutions | Total | Real Estate | Equity | Insurance | Solutions | Total | |||||||||||||||||||||||||||||||
| (Dollars in Thousands) | ||||||||||||||||||||||||||||||||||||||||
| Fee-Earning Assets Under Management | ||||||||||||||||||||||||||||||||||||||||
| Balance, Beginning of Period | $ | 281,967,153 | $ | 167,082,852 | $ | 198,162,931 | $ | 71,173,952 | $ | 718,386,888 | $ | 221,476,699 | $ | 156,556,959 | $ | 197,900,832 | $ | 74,034,568 | $ | 649,969,058 | ||||||||||||||||||||
| Inflows (a) | 15,715,717 | 1,779,857 | 12,412,934 | 2,058,840 | 31,967,348 | 22,791,041 | 5,449,946 | 12,949,112 | 4,170,080 | 45,360,179 | ||||||||||||||||||||||||||||||
| Outflows (b) | (3,741,724 | ) | (144,634 | ) | (3,858,030 | ) | (1,383,002 | ) | (9,127,390 | ) | (4,289,575 | ) | (872,597 | ) | (3,072,247 | ) | (2,582,444 | ) | (10,816,863 | ) | ||||||||||||||||||||
| Net Inflows | 11,973,993 | 1,635,223 | 8,554,904 | 675,838 | 22,839,958 | 18,501,466 | 4,577,349 | 9,876,865 | 1,587,636 | 34,543,316 | ||||||||||||||||||||||||||||||
| Realizations (c) | (4,493,945 | ) | (2,943,918 | ) | (3,231,450 | ) | (324,743 | ) | (10,994,056 | ) | (5,292,057 | ) | (2,688,240 | ) | (3,495,939 | ) | (362,867 | ) | (11,839,103 | ) | ||||||||||||||||||||
| Market Activity (d)(g) | (1,949,895 | ) | (430,652 | ) | 3,136,537 | 984,629 | 1,740,619 | 5,935,345 | 2,500,128 | (3,591,933 | ) | 426,491 | 5,270,031 | |||||||||||||||||||||||||||
| Balance, End of Period (e) | $ | 287,497,306 | $ | 165,343,505 | $ | 206,622,922 | $ | 72,509,676 | $ | 731,973,409 | $ | 240,621,453 | $ | 160,946,196 | $ | 200,689,825 | $ | 75,685,828 | $ | 677,943,302 | ||||||||||||||||||||
| Increase (Decrease) | $ | 5,530,153 | $ | (1,739,347 | ) | $ | 8,459,991 | $ | 1,335,724 | $ | 13,586,521 | $ | 19,144,754 | $ | 4,389,237 | $ | 2,788,993 | $ | 1,651,260 | $ | 27,974,244 | |||||||||||||||||||
| Increase (Decrease) | 2 | % | -1 | % | 4 | % | 2 | % | 2 | % | 9 | % | 3 | % | 1 | % | 2 | % | 4 | % | ||||||||||||||||||||
| Annualized Base Management Fee Rate (f) | 0.99 | % | 1.09 | % | 0.65 | % | 0.76 | % | 0.89 | % | 1.00 | % | 1.06 | % | 0.59 | % | 0.78 | % | 0.87 | % |
| Three Months Ended | ||||||||||||||||||||||||||||||||||||||||
| March 31, 2023 | March 31, 2022 | |||||||||||||||||||||||||||||||||||||||
| Private | Credit & | Hedge Fund | Private | Credit & | Hedge Fund | |||||||||||||||||||||||||||||||||||
| Real Estate | Equity | Insurance | Solutions | Total | Real Estate | Equity | Insurance | Solutions | Total | |||||||||||||||||||||||||||||||
| (Dollars in Thousands) | ||||||||||||||||||||||||||||||||||||||||
| Total Assets Under Management | ||||||||||||||||||||||||||||||||||||||||
| Balance, Beginning of Period | $ | 326,146,904 | $ | 288,902,142 | $ | 279,908,030 | $ | 79,716,001 | $ | 974,673,077 | $ | 279,474,105 | $ | 261,471,007 | $ | 258,622,467 | $ | 81,334,141 | $ | 880,901,720 | ||||||||||||||||||||
| Inflows (a) | 17,045,929 | 4,556,005 | 16,589,263 | 2,168,497 | 40,359,694 | 17,043,319 | 9,233,637 | 19,582,685 | 4,015,331 | 49,874,972 | ||||||||||||||||||||||||||||||
| Outflows (b) | (4,028,547 | ) | (632,468 | ) | (4,750,649 | ) | (1,403,111 | ) | (10,814,775 | ) | (2,295,695 | ) | (1,420,463 | ) | (3,519,958 | ) | (2,768,093 | ) | (10,004,209 | ) | ||||||||||||||||||||
| Net Inflows | 13,017,382 | 3,923,537 | 11,838,614 | 765,386 | 29,544,919 | 14,747,624 | 7,813,174 | 16,062,727 | 1,247,238 | 39,870,763 | ||||||||||||||||||||||||||||||
| Realizations (c) | (4,423,681 | ) | (8,620,785 | ) | (4,576,693 | ) | (330,677 | ) | (17,951,836 | ) | (9,537,783 | ) | (7,725,833 | ) | (5,533,849 | ) | (438,445 | ) | (23,235,910 | ) | ||||||||||||||||||||
| Market Activity (d)(h) | (2,943,267 | ) | 2,843,547 | 4,098,895 | 1,028,261 | 5,027,436 | 13,512,837 | 6,398,003 | (2,709,564 | ) | 753,893 | 17,955,169 | ||||||||||||||||||||||||||||
| Balance, End of Period (e) | $ | 331,797,338 | $ | 287,048,441 | $ | 291,268,846 | $ | 81,178,971 | $ | 991,293,596 | $ | 298,196,783 | $ | 267,956,351 | $ | 266,441,781 | $ | 82,896,827 | $ | 915,491,742 | ||||||||||||||||||||
| Increase (Decrease) | $ | 5,650,434 | $ | (1,853,701 | ) | $ | 11,360,816 | $ | 1,462,970 | $ | 16,620,519 | $ | 18,722,678 | $ | 6,485,344 | $ | 7,819,314 | $ | 1,562,686 | $ | 34,590,022 | |||||||||||||||||||
| Increase (Decrease) | 2 | % | -1 | % | 4 | % | 2 | % | 2 | % | 7 | % | 2 | % | 3 | % | 2 | % | 4 | % |
| (a) | Inflows include contributions, capital raised, other increases in available capital (recallable capital and increased side-by-side commitments), purchases, inter-segment allocations and acquisitions. |
|---|
| (b) | Outflows represent redemptions, client withdrawals and decreases in available capital (expired capital, expense drawdowns and decreased side-by-side commitments). |
|---|
| (c) | Realizations represent realization proceeds from the disposition or other monetization of assets, current income or capital returned to investors from CLOs. |
|---|
| (d) | Market Activity includes realized and unrealized gains (losses) on portfolio investments and the impact of foreign exchange rate fluctuations. |
|---|
| (e) | Total and Fee-Earning Assets Under Management are reported in the segment where the assets are managed. |
|---|
| (f) | Annualized Base Management Fee Rate represents annualized year to date Base Management Fee divided by the average of the beginning of year and each quarter end’s Fee-Earning Assets Under Management in the reporting period. |
|---|
| (g) | For the three months ended March 31, 2023, the impact to Fee-Earning Assets Under Management due to foreign exchange rate fluctuations was $662.2 million, $27.8 million, $314.6 million, $(112.6) million and $892.1 million for the Real Estate, Private Equity, Credit & Insurance, Hedge Fund Solutions and Total segments, respectively. For the three months ended March 31, 2022, such impact was $(977.5) million, $(359.5) million and ($1.4) billion for the Real Estate, Credit & Insurance and Total segments, respectively. |
|---|
| (h) | For the three months ended March 31, 2023, the impact to Total Assets Under Management due to foreign exchange rate fluctuations was $845.2 million, $695.4 million, $386.2 million, $(105.0) million and $1.8 billion for the Real Estate, Private Equity, Credit & Insurance, Hedge Fund Solutions and Total segments, re spectively. For the three months ended March 31, 2022, such impact was $(1.8) billion, $(517.4) million, $(423.9) million and ($2.8) billion for the Real Estate, Private Equity, Credit & Insurance and Total segments, respectively. |
|---|
Fee-Earning
Assets Under Management
Fee-Earning
Assets Under Management were $732.0 billion at March 31, 2023, an increase of $13.6 billion compared to $718.4 billion at December 31, 2022. The net increase was due to:
| • | In our Real Estate segment, an increase of $5.5 billion from $282.0 billion at December 31, 2022 to $287.5 billion at March 31, 2023. The net increase was due to inflows of $15.7 billion, offset by realizations of $4.5 billion, outflows of $3.7 billion and market depreciation of $1.9 billion. |
|---|
| o | Inflows were driven by $7.4 billion from BREIT, including $4.5 billion from the Regents of the University of California (“UC Investments”), $5.3 billion from BREDS, primarily due to allocations of insurance capital, $2.0 billion from BREP and co-investment, primarily from BREP X and $929.1 million from BPP and co-investment. |
|---|
| o | Realizations were driven by $2.4 billion from BREIT, $982.1 million from BREDS, $788.9 million from BPP and co-investment and $306.8 million from BREP and co-investment. |
|---|
| o | Outflows were driven by $3.4 billion from BREIT and $274.4 million from BPP and co-investment, both primarily from repurchases. |
|---|
| o | Market depreciation was driven by depreciation of $2.2 billion from Core+ real estate (which reflected $496.6 million of foreign exchange appreciation), partially offset by market appreciation of $141.6 million from BREP and co-investment (which reflected $141.6 million of foreign exchange appreciation) and $138.8 million from BREDS (which reflected $23.9 million of foreign exchange appreciation). |
|---|
| • | In our Private Equity segment, a decrease of $1.7 billion from $167.1 billion at December 31, 2022 to $165.3 billion at March 31, 2023. The net decrease was due to realizations of $2.9 billion, market depreciation of $430.7 million and outflows of $144.6 million, offset by inflows of $1.8 billion. |
|---|
| o | Realizations were driven by $1.1 billion from corporate private equity, $889.9 million from Tactical Opportunities, $649.7 million from Strategic Partners and $267.1 million from BIP. |
|---|
| o | Market depreciation was driven by deprecation of $539.8 million from BIP (which reflected $44.2 million of foreign exchange appreciation), partially offset by market appreciation of $96.5 million from Strategic Partners. |
|---|
| o | Outflows were driven by $215.3 million from Tactical Opportunities. |
|---|
| o | Inflows were driven by $762.2 million from BIP, $646.7 million from Strategic Partners and $563.4 million from Tactical Opportunities. |
|---|
| • | In our Credit & Insurance segment, an increase of $8.5 billion from $198.2 billion at December 31, 2022 to $206.6 billion at March 31, 2023. The net increase was due to inflows of $12.4 billion and market appreciation of $3.1 billion, offset by outflows of $3.9 billion, and realizations of $3.2 billion. |
|---|
| o | Inflows were driven by $4.1 billion from CLOs, $3.5 billion from liquid credit strategies, $1.9 billion from direct lending and $1.4 billion from asset-based finance. |
|---|
| o | Market appreciation was driven by appreciation of $1.5 billion from liquid credit strategies (which reflected $19.3 million of foreign exchange appreciation), $988.1 million from direct lending (which reflected $112.5 million of foreign exchange appreciation) and $247.6 million from private placement credit. |
|---|
| o | Outflows were driven by $2.2 billion from liquid credit strategies, $931.8 million from direct lending and $318.5 million from MLP strategies. |
|---|
| o | Realizations were driven by $1.5 billion from direct lending, $572.2 million from mezzanine funds and $406.3 million from our energy strategies. |
|---|
| • | In our Hedge Fund Solutions segment, an increase of $1.3 billion from $71.2 billion at December 31, 2022 to $72.5 billion at March 31, 2023. The net increase was due to inflows of $2.1 billion and market appreciation of $984.6 million, offset by outflows of $1.4 billion and realizations of $324.7 million. |
|---|
| o | Inflows were driven by $1.2 billion from customized solutions, $727.5 million from liquid and specialized solutions and $99.4 million from commingled products. |
|---|
| o | Market appreciation was driven by appreciation of $538.2 million from liquid and specialized solutions (which reflected $4.2 million of foreign exchange appreciation), $244.3 million from customized solutions (which reflected $162.0 million of foreign exchange depreciation) and $202.0 million from commingled products (which reflected $45.2 million of foreign exchange appreciation). |
|---|
| o | Outflows were driven by $748.6 million from customized solutions, $534.1 million from liquid and specialized solutions and $100.3 million from commingled products. |
|---|
| o | Realizations were driven by $324.7 million from liquid and specialized solutions. |
|---|
Total Assets Under Management
Total Assets Under Management were $991.3 billion at March 31, 2023, an increase of $16.6 billion compared to $974.7 billion at December 31, 2022. The net increase was due to:
| • | In our Real Estate segment, an increase of $5.7 billion from $326.1 billion at December 31, 2022 to $331.8 billion at March 31, 2023. The net increase was due to inflows of $17.0 billion, offset by realizations of $4.4 billion, outflows of $4.0 billion and market depreciation of $2.9 billion. |
|---|
| o | Inflows were driven by $7.4 billion from BREIT, including $4.5 billion from UC Investments, $7.2 billion from BREDS, primarily due to allocations of insurance capital and BREDS V, $1.8 billion from BREP and co-investment, primarily from BREP X (bringing total capital commitments in BREP X to $30.4 billion), and $507.4 million from BPP and co-investment. |
|---|
| o | Realizations were driven by $2.4 billion from BREIT, $814.4 million from BPP and co-investment, $671.0 million from BREDS and $515.9 million from BREP and co-investment. |
|---|
| o | Outflows were driven by $3.4 billion from BREIT repurchases, $287.2 million from BPP and co-investment, primarily from repurchases, and $225.5 million from BREDS. |
|---|
| o | Market depreciation was driven by depreciation of $2.2 billion from Core+ real estate (which reflected $515.8 million of foreign exchange appreciation), $621.0 million from BREDS (which reflected $31.0 million of foreign exchange appreciation) and $81.5 million from BREP and co-investment (which reflected $298.2 million of foreign exchange appreciation). |
|---|
| • | In our Private Equity segment, a decrease of $1.9 billion from $288.9 billion at December 31, 2022 to $287.0 billion at March 31, 2023. The net decrease was due to realizations of $8.6 billion and outflows of $632.5 million, offset by inflows of $4.6 billion and market appreciation of $2.8 billion. |
|---|
| o | Realizations were driven by $4.6 billion from corporate private equity, $1.9 billion from Tactical Opportunities and $1.6 billion from Strategic Partners. |
|---|
| o | Outflows were driven by $220.3 million from Strategic Partners, $214.5 million from corporate private equity and $179.2 million from Tactical Opportunities. |
|---|
| o | Inflows were driven by $1.7 billion from BIP, $1.4 billion from corporate private equity, $903.9 million from Strategic Partners and $575.8 million from BXG. |
|---|
| o | Market appreciation was driven by appreciation of $2.2 billion from corporate private equity (which reflected $521.8 million of foreign exchange appreciation) and $546.7 million from Strategic Partners (which reflected $17.5 million of foreign exchange depreciation). |
|---|
| • | In our Credit & Insurance segment, an increase of $11.4 billion from $279.9 billion at December 31, 2022 to $291.3 billion at March 31, 2023. The net increase was due to inflows of $16.6 billion and market appreciation of $4.1 billion, offset by outflows of $4.8 billion and realizations of $4.6 billion. |
|---|
| o | Inflows were driven by $6.3 billion from direct lending, $4.1 billion from CLOs, $2.6 billion from liquid credit strategies, $1.8 billion from asset-based finance and $1.3 billion from our energy strategies. |
|---|
| o | Market appreciation was driven by appreciation of $1.6 billion from liquid credit strategies (which reflected $71.7 million of foreign exchange appreciation), $1.4 billion from direct lending (which reflected $105.7 million of foreign exchange appreciation), $247.6 million from private placement credit and $227.0 million from MLP strategies. |
|---|
| o | Outflows were driven by $2.4 billion from liquid credit strategies, $1.3 billion from direct lending and $466.0 million from asset-based finance. |
|---|
| o | Realizations were driven by $1.9 billion from direct lending, $1.1 billion from mezzanine funds and $771.9 million from our energy strategies. |
|---|
| • | In our Hedge Fund Solutions segment, an increase of $1.5 billion from $79.7 billion at December 31, 2022 to $81.2 billion at March 31, 2023. The net increase was due to inflows of $2.2 billion and market appreciation of $1.0 billion, offset by outflows of $1.4 billion and realizations of $330.7 million. |
|---|
| o | Inflows were driven by $1.2 billion from customized solutions, $774.4 million from liquid and specialized solutions and $145.5 million from commingled products. |
|---|
| o | Market appreciation was driven by appreciation of $562.3 million from liquid and specialized solutions (which reflected $3.4 million of foreign exchange appreciation), $239.3 million from customized solutions (which reflected $163.3 million of foreign exchange depreciation) and $226.6 million from commingled products (which reflected $55.0 million of foreign exchange appreciation). |
|---|
| o | Outflows were driven by $762.6 million from customized solutions, $539.9 million from liquid and specialized solutions and $100.6 million from commingled products. |
|---|
| o | Realizations were driven by $330.7 million from liquid and specialized solutions. |
|---|
Total Assets Under Management inflows in our Credit & Insurance segment direct lending funds exceed the
Fee-Earning
Assets Under Management because Total Assets Under Management inflows are reported at their gross value while, for certain funds,
Fee-Earning
Assets Under Management are reported as net assets, which is the basis on which fees are charged.
Total Assets Under Management realizations in our BREP and
co-investment
funds and our Private Equity segment generally represents the total proceeds and typically exceeds the
Fee-Earning
Assets Under Management realizations.
Fee-Earning
Assets Under Management generally represents only the invested capital.
Dry Powder
The following presents our Dry Powder as of quarter end of each period:

| Note: | Totals may not add due to rounding. |
|---|
| (a) | Represents illiquid drawdown funds, a component of Perpetual Capital and fee-paying co-investments; includes fee-paying third party capital as well as general partner and employee capital that does not earn fees. Amounts are reduced by outstanding capital commitments, for which capital has not yet been invested. |
|---|
Net Accrued Performance Revenues
The following table presents the Accrued Performance Revenues, net of performance compensation, of the Blackstone Funds as of March 31, 2023 and 2022. Net Accrued Performance Revenues presented do not include clawback amounts, if any, which are disclosed in Note 17. “Commitments and Contingencies — Contingencies — Contingent Obligations (Clawback)” in the “Notes to Condensed Consolidated Financial Statements” in “Part I. Item 1. Financial Statements” of this filing. See “—
Non-GAAP
Financial Measures” for our reconciliation of Net Accrued Performance Revenues.
| March 31, | ||||||||
| 2023 | 2022 | |||||||
| (Dollars in Millions) | ||||||||
| Real Estate | ||||||||
| BREP IV | $ | 6 | $ | 6 | ||||
| BREP V | 4 | 1 | ||||||
| BREP VI | 19 | 38 | ||||||
| BREP VII | 86 | 527 | ||||||
| BREP VIII | 717 | 990 | ||||||
| BREP IX | 1,015 | 1,139 | ||||||
| BREP Europe IV | 43 | 93 | ||||||
| BREP Europe V | 28 | 548 | ||||||
| BREP Europe VI | 68 | 301 | ||||||
| BREP Asia I | 104 | 126 | ||||||
| BREP Asia II | 37 | 189 | ||||||
| BPP | 518 | 734 | ||||||
| BEPIF | — | 6 | ||||||
| BREDS | 6 | 37 | ||||||
| BTAS | 22 | 83 | ||||||
| Total Real Estate (a) | 2,672 | 4,817 | ||||||
| Private Equity | ||||||||
| BCP IV | 6 | 8 | ||||||
| BCP V | 31 | — | ||||||
| BCP VI | 407 | 475 | ||||||
| BCP VII | 854 | 1,257 | ||||||
| BCP VIII | 276 | 315 | ||||||
| BCP Asia I | 95 | 330 | ||||||
| BEP I | 26 | 27 | ||||||
| BEP II | 2 | — | ||||||
| BEP III | 158 | 93 | ||||||
| BCEP I | 213 | 222 | ||||||
| Tactical Opportunities | 223 | 378 | ||||||
| BXG | — | 12 | ||||||
| Strategic Partners | 511 | 570 | ||||||
| BIP | 158 | 106 | ||||||
| BXLS | 29 | 22 | ||||||
| BTAS/Other | 172 | 255 | ||||||
| Total Private Equity (a) | 3,161 | 4,070 | ||||||
| Credit & Insurance | 239 | 318 | ||||||
| Hedge Fund Solutions | 300 | 342 | ||||||
| Total Blackstone Net Accrued Performance Revenues | $ | 6,372 | $ | 9,546 | ||||
| Note: | Totals may not add due to rounding. |
|---|
| (a) | Real Estate and Private Equity include co-investments, as applicable. |
|---|
For the twelve months ended March 31, 2023, Net Accrued Performance Revenues receivable decreased due to net realized distributions of $2.8 billion, partially offset by Net Performance Revenues of $352.5 million.
Invested Performance Eligible Assets Under Management
The following presents our Invested Performance Eligible Assets Under Management as of quarter end for each period:
| Note: | Totals may not add due to rounding. |
|---|
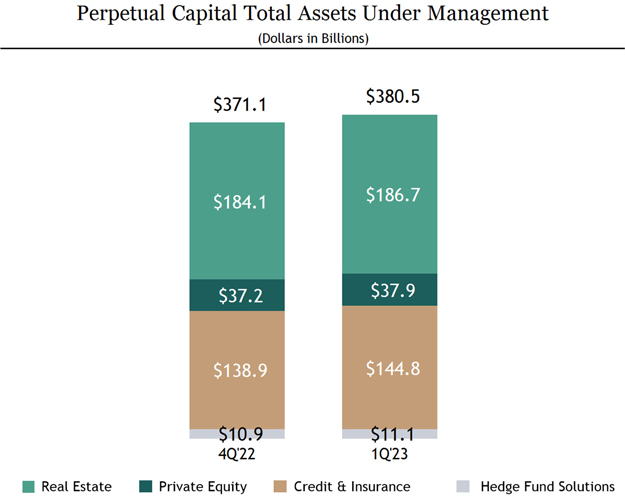
Perpetual Capital
The following presents our Perpetual Capital Total Assets Under Management as of quarter end for each period:
| Note: | Totals may not add due to rounding. |
|---|
Perpetual Capital Total Assets Under Management were $380.5 billion as of March 31, 2023, an increase of $9.4 billion, compared to $371.1 billion as of December 31, 2022. Perpetual Capital Total Assets Under Management in our Credit & Insurance and Real Estate segments increased $5.9 billion and $2.6 billion, respectively. Principal drivers of these increases were:
| • | In our Credit & Insurance segment, net Total Assets Under Management growth in BIS resulted in an increase of $5.1 billion. |
|---|
| • | In our Real Estate segment, net Total Assets Under Management growth in insurance capital managed in the Real Estate segment and growth in BREIT resulted in increases of $4.8 billion and $1.2 billion, respectively, partially offset by decreases of $2.4 billion and $951.0 million in BPP and BXMT, respectively. |
|---|
Investment Records
Fund returns information for our significant funds is included throughout this discussion and analysis to facilitate an understanding of our results of operations for the periods presented. The fund returns information reflected in this discussion and analysis is not indicative of the financial performance of Blackstone and is also not necessarily indicative of the future performance of any particular fund. An investment in Blackstone is not an investment in any of our funds. There can be no assurance that any of our funds or our other existing and future funds will achieve similar returns.
The following table presents the investment record of our significant carry/drawdown funds and selected perpetual capital strategies from inception through March 31, 2023:
Carry/Drawdown Funds
| Unrealized Investments | Realized Investments | Total Investments | ||||||||||||||||||||||||||||||||
| Fund (Investment Period | Committed | Available | % | Net IRRs (d) | ||||||||||||||||||||||||||||||
| Beginning Date / Ending Date) (a) | Capital | Capital (b) | Value | MOIC (c) | Public | Value | MOIC (c) | Value | MOIC (c) | Realized | Total | |||||||||||||||||||||||
| (Dollars/Euros in Thousands, Except Where Noted) | ||||||||||||||||||||||||||||||||||
| Real Estate | ||||||||||||||||||||||||||||||||||
| Pre-BREP | $ 140,714 | $ — | $ — | n/a | — | $ 345,190 | 2.5x | $ 345,190 | 2.5x | 33 | % | 33 | % | |||||||||||||||||||||
| BREP I (Sep 1994 / Oct 1996) | 380,708 | — | — | n/a | — | 1,327,708 | 2.8x | 1,327,708 | 2.8x | 40 | % | 40 | % | |||||||||||||||||||||
| BREP II (Oct 1996 / Mar 1999) | 1,198,339 | — | — | n/a | — | 2,531,614 | 2.1x | 2,531,614 | 2.1x | 19 | % | 19 | % | |||||||||||||||||||||
| BREP III (Apr 1999 / Apr 2003) | 1,522,708 | — | — | n/a | — | 3,330,406 | 2.4x | 3,330,406 | 2.4x | 21 | % | 21 | % | |||||||||||||||||||||
| BREP IV (Apr 2003 / Dec 2005) | 2,198,694 | — | 19,634 | n/a | — | 4,641,310 | 1.7x | 4,660,944 | 1.7x | 12 | % | 12 | % | |||||||||||||||||||||
| BREP V (Dec 2005 / Feb 2007) | 5,539,418 | — | 5,571 | n/a | — | 13,463,448 | 2.3x | 13,469,019 | 2.3x | 11 | % | 11 | % | |||||||||||||||||||||
| BREP VI (Feb 2007 / Aug 2011) | 11,060,444 | 550,388 | 203,661 | 1.3x | 70 | % | 27,526,436 | 2.5x | 27,730,097 | 2.5x | 13 | % | 13 | % | ||||||||||||||||||||
| BREP VII (Aug 2011 / Apr 2015) | 13,501,872 | 1,479,486 | 2,788,711 | 0.7x | 5 | % | 28,157,750 | 2.4x | 30,946,461 | 2.0x | 22 | % | 15 | % | ||||||||||||||||||||
| BREP VIII (Apr 2015 / Jun 2019) | 16,596,889 | 2,215,570 | 13,968,827 | 1.5x | — | 21,522,012 | 2.5x | 35,490,839 | 2.0x | 28 | % | 16 | % | |||||||||||||||||||||
| BREP IX (Jun 2019 / Aug 2022) | 21,306,836 | 3,877,824 | 26,717,962 | 1.5x | 1 | % | 7,802,955 | 2.2x | 34,520,917 | 1.6x | 65 | % | 27 | % | ||||||||||||||||||||
| *BREP X (Aug 2022 / Feb 2028) | 30,415,919 | 29,626,653 | 898,174 | 1.1x | 67 | % | — | n/a | 898,174 | 1.1x | n/a | n/m | ||||||||||||||||||||||
| Total Global BREP | $ 103,862,541 | $ 37,749,921 | $ 44,602,540 | 1.4x | 3 | % | $ 110,648,829 | 2.4x | $ 155,251,369 | 2.0x | 18 | % | 16 | % | ||||||||||||||||||||
| BREP Int’l (Jan 2001 / Sep 2005) | € 824,172 | € — | € — | n/a | — | € 1,373,170 | 2.1x | € 1,373,170 | 2.1x | 23 | % | 23 | % | |||||||||||||||||||||
| BREP Int’l II (Sep 2005 / Jun 2008) (e) | 1,629,748 | — | — | n/a | — | 2,583,032 | 1.8x | 2,583,032 | 1.8x | 8 | % | 8 | % | |||||||||||||||||||||
| BREP Europe III (Jun 2008 / Sep 2013) | 3,205,453 | 395,252 | 232,011 | 0.4x | — | 5,853,092 | 2.4x | 6,085,103 | 2.0x | 18 | % | 14 | % | |||||||||||||||||||||
| BREP Europe IV (Sep 2013 / Dec 2016) | 6,673,049 | 1,393,544 | 1,324,580 | 1.0x | — | 9,904,968 | 2.0x | 11,229,548 | 1.8x | 19 | % | 13 | % | |||||||||||||||||||||
| BREP Europe V (Dec 2016 / Oct 2019) | 7,968,437 | 1,308,022 | 5,056,572 | 1.0x | — | 6,678,098 | 3.9x | 11,734,670 | 1.7x | 42 | % | 11 | % | |||||||||||||||||||||
| *BREP Europe VI (Oct 2019 / Apr 2025) | 10,003,818 | 5,318,763 | 5,649,050 | 1.2x | — | 3,413,426 | 2.6x | 9,062,476 | 1.5x | 71 | % | 20 | % | |||||||||||||||||||||
| Total BREP Europe | € 30,304,677 | € 8,415,581 | € 12,262,213 | 1.1x | — | € 29,805,786 | 2.4x | € 42,067,999 | 1.7x | 17 | % | 12 | % | |||||||||||||||||||||
continued...
| Unrealized Investments | Realized Investments | Total Investments | ||||||||||||||||||||||||||||||||
| Fund (Investment Period | Committed | Available | % | Net IRRs (d) | ||||||||||||||||||||||||||||||
| Beginning Date / Ending Date) (a) | Capital | Capital (b) | Value | MOIC (c) | Public | Value | MOIC (c) | Value | MOIC (c) | Realized | Total | |||||||||||||||||||||||
| (Dollars/Euros in Thousands, Except Where Noted) | ||||||||||||||||||||||||||||||||||
| Real Estate (continued) | ||||||||||||||||||||||||||||||||||
| BREP Asia I (Jun 2013 / Dec 2017) | $ 4,263,411 | $ 897,686 | $ 2,072,851 | 1.4x | 6 | % | $ 6,483,462 | 2.1x | $ 8,556,313 | 1.8x | 20 | % | 12 | % | ||||||||||||||||||||
| BREP Asia II (Dec 2017 / Mar 2022) | 7,346,689 | 1,497,375 | 7,161,885 | 1.3x | — | 1,211,818 | 1.8x | 8,373,703 | 1.3x | 35 | % | 8 | % | |||||||||||||||||||||
| *BREP Asia III (Mar 2022 / Sep 2027) | 8,220,836 | 7,219,363 | 1,002,080 | 1.0x | — | — | n/a | 1,002,080 | 1.0x | n/a | n/m | |||||||||||||||||||||||
| BREP Co-Investment (f) | 7,298,796 | 35,018 | 1,034,501 | 2.2x | — | 15,092,405 | 2.2x | 16,126,906 | 2.2x | 16 | % | 16 | % | |||||||||||||||||||||
| Total BREP | $ 167,079,201 | $ 56,521,012 | $ 69,825,600 | 1.3x | 2 | % | $ 169,896,207 | 2.3x | $ 239,721,807 | 1.9x | 17 | % | 15 | % | ||||||||||||||||||||
| *BREDS High-Yield (Various) (g) | $ 23,477,120 | $ 8,122,320 | $ 5,557,130 | 1.0x | — | $ 17,422,179 | 1.3x | $ 22,979,309 | 1.2x | 10 | % | 9 | % | |||||||||||||||||||||
| Private Equity | ||||||||||||||||||||||||||||||||||
| Corporate Private Equity | ||||||||||||||||||||||||||||||||||
| BCP I (Oct 1987 / Oct 1993) | $ 859,081 | $ — | $ — | n/a | — | $ 1,741,738 | 2.6x | $ 1,741,738 | 2.6x | 19 | % | 19 | % | |||||||||||||||||||||
| BCP II (Oct 1993 / Aug 1997) | 1,361,100 | — | — | n/a | — | 3,268,627 | 2.5x | 3,268,627 | 2.5x | 32 | % | 32 | % | |||||||||||||||||||||
| BCP III (Aug 1997 / Nov 2002) | 3,967,422 | — | — | n/a | — | 9,228,707 | 2.3x | 9,228,707 | 2.3x | 14 | % | 14 | % | |||||||||||||||||||||
| BCOM (Jun 2000 / Jun 2006) | 2,137,330 | 24,575 | 16,242 | n/a | — | 2,981,999 | 1.4x | 2,998,241 | 1.4x | 6 | % | 6 | % | |||||||||||||||||||||
| BCP IV (Nov 2002 / Dec 2005) | 6,773,182 | 195,824 | 28,554 | n/a | — | 21,694,051 | 2.9x | 21,722,605 | 2.9x | 36 | % | 36 | % | |||||||||||||||||||||
| BCP V (Dec 2005 / Jan 2011) | 21,009,112 | 1,035,259 | 169,493 | 11.5x | 95 | % | 38,675,419 | 1.9x | 38,844,912 | 1.9x | 8 | % | 8 | % | ||||||||||||||||||||
| BCP VI (Jan 2011 / May 2016) | 15,195,536 | 1,341,319 | 6,104,724 | 1.9x | 31 | % | 26,616,194 | 2.3x | 32,720,918 | 2.2x | 15 | % | 13 | % | ||||||||||||||||||||
| BCP VII (May 2016 / Feb 2020) | 18,854,174 | 1,690,971 | 20,129,358 | 1.6x | 26 | % | 13,382,133 | 2.6x | 33,511,491 | 1.9x | 33 | % | 14 | % | ||||||||||||||||||||
| *BCP VIII (Feb 2020 / Feb 2026) | 25,651,112 | 13,179,751 | 16,615,869 | 1.3x | 6 | % | 978,651 | 2.6x | 17,594,520 | 1.3x | n/m | 14 | % | |||||||||||||||||||||
| BCP IX (TBD) | 15,547,350 | 15,547,350 | — | n/a | — | — | n/a | — | n/a | n/a | n/a | |||||||||||||||||||||||
| Energy I (Aug 2011 / Feb 2015) | 2,441,558 | 174,492 | 527,407 | 1.4x | 48 | % | 4,306,894 | 1.9x | 4,834,301 | 1.9x | 14 | % | 11 | % | ||||||||||||||||||||
| Energy II (Feb 2015 / Feb 2020) | 4,628,418 | 1,017,254 | 4,227,602 | 1.7x | 60 | % | 3,075,041 | 1.5x | 7,302,643 | 1.6x | 9 | % | 8 | % | ||||||||||||||||||||
| *Energy III (Feb 2020 / Feb 2026) | 4,366,334 | 2,314,765 | 3,624,077 | 1.9x | 28 | % | 1,018,342 | 2.3x | 4,642,419 | 2.0x | 60 | % | 43 | % | ||||||||||||||||||||
| BCP Asia I (Dec 2017 / Sep 2021) | 2,438,028 | 418,459 | 2,841,512 | 1.5x | 28 | % | 1,720,561 | 5.4x | 4,562,073 | 2.1x | 93 | % | 29 | % | ||||||||||||||||||||
| *BCP Asia II (Sep 2021 / Sep 2027) | 6,656,118 | 5,906,814 | 689,960 | 1.1x | — | — | n/a | 689,960 | 1.1x | n/a | n/m | |||||||||||||||||||||||
| Core Private Equity I (Jan 2017 / Mar 2021) (h) | 4,761,609 | 1,158,622 | 7,517,278 | 2.0x | — | 2,293,838 | 4.1x | 9,811,116 | 2.3x | 55 | % | 20 | % | |||||||||||||||||||||
| *Core Private Equity II (Mar 2021 / Mar 2026) (h) | 8,205,237 | 5,721,026 | 2,811,586 | 1.2x | — | 59,581 | n/a | 2,871,167 | 1.2x | n/a | 10 | % | ||||||||||||||||||||||
| Total Corporate Private Equity | $ 144,852,701 | $ 49,726,481 | $ 65,303,662 | 1.5x | 20 | % | $ 131,041,776 | 2.2x | $ 196,345,438 | 1.9x | 16 | % | 15 | % | ||||||||||||||||||||
continued...
| Unrealized Investments | Realized Investments | Total Investments | ||||||||||||||||||||||||||||||||
| Fund (Investment Period | Committed | Available | % | Net IRRs (d) | ||||||||||||||||||||||||||||||
| Beginning Date / Ending Date) (a) | Capital | Capital (b) | Value | MOIC (c) | Public | Value | MOIC (c) | Value | MOIC (c) | Realized | Total | |||||||||||||||||||||||
| (Dollars/Euros in Thousands, Except Where Noted) | ||||||||||||||||||||||||||||||||||
| Private Equity (continued) | ||||||||||||||||||||||||||||||||||
| Tactical Opportunities | ||||||||||||||||||||||||||||||||||
| *Tactical Opportunities (Various) | $ 28,780,088 | $ 14,588,176 | $ 11,030,696 | 1.2x | 10 | % | $ 22,016,525 | 1.9x | $ 33,047,221 | 1.6x | 17 | % | 11 | % | ||||||||||||||||||||
| *Tactical Opportunities Co-Investment and Other (Various) | 9,900,804 | 1,301,237 | 4,499,802 | 1.7x | 7 | % | 8,708,383 | 1.6x | 13,208,185 | 1.6x | 18 | % | 17 | % | ||||||||||||||||||||
| Total Tactical Opportunities | $ 38,680,892 | $ 15,889,413 | $ 15,530,498 | 1.3x | 9 | % | $ 30,724,908 | 1.8x | $ 46,255,406 | 1.6x | 17 | % | 12 | % | ||||||||||||||||||||
| Growth | ||||||||||||||||||||||||||||||||||
| *BXG I (Jul 2020 / Jul 2025) | $ 5,056,267 | $ 1,245,453 | $ 3,635,281 | 1.0x | 5 | % | $ 402,400 | 3.2x | $ 4,037,681 | 1.1x | n/m | -1 | % | |||||||||||||||||||||
| BXG II (TBD) | 4,045,697 | 4,045,697 | — | n/a | — | — | n/a | — | n/a | n/a | n/a | |||||||||||||||||||||||
| Total Growth | $ 9,101,964 | $ 5,291,150 | $ 3,635,281 | 1.0x | 5 | % | $ 402,400 | 3.2x | $ 4,037,681 | 1.1x | n/m | -1 | % | |||||||||||||||||||||
| Strategic Partners (Secondaries) | ||||||||||||||||||||||||||||||||||
| Strategic Partners I-V (Various) (i) | $ 11,447,898 | $ 641,841 | $ 351,910 | n/a | — | $ 16,969,978 | n/a | $ 17,321,888 | 1.7x | n/a | 13 | % | ||||||||||||||||||||||
| Strategic Partners VI (Apr 2014 / Apr 2016) (i) | 4,362,772 | 878,426 | 963,932 | n/a | — | 4,085,158 | n/a | 5,049,090 | 1.7x | n/a | 14 | % | ||||||||||||||||||||||
| Strategic Partners VII (May 2016 / Mar 2019) (i) | 7,489,970 | 1,781,038 | 4,316,007 | n/a | — | 6,260,527 | n/a | 10,576,534 | 2.0x | n/a | 19 | % | ||||||||||||||||||||||
| Strategic Partners Real Assets II (May 2017 / Jun 2020) (i) | 1,749,807 | 476,907 | 1,027,150 | n/a | — | 1,100,472 | n/a | 2,127,622 | 1.5x | n/a | 14 | % | ||||||||||||||||||||||
| Strategic Partners VIII (Mar 2019 / Oct 2021) (i) | 10,763,600 | 4,590,297 | 8,418,380 | n/a | — | 5,894,590 | n/a | 14,312,970 | 1.8x | n/a | 35 | % | ||||||||||||||||||||||
| *Strategic Partners Real Estate, SMA and Other (Various) (i) | 9,072,886 | 3,183,860 | 3,179,914 | n/a | — | 3,488,377 | n/a | 6,668,291 | 1.7x | n/a | 19 | % | ||||||||||||||||||||||
| *Strategic Partners Infrastructure III (Jun 2020 / Jul 2024) (i) | 3,250,100 | 1,423,545 | 1,271,893 | n/a | — | 239,153 | n/a | 1,511,046 | 1.4x | n/a | 31 | % | ||||||||||||||||||||||
| *Strategic Partners IX (Oct 2021 / Jan 2027) (i) | 19,492,126 | 12,551,380 | 3,907,359 | n/a | — | 538,872 | n/a | 4,446,231 | 1.3x | n/a | 21 | % | ||||||||||||||||||||||
| Total Strategic Partners (Secondaries) | $ 67,629,159 | $ 25,527,294 | $ 23,436,545 | n/a | — | $ 38,577,127 | n/a | $ 62,013,672 | 1.7x | n/a | 15 | % | ||||||||||||||||||||||
| Life Sciences | ||||||||||||||||||||||||||||||||||
| Clarus IV (Jan 2018 / Jan 2020) | $ 910,000 | $ 97,447 | $ 940,338 | 1.6x | 1 | % | $ 284,314 | 1.9x | $ 1,224,652 | 1.7x | 21 | % | 13 | % | ||||||||||||||||||||
| *BXLS V (Jan 2020 / Jan 2025) | 4,907,799 | 3,468,466 | 1,608,935 | 1.4x | 3 | % | 95,055 | 1.1x | 1,703,990 | 1.4x | n/m | 5 | % |
continued...
| Unrealized Investments | Realized Investments | Total Investments | ||||||||||||||||||||||||||||||||
| Fund (Investment Period | Committed | Available | % | Net IRRs (d) | ||||||||||||||||||||||||||||||
| Beginning Date / Ending Date) (a) | Capital | Capital (b) | Value | MOIC (c) | Public | Value | MOIC (c) | Value | MOIC (c) | Realized | Total | |||||||||||||||||||||||
| (Dollars/Euros in Thousands, Except Where Noted) | ||||||||||||||||||||||||||||||||||
| Credit | ||||||||||||||||||||||||||||||||||
| Mezzanine / Opportunistic I (Jul 2007 / Oct 2011) | $ 2,000,000 | $ 97,114 | $ — | n/a | — | $ 4,809,097 | 1.6x | $ 4,809,097 | 1.6x | n/a | 17 | % | ||||||||||||||||||||||
| Mezzanine / Opportunistic II (Nov 2011 / Nov 2016) | 4,120,000 | 994,949 | 158,837 | 0.2x | — | 6,586,920 | 1.6x | 6,745,757 | 1.4x | n/a | 10 | % | ||||||||||||||||||||||
| Mezzanine / Opportunistic III (Sep 2016 / Jan 2021) | 6,639,133 | 813,501 | 3,309,664 | 1.0x | 1 | % | 6,429,958 | 1.6x | 9,739,622 | 1.4x | n/a | 11 | % | |||||||||||||||||||||
| *Mezzanine / Opportunistic IV (Jan 2021 / Jan 2026) | 5,016,771 | 3,117,621 | 2,901,910 | 1.1x | — | 149,566 | n/m | 3,051,476 | 1.1x | n/a | 11 | % | ||||||||||||||||||||||
| Stressed / Distressed I (Sep 2009 / May 2013) | 3,253,143 | — | — | n/a | — | 5,777,098 | 1.3x | 5,777,098 | 1.3x | n/a | 9 | % | ||||||||||||||||||||||
| Stressed / Distressed II (Jun 2013 / Jun 2018) | 5,125,000 | 547,430 | 280,321 | 0.4x | — | 5,287,126 | 1.2x | 5,567,447 | 1.1x | n/a | 1 | % | ||||||||||||||||||||||
| Stressed / Distressed III (Dec 2017 / Dec 2022) | 7,356,380 | 2,299,547 | 3,005,197 | 1.0x | — | 3,146,337 | 1.4x | 6,151,534 | 1.1x | n/a | 7 | % | ||||||||||||||||||||||
| Energy I (Nov 2015 / Nov 2018) | 2,856,867 | 1,045,875 | 775,134 | 1.2x | — | 2,711,666 | 1.6x | 3,486,800 | 1.5x | n/a | 10 | % | ||||||||||||||||||||||
| *Energy II (Feb 2019 / Feb 2024) | 3,616,081 | 1,618,066 | 2,112,062 | 1.1x | — | 1,301,896 | 1.6x | 3,413,958 | 1.2x | n/a | 20 | % | ||||||||||||||||||||||
| European Senior Debt I (Feb 2015 / Feb 2019) | € 1,964,689 | € 473,985 | € 639,489 | 0.7x | — | € 2,559,005 | 1.4x | € 3,198,494 | 1.2x | n/a | 2 | % | ||||||||||||||||||||||
| *European Senior Debt II (Jun 2019 / Jun 2024) | € 4,088,344 | € 1,085,456 | € 4,254,443 | 1.0x | — | € 1,590,110 | 1.9x | € 5,844,553 | 1.1x | n/a | 11 | % | ||||||||||||||||||||||
| Total Credit Drawdown Funds (j) | $ 46,889,033 | $ 12,228,380 | $ 17,860,139 | 0.9x | — | $ 41,019,983 | 1.5x | $ 58,880,122 | 1.3x | n/a | 10 | % | ||||||||||||||||||||||
Selected Perpetual Capital Strategies (k)
| Fund (Inception Year) (a) | Investment Strategy | Total AUM | Total Net Return (l) | |||||||||
| (Dollars in Thousands, Except Where Noted) | ||||||||||||
| Real Estate | ||||||||||||
| BPP - Blackstone Property Partners (2013) (m) | Core+ Real Estate | $ | 70,595,493 | 9 | % | |||||||
| BREIT - Blackstone Real Estate Income Trust (2017) (n) | Core+ Real Estate | 69,711,147 | 11 | % | ||||||||
| BREIT - Class I (o) | Core+ Real Estate | 12 | % | |||||||||
| BXMT - Blackstone Mortgage Trust (2013) (p) | Real Estate Debt | 5,600,003 | 5 | % | ||||||||
| Private Equity | ||||||||||||
| BIP - Blackstone Infrastructure Partners (2019) (q) | Infrastructure | 28,593,836 | 15 | % | ||||||||
| Credit | ||||||||||||
| BXSL - Blackstone Secured Lending Fund (2018) (r) | U.S. Direct Lending | 10,878,825 | 10 | % | ||||||||
| BCRED - Blackstone Private Credit Fund (2021) (s) | U.S. Direct Lending | 58,964,030 | 8 | % | ||||||||
| BCRED - Class I (t) | U.S. Direct Lending | 9 | % | |||||||||
| Hedge Fund Solutions | ||||||||||||
| BSCH - Blackstone Strategic Capital Holdings (2014) (u) | GP Stakes | 10,147,324 | 12 | % |
The returns presented herein represent those of the applicable Blackstone Funds and not those of Blackstone.
| n/m | Not meaningful generally due to the limited time since initial investment. |
|---|
| n/a | Not applicable. |
|---|
| SMA | Separately managed account. |
|---|
| * | Represents funds that are currently in their investment period. |
|---|
| (a) | Excludes investment vehicles where Blackstone does not earn fees. |
|---|
| (b) | Available Capital represents total investable capital commitments, including side-by-side, adjusted for certain expenses and expired or recallable capital and may include leverage, less invested capital. This amount is not reduced by outstanding commitments to investments. |
|---|
| (c) | Multiple of Invested Capital (“MOIC”) represents carrying value, before management fees, expenses and Performance Revenues, divided by invested capital. |
|---|
| (d) | Unless otherwise indicated, Net Internal Rate of Return (“IRR”) represents the annualized inception to March 31, 2023 IRR on total invested capital based on realized proceeds and unrealized value, as applicable, after management fees, expenses and Performance Revenues. IRRs are calculated using actual timing of limited partner cash flows. Initial inception date of cash flows may differ from the Investment Period Beginning Date. |
|---|
| (e) | The 8% Realized Net IRR and 8% Total Net IRR exclude investors that opted out of the Hilton investment opportunity. Overall BREP International II performance reflects a 7% Realized Net IRR and a 7% Total Net IRR. |
|---|
| (f) | BREP Co-Investment represents co-investment capital raised for various BREP investments. The Net IRR reflected is calculated by aggregating each co-investment’s realized proceeds and unrealized value, as applicable, after management fees, expenses and Performance Revenues. |
|---|
| (g) | BREDS High-Yield represents the flagship real estate debt drawdown funds only. |
|---|
| (h) | Blackstone Core Equity Partners is a core private equity strategy which invests with a more modest risk profile and longer hold period than traditional private equity. |
|---|
| (i) | Realizations are treated as return of capital until fully recovered and therefore unrealized and realized MOICs are not applicable. Returns are calculated from results that are reported on a three-month lag from Strategic Partners’ fund financial statements and therefore do not include the impact of economic and market activities in the current quarter. |
|---|
| (j) | Funds presented represent the flagship credit drawdown funds only. The Total Credit Net IRR is the combined IRR of the credit drawdown funds presented. |
|---|
| (k) | Represents the performance for select Perpetual Capital Strategies; strategies excluded consist primarily of (1) investment strategies that have been investing for less than one year, (2) perpetual capital assets managed for certain insurance clients, and (3) investment vehicles where Blackstone does not earn fees. |
|---|
| (l) | Unless otherwise indicated, Total Net Return represents the annualized inception to March 31, 2023 IRR on total invested capital based on realized proceeds and unrealized value, as applicable, after management fees, expenses and Performance Revenues. IRRs are calculated using actual timing of investor cash flows. Initial inception date of cash flows occurred during the Inception Year. |
|---|
| (m) | BPP represents the aggregate Total Assets Under Management and Total Net Return of the BPP Platform, which comprises over 30 funds, co-investment and separately managed account vehicles. It includes certain vehicles managed as part of the BPP Platform but not classified as Perpetual Capital. As of March 31, 2023, these vehicles represented $2.9 billion of Total Assets Under Management. |
|---|
| (n) | The BREIT Total Net Return reflects a per share blended return, assuming BREIT had a single share class, reinvestment of all dividends received during the period, and no upfront selling commission, net of all fees and expenses incurred by BREIT. This return is not representative of the return experienced by any particular investor or share class. Total Net Return is presented on an annualized basis and is from January 1, 2017. |
|---|
| (o) | Represents the Total Net Return for BREIT’s Class I shares, its largest share class. Performance varies by share class. Class I Total Net Return assumes reinvestment of all dividends received during the period, and no upfront selling commission, net of all fees and expenses incurred by BREIT, Class I Total Net Return is presented on an annualized basis and is from January 1, 2017. |
|---|
| (p) | The BXMT Total Net Return reflects annualized market return of a shareholder invested in BXMT since inception, May 22, 2013, through March 31, 2023, assuming reinvestment of all dividends received during the period. |
|---|
| (q) | Including co-investment vehicles, BIP Total Assets Under Management is $36.1 billion. |
|---|
| (r) | The BXSL Total Assets Under Management and Total Net Return are reported on a one-quarter lag. Refer to BXSL public filings for current quarter results. BXSL Total Net Return reflects the change in Net Asset Value (“NAV”) per share, plus distributions per share (assuming dividends and distributions are reinvested in accordance with BXSL’s dividend reinvestment plan) divided by the beginning NAV per share. Total Net Returns are presented on an annualized basis and are from November 20, 2018. |
|---|
| (s) | The BCRED Total Net Return reflects a per share blended return, assuming BCRED had a single share class, reinvestment of all dividends received during the period, and no upfront selling commission, net of all fees and expenses incurred by BCRED. This return is not representative of the return experienced by any particular investor or share class. Total Net Return is presented on an annualized basis and is from January 7, 2021. Total Assets Under Management reflects gross asset value plus amounts borrowed or available to be borrowed under certain credit facilities. BCRED net asset value as of March 31, 2023 was $23.1 billion. |
|---|
| (t) | Represents the Total Net Return for BCRED’s Class I shares, its largest share class. Performance varies by share class. Class I Total Net Return assumes reinvestment of all dividends received during the period, and no upfront selling commission, net of all fees and expenses incurred by BCRED. Class I Total Net Return is presented on an annualized basis and is from January 7, 2021. |
|---|
| (u) | BSCH represents the aggregate Total Assets Under Management and Total Net Return of BSCH I and BSCH II funds that invest as part of the GP Stakes strategy, which targets minority investments in the general partners of private equity and other private-market alternative asset management firms globally. Including co-investment vehicles that do not pay fees, BSCH Total Assets Under Management is $11.1 billion. |
|---|
Segment Analysis
Discussed below is our Segment Distributable Earnings for each of our segments. This information is reflected in the manner utilized by our senior management to make operating decisions, assess performance and allocate resources. References to “our” sectors or investments may also refer to portfolio companies and investments of the underlying funds that we manage.
Real Estate
The following table presents the results of operations for our Real Estate segment:
| Three Months Ended | ||||||||||||||||
| March 31, | 2023 vs. 2022 | |||||||||||||||
| 2023 | 2022 | $ | % | |||||||||||||
| (Dollars in Thousands) | ||||||||||||||||
| Management Fees, Net | ||||||||||||||||
| Base Management Fees | $ | 705,387 | $ | 580,186 | $ | 125,201 | 22 | % | ||||||||
| Transaction and Other Fees, Net | 20,561 | 40,485 | (19,924 | ) | -49 | % | ||||||||||
| Management Fee Offsets | (10,457 | ) | (960 | ) | (9,497 | ) | 989 | % | ||||||||
| Total Management Fees, Net | 715,491 | 619,711 | 95,780 | 15 | % | |||||||||||
| Fee Related Performance Revenues | 20,748 | 491,517 | (470,769 | ) | -96 | % | ||||||||||
| Fee Related Compensation | (137,610 | ) | (344,842 | ) | 207,232 | -60 | % | |||||||||
| Other Operating Expenses | (74,181 | ) | (66,003 | ) | (8,178 | ) | 12 | % | ||||||||
| Fee Related Earnings | 524,448 | 700,383 | (175,935 | ) | -25 | % | ||||||||||
| Realized Performance Revenues | 11,096 | 802,916 | (791,820 | ) | -99 | % | ||||||||||
| Realized Performance Compensation | (3,165 | ) | (290,031 | ) | 286,866 | -99 | % | |||||||||
| Realized Principal Investment Income | 2,224 | 53,975 | (51,751 | ) | -96 | % | ||||||||||
| Net Realizations | 10,155 | 566,860 | (556,705 | ) | -98 | % | ||||||||||
| Segment Distributable Earnings | $ | 534,603 | $ | 1,267,243 | $ | (732,640 | ) | -58 | % | |||||||
n/m Not meaningful.
Three Months Ended March 31, 2023 Compared to Three Months Ended March 31, 2022
Segment Distributable Earnings were $534.6 million for the three months ended March 31, 2023, a decrease of $732.6 million, compared to $1.3 billion for the three months ended March 31, 2022. The decrease in Segment Distributable Earnings was primarily attributable to decreases of $175.9 million in Fee Related Earnings and $556.7 million in Net Realizations.
Over eighty percent of the aggregate net asset value of our global opportunistic and core+ real estate vehicles is concentrated in logistics, rental housing, hotels, life science office and data centers. These sectors continue to demonstrate strong cash flow growth, with the majority experiencing low vacancies driven by sustained robust demand and muted supply. Notwithstanding the strength of sectors, the real estate market has been characterized by divergent performance across sectors. Weakening fundamentals persist in the office sector and traditional U.S. office buildings remain particularly challenged. Traditional U.S. office represents only approximately 2% of the aggregate net asset value of our global opportunistic and core+ real estate portfolios. Although inflation is moderating, continued capital market volatility and economic uncertainty have contributed to reduced realization and deployment activity. These market conditions and capital constraints, coupled with the potential for a more constrained financing market in light of recent events in the banking sector, are likely to result in muted realizations for a period of time, which would negatively impact Segment Distributable Earnings in our Real Estate segment. Although these conditions have made deployment more challenging, we believe our real estate funds are well positioned to take advantage of deployment opportunities during periods of heightened dislocation.
Fundraising in the first quarter of 2023 remained positive despite a challenging market backdrop. Perpetual capital strategies, including BREIT, represent an increasing percentage of Total Assets Under Management in our Real Estate segment. Market volatility drove a material increase in BREIT repurchase requests beginning in late 2022, and pursuant to the terms of the vehicle, BREIT began to prorate such requests beginning in November 2022. Concurrently, BREIT inflows were materially reduced after proration was announced which led to net outflows in BREIT in the first quarter, excluding the $4.5 billion subscription by UC Investments. Although repurchase requests in March and April were modestly down from their peak in January 2023, a continuation or worsening of the current environment could further adversely affect net flows in certain perpetual capital strategies for an extended period of time. We believe the
long-term
growth trajectory remains positive and that strong investment performance and investor
under-allocation
to such strategies should drive flows over the
long-term.
See “Part I. Item 1A. Risk Factors — Risks Related to our Business — We have increasingly undertaken business initiatives to increase the number and type of investment products we offer to individual investors, which could expose us to new and greater levels of risk” in our Annual Report on Form
10-K
for the year ended December 31, 2022.
Fee Related Earnings
Fee Related Earnings were $524.4 million for the three months ended March 31, 2023, a decrease of $175.9 million, compared to $700.4 million for the three months ended March 31, 2022. The decrease in Fee Related Earnings was attributable to a decrease of $470.8 million in Fee Related Performance Revenues and an increase of $8.2 million in Other Operating Expenses, partially offset by a decrease of $207.2 million in Fee Related Compensation and an increase of $95.8 million in Management Fees, Net.
Fee Related Performance Revenues were $20.7 million for the three months ended March 31, 2023, a decrease of $470.8 million, compared to $491.5 million for the three months ended March 31, 2022. The decrease was primarily due to lower Fee Related Performance Revenues in BREIT.
Other Operating Expenses were $74.2 million for three months ended March 31, 2023, an increase of $8.2 million, compared to $66.0 million for three months ended March 31, 2022. The increase was primarily due to travel and entertainment and occupancy costs.
Fee Related Compensation was $137.6 million for the three months ended March 31, 2023, a decrease of $207.2 million, compared to $344.8 million for the three months ended March 31, 2022. The decrease was primarily due to a decrease in Fee Related Performance Revenues, partially offset by an increase in Management Fees, Net, both of which impact Fee Related Compensation.
Management Fees, Net were $715.5 million for the three months ended March 31, 2023, an increase of $95.8 million, compared to $619.7 million for the three months ended March 31, 2022, primarily driven by an increase in Base Management Fees, partially offset by a decrease in Transaction and Other Fees, Net. Base Management Fees increased $125.2 million primarily due to
Fee-Earning
Assets Under Management growth in BREP, Core+ real estate and BREDS. Transaction and Other Fees, Net decreased $19.9 million primarily due to a decrease in acquisition fees.
Net Realizations
Net Realizations were $10.2 million for the three months ended March 31, 2023, a decrease of $556.7 million, compared to $566.9 million for the three months ended March 31, 2022. The decrease in Net Realizations was primarily attributable to decreases of $791.8 million in Realized Performance Revenues and $51.8 million in Realized Principal Investment Income, partially offset by a decrease of $286.9 million in Realized Performance Compensation.
Realized Performance Revenues were $11.1 million for the three months ended March 31, 2023, a decrease of $791.8 million, compared to $802.9 million for the three months ended March 31, 2022. The decrease was primarily due to lower Realized Performance Revenues in BREP.
Realized Principal Investment Income was $2.2 million for the three months ended March 31, 2023, a decrease of $51.8 million, compared to $54.0 million for the three months ended March 31, 2022. The decrease was primarily due to the segment’s allocation of the gain recognized in a Pátria Investments Limited and Pátria Investimentos Ltda. (collectively, “Pátria”) sale transaction in the first quarter of 2022.
Realized Performance Compensation was $3.2 million for the three months ended March 31, 2023, a decrease of $286.9 million, compared to $290.0 million for the three months ended March 31, 2022. The decrease was primarily due to the decrease in Realized Performance Revenues.
Fund Returns
Fund return information for our significant funds is included throughout this discussion and analysis to facilitate an understanding of our results of operations for the periods presented. The fund returns information reflected in this discussion and analysis is not indicative of the financial performance of Blackstone and is also not necessarily indicative of the future performance of any particular fund. An investment in Blackstone is not an investment in any of our funds. There can be no assurance that any of our funds or our other existing and future funds will achieve similar returns.
The following table presents the internal rates of return, except where noted, of our significant real estate funds:
| Three Months Ended | March 31, 2023 | |||||||||||||||||||||||||||||||
| March 31, | Inception to Date | |||||||||||||||||||||||||||||||
| 2023 | 2022 | Realized | Total | |||||||||||||||||||||||||||||
| Fund (a) | Gross | Net | Gross | Net | Gross | Net | Gross | Net | ||||||||||||||||||||||||
| BREP VII | -27% | -23% | 7% | 6% | 30% | 22% | 21% | 15% | ||||||||||||||||||||||||
| BREP VIII | -6% | -6% | 13% | 11% | 36% | 28% | 22% | 16% | ||||||||||||||||||||||||
| BREP IX | 1% | - | 18% | 15% | 95% | 65% | 37% | 27% | ||||||||||||||||||||||||
| BREP Europe IV (b) | -13% | -12% | 3% | 2% | 27% | 19% | 19% | 13% | ||||||||||||||||||||||||
| BREP Europe V (b) | -8% | -8% | 5% | 4% | 51% | 42% | 16% | 11% | ||||||||||||||||||||||||
| BREP Europe VI (b) | 15% | 10% | 8% | 7% | 97% | 71% | 32% | 20% | ||||||||||||||||||||||||
| BREP Asia I | -3% | -4% | 3% | 2% | 27% | 20% | 18% | 12% | ||||||||||||||||||||||||
| BREP Asia II | -1% | 5% | 4% | 3% | 51% | 35% | 13% | 8% | ||||||||||||||||||||||||
| BREP Co-Investment (c) | 3% | 2% | 22% | 22% | 18% | 16% | 18% | 16% | ||||||||||||||||||||||||
| BPP (d) | -3% | -3% | 10% | 9% | n/a | n/a | 11% | 9% | ||||||||||||||||||||||||
| BREIT (e) | n/a | -1% | n/a | 5% | n/a | n/a | n/a | 11% | ||||||||||||||||||||||||
| BREIT - Class I (f) | n/a | -1% | n/a | 5% | n/a | n/a | n/a | 12% | ||||||||||||||||||||||||
| BREDS High-Yield (g) | 1% | - | 1% | - | 15% | 10% | 13% | 9% | ||||||||||||||||||||||||
| BXMT (h) | n/a | -13% | n/a | 6% | n/a | n/a | n/a | 5% |
The returns presented herein represent those of the applicable Blackstone Funds and not those of Blackstone.
| n/m | Not meaningful generally due to the limited time since initial investment. |
|---|
| n/a | Not applicable. |
|---|
| (a) | Net returns are based on the change in carrying value (realized and unrealized) after management fees, expenses and Performance Revenues. |
|---|
| (b) | Euro-based internal rates of return. |
|---|
| (c) | BREP Co-Investment represents co-investment capital raised for various BREP investments. The Net IRR reflected is calculated by aggregating each co-investment’s realized proceeds and unrealized value, as applicable, after management fees, expenses and Performance Revenues. |
|---|
| (d) | The BPP platform, which comprises over 30 funds, co-investment and separately managed account vehicles, represents the Core+ real estate funds which invest with a more modest risk profile and lower leverage. |
|---|
| (e) | Reflects a per share blended return for each respective period, assuming BREIT had a single share class, reinvestment of all dividends received during the period, and no upfront selling commission, net of all fees and expenses incurred by BREIT. These returns are not representative of the returns experienced by any particular investor or share class. Inception to date returns are presented on an annualized basis and are from January 1, 2017. |
|---|
| (f) | Represents the Total Net Return for BREIT’s Class I shares, its largest share class. Performance varies by share class. Class I Total Net Return assumes reinvestment of all dividends received during the period, and no upfront selling commission, net of all fees and expenses incurred by BREIT. Inception to date return is from January 1, 2017. |
|---|
| (g) | BREDS High-Yield represents the flagship real estate debt drawdown funds only. Inception to date returns are from July 1, 2009. |
|---|
| (h) | Reflects annualized return of a shareholder invested in BXMT as of the beginning of each period presented, assuming reinvestment of all dividends received during the period, and net of all fees and expenses incurred by BXMT. Return incorporates the closing NYSE stock price as of each period end. Inception to date returns are from May 22, 2013. |
|---|
Funds With Closed Investment Periods as of March 31, 2023
The Real Estate segment has twelve funds with closed investment periods as of March 31, 2023: BREP IX, BREP VIII, BREP VII, BREP VI, BREP V, BREP IV, BREP Europe V, BREP Europe IV, BREP Europe III, BREP Asia II, BREP Asia I and BREDS III. As of March 31, 2023, BREP VII, BREP VI, BREP V, BREP IV, BREP Europe IV and BREP Europe III were above their carried interest thresholds (i.e., the preferred return payable to its limited partners before the general partner is eligible to receive carried interest) and would have been above their carried interest thresholds even if all remaining investments were valued at zero. BREP IX, BREP VIII, BREP Europe V, BREP Asia II, BREP Asia I and BREDS III were above their carried interest thresholds. Funds are considered above their carried interest thresholds based on the aggregate fund position, although individual limited partners may be below their respective carried interest thresholds in certain funds.
Private Equity
The following table presents the results of operations for our Private Equity segment:
| Three Months Ended March 31, | 2023 vs. 2022 | |||||||||||||||
| 2023 | 2022 | $ | % | |||||||||||||
| (Dollars in Thousands) | ||||||||||||||||
| Management and Advisory Fees, Net | ||||||||||||||||
| Base Management Fees | $ | 451,610 | $ | 421,472 | $ | 30,138 | 7% | |||||||||
| Transaction, Advisory and Other Fees, Net | 14,784 | 12,658 | 2,126 | 17% | ||||||||||||
| Management Fee Offsets | (1,310) | (27,142) | 25,832 | -95% | ||||||||||||
| Total Management and Advisory Fees, Net | 465,084 | 406,988 | 58,096 | 14% | ||||||||||||
| Fee Related Performance Revenues | - | (648) | 648 | -100% | ||||||||||||
| Fee Related Compensation | (161,626) | (151,050) | (10,576) | 7% | ||||||||||||
| Other Operating Expenses | (76,763) | (67,744) | (9,019) | 13% | ||||||||||||
| Fee Related Earnings | 226,695 | 187,546 | 39,149 | 21% | ||||||||||||
| Realized Performance Revenues | 499,322 | 450,238 | 49,084 | 11% | ||||||||||||
| Realized Performance Compensation | (232,934) | (206,703) | (26,231) | 13% | ||||||||||||
| Realized Principal Investment Income | 32,889 | 65,438 | (32,549) | -50% | ||||||||||||
| Net Realizations | 299,277 | 308,973 | (9,696) | -3% | ||||||||||||
| Segment Distributable Earnings | $ | 525,972 | $ | 496,519 | $ | 29,453 | 6% | |||||||||
n/m Not meaningful.
Three Months Ended March 31, 2023 Compared to Three Months Ended March 31, 2022
Segment Distributable Earnings were $526.0 million for the three months ended March 31, 2023, an increase of $29.5 million, compared to $496.5 million for the three months ended March 31, 2022. The increase in Segment Distributable Earnings was attributable to an increase of $39.1 million in Fee Related Earnings, partially offset by a decrease of $9.7 million in Net Realizations.
The corporate private equity portfolio has, to a meaningful extent, been able to navigate the impact of inflationary pressures by focusing on investments in companies that are less impacted by rising input costs or that benefit from strong revenue growth and pricing power. As a result, overall margins in the private equity portfolio have demonstrated resilience, although wage inflation continues to put some pressure on profits margins of certain private equity portfolio companies, particularly in labor intensive businesses. With respect to realizations and deployment, continuing capital market volatility and economic uncertainty have contributed to reduced activity. Current market and economic conditions, coupled with the potential for a more constrained financing market in light of recent events in the banking sector, are likely to continue to result in muted realizations and deployment until such conditions improve. This would negatively impact Segment Distributable Earnings in our Private Equity segment. Challenging market conditions have pressured investors’ ability to allocate to private equity strategies and contributed to an already difficult fundraising environment. Despite these near-term headwinds and a slower pace of fundraising, our institutional fundraising has remained positive and we have advanced considerably on flagship fundraising in our Private Equity segment.
In energy, the values of certain energy investments fluctuated as a result of volatility in oil and gas prices in the first quarter of 2023. Beyond any short term conditions, increased scrutiny from regulators, investors and other market participants on the climate impact of oil and gas energy investments has weakened long-term growth prospects for traditional energy. The persistence of these weakened market fundamentals could negatively impact the performance of certain investments in our energy and corporate private equity funds.
Fee Related Earnings
Fee Related Earnings were $226.7 million for the three months ended March 31, 2023, an increase of $39.1 million, or 21%, compared to $187.5 million for the three months ended March 31, 2022. The increase in Fee Related Earnings was primarily attributable to an increase of $58.1 million in Management and Advisory Fees, Net, partially offset by increases of $10.6 million in Fee Related Compensation and $9.0 million in Other Operating Expenses.
Management and Advisory Fees, Net were $465.1 million for the three months ended March 31, 2023, an increase of $58.1 million, compared to $407.0 million for the three months ended March 31, 2022, primarily driven by an increase in Base Management Fees and a decrease in Management Fee Offsets. Base Management Fees increased $30.1 million primarily due to (a) additional commitments from limited partners to Strategic Partners IX and Strategic Partners GP Solutions and the commencement of Strategic Partners Real Estate VIII’s investment period in the second quarter of 2022, and
(b) Fee-Earning
Assets Under Management Growth in BIP. Management Fee Offsets decreased $25.8 million primarily due to a reduction from Strategic Partners IX.
Fee Related Compensation was $161.6 million for the three months ended March 31, 2023, an increase of $10.6 million, compared to $151.1 million for the three months ended March 31, 2022. The increase was primarily due to an increase in Base Management Fees, on which a portion of Fee Related Compensation is based.
Other Operating Expenses were $76.8 million for the three months ended March 31, 2023, an increase of $9.0 million, compared to $67.7 million for the three months ended March 31, 2022. The increase was primarily due to travel and entertainment and occupancy costs.
Net Realizations
Net Realizations were $299.3 million for the three months ended March 31, 2023, a decrease of $9.7 million, compared to $309.0 million for the three months ended March 31, 2022. The decrease in Net Realizations was primarily attributable to a decrease of $32.5 million in Realized Principal Investment Income and an increase of $26.2 million in Realized Performance Compensation, partially offset by an increase of $49.1 million in Realized Performance Revenues.
Realized Principal Investment Income was $32.9 million for the three months ended March 31, 2023, a decrease of $32.5 million, compared to $65.4 million for the three months ended March 31, 2022. The decrease was primarily due to the segment’s allocation of the gain recognized in a Pátria sale transaction in the first quarter of 2022.
Realized Performance Compensation was $232.9 million for the three months ended March 31, 2023, an increase of $26.2 million, compared to $206.7 million for the three months ended March 31, 2022. The increase was primarily due to an increase in Realized Performance Revenues.
Realized Performance Revenues were $499.3 million for the three months ended March 31, 2023, an increase of $49.1 million, compared to $450.2 million for the three months ended March 31, 2022. The increase was primarily due to higher Realized Performance Revenues in corporate private equity and Tactical Opportunities, partially offset by lower Realized Performance Revenues in Strategic Partners.
Fund Returns
Fund returns information for our significant funds is included throughout this discussion and analysis to facilitate an understanding of our results of operations for the periods presented. The fund returns information reflected in this discussion and analysis is not indicative of the financial performance of Blackstone and is also not necessarily indicative of the future performance of any particular fund. An investment in Blackstone is not an investment in any of our funds. There can be no assurance that any of our funds or our other existing and future funds will achieve similar returns.
The following table presents the internal rates of return of our significant private equity funds:
| Three Months Ended | March 31, 2023 | |||||||||||||||||||||||||||||||
| March 31, | Inception to Date | |||||||||||||||||||||||||||||||
| 2023 | 2022 | Realized | Total | |||||||||||||||||||||||||||||
| Fund (a) | Gross | Net | Gross | Net | Gross | Net | Gross | Net | ||||||||||||||||||||||||
| BCP VI | 2% | 1% | 3% | 3% | 20% | 15% | 17% | 13% | ||||||||||||||||||||||||
| BCP VII | 5% | 4% | 1% | - | 42% | 33% | 20% | 14% | ||||||||||||||||||||||||
| BCP VIII | 2% | 1% | 4% | 3% | n/m | n/m | 27% | 14% | ||||||||||||||||||||||||
| BEP I | -15% | -13% | 24% | 19% | 18% | 14% | 15% | 11% | ||||||||||||||||||||||||
| BEP II | 1% | 1% | 17% | 16% | 13% | 9% | 12% | 8% | ||||||||||||||||||||||||
| BEP III | 9% | 7% | 10% | 7% | 95% | 60% | 66% | 43% | ||||||||||||||||||||||||
| BCP Asia I | -3% | -3% | -9% | -9% | 131% | 93% | 42% | 29% | ||||||||||||||||||||||||
| BCEP I (b) | 1% | 1% | 4% | 4% | 61% | 55% | 23% | 20% | ||||||||||||||||||||||||
| BCEP II (b) | 6% | 4% | 2% | 1% | n/a | n/a | 16% | 10% | ||||||||||||||||||||||||
| Tactical Opportunities | 2% | 2% | 2% | 2% | 21% | 17% | 15% | 11% | ||||||||||||||||||||||||
| Tactical Opportunities Co-Investment and Other | 3% | 4% | 1% | 3% | 19% | 18% | 20% | 17% | ||||||||||||||||||||||||
| BXG I | - | -1% | -6% | -5% | n/m | n/m | 5% | -1% | ||||||||||||||||||||||||
| Strategic Partners VI (c) | -2% | -2% | 5% | 5% | n/a | n/a | 18% | 14% | ||||||||||||||||||||||||
| Strategic Partners VII (c) | 1% | 1% | 4% | 4% | n/a | n/a | 23% | 19% | ||||||||||||||||||||||||
| Strategic Partners Real Assets II (c) | 1% | - | 3% | 2% | n/a | n/a | 18% | 14% | ||||||||||||||||||||||||
| Strategic Partners VIII (c) | 2% | 1% | 7% | 5% | n/a | n/a | 44% | 35% | ||||||||||||||||||||||||
| Strategic Partners Real Estate, SMA and Other (c) | 2% | 1% | 11% | 10% | n/a | n/a | 20% | 19% | ||||||||||||||||||||||||
| Strategic Partners Infrastructure III (c) | 1% | -1% | 17% | 6% | n/a | n/a | 53% | 31% | ||||||||||||||||||||||||
| Strategic Partners IX (c) | 3% | - | n/m | n/m | n/a | n/a | 36% | 21% | ||||||||||||||||||||||||
| BIP | -3% | -2% | 15% | 12% | n/a | n/a | 20% | 15% | ||||||||||||||||||||||||
| Clarus IV | 7% | 6% | - | -1% | 30% | 21% | 22% | 13% | ||||||||||||||||||||||||
| BXLS V | 6% | 4% | -4% | -6% | n/m | n/m | 18% | 5% |
The returns presented herein represent those of the applicable Blackstone Funds and not those of Blackstone.
| n/m | Not meaningful generally due to the limited time since initial investment. |
|---|
| n/a | Not applicable. |
|---|
| SMA | Separately managed account. |
|---|
| (a) | Net returns are based on the change in carrying value (realized and unrealized) after management fees, expenses and Performance Revenues. |
|---|
| (b) | BCEP is a core private equity strategy which invests with a more modest risk profile and longer hold period than traditional private equity. |
|---|
| (c) | Realizations are treated as return of capital until fully recovered and therefore inception to date realized returns are not applicable. Returns are calculated from results that are reported on a three month lag from Strategic Partners’ fund financial statements and therefore do not include the impact of economic and market activities in the current quarter. |
|---|
Funds With Closed Investment Periods as of March 31, 2023
The corporate private equity funds within the Private Equity segment have nine funds with closed investment periods: BCP IV, BCP V, BCP VI, BCP VII, BCOM, BEP I, BEP II, BCEP I and BCP Asia I. As of March 31, 2023, BCP IV was above its carried interest threshold (i.e., the preferred return payable to its limited partners before the general partner is eligible to receive carried interest) and would still be above its carried interest threshold even if all remaining investments were valued at zero. BCP V is comprised of two fund classes, the BCP V “main fund” and
BCP V-AC
fund. Within these fund classes, the general partner is subject to equalization such that (a) the general partner accrues carried interest when the respective carried interest for either fund class is positive and (b) the general partner realizes carried interest so long as clawback obligations, if any, for either of the respective fund classes are fully satisfied. BCP V, BCP VI, BCP VII, BCOM, BEP I, BEP II, BCEP I and BCP Asia were above their respective carried interest thresholds. Funds are considered above their carried interest thresholds based on the aggregate fund position, although individual limited partners may be below their respective carried interest thresholds in certain funds. We are entitled to retain previously realized carried interest up to 20% of BCOM’s net gains. As a result, Performance Revenues are recognized from BCOM on current period gains and losses.
The Tactical Opportunities funds within the Private Equity segment have various funds with closed investment periods, including but not limited to: BTOF-POOL, BTOF-POOL II, and BTOF-POOL III, which are each above their carried interest thresholds based on aggregate fund position. Strategic Partners funds within the Private Equity segment have various funds with closed investment periods, including but not limited to: SP VIII, SP VII RE, and SP RA II, which are above their respective carried interest thresholds based on aggregate fund position. Certain Strategic Partner funds with closed investment periods do not generate carried interest for Blackstone as agreed to at the time the Strategic Partners business was acquired. The Blackstone Life Sciences funds within the Private Equity segment has one fund with a closed investment period: Clarus IV, which was above its carried interest threshold.
Credit & Insurance
The following table presents the results of operations for our Credit & Insurance segment:
| Three Months Ended | ||||||||||||||||
| March 31, | 2023 vs. 2022 | |||||||||||||||
| 2023 | 2022 | $ | % | |||||||||||||
| (Dollars in Thousands) | ||||||||||||||||
| Management Fees, Net | ||||||||||||||||
| Base Management Fees | $ | 326,779 | $ | 292,445 | $ | 34,334 | 12% | |||||||||
| Transaction and Other Fees, Net | 8,451 | 9,397 | (946) | -10% | ||||||||||||
| Management Fee Offsets | (1,101) | (1,619) | 518 | -32% | ||||||||||||
| Total Management Fees, Net | 334,129 | 300,223 | 33,906 | 11% | ||||||||||||
| Fee Related Performance Revenues | 127,496 | 67,196 | 60,300 | 90% | ||||||||||||
| Fee Related Compensation | (163,999) | (127,344) | (36,655) | 29% | ||||||||||||
| Other Operating Expenses | (74,238) | (57,167) | (17,071) | 30% | ||||||||||||
| Fee Related Earnings | 223,388 | 182,908 | 40,480 | 22% | ||||||||||||
| Realized Performance Revenues | 125,181 | 30,743 | 94,438 | 307% | ||||||||||||
| Realized Performance Compensation | (56,772) | (13,386) | (43,386) | 324% | ||||||||||||
| Realized Principal Investment Income | 6,009 | 22,781 | (16,772) | -74% | ||||||||||||
| Net Realizations | 74,418 | 40,138 | 34,280 | 85% | ||||||||||||
| Segment Distributable Earnings | $ | 297,806 | $ | 223,046 | $ | 74,760 | 34% | |||||||||
n/m Not meaningful.
Three Months Ended March 31, 2023 Compared to Three Months Ended March 31, 2022
Segment Distributable Earnings were $297.8 million for the three months ended March 31, 2023, an increase of $74.8 million, or 34%, compared to $223.0 million for the three months ended March 31, 2022. The increase in Segment Distributable Earnings was attributable to increases of $40.5 million in Fee Related Earnings and $34.3 million in Net Realizations.
Despite market volatility amid challenges in the banking sector, sustained high interest rates and solid underlying company performance have continued to favorably impact returns in our private credit strategies. The performance of our credit funds has generally benefited from the high interest rate environment as a substantial majority of the portfolio is floating rate, although a higher cost of capital as a result of higher interest rates has the potential to negatively impact the free cash flow and credit quality of certain borrowers. Heightened energy prices and wage costs continue to put some profit margin pressures on certain of our Credit & Insurance segment investments even as overall inflation is moderating. Recent challenges in the banking sector may contribute to a more constrained financing market, which may create meaningful deployment opportunities for our private credit strategies as borrowers seek alternative financing sources. Nonetheless, significant market dislocation, particularly in the banking sector, could limit the liquidity of certain assets traded in the credit markets, and this would impact our funds’ ability to sell such assets at attractive prices or in a timely manner.
Perpetual capital strategies, including BCRED, represent an increasing percentage of Total Assets Under Management in our Credit & Insurance segment. Beginning in late 2022, market volatility drove a material increase in BCRED repurchase requests and a material decrease in inflows. While this led to minimal net flows in BCRED in the first quarter, inflows began showing signs of improving beginning late in the first quarter, with April inflows representing the highest month since October 2022 in six months. Nevertheless, a continuation or worsening of the current environment would again adversely affect our net flows. However, we believe the
long-term
growth trajectory remains positive and that strong investment performance and investor
under-allocation
to such private wealth strategies should drive flows over the
long-term.
See “Item 1A. Risk Factors — Risks Related to Our Business —We have increasingly undertaken business initiatives to increase the number and type of investment products we offer to individual investors, which could expose us to new and greater levels of risk” in our Annual Report on Form
10-K
for the year ended December 31, 2022.
Fee Related Earnings
Fee Related Earnings were $223.4 million for the three months ended March 31, 2023, an increase of $40.5 million, or 22%, compared to $182.9 million for the three months ended March 31, 2022. The increase in Fee Related Earnings was primarily attributable to increases of $60.3 million in Fee Related Performance Revenues and $33.9 million in Management Fees, Net, partially offset by increases of $36.7 million in Fee Related Compensation and $17.1 million in Other Operating Expenses.
Fee Related Performance Revenues were $127.5 million for the three months ended March 31, 2023, an increase of $60.3 million, compared to $67.2 million for the three months ended March 31, 2022. The increase was primarily due to performance and an increase in subscriptions in BCRED.
Management Fees, Net were $334.1 million for the three months ended March 31, 2023, an increase of $33.9 million, compared to $300.2 million for the three months ended March 31, 2022, primarily driven by an increase in Base Management Fees. Base Management Fees increased $34.3 million primarily due to inflows from
Fee-Earning
Assets Under Management in BCRED and BIS.
Fee Related Compensation was $164.0 million for the three months ended March 31, 2023, an increase of $36.7 million, compared to $127.3 million for the three months ended March 31, 2022. The increase was primarily due to increases in Management Fees, Net and Fee Related Performance Revenues, both of which impact Fee Related Compensation.
Other Operating Expenses were $74.2 million for the three months ended March 31, 2023, an increase of $17.1 million, compared to $57.2 million for the three months ended March 31, 2022. The increase was primarily due to technology-related expenses, as well as travel and entertainment and occupancy costs.
Net Realizations
Net Realizations were $74.4 million for the three months ended March 31, 2023, an increase of $34.3 million, or 85%, compared to $40.1 million for the three months ended March 31, 2022. The increase in Net Realizations was primarily attributable to an increase of $94.4 million in Realized Performance Revenues, partially offset by an increase of $43.4 million in Realized Performance Compensation and a decrease of $16.8 million in Realized Principal Investment Income.
Realized Performance Revenues were $125.2 million for the three months ended March 31, 2023, an increase of $94.4 million, compared to $30.7 million for the three months ended March 31, 2022. The increase was primarily attributable to higher realized performance revenues in our energy and mezzanine funds.
Realized Performance Compensation was $56.8 million for the three months ended March 31, 2023, an increase of $43.4 million, compared to $13.4 million for the three months ended March 31, 2022. The increase was primarily due to the increase in Realized Performance Revenues.
Realized Principal Investment Income was $6.0 million for the three months ended March 31, 2023, a decrease of $16.8 million, compared to $22.8 million for the three months ended March 31, 2022. The decrease was primarily due to the segment’s allocation of the gain recognized in a Pátria sale transaction in the first quarter of 2022.
Composite Returns
Composite returns information is included throughout this discussion and analysis to facilitate an understanding of our results of operations for the periods presented. The composite returns information reflected in this discussion and analysis is not indicative of the financial performance of Blackstone and is also not necessarily indicative of the future results of any particular fund or composite. An investment in Blackstone is not an investment in any of our funds or composites. There can be no assurance that any of our funds or composites or our other existing and future funds or composites will achieve similar returns.
The following table presents the return information for the Private Credit and Liquid Credit composites:
| Three Months Ended March 31, | March 31, 2023 | |||||||||||||||||||||||
| 2023 | 2022 | Inception to Date | ||||||||||||||||||||||
| Composite (a) | Gross | Net | Gross | Net | Gross | Net | ||||||||||||||||||
| Private Credit (b) | 3% | 3% | 2% | 1% | 11% | 7% | ||||||||||||||||||
| Liquid Credit (b) | 3% | 3% | -1% | -1% | 5% | 4% |
The returns presented herein represent those of the applicable Blackstone Funds and not those of Blackstone.
| (a) | Net returns are based on the change in carrying value (realized and unrealized) after management fees, expenses and Performance Allocations, net of tax advances. |
|---|
| (b) | Private Credit returns include mezzanine lending funds and middle market direct lending funds (including BXSL and BCRED), stressed/distressed strategies (including stressed/distressed funds and credit alpha strategies) and energy strategies. Liquid Credit returns include CLOs, closed-ended funds, open-ended funds and separately managed accounts. Only fee-earning funds exceeding $100 million of fair value at the beginning of each respective quarter-end are included. Funds in liquidation, funds investing primarily in investment grade corporate credit and asset-based finance funds are excluded. Blackstone Funds that were contributed to BXC as part of Blackstone’s acquisition of BXC in March 2008 and the pre-acquisition date performance for funds and vehicles acquired by BXC subsequent to March 2008, are also excluded. Private Credit and Liquid Credit’s inception to date returns are from December 31, 2005. |
|---|
Operating Metrics
The following table presents information regarding our Invested Performance Eligible Assets Under Management:
| Invested Performance Eligible Assets Under Management | Estimated % Above High Water Mark/ Hurdle (a) | |||||||||||
| As of March 31, | As of March 31, | |||||||||||
| 2023 | 2022 | 2023 | 2022 | |||||||||
| (Dollars in Thousands) | ||||||||||||
| Credit & Insurance (b) | $ | 85,672,809 | $ | 71,336,513 | 93% | 93% |
| (a) | Estimated % Above High Water Mark/Hurdle represents the percentage of Invested Performance Eligible Assets Under Management that as of the dates presented would earn performance fees when the applicable Credit & Insurance managed fund has positive investment performance relative to a hurdle, where applicable. Incremental positive performance in the applicable Blackstone Funds may cause additional assets to reach their respective High Water Mark or clear a hurdle return, thereby resulting in an increase in Estimated % Above High Water Mark/Hurdle. |
|---|
| (b) | For the Credit & Insurance managed funds, at March 31, 2023, the incremental appreciation needed for the 7% of Invested Performance Eligible Assets Under Management below their respective High Water Marks/Hurdles to reach their respective High Water Marks/Hurdles was $1.9 billion, an increase of $61.0 million, compared to $1.8 billion at March 31, 2022. Of the Invested Performance Eligible Assets Under Management below their respective High Water Marks/Hurdles as of March 31, 2023, 51% were within 5% of reaching their respective High Water Mark. |
|---|
Hedge Fund Solutions
The following table presents the results of operations for our Hedge Fund Solutions segment:
| Three Months Ended | ||||||||||||||||
| March 31, | 2023 vs. 2022 | |||||||||||||||
| 2023 | 2022 | $ | % | |||||||||||||
| (Dollars in Thousands) | ||||||||||||||||
| Management Fees, Net | ||||||||||||||||
| Base Management Fees | $ | 135,771 | $ | 145,046 | $ | (9,275) | -6% | |||||||||
| Transaction and Other Fees, Net | 1,914 | 1,469 | 445 | 30% | ||||||||||||
| Management Fee Offsets | (2) | (69) | 67 | -97% | ||||||||||||
| Total Management Fees, Net | 137,683 | 146,446 | (8,763) | -6% | ||||||||||||
| Fee Related Compensation | (45,736) | (47,235) | 1,499 | -3% | ||||||||||||
| Other Operating Expenses | (26,466) | (23,184) | (3,282) | 14% | ||||||||||||
| Fee Related Earnings | 65,481 | 76,027 | (10,546) | -14% | ||||||||||||
| Realized Performance Revenues | 5,927 | 28,913 | (22,986) | -80% | ||||||||||||
| Realized Performance Compensation | (3,153) | (9,000) | 5,847 | -65% | ||||||||||||
| Realized Principal Investment Income | 2,569 | 14,901 | (12,332) | -83% | ||||||||||||
| Net Realizations | 5,343 | 34,814 | (29,471) | -85% | ||||||||||||
| Segment Distributable Earnings | $ | 70,824 | $ | 110,841 | $ | (40,017) | -36% | |||||||||
n/m Not meaningful.
Three Months Ended March 31, 2023 Compared to Three Months Ended March 31, 2022
Segment Distributable Earnings were $70.8 million for the three months ended March 31, 2023, a decrease of $40.0 million, compared to $110.8 million for the three months ended March 31, 2022. The decrease in Segment Distributable Earnings was attributable to decreases of $10.5 million in Fee Related Earnings and $29.5 million in Net Realizations.
Strategies across our Hedge Fund Solutions segment navigated a volatile quarter for markets to generally outperform the broader market with significantly less volatility. The performance of some of the underlying managers in our Hedge Fund Solutions segment, however, was adversely impacted by the challenging market environment. Segment Distributable Earnings in the Hedge Fund Solutions segment would likely be negatively impacted by a significant or sustained weak market environment or decline in asset prices, including as a result of concerns over macroeconomic and geopolitical factors. In addition, while certain of our strategies are designed to benefit from a high interest rate environment, in an environment concurrently characterized by high interest rates and weak equity markets, it may be difficult for funds in certain strategies to exceed interest
rate-based
performance hurdles to which such funds are subject. This would negatively impact our Segment Distributable Earnings.
Outperformance relative to the broader market by strategies in our Hedge Fund Solutions segment, particularly during times of meaningful equity market volatility, could contribute to increased flows in the segment. Despite significant recent volatility, however, overall in recent years markets have experienced relatively low volatility, which has at times resulted in certain investors reallocating capital away from traditional hedge fund strategies. To the extent markets experience a prolonged period of low volatility and outperform our hedge fund strategies, investors may seek to reallocate capital away from traditional hedge fund strategies, which could negatively impact net flows in our Hedge Fund Solutions segment. Conversely, outperformance by our Hedge Fund Solutions strategies in a weak market environment has in some cases resulted in such strategies representing an
increasing portion of the value of certain investors’ portfolios, which may limit such investors’ ability to allocate additional capital to certain funds in the segment, or result in such investors seeking to withdraw capital from such funds. The Hedge Fund Solutions segment operates multiple business lines, manages strategies that are both long and short asset classes and generates a majority of its revenue through management fees. In that regard, the segment’s revenues depend in part on our ability to successfully grow such existing, diverse business lines and strategies and to identify and scale new ones to meet evolving investor appetites. In recent years we have shifted the mix of our product offerings to include more products whose
performance-based
fees represent a more significant proportion of the fees earned from such products than has historically been the case.
Fee Related Earnings
Fee Related Earnings were $65.5 million for the three months ended March 31, 2023, a decrease of $10.5 million, compared to $76.0 million for the three months ended March 31, 2022. The decrease in Fee Related Earnings was primarily attributable to a decrease of $8.8 million in Management Fees, Net and an increase of $3.3 million in Other Operating Expenses.
Management Fees, Net were $137.7 million for the three months ended March 31, 2023, a decrease of $8.8 million, compared to $146.4 million for the three months ended March 31, 2022, primarily driven by a decrease in Base Management Fees. Base Management Fees decreased $9.3 million primarily due to a decrease in
Fee-Earning
Assets Under Management in commingled products.
Other Operating Expenses were $26.5 million for the three months ended March 31, 2023, an increase of $3.3 million, compared to $23.2 million for the three months ended March 31, 2022. The increase was primarily due to technology-related expenses, travel and entertainment and occupancy costs.
Net Realizations
Net Realizations were $5.3 million for the three months ended March 31, 2023, a decrease of $29.5 million, compared to $34.8 million for the three months ended March 31, 2022. The decrease in Net Realizations was primarily attributable to decreases of $23.0 million in Realized Performance Revenues and $12.3 million in Realized Principal Investment Income, partially offset by a decrease of $5.8 million in Realized Performance Compensation.
Realized Performance Revenues were $5.9 million for the three months ended March 31, 2023, a decrease of $23.0 million, compared to $28.9 million for the three months ended March 31, 2022. The decrease was primarily driven by reduced Realized Performance Revenues in liquid and specialized solutions and in customized solutions.
Realized Principal Investment Income was $2.6 million for the three months ended March 31, 2023, a decrease of $12.3 million, compared to $14.9 million for the three months ended March 31, 2022. The decrease was primarily due to the segment’s allocation of the gain recognized in a Pátria sale transaction in the first quarter of 2022.
Realized Performance Compensation was $3.2 million for the three months ended March 31, 2023, a decrease of $5.8 million, compared to $9.0 million for the three months ended March 31, 2022. The decrease was primarily due to the decrease in Realized Performance Revenues.
Composite Returns
Composite returns information is included throughout this discussion and analysis to facilitate an understanding of our results of operations for the periods presented. The composite returns information reflected in this discussion and analysis is not indicative of the financial performance of Blackstone and is also not necessarily indicative of the future results of any particular fund or composite. An investment in Blackstone is not an investment in any of our funds or composites. There can be no assurance that any of our funds or composites or our other existing and future funds or composites will achieve similar returns.
The following table presents the return information of the BAAM Principal Solutions Composite:
| Three | Average Annual Returns (a) | |||||||||||||||||||||||||||||||||||||||||||||||
| Months Ended | Periods Ended | |||||||||||||||||||||||||||||||||||||||||||||||
| March 31, | March 31, 2023 | |||||||||||||||||||||||||||||||||||||||||||||||
| 2023 | 2022 | One Year | Three Year | Five Year | Historical | |||||||||||||||||||||||||||||||||||||||||||
| Composite | Gross | Net | Gross | Net | Gross | Net | Gross | Net | Gross | Net | Gross | Net | ||||||||||||||||||||||||||||||||||||
| BAAM Principal Solutions Composite (b) | 1 | % | 1 | % | 1 | % | 1 | % | 5 | % | 4 | % | 10 | % | 9 | % | 6 | % | 5 | % | 7 | % | 6 | % |
The returns presented herein represent those of the applicable Blackstone Funds and not those of Blackstone.
| (a) | Composite returns present a summarized asset-weighted return measure to evaluate the overall performance of the applicable class of Blackstone Funds. |
|---|
| (b) | BAAM’s Principal Solutions (“BPS”) Composite covers the period from January 2000 to present, although BAAM’s inception date is September 1990. The BPS Composite includes only BAAM-managed commingled and customized multi-manager funds and accounts and does not include BAAM’s individual investor solutions (liquid alternatives), strategic capital (seeding and GP minority stakes), strategic opportunities (co-invests), and advisory (non-discretionary) platforms, except for investments by BPS funds directly into those platforms. BAAM-managed funds in liquidation and, in the case of net returns, non-fee-paying assets are also excluded. The funds/accounts that comprise the BPS Composite are not managed within a single fund or account and are managed with different mandates. There is no guarantee that BAAM would have made the same mix of investments in a stand-alone fund/account. The BPS Composite is not an investible product and, as such, the performance of the BPS Composite does not represent the performance of an actual fund or account. The historical return is from January 1, 2000. |
|---|
Operating Metrics
The following table presents information regarding our Invested Performance Eligible Assets Under Management:
| Invested Performance Eligible Assets Under Management | Estimated % Above High Water Mark/ Benchmark (a) | |||||||||||
| As of March 31, | As of March 31, | |||||||||||
| 2023 | 2022 | 2023 | 2022 | |||||||||
| (Dollars in Thousands) | ||||||||||||
| Hedge Fund Solutions Managed Funds (b) | $ | 51,134,869 | $ | 50,175,772 | 82% | 77% |
| (a) | Estimated % Above High Water Mark/Benchmark represents the percentage of Invested Performance Eligible Assets Under Management that as of the dates presented would earn performance fees when the applicable Hedge Fund Solutions managed fund has positive investment performance relative to a benchmark, where applicable. Incremental positive performance in the applicable Blackstone Funds may cause additional assets to reach their respective High Water Mark or clear a benchmark return, thereby resulting in an increase in Estimated % Above High Water Mark/Benchmark. |
|---|
| (b) | For the Hedge Fund Solutions managed funds, at March 31, 2023, the incremental appreciation needed for the 18% of Invested Performance Eligible Assets Under Management below their respective High Water Marks/Benchmarks to reach their respective High Water Marks/Benchmarks was $642.4 million, an increase of $140.0 million, compared to $502.4 million at March 31, 2022. Of the Invested Performance Eligible Assets Under Management below their respective High Water Marks/Benchmarks as of March 31, 2023, 60% were within 5% of reaching their respective High Water Mark. |
|---|
Non-GAAP
Financial Measures
These
non-GAAP
financial measures are presented without the consolidation of any Blackstone Funds that are consolidated into the Condensed Consolidated Financial Statements. Consequently, all
non-GAAP
financial measures exclude the assets, liabilities and operating results related to the Blackstone Funds. See “— Key Financial Measures and Indicators” for our definitions of Distributable Earnings, Segment Distributable Earnings, Fee Related Earnings and Adjusted EBITDA.
The following table is a reconciliation of Net Income Attributable to Blackstone Inc. to Distributable Earnings, Total Segment Distributable Earnings, Fee Related Earnings and Adjusted EBITDA:
| Three Months Ended | ||||||||
| March 31, | ||||||||
| 2023 | 2022 | |||||||
| (Dollars in Thousands) | ||||||||
| Net Income Attributable to Blackstone Inc. | $ | 85,812 | $ | 1,216,874 | ||||
| Net Income Attributable to Non-Controlling Interests in Blackstone Holdings | 56,700 | 1,059,313 | ||||||
| Net Income Attributable to Non-Controlling Interests in Consolidated Entities | 74,869 | 216,375 | ||||||
| Net Income (Loss) Attributable to Redeemable Non-Controlling Interests in Consolidated Entities | (6,700 | ) | 5,052 | |||||
| Net Income | 210,681 | 2,497,614 | ||||||
| Provision for Taxes | 47,675 | 483,281 | ||||||
| Net Income Before Provision for Taxes | 258,356 | 2,980,895 | ||||||
| Transaction-Related Charges (a) | 8,621 | 25,333 | ||||||
| Amortization of Intangibles (b) | 11,341 | 17,044 | ||||||
| Impact of Consolidation (c) | (68,169 | ) | (221,427 | ) | ||||
| Unrealized Performance Revenues (d) | 759,316 | (1,293,050 | ) | |||||
| Unrealized Performance Allocations Compensation (e) | (313,249 | ) | 472,284 | |||||
| Unrealized Principal Investment (Income) Loss (f) | 479,120 | (26,758 | ) | |||||
| Other Revenues (g) | 14,180 | (72,819 | ) | |||||
| Equity-Based Compensation (h) | 268,134 | 201,545 | ||||||
| Administrative Fee Adjustment (i) | 2,447 | 2,485 | ||||||
| Taxes and Related Payables (j) | (171,005 | ) | (147,652 | ) | ||||
| Distributable Earnings | 1,249,092 | 1,937,880 | ||||||
| Taxes and Related Payables (j) | 171,005 | 147,652 | ||||||
| Net Interest and Dividend Loss (k) | 9,108 | 12,117 | ||||||
| Total Segment Distributable Earnings | 1,429,205 | 2,097,649 | ||||||
| Realized Performance Revenues (l) | (641,526 | ) | (1,312,810 | ) | ||||
| Realized Performance Compensation (m) | 296,024 | 519,120 | ||||||
| Realized Principal Investment Income (n) | (43,691 | ) | (157,095 | ) | ||||
| Fee Related Earnings | $ | 1,040,012 | $ | 1,146,864 | ||||
| Adjusted EBITDA Reconciliation | ||||||||
| Distributable Earnings | $ | 1,249,092 | $ | 1,937,880 | ||||
| Interest Expense (o) | 104,209 | 66,602 | ||||||
| Taxes and Related Payables (j) | 171,005 | 147,652 | ||||||
| Depreciation and Amortization (p) | 23,175 | 14,316 | ||||||
| Adjusted EBITDA | $ | 1,547,481 | $ | 2,166,450 | ||||
| (a) | This adjustment removes Transaction-Related Charges, which are excluded from Blackstone’s segment presentation. Transaction-Related Charges arise from corporate actions including acquisitions, divestitures, and Blackstone’s initial public offering. They consist primarily of equity-based compensation charges, gains and losses on contingent consideration arrangements, changes in the balance of the Tax Receivable Agreement resulting from a change in tax law or similar event, transaction costs and any gains or losses associated with these corporate actions. |
|---|
| (b) | This adjustment removes the amortization of transaction-related intangibles, which are excluded from Blackstone’s segment presentation. |
|---|
| (c) | This adjustment reverses the effect of consolidating Blackstone Funds, which are excluded from Blackstone’s segment presentation. This adjustment includes the elimination of Blackstone’s interest in these funds and the removal of amounts associated with the ownership of Blackstone consolidated operating partnerships held by non-controlling interests. |
|---|
| (d) | This adjustment removes Unrealized Performance Revenues on a segment basis. The Segment Adjustment represents the add back of performance revenues earned from consolidated Blackstone Funds which have been eliminated in consolidation. |
|---|
| Three Months Ended | ||||||||
| March 31, | ||||||||
| 2023 | 2022 | |||||||
| (Dollars in Thousands) | ||||||||
| GAAP Unrealized Performance Allocations | $ | (759,212 | ) | $ | 1,293,050 | |||
| Segment Adjustment | (104 | ) | — | |||||
| Unrealized Performance Revenues | $ | (759,316 | ) | $ | 1,293,050 | |||
| (e) | This adjustment removes Unrealized Performance Allocations Compensation. |
|---|
| (f) | This adjustment removes Unrealized Principal Investment Income (Loss) on a segment basis. The Segment Adjustment represents (1) the add back of Principal Investment Income, including general partner income, earned from consolidated Blackstone Funds which have been eliminated in consolidation, and (2) the removal of amounts associated with the ownership of Blackstone consolidated operating partnerships held by non-controlling interests. |
|---|
| Three Months Ended | ||||||||
| March 31, | ||||||||
| 2023 | 2022 | |||||||
| (Dollars in Thousands) | ||||||||
| GAAP Unrealized Principal Investment Income (Loss) | $ | (491,417 | ) | $ | 73,961 | |||
| Segment Adjustment | 12,297 | (47,203 | ) | |||||
| Unrealized Principal Investment Income (Loss) | $ | (479,120 | ) | $ | 26,758 | |||
| (g) | This adjustment removes Other Revenues on a segment basis. The Segment Adjustment represents (1) the add back of Other Revenues earned from consolidated Blackstone Funds which have been eliminated in consolidation, and (2) the removal of certain Transaction-Related Charges. |
|---|
| Three Months Ended | ||||||||
| March 31, | ||||||||
| 2023 | 2022 | |||||||
| (Dollars in Thousands) | ||||||||
| GAAP Other Revenue | $ | (14,154 | ) | $ | 72,869 | |||
| Segment Adjustment | (26 | ) | (50 | ) | ||||
| Other Revenues | $ | (14,180 | ) | $ | 72,819 | |||
| (h) | This adjustment removes Equity-Based Compensation on a segment basis. |
|---|
| (i) | This adjustment adds an amount equal to an administrative fee collected on a quarterly basis from certain holders of Blackstone Holdings Partnership Units. The administrative fee is accounted for as a capital contribution under GAAP, but is reflected as a reduction of Other Operating Expenses in Blackstone’s segment presentation. |
|---|
| (j) | Taxes represent the total GAAP tax provision adjusted to include only the current tax provision (benefit) calculated on Income (Loss) Before Provision (Benefit) for Taxes and adjusted to exclude the tax impact of any divestitures. For interim periods, taxes are calculated using the preferred annualized effective tax rate approach. Related Payables represent tax-related payables including the amount payable under the Tax Receivable Agreement. See “— Key Financial Measures and Indicators — Distributable Earnings” for the full definition of Taxes and Related Payables. |
|---|
| Three Months Ended | ||||||||
| March 31, | ||||||||
| 2023 | 2022 | |||||||
| (Dollars in Thousands) | ||||||||
| Taxes | $ | 151,002 | $ | 124,645 | ||||
| Related Payables | 20,003 | 23,007 | ||||||
| Taxes and Related Payables | $ | 171,005 | $ | 147,652 | ||||
| (k) | This adjustment removes Interest and Dividend Revenue less Interest Expense on a segment basis. The Segment Adjustment represents (1) the add back of Interest and Dividend Revenue earned from consolidated Blackstone Funds which have been eliminated in consolidation, and (2) the removal of interest expense associated with the Tax Receivable Agreement. |
|---|
| Three Months Ended | ||||||||
| March 31, | ||||||||
| 2023 | 2022 | |||||||
| (Dollars in Thousands) | ||||||||
| GAAP Interest and Dividend Revenue | $ | 90,485 | $ | 54,485 | ||||
| Segment Adjustment | 4,616 | — | ||||||
| Interest and Dividend Revenue | 95,101 | 54,485 | ||||||
| GAAP Interest Expense | 104,441 | 66,747 | ||||||
| Segment Adjustment | (232 | ) | (145 | ) | ||||
| Interest Expense | 104,209 | 66,602 | ||||||
| Net Interest and Dividend Loss | $ | (9,108 | ) | $ | (12,117 | ) | ||
| (l) | This adjustment removes the total segment amount of Realized Performance Revenues. |
|---|
| (m) | This adjustment removes the total segment amount of Realized Performance Compensation. |
|---|
| (n) | This adjustment removes the total segment amount of Realized Principal Investment Income. |
|---|
| (o) | This adjustment adds back Interest Expense on a segment basis, excluding interest expense related to the Tax Receivable Agreement. |
|---|
| (p) | This adjustment adds back Depreciation and Amortization on a segment basis. |
|---|
The following tables are a reconciliation of Total GAAP Investments to Net Accrued Performance Revenues. Total GAAP Investments and Net Accrued Performance Revenues consist of the following:
| March 31, | ||||||||
| 2023 | 2022 | |||||||
| (Dollars in Thousands) | ||||||||
| Investments of Consolidated Blackstone Funds | $ | 5,443,867 | $ | 2,045,156 | ||||
| Equity Method Investments | ||||||||
| Partnership Investments | 5,598,552 | 5,858,926 | ||||||
| Accrued Performance Allocations | 11,517,750 | 17,661,244 | ||||||
| Corporate Treasury Investments | 958,632 | 916,510 | ||||||
| Other Investments | 3,467,150 | 3,586,638 | ||||||
| Total GAAP Investments | $ | 26,985,951 | $ | 30,068,474 | ||||
| Accrued Performance Allocations - GAAP | $ | 11,517,750 | $ | 17,661,244 | ||||
| Impact of Consolidation (a) | — | 1 | ||||||
| Due from Affiliates - GAAP (b) | 190,337 | 112,194 | ||||||
| Less: Net Realized Performance Revenues (c) | (379,453 | ) | (743,772 | ) | ||||
| Less: Accrued Performance Compensation - GAAP (d) | (4,956,515 | ) | (7,483,337 | ) | ||||
| Net Accrued Performance Revenues | $ | 6,372,119 | $ | 9,546,330 | ||||
| (a) | This adjustment adds back investments in consolidated Blackstone Funds which have been eliminated in consolidation. |
|---|
| (b) | Represents GAAP accrued performance revenue recorded within Due from Affiliates. |
|---|
| (c) | Represents Performance Revenues realized but not yet distributed as of the reporting date and are included in Distributable Earnings in the period they are realized. |
|---|
| (d) | Represents GAAP accrued performance compensation associated with Accrued Performance Allocations and is recorded within Accrued Compensation and Benefits and Due to Affiliates. |
|---|
Liquidity and Capital Resources
General
Blackstone’s business model derives revenue primarily from third party Assets Under Management. Blackstone is not a capital or balance sheet intensive business and targets operating expense levels such that total management and advisory fees exceed total operating expenses each period. As a result, we require limited capital resources to support the working capital or operating needs of our businesses. We draw primarily on the long-term committed capital of our limited partner investors to fund the investment requirements of the Blackstone Funds and use our own realizations and cash flows to invest in growth initiatives, make commitments to our own funds, where our minimum general partner commitments are generally less than 5% of the limited partner commitments of a fund, and pay dividends to stockholders and distributions to holders of Holdings Units.
Fluctuations in our statement of financial condition result primarily from activities of the Blackstone Funds that are consolidated as well as business transactions, such as the issuance of senior notes. The majority economic ownership interests of such consolidated Blackstone Funds are reflected as Redeemable
Non-Controlling
Interests in Consolidated Entities, and
Non-Controlling
Interests in Consolidated Entities in the Consolidated Financial Statements. The consolidation of these Blackstone Funds has no net effect on Blackstone’s Net Income or Equity. Additionally, fluctuations in our statement of financial condition also include appreciation or depreciation in Blackstone investments in the
non-consolidated
Blackstone Funds, additional investments and redemptions of such interests in the
non-consolidated
Blackstone Funds and the collection of receivables related to management and advisory fees.
Total Assets were $41.1 billion as of March 31, 2023, a decrease of $1.4 billion, from December 31, 2022. The decrease in Total Assets was principally due to a decrease of $1.8 billion in total assets attributable to consolidated operating partnerships, partially offset by an increase of $255.9 million in total assets attributable to consolidated Blackstone Funds. The decrease in total assets attributable to consolidated operating partnerships was primarily due to decreases of $1.4 billion in Cash and Cash Equivalents and $965.2 million in Investments, respectively. The decrease in Cash and Cash Equivalents was primarily due to ongoing operating activities including the payoff at maturity of Blackstone’s 4.750% senior note due February 15, 2023. The decrease in Investments was primarily due to unrealized depreciation across our Real Estate and Credit & Insurance segments. The increase in total assets attributable to consolidated Blackstone Funds was primarily due to an increase of $307.3 million in Investments. The increase in Investments was primarily due to the consolidation of one CLO.
Total Liabilities were $22.4 billion as of March 31, 2023, a decrease of $470.5 million, from December 31, 2022. The decrease in Total Liabilities was principally due to a decrease of $866.9 million in total liabilities attributable to consolidated operating partnerships, partially offset by an increase of $405.3 million in total liabilities attributable to consolidated Blackstone Funds. The decrease in total liabilities attributable to consolidated operating partnerships was primarily due to decreases of $631.0 million in Accrued Compensation and Benefits and $330.6 million in Loans Payable. The decrease in Accrued Compensation and Benefits was primarily due to a decrease in performance compensation. The decrease in Loans Payable was primarily due to the payoff at maturity of senior notes, partially offset by the consolidation of one Blackstone operating partnership. The increase in total liabilities attributable to consolidated Blackstone Funds was primarily due to an increase of $292.5 million in Loans Payable. The increase in Loans Payable was primarily due to the consolidation of one CLO.
In light of the disruption to the U.S. regional banking system during the three months ended March 31, 2023, Blackstone assessed its exposure and determined that it had no material exposure to such banks. Blackstone has taken mitigating actions to reduce the limited and isolated areas of exposure identified and continues to monitor developments.
Sources and Uses of Liquidity
We have multiple sources of liquidity to meet our capital needs, including annual cash flows, accumulated earnings in our businesses, the proceeds from our issuances of senior notes, liquid investments we hold on our balance sheet and access to our $4.135 billion committed revolving credit facility. As of March 31, 2023, Blackstone had $2.8 billion in Cash and Cash Equivalents, $958.6 million invested in Corporate Treasury Investments and $3.5 billion in Other Investments (which included $3.1 billion of liquid investments), against $10.7 billion in borrowings from our bond issuances, and no borrowings outstanding under our revolving credit facility.
In addition to the cash we received from our notes offerings and availability under our revolving credit facility, we expect to receive (a) cash generated from operating activities, (b) Performance Revenue realizations, and (c) realizations on the fund investments that we make. The amounts received from these three sources in particular may vary substantially from year to year and quarter to quarter depending on the frequency and size of realization events or net returns experienced by our investment funds. Our available capital could be adversely affected if there are prolonged periods of few substantial realizations from our investment funds accompanied by substantial capital calls for new investments from those investment funds. Therefore, Blackstone’s commitments to our funds are taken into consideration when managing our overall liquidity and cash position.
We expect that our primary liquidity needs will be cash to (a) provide capital to facilitate the growth of our existing businesses, which principally includes funding our general partner and
co-investment
commitments to our funds, (b) provide capital for business expansion, (c) pay operating expenses, including cash compensation to our employees and other obligations as they arise, (d) fund modest capital expenditures, (e) repay borrowings and related interest costs, (f) pay income taxes, (g) repurchase shares of our common stock and Blackstone Holdings Partnership Units pursuant to our repurchase program and (h) pay dividends to our stockholders and distributions to the holders of Blackstone Holdings Partnership Units. For a tabular presentation of Blackstone’s contractual obligations and the expected timing of such see “— Contractual Obligations.”
Capital Commitments
Our own capital commitments to our funds, the funds we invest in and our investment strategies as of March 31, 2023 consisted of the following:
| Senior Managing Directors | ||||||||||||||||
| Blackstone and | and Certain Other | |||||||||||||||
| General Partner (a) | Professionals (b) | |||||||||||||||
| Original | Remaining | Original | Remaining | |||||||||||||
| Fund | Commitment | Commitment | Commitment | Commitment | ||||||||||||
| (Dollars in Thousands) | ||||||||||||||||
| Real Estate | ||||||||||||||||
| BREP VI | $ | 750,000 | $ | 36,809 | $ | 150,000 | $ | 12,270 | ||||||||
| BREP VII | 300,000 | 32,685 | 100,000 | 10,895 | ||||||||||||
| BREP VIII | 300,000 | 41,512 | 100,000 | 13,837 | ||||||||||||
| BREP IX | 300,000 | 54,572 | 100,000 | 18,191 | ||||||||||||
| BREP X | 300,000 | 292,172 | 100,000 | 97,391 | ||||||||||||
| BREP Europe III | 100,000 | 11,257 | 35,000 | 3,752 | ||||||||||||
| BREP Europe IV | 130,000 | 24,074 | 43,333 | 8,025 | ||||||||||||
| BREP Europe V | 150,000 | 25,647 | 43,333 | 7,409 | ||||||||||||
| BREP Europe VI | 130,000 | 69,553 | 43,333 | 23,184 | ||||||||||||
| BREP Asia I | 50,392 | 10,342 | 16,797 | 3,447 | ||||||||||||
| BREP Asia II | 70,707 | 14,711 | 23,569 | 4,904 | ||||||||||||
| BREP Asia III | 81,078 | 70,287 | 27,026 | 23,428 | ||||||||||||
| BREDS III | 50,000 | 13,499 | 16,667 | 4,500 | ||||||||||||
| BREDS IV | 50,000 | 19,586 | 49,113 | 19,239 | ||||||||||||
| BREDS V | 50,000 | 50,000 | 49,660 | 49,660 | ||||||||||||
| BPP | 314,554 | 35,893 | — | — | ||||||||||||
| Other (c) | 27,096 | 9,082 | — | — | ||||||||||||
| Total Real Estate | 3,153,827 | 811,681 | 897,831 | 300,132 | ||||||||||||
continued...
| Senior Managing Directors | ||||||||||||||||
| Blackstone and | and Certain Other | |||||||||||||||
| General Partner (a) | Professionals (b) | |||||||||||||||
| Original | Remaining | Original | Remaining | |||||||||||||
| Fund | Commitment | Commitment | Commitment | Commitment | ||||||||||||
| (Dollars in Thousands) | ||||||||||||||||
| Private Equity | ||||||||||||||||
| BCP V | $ | 629,356 | $ | 30,642 | $ | — | $ | — | ||||||||
| BCP VI | 719,718 | 81,403 | 250,000 | 28,276 | ||||||||||||
| BCP VII | 500,000 | 36,635 | 225,000 | 16,486 | ||||||||||||
| BCP VIII | 500,000 | 250,690 | 225,000 | 112,811 | ||||||||||||
| BCP IX | 500,000 | 500,000 | 225,000 | 225,000 | ||||||||||||
| BEP I | 50,000 | 4,728 | — | — | ||||||||||||
| BEP II | 80,000 | 14,642 | 26,667 | 4,881 | ||||||||||||
| BEP III | 80,000 | 42,493 | 26,667 | 14,164 | ||||||||||||
| BETP IV | 32,806 | 32,806 | 10,935 | 10,935 | ||||||||||||
| BCEP I | 117,747 | 27,016 | 18,992 | 4,358 | ||||||||||||
| BCEP II | 160,000 | 112,284 | 32,640 | 22,906 | ||||||||||||
| BCP Asia I | 40,000 | 5,869 | 13,333 | 1,956 | ||||||||||||
| BCP Asia II | 100,000 | 89,186 | 33,333 | 29,729 | ||||||||||||
| Tactical Opportunities | 463,188 | 211,246 | 154,396 | 70,415 | ||||||||||||
| Strategic Partners | 1,229,655 | 764,847 | 1,133,110 | 702,674 | ||||||||||||
| BIP | 319,353 | 92,324 | — | — | ||||||||||||
| BXLS | 142,057 | 95,841 | 37,353 | 29,963 | ||||||||||||
| BXG | 150,838 | 93,183 | 50,111 | 31,049 | ||||||||||||
| Other (c) | 290,209 | 28,199 | — | — | ||||||||||||
| Total Private Equity | 6,104,927 | 2,514,034 | 2,462,537 | 1,305,603 | ||||||||||||
| Credit & Insurance | ||||||||||||||||
| Mezzanine / Opportunistic II | 120,000 | 29,182 | 110,101 | 26,774 | ||||||||||||
| Mezzanine / Opportunistic III | 130,783 | 38,726 | 96,654 | 28,620 | ||||||||||||
| Mezzanine / Opportunistic IV | 122,000 | 79,739 | 115,614 | 75,565 | ||||||||||||
| European Senior Debt I | 63,000 | 16,508 | 56,882 | 14,905 | ||||||||||||
| European Senior Debt II | 92,543 | 38,459 | 89,670 | 37,290 | ||||||||||||
| European Senior Debt III | 54,323 | 54,323 | 18,108 | 18,108 | ||||||||||||
| Stressed / Distressed II | 125,000 | 51,695 | 119,878 | 49,576 | ||||||||||||
| Stressed / Distressed III | 151,000 | 93,835 | 146,771 | 91,207 | ||||||||||||
| Energy I | 80,000 | 37,630 | 75,445 | 35,487 | ||||||||||||
| Energy II | 150,000 | 104,410 | 148,612 | 103,445 | ||||||||||||
| Energy III | 96,979 | 96,979 | 32,326 | 32,326 | ||||||||||||
| Credit Alpha Fund | 52,102 | 19,752 | 50,670 | 19,209 | ||||||||||||
| Credit Alpha Fund II | 25,500 | 12,550 | 24,385 | 12,001 | ||||||||||||
| Other (c) | 149,967 | 62,419 | 39,175 | 6,785 | ||||||||||||
| Total Credit & Insurance | 1,413,197 | 736,207 | 1,124,291 | 551,298 | ||||||||||||
continued...
| Senior Managing Directors | ||||||||||||||||
| Blackstone and | and Certain Other | |||||||||||||||
| General Partner (a) | Professionals (b) | |||||||||||||||
| Original | Remaining | Original | Remaining | |||||||||||||
| Fund | Commitment | Commitment | Commitment | Commitment | ||||||||||||
| (Dollars in Thousands) | ||||||||||||||||
| Hedge Fund Solutions | ||||||||||||||||
| Strategic Alliance I | $ | 50,000 | $ | 2,033 | $ | — | $ | — | ||||||||
| Strategic Alliance II | 50,000 | 1,482 | — | — | ||||||||||||
| Strategic Alliance III | 22,000 | 15,591 | — | — | ||||||||||||
| Strategic Alliance IV | 15,000 | 15,000 | — | — | ||||||||||||
| Strategic Holdings I | 154,610 | 24,386 | — | — | ||||||||||||
| Strategic Holdings II | 50,000 | 23,930 | — | — | ||||||||||||
| Horizon | 100,000 | 27,765 | — | — | ||||||||||||
| Dislocation | 10,000 | 7,710 | — | — | ||||||||||||
| Other (c) | 17,941 | 8,433 | — | — | ||||||||||||
| Total Hedge Fund Solutions | 469,551 | 126,330 | — | — | ||||||||||||
| Other | ||||||||||||||||
| Treasury (d) | 869,226 | 624,069 | — | — | ||||||||||||
| $ | 12,010,728 | $ | 4,812,321 | $ | 4,484,659 | $ | 2,157,033 | |||||||||
| (a) | We expect our commitments to be drawn down over time and to be funded by available cash and cash generated from operations and realizations. Taking into account prevailing market conditions and both the liquidity and cash or liquid investment balances, we believe that the sources of liquidity described above will be more than sufficient to fund our working capital requirements. Additionally, for some of the general partner commitments shown in the table above, we require our senior managing directors and certain other professionals to fund a portion of the commitment even though the ultimate obligation to fund the aggregate commitment is ours pursuant to the governing agreements of the respective funds. The amounts of the aggregate applicable general partner original and remaining commitment are shown in the table above. |
|---|
| (b) | Includes the full portion of our commitments (i) required to be funded by senior managing directors and certain other professionals and (ii) that are elected by such individuals to be funded for the life of a fund, where such fund permits such election. Excludes amounts that are elected by such individuals to be funded on an annual basis and certain de minimis commitments funded by such individuals in certain carry funds. |
|---|
| (c) | Represents capital commitments to a number of other funds in each respective segment. |
|---|
| (d) | Represents loan origination commitments, revolver commitments and capital market commitments. |
|---|
For a tabular presentation of the timing of Blackstone’s remaining capital commitments to our funds, the funds we invest in and our investment strategies see “— Contractual Obligations.”
Borrowings
As of March 31, 2023, Blackstone Holdings Finance Co. L.L.C. (the “Issuer”), an indirect subsidiary of Blackstone, had issued and outstanding the following senior notes (collectively the “Notes”):
| Aggregate | ||||
| Principal | ||||
| Amount | ||||
| (Dollars/Euros | ||||
| Senior Notes (a) | in Thousands) | |||
| 2.000%, Due 5/19/2025 | € | 300,000 | ||
| 1.000%, Due 10/5/2026 | € | 600,000 | ||
| 3.150%, Due 10/2/2027 | $ | 300,000 | ||
| 5.900%, Due 11/3/2027 | $ | 600,000 | ||
| 1.625%, Due 8/5/2028 | $ | 650,000 | ||
| 1.500%, Due 4/10/2029 | € | 600,000 | ||
| 2.500%, Due 1/10/2030 | $ | 500,000 | ||
| 1.600%, Due 3/30/2031 | $ | 500,000 | ||
| 2.000%, Due 1/30/2032 | $ | 800,000 | ||
| 2.550%, Due 3/30/2032 | $ | 500,000 | ||
| 6.200%, Due 4/22/2033 | $ | 900,000 | ||
| 3.500%, Due 6/1/2034 | € | 500,000 | ||
| 6.250%, Due 8/15/2042 | $ | 250,000 | ||
| 5.000%, Due 6/15/2044 | $ | 500,000 | ||
| 4.450%, Due 7/15/2045 | $ | 350,000 | ||
| 4.000%, Due 10/2/2047 | $ | 300,000 | ||
| 3.500%, Due 9/10/2049 | $ | 400,000 | ||
| 2.800%, Due 9/30/2050 | $ | 400,000 | ||
| 2.850%, Due 8/5/2051 | $ | 550,000 | ||
| 3.200%, Due 1/30/2052 | $ | 1,000,000 | ||
| $ | 10,667,800 | |||
| (a) | The Notes are unsecured and unsubordinated obligations of the Issuer and are fully and unconditionally guaranteed, jointly and severally, by Blackstone Inc. and each of the Blackstone Holdings Partnerships. The Notes contain customary covenants and financial restrictions that, among other things, limit the Issuer and the guarantors’ ability, subject to certain exceptions, to incur indebtedness secured by liens on voting stock or profit participating equity interests of their subsidiaries or merge, consolidate or sell, transfer or lease assets. The Notes also contain customary events of default. All or a portion of the Notes may be redeemed at our option, in whole or in part, at any time and from time to time, prior to their stated maturity, at the make-whole redemption price set forth in the Notes. If a change of control repurchase event occurs, the Notes are subject to repurchase at the repurchase price as set forth in the Notes. |
|---|
Blackstone, through its indirect subsidiary Blackstone Holdings Finance Co. L.L.C., has a $4.135 billion unsecured revolving credit facility (the “Credit Facility”) with Citibank, N.A., as administrative agent with a maturity date of June 3, 2027. Borrowings may also be made in U.K. sterling, euros, Swiss francs, Japanese yen or Canadian dollars, in each case subject to certain
sub-limits.
The Credit Facility contains customary representations, covenants and events of default. Financial covenants consist of a maximum net leverage ratio and a requirement to keep a minimum amount of
fee-earning
assets under management, each tested quarterly.
For a tabular presentation of the payment timing of principal and interest due on Blackstone’s issued notes and revolving credit facility see “— Contractual Obligations.”
Contractual Obligations
The following table sets forth information relating to our contractual obligations as of March 31, 2023 on a consolidated basis and on a basis deconsolidating the Blackstone Funds:
| April 1, 2023 to | ||||||||||||||||||||
| Contractual Obligations | December 31, 2023 | 2024-2025 | 2026-2027 | Thereafter | Total | |||||||||||||||
| (Dollars in Thousands) | ||||||||||||||||||||
| Operating Lease Obligations (a) | $ | 117,824 | $ | 323,747 | $ | 315,579 | $ | 700,982 | $ | 1,458,132 | ||||||||||
| Purchase Obligations | 107,815 | 140,243 | 51,930 | — | 299,988 | |||||||||||||||
| Blackstone Operating Borrowings (b) | — | 325,170 | 1,550,340 | 8,832,290 | 10,707,800 | |||||||||||||||
| Interest on Blackstone Operating Borrowings (c) | 263,101 | 695,848 | 671,300 | 3,563,852 | 5,194,101 | |||||||||||||||
| Borrowings of Consolidated Blackstone Funds | — | — | — | 1,754,992 | 1,754,992 | |||||||||||||||
| Interest on Borrowings of Consolidated Blackstone Funds | 15,283 | 40,756 | 40,756 | 36,513 | 133,308 | |||||||||||||||
| Blackstone Funds Capital Commitments to Investee Funds (d) | 244,467 | — | — | — | 244,467 | |||||||||||||||
| Due to Certain Non-Controlling Interest Holders in Connection with Tax Receivable Agreements (e) | — | 185,598 | 213,661 | 1,176,382 | 1,575,641 | |||||||||||||||
| Unrecognized Tax Benefits, Including Interest and Penalties (f) | — | — | — | — | — | |||||||||||||||
| Blackstone Operating Entities Capital Commitments to Blackstone Funds and Other (g) | 4,812,321 | — | — | — | 4,812,321 | |||||||||||||||
| Consolidated Contractual Obligations | 5,560,811 | 1,711,362 | 2,843,566 | 16,065,011 | 26,180,750 | |||||||||||||||
| Borrowings of Consolidated Blackstone Funds | — | — | — | (1,754,992 | ) | (1,754,992 | ) | |||||||||||||
| Interest on Borrowings of Consolidated Blackstone Funds | (15,283 | ) | (40,756 | ) | (40,756 | ) | (36,513 | ) | (133,308 | ) | ||||||||||
| Blackstone Funds Capital Commitments to Investee Funds (d) | (244,467 | ) | — | — | — | (244,467 | ) | |||||||||||||
| Blackstone Operating Entities Contractual Obligations | $ | 5,301,061 | $ | 1,670,606 | $ | 2,802,810 | $ | 14,273,506 | $ | 24,047,983 | ||||||||||
| (a) | We lease our primary office space and certain office equipment under agreements that expire through 2043. Occupancy lease agreements, in addition to contractual rent payments, generally include additional payments for certain costs incurred by the landlord, such as building expenses, and utilities. To the extent these are fixed or determinable they are included in the table above. The table above includes operating leases that are recognized as Operating Lease Liabilities, short-term leases that are not recorded as Operating Lease Liabilities and leases that have been signed but not yet commenced which are not recorded as Operating Lease Liabilities. The amounts in this table are presented net of contractual sublease commitments. |
|---|
| (b) | Represents the principal amount due on our senior notes and secured borrowings assuming no pre-payments are made and the borrowings are held until their final maturity. As of March 31, 2023, we had no borrowings outstanding under our revolver. |
|---|
| (c) | Represents interest to be paid over the maturity of our senior notes and secured borrowings which has been calculated assuming no pre-payments are made and debt is held until its final maturity date. These amounts include commitment fees for unutilized borrowings under our revolver. |
|---|
| (d) | These obligations represent commitments of the consolidated Blackstone Funds to make capital contributions to investee funds and portfolio companies. These amounts are generally due on demand and are therefore presented in the less than one year category. |
|---|
| (e) | Represents obligations by Blackstone’s corporate subsidiary to make payments under the Tax Receivable Agreements to certain non-controlling interest holders for the tax savings realized from the taxable purchases of their interests in connection with the reorganization at the time of Blackstone’s initial public offering (“IPO”) in 2007 and subsequent purchases. The obligation represents the amount of the payments currently expected to be made, which are dependent on the tax savings actually realized as determined annually without discounting for the timing of the payments. As required by GAAP, the amount of the obligation included in the Condensed Consolidated Financial Statements and shown in Note 16. “Related Party Transactions” (see “Part I. Item 1. Financial Statements”) differs to reflect the net present value of the payments due to certain non-controlling interest holders. |
|---|
| (f) | As of March 31, 2023, there were no Unrecognized Tax Benefits, including Interest and Penalties. In addition, Blackstone is not able to make a reasonably reliable estimate of the timing of payments in individual years in connection with gross unrecognized benefits of $158.8 million and interest of $41.0 million, therefore, such amounts are not included in the above contractual obligations table. |
|---|
| (g) | These obligations represent commitments by us to provide general partner capital funding to the Blackstone Funds, limited partner capital funding to other funds and Blackstone principal investment commitments. These amounts are generally due on demand and are therefore presented in the less than one year category; however, a substantial amount of the capital commitments are expected to be called over the next three years. We expect to continue to make these general partner capital commitments as we raise additional amounts for our investment funds over time. |
|---|
Guarantees
Blackstone and certain of its consolidated funds provide financial guarantees. The amounts and nature of these guarantees are described in Note 17. “Commitments and Contingencies — Contingencies — Guarantees” in the “Notes to Condensed Consolidated Financial Statements” in “Part I. Item 1. Financial Statements” of this filing.
Indemnifications
In many of its service contracts, Blackstone agrees to indemnify the third-party service provider under certain circumstances. The terms of the indemnities vary from contract to contract and the amount of indemnification liability, if any, cannot be determined and has not been included in the above contractual obligations table or recorded in our Condensed Consolidated Financial Statements as of March 31, 2023.
Clawback Obligations
Performance Allocations are subject to clawback to the extent that the Performance Allocations received to date with respect to a fund exceed the amount due to Blackstone based on cumulative results of that fund. The amounts and nature of Blackstone’s clawback obligations are described in Note 17. “Commitments and Contingencies — Contingencies — Contingent Obligations (Clawback)” in the “Notes to Condensed Consolidated Financial Statements” in “Part I. Item 1. Financial Statements” of this filing.
Share Repurchase Program
On December 7, 2021, Blackstone’s board of directors authorized the repurchase of up to $2.0 billion of common stock and Blackstone Holdings Partnership Units. Under the repurchase program, repurchases may be made from time to time in open market transactions, in privately negotiated transactions or otherwise. The timing and the actual number repurchased will depend on a variety of factors, including legal requirements, price and economic and market conditions. The repurchase program may be changed, suspended or discontinued at any time and does not have a specified expiration date.
During the three months ended March 31, 2023, Blackstone repurchased 1.0 million shares of common stock at a total cost of $90.1 million. As of March 31, 2023, the amount remaining available for repurchases under the program was $1.0 billion.
Dividends
Our intention is to pay to holders of common stock a quarterly dividend representing approximately 85% of Blackstone Inc.’s share of Distributable Earnings, subject to adjustment by amounts determined by our board of directors to be necessary or appropriate to provide for the conduct of our business, to make appropriate investments in our business and funds, to comply with applicable law, any of our debt instruments or other agreements, or to provide for future cash requirements such as
tax-related
payments, clawback obligations and dividends to stockholders for any ensuing quarter. The dividend amount could also be adjusted upward in any one quarter.
For Blackstone’s definition of Distributable Earnings, see “— Key Financial Measures and Indicators.”
All of the foregoing is subject to the qualification that the declaration and payment of any dividends are at the sole discretion of our board of directors, and our board of directors may change our dividend policy at any time, including, without limitation, to reduce such quarterly dividends or even to eliminate such dividends entirely.
Because the publicly traded entity and/or its wholly owned subsidiaries must pay taxes and make payments under the tax receivable agreements, the amounts ultimately paid as dividends by Blackstone to common stockholders in respect of each fiscal year are generally expected to be less, on a per share or per unit basis, than the amounts distributed by the Blackstone Holdings Partnerships to the Blackstone personnel and others who are limited partners of the Blackstone Holdings Partnerships in respect of their Blackstone Holdings Partnership Units. Following Blackstone’s conversion from a limited partnership to a corporation, we expect to pay more corporate income taxes than we would have as a limited partnership, which will increase this difference between the per share dividend and per unit distribution amounts.
Dividends are treated as qualified dividends to the extent of Blackstone’s current and accumulated earnings and profits, with any excess dividends treated as a return of capital to the extent of the stockholder’s basis.
The following graph shows fiscal quarterly and annual per common stockholder dividends for 2023 and 2022. Dividends are declared and paid in the quarter subsequent to the quarter in which they are earned.
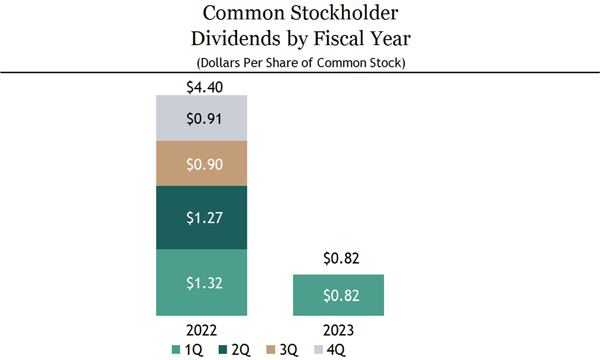
With respect to the first quarter of fiscal year 2023, we paid to stockholders of our common stock a dividend of $0.82 per share. With respect to fiscal year 2022, we paid stockholders aggregate dividends of $4.40 per share.
Leverage
We may under certain circumstances use leverage opportunistically and over time to create the most efficient capital structure for Blackstone and our stockholders. In addition to the borrowings from our notes issuances and our revolving credit facility, we may use reverse repurchase agreements, repurchase agreements and securities sold, not yet purchased. Reverse repurchase agreements are entered into primarily to take advantage of opportunistic yields otherwise absent in the overnight markets and also to use the collateral received to cover securities sold, not yet purchased. Repurchase agreements are entered into primarily to opportunistically yield higher spreads on purchased securities. The balances held in these financial instruments fluctuate based on Blackstone’s liquidity needs, market conditions and investment risk profiles.
The following table presents information regarding these financial instruments in our Condensed Consolidated Statements of Financial Condition:
| Securities | ||||||||
| Repurchase | Sold, Not Yet | |||||||
| Agreements | Purchased | |||||||
| (Dollars in Millions) | ||||||||
| Balance, March 31, 2023 | $ | 19.6 | $ | 3.9 | ||||
| Balance, December 31, 2022 | $ | 89.9 | $ | 3.8 | ||||
| Three Months Ended March 31, 2023 | ||||||||
| Average Daily Balance | $ | 54.3 | $ | 3.8 | ||||
| Maximum Daily Balance | $ | 90.1 | $ | 3.9 |
Critical Accounting Policies
We prepare our Condensed Consolidated Financial Statements in accordance with GAAP. In applying many of these accounting principles, we need to make assumptions, estimates and/or judgments that affect the reported amounts of assets, liabilities, revenues and expenses in our Condensed Consolidated Financial Statements. We base our estimates and judgments on historical experience and other assumptions that we believe are reasonable under the circumstances. These assumptions, estimates and/or judgments, however, are often subjective. Actual results may be affected negatively based on changing circumstances. If actual amounts are ultimately different from our estimates, the revisions are included in our results of operations for the period in which the actual amounts become known. We believe the following critical accounting policies could potentially produce materially different results if we were to change underlying assumptions, estimates and/or judgments. For a description of our accounting policies, see Note 2. “Summary of Significant Accounting Policies” in the “Notes to Condensed Consolidated Financial Statements” in “Part I. Item 1. Financial Statements” of this filing.
Principles of Consolidation
For a description of our accounting policy on consolidation, see Note 2. “Summary of Significant Accounting Policies — Consolidation” and Note 9. “Variable Interest Entities” in the “Notes to Condensed Consolidated Financial Statements” in “Part I. Item 1. Financial Statements” of this filing for detailed information on Blackstone’s involvement with VIEs. The following discussion is intended to provide supplemental information about how the application of consolidation principles impact our financial results, and management’s process for implementing those principles including areas of significant judgment.
The determination that Blackstone holds a controlling financial interest in a Blackstone Fund or investment vehicle significantly changes the presentation of our condensed consolidated financial statements. In our Condensed Consolidated Statements of Financial Position included in this filing, we present 100% of the assets and liabilities of consolidated VIEs along with a
non-controlling
interest which represents the portion of the consolidated vehicle’s interests held by third parties. However, assets of our consolidated VIEs can only be used to settle obligations of the consolidated VIE and are not available for general use by Blackstone. Further, the liabilities of our consolidated VIEs do not have recourse to the general credit of Blackstone. In the Condensed Consolidated Statements of Operations, we eliminate any management fees, Incentive Fees, or Performance Allocations received or accrued from consolidated VIEs as they are considered intercompany transactions. We recognize 100% of the consolidated VIE’s investment income (loss) and allocate the portion of that income (loss) attributable to third party ownership to
non-controlling
interests in arriving at Net Income Attributable to Blackstone Inc.
The assessment of whether we consolidate a Blackstone Fund or investment vehicle we manage requires the application of significant judgment. These judgments are applied both at the time we become involved with the VIE and on an ongoing basis and include, but are not limited to:
| • | Determining whether our management fees, Incentive Fees or Performance Allocations represent variable interests – We make judgments as to whether the fees we earn are commensurate with the level of effort required for those fees and at market rates. In making this judgment, we consider, among other things, the extent of third party investment in the entity and the terms of any other interests we hold in the VIE. |
|---|
| • | Determining whether kick-out rights are substantive – We make judgments as to whether the third party investors in a partnership entity have the ability to remove the general partner, the investment manager or its equivalent, or to dissolve (liquidate) the partnership entity, through a simple majority vote. This includes an evaluation of whether barriers to exercise these rights exist. |
|---|
| • | Concluding whether Blackstone has an obligation to absorb losses or the right to receive benefits that could potentially be significant to the VIE – As there is no explicit threshold in GAAP to define “potentially significant,” management must apply judgment and evaluate both quantitative and qualitative factors to conclude whether this threshold is met. |
|---|
Revenue Recognition
For a description of our accounting policy on revenue recognition, see Note 2. “Summary of Significant Accounting Policies — Revenue Recognition” in the “Notes to Condensed Consolidated Financial Statements” in “Part I. Item 1. Financial Statements.” For an additional description of the nature of our revenue arrangements, including how management fees, Incentive Fees, and Performance Allocations are generated, please refer to “Part I. Item 1. Business — Fee Structure/Incentive Arrangements” in our Annual Report on
Form 10-K
for the year ended December 31, 2022. The following discussion is intended to provide supplemental information about how the application of revenue recognition principles impact our financial results, and management’s process for implementing those principles including areas of significant judgment.
Management and Advisory Fees, Net
— Blackstone earns base management fees from its customers at a fixed percentage of a calculation base which is typically assets under management, net asset value, gross asset value, total assets, committed capital or invested capital. The range of management fee rates and the calculation base from which they are earned, generally, are as follows:
On private equity, real estate, and certain of our hedge fund solutions and credit-focused funds:
| • | 0.25% to 1.75% of committed capital or invested capital during the investment period, |
|---|
| • | 0.25% to 1.50% of invested capital, committed capital or investment fair value subsequent to the investment period for private equity and real estate funds, and |
|---|
| • | 1.00% to 1.75% of invested capital or net asset value subsequent to the investment period for certain of our hedge fund solutions and credit-focused funds. |
|---|
On real estate and credit-focused funds structured like hedge funds:
| • | 0.50% to 1.00% of net asset value. |
|---|
On credit separately managed accounts:
| • | 0.20% to 1.35% of net asset value or total assets. |
|---|
On real estate separately managed accounts:
| • | 0.65% to 2.00% of invested capital, net operating income or net asset value. |
|---|
On insurance separately managed accounts and investment vehicles:
| • | 0.25% to 1.00% of net asset value. |
|---|
On funds of hedge funds, certain hedge funds and separately managed accounts invested in hedge funds:
| • | 0.20% to 1.50% of net asset value. |
|---|
On CLO vehicles:
| • | 0.20% to 0.50% of the aggregate par amount of collateral assets, including principal cash. |
|---|
On credit-focused registered and
non-registered
investment companies:
| • | 0.25% to 1.25% of total assets or net asset value. |
|---|
The investment adviser of BXMT receives annual management fees based on 1.50% of BXMT’s net proceeds received from equity offerings and accumulated “distributable earnings” (which is generally equal to its GAAP net income excluding certain
non-cash
and other items), subject to certain adjustments. The investment advisers of BREIT and BEPIF receive a management fee of 1.25% per annum of net asset value, payable monthly.
Management fee calculations based on committed capital or invested capital are mechanical in nature and therefore do not require the use of significant estimates or judgments. Management fee calculations based on net asset value, total assets, or investment fair value depend on the fair value of the underlying investments within the funds. Estimates and assumptions are made when determining the fair value of the underlying investments within the funds and could vary depending on the valuation methodology that is used as well as economic conditions. See “— Fair Value” below for further discussion of the judgment required for determining the fair value of the underlying investments.
Investment Income (Loss)
— Performance Allocations are made to the general partner based on cumulative fund performance to date, subject to a preferred return to limited partners. Blackstone has concluded that investments made alongside its limited partners in a partnership which entitle Blackstone to a Performance Allocation represent equity method investments that are not in the scope of the GAAP guidance on accounting for revenues from contracts with customers. Blackstone accounts for these arrangements under the equity method of accounting. Under the equity method, Blackstone’s share of earnings (losses) from equity method investments is determined using a balance sheet approach referred to as the hypothetical liquidation at book value (“HLBV”) method. Under the HLBV method, at the end of each reporting period Blackstone calculates the accrued Performance Allocations that would be due to Blackstone for each fund pursuant to the fund agreements as if the fair value of the underlying investments were realized as of such date, irrespective of whether such amounts have been realized. Performance Allocations are subject to clawback to the extent that the Performance Allocation received to date exceeds the amount due to Blackstone based on cumulative results.
The change in the fair value of the investments held by certain Blackstone Funds is a significant input into the accrued Performance Allocation calculation and accrual for potential repayment of previously received Performance Allocations. Estimates and assumptions are made when determining the fair value of the underlying investments within the funds. See “— Fair Value” below for further discussion related to significant estimates and assumptions used for determining fair value of the underlying investments.
Fair Value
Blackstone uses fair value throughout the reporting process. For a description of our accounting policies related to valuation, see Note 2. “Summary of Significant Accounting Policies — Fair Value of Financial Instruments” and “Summary of Significant Accounting Policies — Investments, at Fair Value” in the “Notes to Condensed Consolidated Financial Statements” in “Part I. Item 1. Financial Statements” of this filing. The following discussion is intended to provide supplemental information about how the application of fair value principles impact our financial results, and management’s process for implementing those principles including areas of significant judgment.
The fair value of the investments held by Blackstone Funds is the primary input to the calculation of certain of our management fees, Incentive Fees, Performance Allocations and the related Compensation we recognize. Generally, Blackstone Funds are accounted for as investment companies under the American Institute of Certified Public Accountants Accounting and Auditing Guide,
Investment Companies
, and in accordance with the GAAP guidance on investment companies and reflect their investments, including majority-owned and controlled investments (the “Portfolio Companies”), at fair value. In the absence of observable market prices, we utilize valuation methodologies applied on a consistent basis and assumptions that we believe market participants would use to determine the fair value of the investments. For investments where little market activity exists management’s determination of fair value is based on the best information available in the circumstances, which may incorporate management’s own assumptions and involves a significant degree of judgment, and the consideration of a combination of internal and external factors, including the appropriate risk adjustments for
non-performance
and liquidity risks.
Blackstone has also elected the fair value option for certain instruments it owns directly, including loans and receivables, investments in private debt securities and other proprietary investments. Blackstone is required to measure certain financial instruments at fair value, including debt instruments, equity securities and freestanding derivatives.
Fair Value of Investments or Instruments that are Publicly Traded
Securities that are publicly traded and for which a quoted market exists will be valued at the closing price of such securities in the principal market in which the security trades, or in the absence of a principal market, in the most advantageous market on the valuation date. When a quoted price in an active market exists, no block discounts or control premiums are permitted regardless of the size of the public security held. In some cases, securities will include legal and contractual restrictions limiting their purchase and sale for a period of time. A discount to publicly traded price may be appropriate in instances where a legal restriction is a characteristic of the security, such as may be required under SEC Rule 144. The amount of the discount, if taken, shall be determined based on the time period that must pass before the restricted security becomes unrestricted or otherwise available for sale.
Fair Value of Investments or Instruments that are not Publicly Traded
Investments for which market prices are not observable include private investments in the equity or debt of operating companies or real estate properties. Our primary methodology for determining the fair values of such investments is generally the income approach which provides an indication of fair value based on the present value of cash flows that a business, security, or property is expected to generate in the future. The most widely used methodology under the income approach is the discounted cash flow method which includes significant assumptions about the underlying investment’s projected net earnings or cash flows, discount rate, capitalization rate and exit multiple. Our secondary methodology, generally used to corroborate the results of the income approach, is typically the market approach. The most widely used methodology under the market approach relies upon valuations for comparable public companies, transactions, or assets, and includes making judgments about which companies, transactions, or assets are comparable. Depending on the facts and circumstances associated with the investment, different primary and secondary methodologies may be used including option value, contingent claims or scenario analysis, yield analysis, projected cash flow through maturity or expiration, probability weighted methods or recent round of financing.
In certain cases debt and equity securities are valued on the basis of prices from an orderly transaction between market participants provided by reputable dealers or pricing services. In determining the value of a particular investment, pricing services may use certain information with respect to transactions in such investments, quotations from dealers, pricing matrices and market transactions in comparable investments and various relationships between investments.
Management Process on Fair Value
Due to the importance of fair value throughout the condensed consolidated financial statements and the significant judgment required to be applied in arriving at those fair values, we have developed a process around valuation that incorporates several levels of approval and review from both internal and external sources. Investments held by Blackstone Funds and investment vehicles are valued on at least a quarterly basis by our internal valuation or asset management teams, which are independent from our investment teams.
For investments valued utilizing the income method and where Blackstone has information rights, we generally have a direct line of communication with each of the Portfolio Companies’ and underlying assets’ finance teams and collect financial data used to support projections used in a discounted cash flow analysis. The valuation team then analyzes the data received and updates the valuation models reflecting any changes in the underlying cash flow projections, weighted-average cost of capital, exit multiple or capitalization rate, and any other valuation input relevant economic conditions.
The results of all valuations of investments held by Blackstone Funds and investment vehicles are reviewed by the relevant business unit’s valuation
sub-committee,
which is comprised of key personnel from the business unit, typically the chief investment officer, chief operating officer, chief financial officer, chief compliance officer (or their respective equivalents where applicable) and other senior managing directors in the business. To further corroborate results, each business unit also generally obtains either a positive assurance opinion or a range of value from an independent valuation party, at least annually for internally prepared valuations for investments that have been held by Blackstone Funds and investment vehicles for greater than a year and quarterly for certain investments. Our firmwide valuation committee, chaired by our Chief Financial Officer and comprised of senior members of our businesses and representatives from corporate functions, including legal and finance, reviews the valuation process for investments held by us and our investment vehicles, including the application of appropriate valuation standards on a consistent basis. Each quarter, the valuation process is also reviewed by the audit committee of our board of directors, which is comprised of our
non-employee
directors.
Income Tax
For a description of our accounting policy on taxes and additional information on taxes see Note 2. “Summary of Significant Accounting Policies” and Note 13. “Income Taxes” in the “Notes to Condensed Consolidated Financial Statements” in “Part I. Item 1. Financial Statements” of this filing.
Our provision for income taxes is composed of current and deferred taxes. Current income taxes approximate taxes to be paid or refunded for the current period. Deferred income taxes reflect the net tax effects of temporary differences between the financial reporting and tax bases of assets and liabilities and are measured using the applicable enacted tax rates and laws that will be in effect when such differences are expected to reverse.
Additionally, significant judgment is required in estimating the provision for (benefit from) income taxes, current and deferred tax balances (including valuation allowance), accrued interest or penalties and uncertain tax positions. In evaluating these judgments, we consider, among other items, projections of taxable income (including the character of such income), beginning with historic results and incorporating assumptions of the amount of future pretax operating income. These assumptions about future taxable income require significant judgment and are consistent with the plans and estimates that Blackstone uses to manage its business. To the extent any portion of the deferred tax assets are not considered to be more likely than not to be realized, a valuation allowance is recorded.
Revisions in estimates and/or actual costs of a tax assessment may ultimately be materially different from the recorded accruals and unrecognized tax benefits, if any.
Recent Accounting Developments
Information regarding recent accounting developments and their impact on Blackstone, if any, can be found in Note 2. “Summary of Significant Accounting Policies” in the “Notes to Condensed Consolidated Financial Statements” in “Part I. Item 1. Financial Statements” of this filing.
Interbank Offered Rates Transition
Certain jurisdictions are currently reforming or phasing out their benchmark interest rates, most notably the London Interbank Offered Rates (“LIBOR”) across multiple currencies. Many such reforms and phase outs became effective at the end of 2021 with select U.S. dollar LIBOR tenors persisting through June 2023 and others potentially persisting on a synthetic basis through September 2024. Blackstone has taken steps to prepare for and mitigate the impact of changing base rates and continues to manage transition efforts and evaluate the impact of prospective changes on existing transactions and contractual arrangements. See “Part I. Item 1A. Risk Factors — Risks Related to Our Business — Interest rates on our and our portfolio companies’ outstanding financial instruments might be subject to change based on regulatory developments, which could adversely affect our revenue, expenses and the value of those financial instruments.” in our Annual Report on Form
10-K
for the year ended December 31, 2022.
Previous: Item 1A. Unaudited Supplemental Presentation of Statements of Financial Condition · Next: Item 3. Quantitative and Qualitative Disclosures About Market Risk