 filings.tools
Item 5. Market for Registrant’s Common Equity, Related Stockholder Matters and Issuer Purchases of Equity Securities
6K characters. Original on sec.gov · Markdown
Item 5. Market for Registrant’s Common Equity, Related Stockholder Matters and Issuer Purchases of Equity Securities
Our common shares are listed on the New York Stock Exchange under the symbol “CAH.” The following table reflects the range of the reported high and low closing prices of our common shares as reported on the New York Stock Exchange Composite Tape and the per share dividends declared for the fiscal years ended June 30, 2014 and 2013. It also reflects the range of the reported high and low closing prices of our common shares from July 1, 2014 through the period ended on July 31, 2014 and the per share dividends declared from July 1, 2014 through the period ended on August 6, 2014:
| High | Low | Dividends | |||||||||
| Fiscal 2013 | |||||||||||
| Quarter Ended: | |||||||||||
| September 30, 2012 | $ | 43.50 | $ | 37.75 | $ | 0.2375 | |||||
| December 31, 2012 | 42.65 | 39.29 | 0.2750 | ||||||||
| March 31, 2013 | 47.09 | 41.62 | 0.2750 | ||||||||
| June 30, 2013 | 48.76 | 41.85 | 0.3025 | ||||||||
| Fiscal 2014 | |||||||||||
| Quarter Ended: | |||||||||||
| September 30, 2013 | $ | 53.57 | $ | 47.02 | $ | 0.3025 | |||||
| December 31, 2013 | 67.48 | 52.95 | 0.3025 | ||||||||
| March 31, 2014 | 73.54 | 65.26 | 0.3025 | ||||||||
| June 30, 2014 | 71.31 | 63.80 | 0.3425 | ||||||||
| Fiscal 2015 | $ | 72.75 | $ | 69.59 | $ | 0.3425 |
At July 31, 2014 there were approximately 10,241 shareholders of record of our common shares.
We anticipate that we will continue to pay quarterly cash dividends in the future. The payment and amount of future dividends remain, however, within the discretion of our Board of Directors and will depend upon our future earnings, financial condition, capital requirements and other factors.
| Issuer Purchases of Equity Securities | |||||||||||||
| Period | Total Number of Shares Purchased (1) | Average Price Paid per Share | Total Number of Shares Purchased as Part of Publicly Announced Programs (2) | Approximate Dollar Value of Shares That May Yet be Purchased Under the Programs (2) (in millions) | |||||||||
| Apr 2014 | 252 | $ | 69.23 | — | $ | 1,011 | |||||||
| May 2014 | 1,661,576 | 67.32 | 1,661,405 | 900 | |||||||||
| Jun 2014 | 2,513,482 | 68.64 | 2,513,288 | 727 | |||||||||
| Total | 4,175,310 | $ | 68.12 | 4,174,693 | $ | 727 |
| (1) | Includes 252, 171 and 194 common shares purchased in April, May and June 2014, respectively, through a rabbi trust as investments of participants in our Deferred Compensation Plan. |
| (2) | On August 8, 2012, our Board of Directors approved a $750 million share repurchase program, which expires on August 31, 2015. During the three months ended June 30, 2014, we repurchased $11 million of our common shares, the remaining amount under this program. On October 29, 2013, our Board of Directors approved a $1.0 billion share repurchase program, which expires on December 31, 2016. During the three months ended June 30, 2014, we repurchased $273 million of our common shares under this program. On August 6, 2014, our Board of Directors authorized an additional $1.0 billion under this share repurchase program. |
| Table of Contents | Cardinal Health, Inc. and Subsidiaries | |
Performance Graph
Five Year Performance Graph
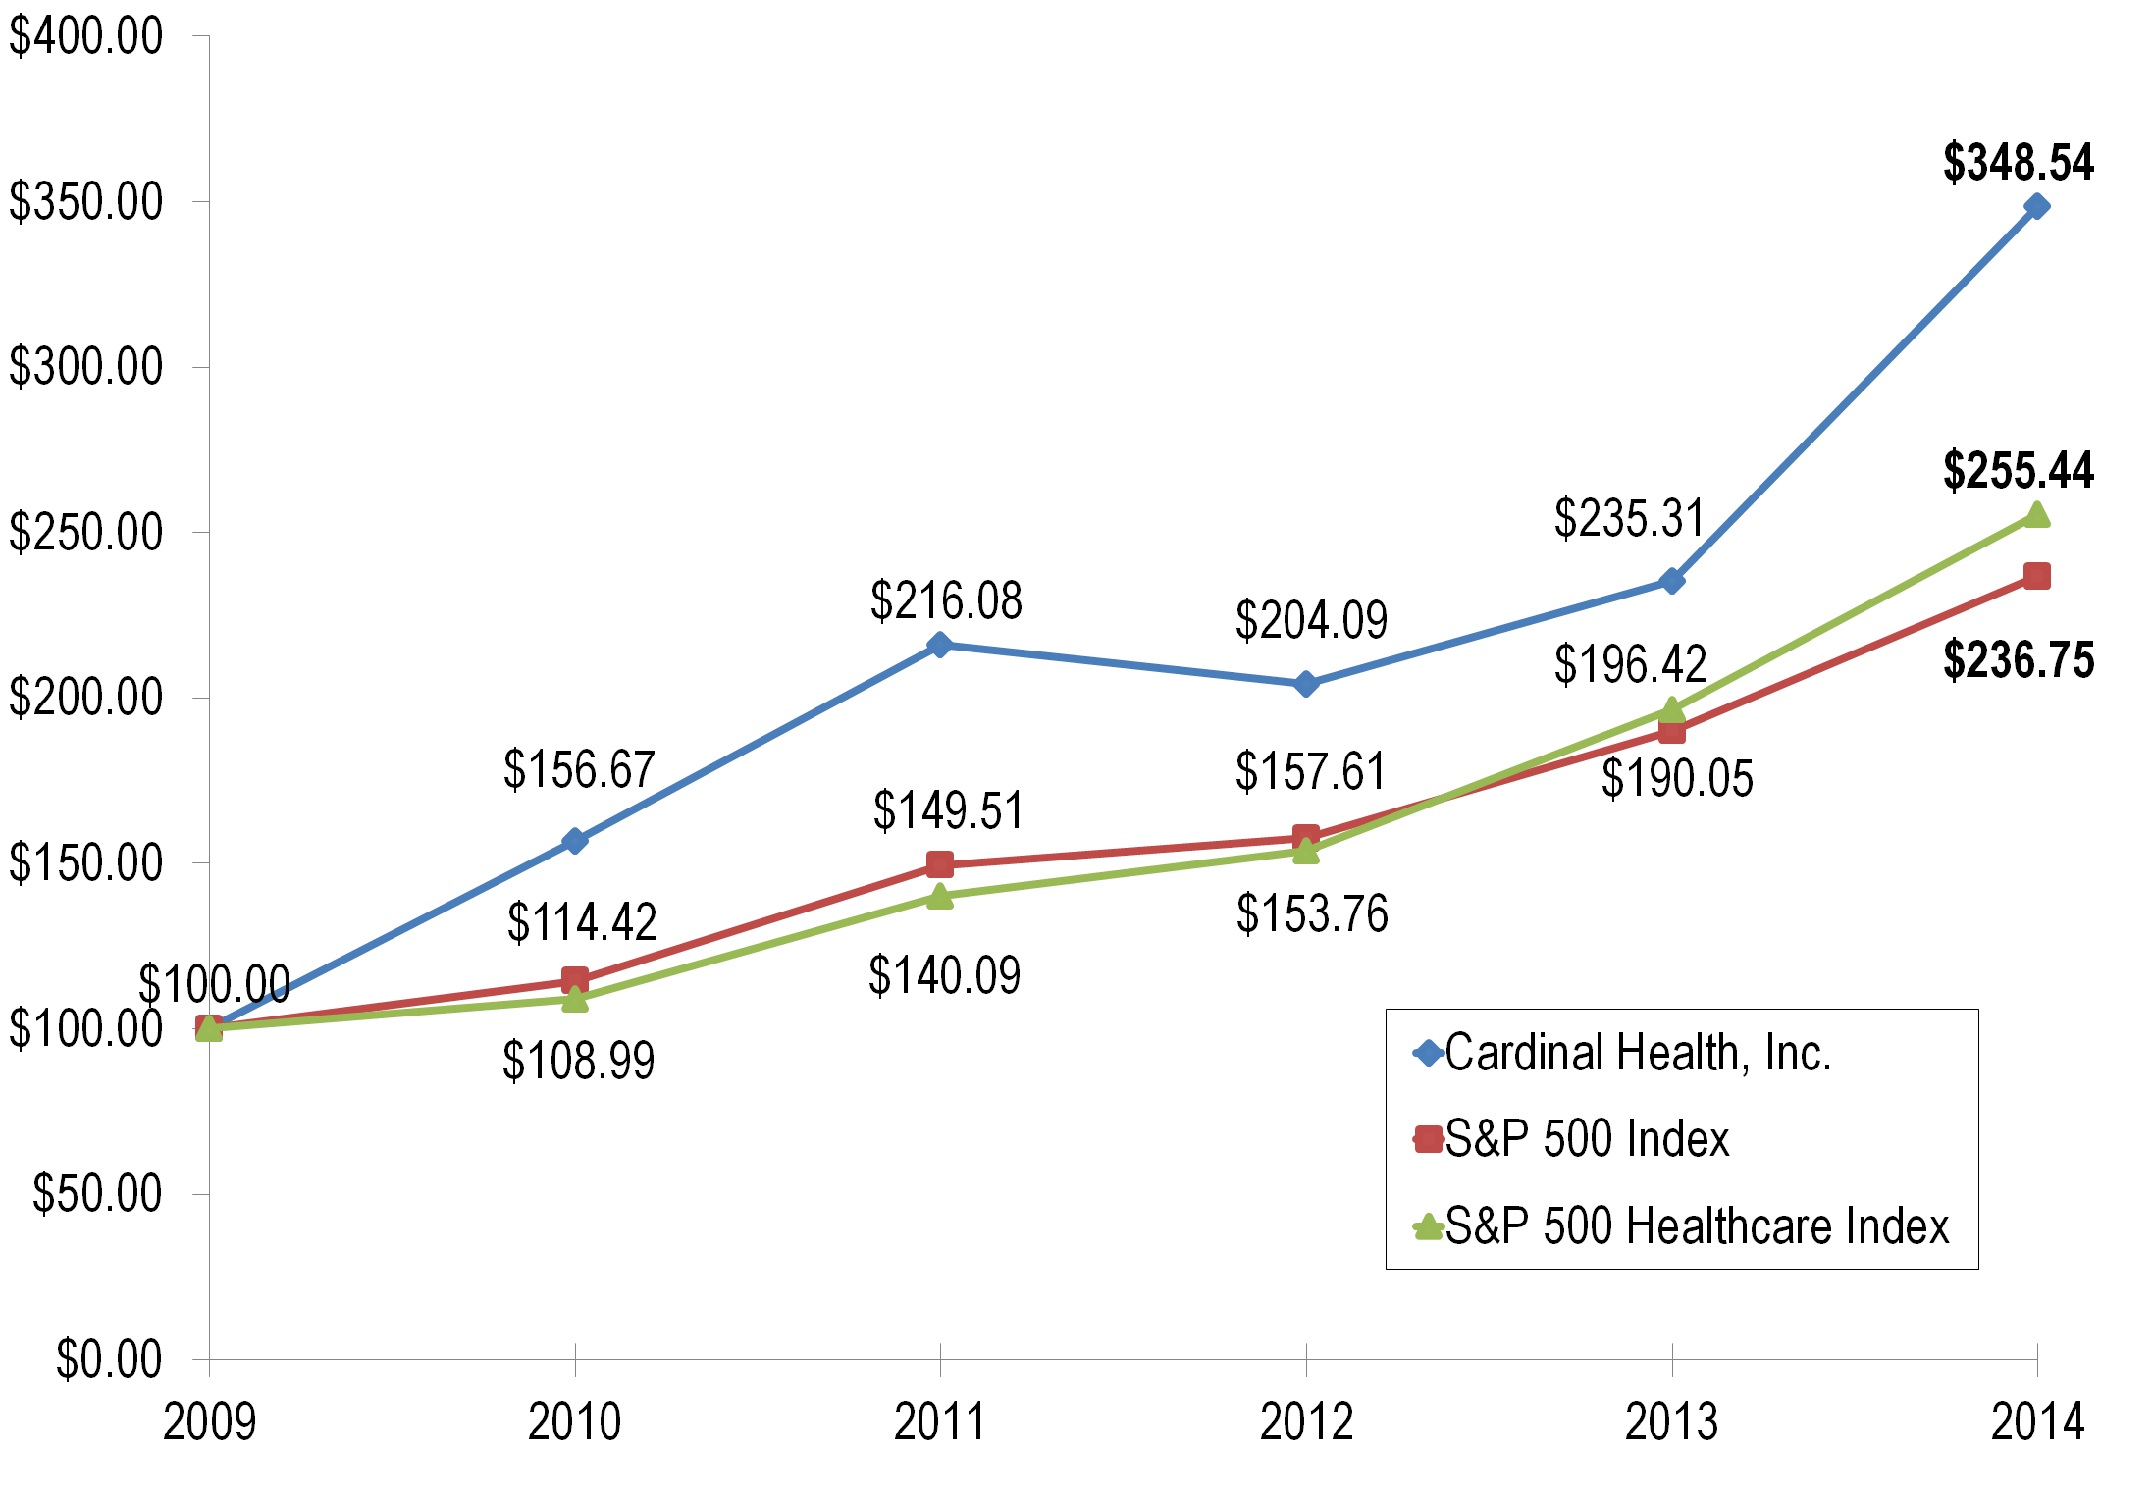
The following line graph compares the cumulative total return of our common shares with the cumulative total return of the Standard & Poor’s Composite—500 Stock Index (the "S&P 500 Index") and the Standard & Poor's Composite—500 Healthcare Index (the "S&P 500 Healthcare Index"). The line graph assumes, in each case, an initial investment of $100 on June 30, 2009, based on the market prices at the end of each fiscal year through and including June 30, 2014, and reinvestment of dividends. The S&P 500 Index and S&P 500 Healthcare Index investments are weighted on the basis of market capitalization at the beginning of each period. We have adjusted the market price of our common shares prior to August 31, 2009 to reflect the CareFusion Spin-Off on August 31, 2009.
| June 30 | ||||||||||||||||||
| 2009 | 2010 | 2011 | 2012 | 2013 | 2014 | |||||||||||||
| Cardinal Health, Inc. | $ | 100.00 | $ | 156.67 | $ | 216.08 | $ | 204.09 | $ | 235.31 | $ | 348.54 | ||||||
| S&P 500 Index | 100.00 | 114.42 | 149.51 | 157.61 | 190.05 | 236.75 | ||||||||||||
| S&P 500 Healthcare Index | 100.00 | 108.99 | 140.09 | 153.76 | 196.42 | 255.44 |
| Table of Contents | Cardinal Health, Inc. and Subsidiaries | |
Previous: Item 4. Mine Safety Disclosures · Next: Item 6. Selected Financial Data