 filings.tools
Item 5. Market for Registrant's Common Equity, Related Stockholder Matters and Issuer Purchases of Equity Securities
6K characters. Original on sec.gov · Markdown
Item 5. Market for Registrant's Common Equity, Related Stockholder Matters and Issuer Purchases of Equity Securities
Our Common Shares have been listed on the New York Stock Exchange since March 25, 1993, with a current par value of CHF 24.15 per share. The trading symbol for our Common Shares is "CB".
We have paid dividends each quarter since we became a public company in 1993. In 2020 and 2019, our annual dividends were paid by way of a distribution from capital contribution reserves (Additional paid-in capital) through the transfer of dividends from Additional paid-in capital to Retained earnings (free reserves) as approved by our shareholders.
Chubb Limited is a holding company whose principal sources of income are dividends and investment income from its operating subsidiaries. The ability of the operating subsidiaries to pay dividends to us and our ability to pay dividends to our shareholders are each subject to legal and regulatory restrictions. The recommendation and payment of future dividends will be based on the determination of the Board of Directors (Board) and will be dependent upon shareholder approval, profits and financial requirements of Chubb and other factors, including legal restrictions on the payment of dividends and other such factors as the Board deems relevant. Refer to Part I, Item 1A and Part II, Item 7 for additional information.
The number of record holders of Common Shares as of February 11, 2021 was 6,598. This is not the actual number of beneficial owners of Chubb's Common Shares since most of our shareholders hold their shares through a stockbroker, bank or other nominee rather than directly in their own names.
Refer to Part III, Item 12 for information relating to compensation plans under which equity securities are authorized for issuance.
Issuer's Repurchases of Equity Securities for the Three Months Ended December 31, 2020
| Period | Total Number of Shares Purchased (1) | Average Price Paid per Share | Total Number of Shares Purchased as Part of Publicly Announced Plan (2) | Approximate Dollar Value of Shares that May Yet be Purchased Under Publicly Announced Plans (3) | |||||||||||||||||||||||||
| October 1 through October 31 | 144,550 | $ | 131.11 | 140,000 | $ | 1.11 | billion | ||||||||||||||||||||||
| November 1 through November 30 | 886,702 | $ | 143.52 | 883,000 | $ | 2.48 | billion | ||||||||||||||||||||||
| December 1 through December 31 | 296,858 | $ | 152.73 | 295,000 | $ | 1.50 | billion | ||||||||||||||||||||||
| Total | 1,328,110 | $ | 144.23 | 1,318,000 |
(1)This column represents open market share repurchases and the surrender to Chubb of Common Shares to satisfy tax withholding obligations in connection with the vesting of restricted stock issued to employees and to cover the cost of the exercise of options by employees through stock swaps.
(2)The aggregate value of shares purchased in the three months ended December 31, 2020 as part of the publicly announced plan was $190 million.
(3)In November 2020, the Board authorized the repurchase of up to $1.5 billion of Chubb's Common Shares from November 19, 2020 through December 31, 2021. Subsequently, in February 2021, the Board approved an increase to the November 2020 share repurchase program of $1.0 billion to a total of $2.5 billion, effective through December 31, 2021. The $1.5 billion November 2019 Board authorization remained effective through December 31, 2020. Repurchases through December 31, 2020 were made under this authorization. For the period January 1, 2021 through February 24, 2021, we repurchased 1,971,000 Common Shares for a total of $327 million in a series of open market transactions under the share repurchase program authorized in November 2020. As of February 24, 2021, $2.17 billion in share repurchase authorization remained through December 31, 2021. Refer to Note 11 to the Consolidated Financial Statements for more information on the Chubb Limited securities repurchase authorizations.
Performance Graph
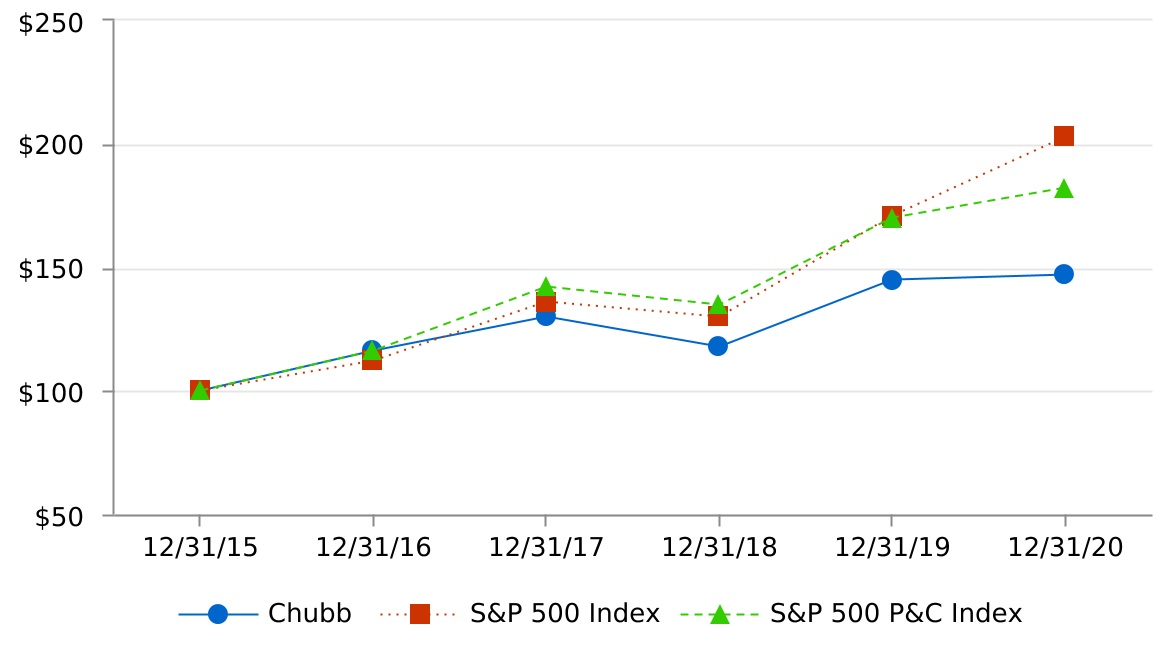
Set forth below is a line graph comparing the dollar change in the cumulative total shareholder return on Chubb's Common Shares from December 31, 2015, through December 31, 2020, as compared to the cumulative total return of the Standard & Poor's 500 Stock Index and the cumulative total return of the Standard & Poor's Property-Casualty Insurance Index. The cumulative total shareholder return is a concept used to compare the performance of a company's stock over time and is the ratio of the stock price change plus the cumulative amount of dividends over the specified time period (assuming dividend reinvestment), to the stock price at the beginning of the time period. The chart depicts the value on December 31, 2016, 2017, 2018, 2019, and 2020, of a $100 investment made on December 31, 2015, with all dividends reinvested.
| 12/31/2015 | 12/31/2016 | 12/31/2017 | 12/31/2018 | 12/31/2019 | 12/31/2020 | |||||||||||||||
| Chubb Limited | $100 | $116 | $130 | $118 | $145 | $147 | ||||||||||||||
| S&P 500 Index | $100 | $112 | $136 | $130 | $171 | $203 | ||||||||||||||
| S&P 500 P&C Index | $100 | $116 | $142 | $135 | $170 | $182 |
Previous: Item 4. Mine Safety Disclosures · Next: Item 6. Selected Financial Data