 filings.tools
Chubb 10-K 2021-12-31
Filed 2022-02-24. 23 sections, 1111K characters. Original on sec.gov · Markdown · JSON
Cover and table of contents
UNITED STATES SECURITIES AND EXCHANGE COMMISSION
Washington, D.C. 20549
FORM 10-K
| ☑ | ANNUAL REPORT PURSUANT TO SECTION 13 OR 15(d) OF THE SECURITIES EXCHANGE ACT OF 1934 |
For the fiscal year ended December 31, 2021
OR
| ☐ | TRANSITION REPORT PURSUANT TO SECTION 13 OR 15(d) OF THE SECURITIES EXCHANGE ACT OF 1934 |
For the Transition Period from to
Commission File No. 1-11778
CHUBB LIMITED
(Exact name of registrant as specified in its charter)
| Switzerland | 98-0091805 | |||||||
| (State or other jurisdiction of incorporation or organization) | (I.R.S. Employer Identification No.) |
Baerengasse 32
Zurich, Switzerland CH-8001
(Address of principal executive offices) (Zip Code)
+41 (0)43 456 76 00
(Registrant’s telephone number, including area code)
| Securities registered pursuant to Section 12(b) of the Act: | |||||||||||
| Title of each class | Trading Symbol(s) | Name of each exchange on which registered | |||||||||
| Common Shares, par value CHF 24.15 per share | CB | New York Stock Exchange | |||||||||
| Guarantee of Chubb INA Holdings Inc. 0.30% Senior Notes due 2024 | CB/24A | New York Stock Exchange | |||||||||
| Guarantee of Chubb INA Holdings Inc. 0.875% Senior Notes due 2027 | CB/27 | New York Stock Exchange | |||||||||
| Guarantee of Chubb INA Holdings Inc. 1.55% Senior Notes due 2028 | CB/28 | New York Stock Exchange | |||||||||
| Guarantee of Chubb INA Holdings Inc. 0.875% Senior Notes due 2029 | CB/29A | New York Stock Exchange | |||||||||
| Guarantee of Chubb INA Holdings Inc. 1.40% Senior Notes due 2031 | CB/31 | New York Stock Exchange | |||||||||
| Guarantee of Chubb INA Holdings Inc. 2.50% Senior Notes due 2038 | CB/38A | New York Stock Exchange |
Securities registered pursuant to Section 12(g) of the Act: None
Indicate by check mark if the registrant is a well-known seasoned issuer, as defined in Rule 405 of the Securities Act. Yes ☑ No ☐
Indicate by check mark if the registrant is not required to file reports pursuant to Section 13 or Section 15(d) of the Act. Yes ☐ No ☑
Indicate by check mark whether the registrant (1) has filed all reports required to be filed by Section 13 or 15 (d) of the Securities Exchange Act of 1934 during the preceding 12 months (or for such shorter period that the registrant was required to file such reports), and (2) has been subject to such filing requirements for the past 90 days. Yes ☑ No ☐
Indicate by check mark whether the registrant has submitted electronically every Interactive Data File required to be submitted pursuant to Rule 405 of Regulation S-T (§232.405 of this chapter) during the preceding 12 months (or for such shorter period that the registrant was required to submit such files). Yes ☑ No ☐
Indicate by check mark whether the registrant is a large accelerated filer, an accelerated filer, a non-accelerated filer, a smaller reporting company, or an emerging growth company. See the definitions of “large accelerated filer,” “accelerated filer,” "smaller reporting company," and “emerging growth company” in Rule 12b-2 of the Exchange Act.
| Large accelerated filer | ☑ | Accelerated filer | ☐ | ||||||||||||||
| Non-accelerated filer | ☐ | Smaller reporting company | ☐ | ||||||||||||||
| Emerging growth company | ☐ |
If an emerging growth company, indicate by check mark if the registrant has elected not to use the extended transition period for complying with any new or revised financial accounting standards provided pursuant to Section 13(a) of the Exchange Act. ☐
Indicate by check mark whether the registrant has filed a report on and attestation to its management's assessment of the effectiveness of its internal control over financial reporting under Section 404(b) of the Sarbanes-Oxley Act (15 U.S.C 7262(b)) by the registered public accounting firm that prepared or issued its audit report. ☑
Indicate by check mark whether the registrant is a shell company (as defined in Rule 12b-2 of the Act). Yes ☐ No ☑
The aggregate market value of voting stock held by non-affiliates as of June 30, 2021 (the last business day of the registrant's most recently completed second fiscal quarter), was approximately $69 billion. For the purposes of this computation, shares held by directors and officers of the registrant have been excluded. Such exclusion is not intended, nor shall it be deemed, to be an admission that such persons are affiliates of the registrant.
As of February 10, 2022, there were 426,229,254 Common Shares par value CHF 24.15 of the registrant outstanding.
| Documents Incorporated by Reference |
Certain portions of the registrant's definitive proxy statement relating to its 2022 Annual General Meeting of Shareholders are incorporated by reference into Part III of this report.
CHUBB LIMITED INDEX TO 10-K
PART I
Item 1. Business
General
Chubb Limited is the Swiss-incorporated holding company of the Chubb Group of Companies. Chubb Limited, which is headquartered in Zurich, Switzerland, and its direct and indirect subsidiaries (collectively, the Chubb Group of Companies, Chubb, we, us, or our) are a global insurance and reinsurance organization, serving the needs of a diverse group of clients worldwide. At December 31, 2021, we had total assets of $200 billion and shareholders’ equity of $60 billion. Chubb was incorporated in 1985 at which time it opened its first business office in Bermuda and continues to maintain operations in Bermuda. We have grown our business through increased premium volume, expansion of product offerings and geographic reach, and the acquisition of other companies to become a global property and casualty (P&C) leader.
With operations in 54 countries and territories, Chubb provides commercial and consumer P&C insurance, personal accident and supplemental health insurance (A&H), reinsurance, and life insurance to a diverse group of clients. We provide commercial insurance products and service offerings such as risk management programs, loss control, and engineering and complex claims management. We provide specialized insurance products ranging from Directors & Officers (D&O) and financial lines to various specialty-casualty and umbrella and excess casualty lines to niche areas such as aviation and energy. We also offer consumer lines insurance coverage including homeowners, automobile, valuables, umbrella liability, and recreational marine products. In addition, we supply A&H and life insurance to individuals in select countries.
We serve multinational corporations, mid-size and small businesses with property and casualty insurance and risk engineering services; affluent and high net worth individuals with substantial assets to protect; individuals purchasing life, personal accident, supplemental health, homeowners, automobile in certain international markets and for high net worth individuals in the U.S., and specialty personal insurance coverage; companies and affinity groups providing or offering accident and health insurance programs and life insurance to their employees or members; and insurers managing exposures with reinsurance coverage.
We make available free of charge through our website (investors.chubb.com, under Financials) our annual report on Form 10-K, quarterly reports on Form 10-Q, current reports on Form 8-K, and amendments to those reports, if any, filed or furnished pursuant to Section 13(a) or 15(d) of the Exchange Act as soon as reasonably practicable after they have been electronically filed with or furnished to the U.S. Securities and Exchange Commission (SEC). Also available through our website (under Investor Relations / Corporate Governance) are our Corporate Governance Guidelines, Code of Conduct, and Charters for the Committees of the Board of Directors (the Board). Printed documents are available by contacting our Investor Relations Department (Telephone: +1 (212) 827-4445, E-mail: investorrelations@chubb.com).
We also use our website as a means of disclosing material, non-public information and for complying with our disclosure obligations under SEC Regulation FD (Fair Disclosure). Accordingly, investors should monitor the Investor Relations portion of our website, in addition to following our press releases, SEC filings, and public conference calls and webcasts. The information contained on, or that may be accessed through, our website is not incorporated by reference into, and is not a part of, this report. The SEC maintains an Internet site (www.sec.gov) that contains reports, proxy and information statements, and other information regarding issuers that file with the SEC.
Customers
For most commercial and personal lines of business we offer, insureds typically use the services of an insurance broker or agent. An insurance broker acts as an agent for the insureds, offering advice on the types and amount of insurance to purchase, and assists in the negotiation of price and terms and conditions. We obtain business from the local and major international insurance brokers and typically pay a commission to brokers for any business accepted and bound. Loss of all or a substantial portion of the business provided by one or more of these brokers could have a material adverse effect on our business. In our opinion, no material part of our business is dependent upon a single insured or group of insureds. We do not believe that the loss of any one insured would have a material adverse effect on our financial condition or results of operations.
Competition
Competition in the insurance and reinsurance marketplace is substantial. We compete on an international and regional basis with major U.S., Bermuda, European, and other international insurers and reinsurers and with underwriting syndicates, some of which have greater financial, technological, marketing, distribution and management resources than we do. In addition, capital market participants have created alternative products that are intended to compete with reinsurance products. We also compete with new companies and existing companies that move into the insurance and reinsurance markets. Competitors include other stock companies, mutual companies, alternative risk sharing groups (such as group captives and catastrophe pools), and other underwriting organizations. Competitors sell through various distribution channels and business models, across a broad array of product lines, and with a high level of variation regarding geographic, marketing, and customer segmentation. We compete for business not only on the basis of price but also on the basis of availability of coverage desired by customers and quality of service.
The insurance industry is changing rapidly. Our ability to compete is dependent on a number of factors, particularly our ability to maintain the appropriate financial strength ratings as assigned by independent rating agencies and effectively using digital capabilities in an everchanging competitive landscape and incorporating, among other things, climate and environmental changes into our insurance processes, products, and services. Our broad market capabilities in personal, commercial, specialty, and A&H lines made available by our underwriting expertise, business infrastructure, and global presence, help define our competitive advantage. Our superior claims service is a significant asset to our business, our business partners and customers, and is unique in the industry. Our strong balance sheet is attractive to businesses, and our strong capital position and global platform affords us opportunities for growth not available to smaller, less diversified insurance companies. Refer to “Segment Information” for competitive environment by segment.
Trademarks and Trade Names
Various trademarks and trade names we use protect names of certain products and services we offer and are important to the extent they provide goodwill and name recognition in the insurance industry. We use commercially reasonable efforts to protect these proprietary rights, including various trade secret and trademark laws. We intend to retain material trademark rights in perpetuity, so long as it satisfies the use and registration requirements of applicable countries. One or more of the trademarks and trade names could be material to our ability to sell our products and services. We have taken appropriate steps to protect our ownership of key names, and we believe it is unlikely that anyone would be able to prevent us from using names in places or circumstances material to our operations.
Human Capital Management
Our employees are critical to our mission to protect the present and build a better future, by providing our customers with the security from risk that allows people and businesses to gro
Showing the first 8K of 94K characters. Open the full section
Item 1A. Risk Factors
Factors that could have a material impact on our results of operations or financial condition are outlined below. Additional risks not presently known to us or that we currently deem insignificant may also impair our business or results of operations as they become known or as facts and circumstances change. Any of the risks described below could result in a material adverse effect on our results of operations or financial condition.
Insurance
Our results of operations or financial condition could be adversely affected by the occurrence of natural and man-made disasters.
We have substantial exposure to losses resulting from natural disasters, man-made catastrophes, such as terrorism or cyber-attack, and other catastrophic events, including pandemics. This could impact a variety of our businesses, including our commercial and personal lines, and life and accident and health (A&H) products. Catastrophes can be caused by various events, including hurricanes, typhoons, earthquakes, hailstorms, droughts, explosions, severe winter weather, fires, war, acts of terrorism, nuclear accidents, political instability, and other natural or man-made disasters, including a global or other wide-impact pandemic or a significant cyber-attack. The incidence and severity of catastrophes are inherently unpredictable and our losses from catastrophes could be substantial. In addition, climate change and resulting changes in global temperatures, weather patterns, and sea levels may both increase the frequency and severity of natural catastrophes and the resulting losses in the future and impact our risk modeling assumptions. We cannot predict the impact that changing climate conditions, if any, may have on our results of operations or our financial condition. Additionally, we cannot predict how legal, regulatory and/or social responses to concerns around global climate change and the resulting impact on various sectors of the economy may impact our business. Exposure to cyber risk is increasing systematically due to greater digital dependence and increases possible losses due to a catastrophic cyber event. Cyber catastrophic scenarios are not bound by time or geographic limitations and cyber catastrophic perils don’t have well-established definitions and fundamental physical properties. Rather, cyber risks are engineered by human actors and thus are continuously evolving, often in ways that are engineered specifically to evade established loss mitigation controls. The occurrence of claims from catastrophic events could result in substantial volatility in our results of operations or financial condition for any fiscal quarter or year. Although we attempt to manage our exposure to such events through the use of underwriting controls, risk models, and the purchase of third-party reinsurance, catastrophic events are inherently unpredictable and the actual nature of such events, when they occur, could be more frequent or severe than contemplated in our pricing and risk management expectations. As a result, the occurrence of one or more catastrophic events could have an adverse effect on our results of operations and financial condition.
COVID-19, the effects of global actions taken to contain its spread, and its economic and societal impact could adversely impact our businesses, invested assets, financial condition, and results of operations.
COVID-19 and related variants (the “pandemic”) is causing significant disruption to public health, the global economy, financial markets, and commercial, social and community activity generally. The pandemic has had a significant effect on our company’s business operations and, depending on the course of the pandemic and government responses, may continue to affect our current and future financial results. We may experience higher levels of loss and, claims activity in certain lines of business in excess of losses we have already recognized, and our premiums could also be adversely affected by any repeated or further suppression of global commercial activity that results in a reduction in insurable assets and other exposure. Financial conditions resulting from the pandemic may also have a negative effect on the value and quality of our portfolio of invested assets, thereby adversely affecting our investment returns and increasing our credit and related risk. Certain lines of our business, such as our variable annuity life reinsurance business, may require additional forms of collateral in the event of a decline in the securities and benchmarks to which those repayment mechanisms are linked.
To protect our employees and in response to the global and regional restrictions on interpersonal contact and travel because of the pandemic, much of our work force may be working remotely, either for extended periods or intermittently, in response to changing health and regulatory conditions, placing increased demands on our IT systems. While we have continued to conduct our business effectively throughout the pandemic, there is no assurance that our ability to continue to function in this environment will not be adversely affected by an extended disruption in the telecommunications and internet infrastructures that support our remote work capability.
If actual claims exceed our loss reserves, our financial results could be adversely affected.
Our results of operations and financial condition depend upon our ability to accurately assess the potential losses associated with the risks that we insure and reinsure. We establish reserves for unpaid losses and loss expenses, which are estimates of future payments of reported and unreported claims for losses and related expenses, with respect to insured events that have occurred at or prior to the balance sheet date. The process of establishing reserves can be highly complex and is subject to considerable variability as it requires the use of informed estimates and judgments.
Actuarial staff in each of our segments regularly evaluates the levels of loss reserves. Any such evaluation could result in future changes in estimates of losses or reinsurance recoverables and would be reflected in our results of operations in the period in which the estimates are changed. Losses and loss expenses are charged to income as incurred. During the loss settlement period, which can be many years in duration for some of our lines of business, additional facts regarding individual claims and trends often will become known which may result in a change in overall reserves. In addition, application of statistical and actuarial methods may require the adjustment of overall reserves upward or downward from time to time.
Included in our loss reserves are liabilities for latent claims such as asbestos and environmental (A&E), which are principally related to claims arising from remediation costs associated with hazardous waste sites and bodily-injury claims related to exposure to asbestos products and environmental hazards. At December 31, 2021, gross A&E liabilities represented approximately 2.2 percent of our gross loss reserves. The estimation of these liabilities is subject to many complex variables including: the current legal environment; specific settlements that may be used as precedents to settle future claims; assumptions regarding trends with respect to claim severity and the frequency of higher severity claims; assumptions regarding the ability to allocate liability among defendants (including bankruptcy trusts) and other insurers; the ability of a claimant to bring a claim in a state in which it has no residency or exposure; the ability of a policyholder to claim the right to non-products coverage; whether high-level excess policies have the potential to be accessed given the policyholder's claim trends and liability situation; payments to unimpaired claimants; and the potential liability of peripheral defendants. Accordingly, the u
Showing the first 8K of 72K characters. Open the full section
Item 1B. Unresolved Staff Comments
There are currently no unresolved SEC staff comments regarding our periodic or current reports.
Item 2. Properties
We maintain office facilities around the world including in North America, Europe (including our principal executive offices in Switzerland), Bermuda, Latin America, Asia Pacific, and Japan. Most of our office facilities are leased, although we own major facilities in Hamilton, Bermuda, and in the U.S., including in Philadelphia, Pennsylvania; Wilmington, Delaware; Whitehouse Station, New Jersey; and Simsbury, Connecticut. Management considers its office facilities suitable and adequate for the current level of operations.
Item 3. Legal Proceedings
The information required with respect to Item 3 is included in Note 10 h) to the Consolidated Financial Statements, under Item 8, which is hereby incorporated herein by reference.
Item 4. Mine Safety Disclosures
Item 5. Market for Registrant's Common Equity, Related Stockholder Matters and Issuer Purchases of Equity Securities
Our Common Shares have been listed on the New York Stock Exchange since March 25, 1993, with a current par value of CHF 24.15 per share. The trading symbol for our Common Shares is "CB".
We have paid dividends each quarter since we became a public company in 1993. In 2021 and 2020, our annual dividends were paid by way of a distribution from capital contribution reserves (Additional paid-in capital) through the transfer of dividends from Additional paid-in capital to Retained earnings (free reserves) as approved by our shareholders.
Chubb Limited is a holding company whose principal sources of income are dividends and investment income from its operating subsidiaries. The ability of the operating subsidiaries to pay dividends to us and our ability to pay dividends to our shareholders are each subject to legal and regulatory restrictions. The recommendation and payment of future dividends will be based on the determination of the Board of Directors (Board) and will be dependent upon shareholder approval, profits and financial requirements of Chubb and other factors, including legal restrictions on the payment of dividends and other such factors as the Board deems relevant. Refer to Part I, Item 1A and Part II, Item 7 for additional information.
The number of record holders of Common Shares as of February 10, 2022 was 6,229. This is not the actual number of beneficial owners of Chubb's Common Shares since most of our shareholders hold their shares through a stockbroker, bank or other nominee rather than directly in their own names.
Refer to Part III, Item 12 for information relating to compensation plans under which equity securities are authorized for issuance.
Issuer's Repurchases of Equity Securities for the Three Months Ended December 31, 2021
| Period | Total Number of Shares Purchased (1) | Average Price Paid per Share | Total Number of Shares Purchased as Part of Publicly Announced Plan (2) | Approximate Dollar Value of Shares that May Yet be Purchased Under Publicly Announced Plan (3) | |||||||||||||||||||||||||
| October 1 through October 31 | 369,919 | $ | 186.30 | 367,700 | $ | 3.48 | billion | ||||||||||||||||||||||
| November 1 through November 30 | 2,669,873 | $ | 191.34 | 2,667,900 | $ | 2.97 | billion | ||||||||||||||||||||||
| December 1 through December 31 | 1,733,371 | $ | 188.45 | 1,731,500 | $ | 2.65 | billion | ||||||||||||||||||||||
| Total | 4,773,163 | $ | 189.90 | 4,767,100 |
(1)This column represents open market share repurchases and the surrender to Chubb of Common Shares to satisfy tax withholding obligations in connection with the vesting of restricted stock issued to employees and to cover the cost of the exercise of options by employees through stock swaps.
(2)The aggregate value of shares purchased in the three months ended December 31, 2021 as part of the publicly announced plan was $905 million. The July 2021 $5.0 billion share repurchase program is the only board authorization currently in effect. Refer to Note 11 to the Consolidated Financial Statements for more information on the Chubb Limited securities repurchase authorizations.
(3)For the period January 1, 2022 through February 23, 2022, we repurchased 1,966,600 Common Shares for a total of $405 million in a series of open market transactions. As of February 23, 2022, $2.24 billion in share repurchase authorization remained through June 30, 2022.
Performance Graph
Set forth below is a line graph comparing the dollar change in the cumulative total shareholder return on Chubb's Common Shares from December 31, 2016, through December 31, 2021, as compared to the cumulative total return of the Standard & Poor's 500 Stock Index and the cumulative total return of the Standard & Poor's Property-Casualty Insurance Index. The cumulative total shareholder return is a concept used to compare the performance of a company's stock over time and is the ratio of the stock price change plus the cumulative amount of dividends over the specified time period (assuming dividend reinvestment), to the stock price at the beginning of the time period. The chart depicts the value on December 31, 2017, 2018, 2019, 2020, and 2021, of a $100 investment made on December 31, 2016, with all dividends reinvested.
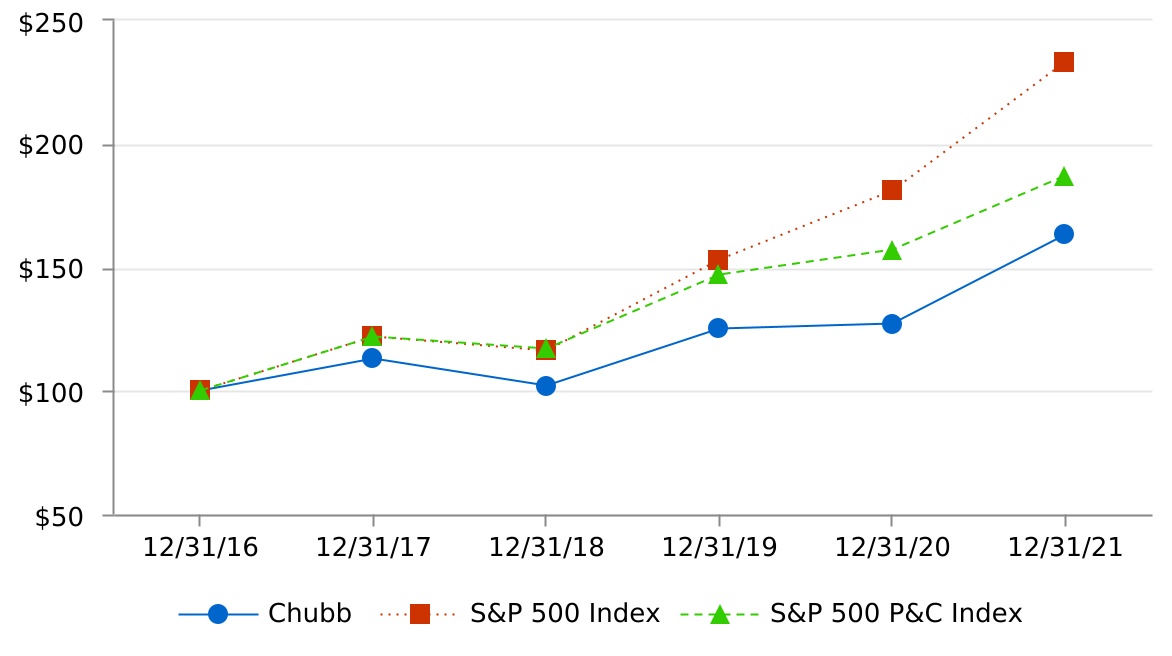
| 12/31/2016 | 12/31/2017 | 12/31/2018 | 12/31/2019 | 12/31/2020 | 12/31/2021 | |||||||||||||||
| Chubb Limited | $100 | $113 | $102 | $125 | $127 | $163 | ||||||||||||||
| S&P 500 Index | $100 | $122 | $116 | $153 | $181 | $233 | ||||||||||||||
| S&P 500 P&C Index | $100 | $122 | $117 | $147 | $157 | $187 |
Item 6. [Reserved]
Item 7. Management's Discussion and Analysis of Financial Condition and Results of Operations
The following is a discussion of our financial condition and results of operations for the years ended December 31, 2021 and 2020 and comparisons between 2021 and 2020. This discussion should be read in conjunction with the Consolidated Financial Statements and related Notes, under Item 8 of this Form 10-K. Comparisons between 2020 and 2019 have been omitted from this Form 10-K, but can be found in "Management's Discussion and Analysis of Financial Condition and Results of Operations" in Part II, Item 7 of our Form 10-K for the year ended December 31, 2020.
All comparisons in this discussion are to the corresponding prior year unless otherwise indicated. All dollar amounts are rounded. However, percent changes and ratios are calculated using whole dollars. Accordingly, calculations using rounded dollars may differ.
Forward-Looking Statements
The Private Securities Litigation Reform Act of 1995 provides a “safe harbor” for forward-looking statements. Any written or oral statements made by us or on our behalf may include forward-looking statements that reflect our current views with respect to future events and financial performance. The words “believe,” “anticipate,” “estimate,” “project,” “should,” “plan,” “expect,” “intend,” “hope,” “feel,” “foresee,” “will likely result,” “will continue,” and variations thereof and similar expressions, identify forward-looking statements. These forward-looking statements are subject to certain risks, uncertainties, and other factors that could, should potential events occur, cause actual results to differ materially from such statements. These risks, uncertainties, and other factors, which are described in more detail under Part I, Item 1A, under Risk Factors, and elsewhere herein and in other documents we file with the U.S. Securities and Exchange Commission (SEC), include but are not limited to:
-
actual amount of new and renewal business, premium rates, underwriting margins, market acceptance of our products, and risks associated with the introduction of new products and services and entering new markets; the competitive environment in which we operate, including trends in pricing or in policy terms and conditions, which may differ from our projections and changes in market conditions that could render our business strategies ineffective or obsolete;
-
losses arising out of natural or man-made catastrophes; actual loss experience from insured or reinsured events and the timing of claim payments; the uncertainties of the loss-reserving and claims-settlement processes, including the difficulties associated with assessing environmental damage and asbestos-related latent injuries, the impact of aggregate-policy-coverage limits, the impact of bankruptcy protection sought by various asbestos producers and other related businesses, and the timing of loss payments;
-
infection rates and severity of COVID-19 and related risks, and their effects on our business operations and claims activity, and any adverse impact to our insureds, brokers, agents, and employees; actual claims may exceed our best estimate of ultimate insurance losses incurred which could change including as a result of, among other things, the impact of legislative or regulatory actions taken in response to COVID-19;
-
changes in the distribution or placement of risks due to increased consolidation of insurance and reinsurance brokers; material differences between actual and expected assessments for guaranty funds and mandatory pooling arrangements; the ability to collect reinsurance recoverable, credit developments of reinsurers, and any delays with respect thereto and changes in the cost, quality, or availability of reinsurance;
-
uncertainties relating to governmental, legislative and regulatory policies, developments, actions, investigations, and treaties; judicial decisions and rulings, new theories of liability, legal tactics, and settlement terms; the effects of data privacy or cyber laws or regulation; global political conditions and possible business disruption or economic contraction that may result from such events;
-
developments in global financial markets, including changes in interest rates, stock markets, and other financial markets; increased government involvement or intervention in the financial services industry; the cost and availability of financing, and foreign currency exchange rate fluctuations; changing rates of inflation; and other general economic and business conditions, including the depth and duration of potential recession;
-
the availability of borrowings and letters of credit under our credit facilities; the adequacy of collateral supporting funded high deductible programs; the amount of dividends received from subsidiaries;
-
changes to our assessment as to whether i
Showing the first 8K of 272K characters. Open the full section
Item 7A. Quantitative and Qualitative Disclosures about Market Risk
Market Sensitive Instruments and Risk Management
Market risk represents the potential for loss due to adverse changes in the fair value of financial instruments. We are exposed to potential losses from various market risks including changes in interest rates, equity prices, and foreign currency exchange rates. Further, through writing the GLB and GMDB products, we are exposed to volatility in the equity and credit markets, as well as interest rates. Our investment portfolio consists primarily of fixed income securities, denominated in both U.S. dollars and foreign currencies, which are sensitive to changes in interest rates and foreign currency exchange rates. The majority of our fixed income portfolio is classified as available for sale. The effect of market movements on our fixed maturities portfolio impacts Net income (through Net realized gains (losses)) when securities are sold, when we write down an asset, or when we record a change to the allowance for expected credit losses. Changes in interest rates and foreign currency exchange rates will have an immediate effect on Shareholders' equity and Comprehensive income and in certain instances, Net income. From time to time, we also use derivative instruments such as futures, options, swaps, and foreign currency forward contracts to manage the duration of our investment portfolio and foreign currency exposures and also to obtain exposure to a particular financial market. At December 31, 2021 and 2020, our notional exposure to derivative instruments was $20.0 billion and $5.3 billion, respectively. These instruments are recognized as assets or liabilities in our Consolidated Financial Statements and are sensitive to changes in interest rates, foreign currency exchange rates, and equity security prices. As part of our investing activities, from time to time we purchase to be announced mortgage backed securities (TBAs). Changes in the fair value of TBAs are included in Net realized gains (losses) and therefore, have an immediate effect on both our Net income and Shareholders' equity.
We seek to mitigate market risk using a number of techniques, including maintaining and managing the assets and liabilities of our international operations consistent with the foreign currencies of the underlying insurance and reinsurance businesses, thereby limiting exchange rate risk to net assets denominated in foreign currencies.
The following is a discussion of our primary market risk exposures at December 31, 2021. Our policies to address these risks in 2021 were not materially different from 2020. We do not currently anticipate significant changes in our primary market risk exposures or in how those exposures are managed in future reporting periods based upon what is known or expected to be in effect in future reporting periods.
Interest rate risk – fixed income portfolio and debt obligations
Our fixed income portfolio and debt obligations have exposure to interest rate risk. Changes in investment values attributable to interest rate changes are mitigated by corresponding and partially offsetting changes in the economic value of our insurance reserves and debt obligations. We monitor this exposure through periodic reviews of our asset and liability positions.
The following table presents the impact at December 31, 2021 and 2020, on the fair value of our fixed income portfolio of a hypothetical increase in interest rates of 100 bps applied instantly across the U.S. yield curve (an immediate time horizon was used as this presents the worst case scenario):
| (in billions of U.S. dollars, except for percentages) | 2021 | 2020 | ||||||||||||
| Fair value of fixed income portfolio | $ | 106.9 | $ | 107.6 | ||||||||||
| Pre-tax impact of 100 bps increase in interest rates: | ||||||||||||||
| Decrease in dollars | $ | 4.4 | $ | 4.3 | ||||||||||
| As a percentage of total fixed income portfolio at fair value | 4.1 | % | 4.0 | % |
Changes in interest rates will have an immediate effect on Comprehensive income and Shareholders' equity but will not ordinarily have an immediate effect on Net income. Variations in market interest rates could produce significant changes in the timing of prepayments due to available prepayment options. For these reasons, actual results could differ from those reflected in the tables.
Although our debt and trust preferred securities (collectively referred to as debt obligations) are reported at amortized cost and not adjusted for fair value changes, changes in interest rates could have a material impact on their fair value, albeit there would be no impact on our Consolidated Financial Statements.
The following table presents the impact at December 31, 2021 and 2020, on the fair value of our debt obligations of a hypothetical decrease in interest rates of 100 bps applied instantly across the U.S. yield curve (an immediate time horizon was used as this presents the worst case scenario):
| (in millions of U.S. dollars, except for percentages) | 2021 | 2020 | ||||||||||||
| Fair value of debt obligations, including repurchase agreements | $ | 19,733 | $ | 19,365 | ||||||||||
| Pre-tax impact of 100 bps decrease in interest rates: | ||||||||||||||
| Increase in dollars | $ | 1,799 | $ | 1,673 | ||||||||||
| As a percentage of total debt obligations at fair value | 9.1 | % | 8.6 | % |
Foreign currency management
As a global company, Chubb entities transact business in multiple currencies. Our policy is to generally match assets, liabilities and required capital for each individual jurisdiction in local currency, which would include the use of derivatives. We do not hedge our net asset non-U.S. dollar capital positions; however, we do consider hedging for planned cross border transactions.
The following table summarizes the net assets (liabilities) in non-U.S. currencies at December 31, 2021 and 2020:
| 2021 | 2020 | 2021 vs. 2020 % change in exchange rate per USD | ||||||||||||||||||||||||||||||
| (in millions of U.S. dollars, except for percentages) | Value of net assets (liabilities) | Exchange rate per USD | Value of net assets (liabilities) | Exchange rate per USD | ||||||||||||||||||||||||||||
| Chinese yuan renminbi (CNY) | $ | 3,519 | 0.1573 | $ | 2,853 | 0.1532 | 2.7 | % | ||||||||||||||||||||||||
| Canadian dollar (CAD) | 2,624 | 0.7914 | 2,613 | 0.7858 | 0.7 | % | ||||||||||||||||||||||||||
| British pound sterling (GBP) | 2,333 | 1.3532 | 2,492 | 1.3670 | (1.0) | % | ||||||||||||||||||||||||||
| Australian dollar (AUD) | 1,347 | 0.7263 | 1,347 | 0.7694 | (5.6) | % | ||||||||||||||||||||||||||
| Korean won (KRW) (x100) | 805 | 0.0840 | 781 | 0.0920 | (8.7) | % | ||||||||||||||||||||||||||
| Mexican peso (MXN) | 728 | 0.0487 | 877 | 0.0502 | (3.0) | % | ||||||||||||||||||||||||||
| Japanese yen (JPY) | 631 | 0.0087 | 617 | 0.0097 | (10.3) | % | ||||||||||||||||||||||||||
| Brazilian real (BRL) | 577 | 0.1795 | 747 | 0.1926 | (6.8) | % | ||||||||||||||||||||||||||
| Hong Kong Dollar (HKD) | 537 | 0.1283 | 486 | 0.1290 | (0.6) | % | ||||||||||||||||||||||||||
| Euro (EUR) (1) | (3,013) | 1.1370 | (3,162) | 1.2216 | (6.9) | % | ||||||||||||||||||||||||||
| Other foreign currencies | 2,444 | various | 3,095 | various | NM | |||||||||||||||||||||||||||
| Value of net assets denominated in foreign currencies (2) | $ | 12,532 | $ | 12,746 | ||||||||||||||||||||||||||||
| As a percentage of total net assets | 21.0 | % | 21.4 | % | ||||||||||||||||||||||||||||
| Pre-tax decrease to Shareholders' equity of a hypothetical 10 percent strengthening of the USD | $ | 1,139 | $ | 1,159 |
NM – not meaningful
(1) Comprised Euro denominated debt of $4.9 billion, partially offset by net assets of $1.9 billion at December 31, 2021 and Euro denominated debt of $5.2 billion, partially offset by net assets of $2.1 billion at December 31, 2020.
(2) Net assets denominated in foreign currencies comprised goodwill and other intangible assets of approximately 45 percent and 46 percent at December 31, 2021 and 2020, respectively.
Reinsurance of GMDB and GLB guarantees
Chubb views its variable annuity reinsurance business as having a similar risk profile to that of catastrophe reinsurance with the probability of long-term economic loss relatively small, at the time of pricing. Adverse changes in market factors and policyholder behavior will have an impact on both realized gains (losses) and net income for GLB and both Life Insurance underwriting income and net income for GMDB. When evaluating these risks, we expect to be compensated for taking both the risk of a cumulative long-term economic net loss, as well as the short-term accounting variations caused by these market movements. Therefore, we evaluate this business in terms of its long-term economic risk and reward.
For the GMDB reinsurance business, net income is directly impacted by changes in future policy benefit reserves. For the GLB reinsurance business, net income is directly impacted by changes in the fair value of the GLB liability (FVL), which is classified as a derivative for accounting purposes. The FVL calculation is directly affected by market factors, including equity levels, interest rate levels, credit risk, and implied volatilities, as well as policyholder behaviors, such as annuitization and lapse rates, and policyholder mortality.
The tables below are estimates of the sensitivities to instantaneous changes in economic inputs (e.g., equity shock, interest rate shock, etc.) or actuarial assumptions at December 31, 2021 of the FVL and of the fair value of specific derivative instruments held (hedge value) to partially offset the risk in the variable annuity guarantee reinsurance portfolio. The following assumptions should be considered when using the below tables:
-
Equity shocks impact all global equity markets equally
-
Our liabilities are sensitive to global equity markets in the following proportions: 80 percent—90 percent U.S. equity, and 10 percent—20 percent international equity.
-
Our current hedge portfolio is sensitive only to U.S. equity markets.
-
We would suggest using the S&P 500 index as a proxy for U.S. equity, and the MSCI EAFE index as a proxy for international equity.
-
Interest rate shocks assume a parallel shift in the U.S. yield curve
-
Our liabilities are also sensitive to global interest rates at various points on the yield curve, mainly the U.S. Treasury curve in the following proportions: 5 percent—15 percent short-term rates (maturing in less than 5 years), 15 percent—25 percent medium-term rates (maturing between 5 years and 10 years, inclusive), and 65 percent—75 percent long-term rates (maturing beyond 10 years).
-
A change in AA-rated credit spreads impacts the rate used to discount cash flows in the fair value model. AA-rated credit spreads are a proxy for both our own credit spreads and the credit spreads of the ceding insurers.
-
The hedge sensitivity is from December 31, 2021 market levels and only applicable to the equity and interest rate sensitivities table below.
-
The sensitivities are not directly additive because changes in one factor will affect the sensitivity to changes in other factors. The sensitivities do not scale linearly and may be proportionally greater for larger movements in the market factors. The sensitivities may also vary due to foreign exchange rate fluctuations. The calculation of the FVL is based on internal models that include assumptions regarding future policyholder behavior, including lapse, annuitization, and asset allocation. These assumptions impact both the absolute level of the FVL as well as the sensitivities to changes in market factors shown below. Actual sensitivity of our net income may differ from those disclosed in the tables below due to fluctuations in short-term market movements.
-
In addition, the tables below do not reflect the expected quarterly run rate of net income generated by the variable annuity guarantee reinsurance portfolio if markets remain unchanged during the period. All else equal, if markets remain unchanged during the period, the FVL will increase, resulting in a realized loss. This realized loss occurs primarily because the guarantees provided in the underlying contracts continue to become more valuable even when markets remain unchanged. We refer to this increase in FVL as the “timing effect”. The unfavorable impact of the timing effect on our FVL in a quarter is not reflected in the sensitivity tables below. For this reason, when using the tables below to estimate the sensitivity of FVL in the first quarter 2022 to various changes, it is necessary to assume an additional $5 million to $45 million increase in FVL and realized losses. Note that both the timing effect and the quarterly run rate impact to net income change over time as the book ages.
| Sensitivities to equity and interest rate movements | ||||||||||||||||||||||||||||||||||||||
| (in millions of U.S. dollars) | Worldwide Equity Shock | |||||||||||||||||||||||||||||||||||||
| Interest Rate Shock | +10 | % | Flat | -10 | % | -20 | % | -30 | % | -40 | % | |||||||||||||||||||||||||||
| +100 bps | (Increase)/decrease in FVL | $ | 325 | $ | 219 | $ | 91 | $ | (77) | $ | (288) | $ | (552) | |||||||||||||||||||||||||
| Increase/(decrease) in hedge value | (92) | — | 92 | 184 | 276 | 368 | ||||||||||||||||||||||||||||||||
| Increase/(decrease) in net income | $ | 233 | $ | 219 | $ | 183 | $ | 107 | $ | (12) | $ | (184) | ||||||||||||||||||||||||||
| Flat | (Increase)/decrease in FVL | $ | 130 | $ | — | $ | (167) | $ | (369) | $ | (616) | $ | (918) | |||||||||||||||||||||||||
| Increase/(decrease) in hedge value | (92) | — | 92 | 184 | 276 | 368 | ||||||||||||||||||||||||||||||||
| Increase/(decrease) in net income | $ | 38 | $ | — | $ | (75) | $ | (185) | $ | (340) | $ | (550) | ||||||||||||||||||||||||||
| -100 bps | (Increase)/decrease in FVL | $ | (123) | $ | (288) | $ | (484) | $ | (719) | $ | (1,000) | $ | (1,333) | |||||||||||||||||||||||||
| Increase/(decrease) in hedge value | (92) | — | 92 | 184 | 276 | 368 | ||||||||||||||||||||||||||||||||
| Increase/(decrease) in net income | $ | (215) | $ | (288) | $ | (392) | $ | (535) | $ | (724) | $ | (965) | ||||||||||||||||||||||||||
| Sensitivities to Other Economic Variables | AA-rated Credit Spreads | Interest Rate Volatility | Equity Volatility | |||||||||||||||||||||||||||||||||||
| (in millions of U.S. dollars) | +100 bps | -100 bps | +2 | % | -2 | % | +2 | % | -2 | % | ||||||||||||||||||||||||||||
| (Increase)/decrease in FVL | $ | 66 | $ | (77) | $ | (1) | $ | 1 | $ | (22) | $ | 19 | ||||||||||||||||||||||||||
| Increase/(decrease) in net income | $ | 66 | $ | (77) | $ | (1) | $ | 1 | $ | (22) | $ | 19 | ||||||||||||||||||||||||||
Variable Annuity Net Amount at Risk
All our VA reinsurance treaties include annual or aggregate claim limits and many include an aggregate deductible which limit the net amount at risk under these programs. The tables below present the net amount at risk at December 31, 2021 following an immediate change in equity market levels, assuming all global equity markets are impacted equally.
a) Reinsurance covering the GMDB risk only
| Equity Shock | |||||||||||||||||||||||||||||||||||
| (in millions of U.S. dollars) | +20 | % | Flat | -20 | % | -40 | % | -60 | % | -80 | % | ||||||||||||||||||||||||
| GMDB net amount at risk | $ | 297 | $ | 283 | $ | 471 | $ | 848 | $ | 897 | $ | 744 | |||||||||||||||||||||||
| Claims at 100% immediate mortality | 151 | 156 | 174 | 164 | 148 | 128 |
The treaty claim limits function as a ceiling as equity markets fall. As the shocks in the table above become incrementally more negative, the impact on the NAR and claims at 100 percent mortality begin to drop due to the specific nature of these claim limits, many of which are annual claim limits calculated as a percentage of the reinsured account value. There is also some impact due to a small portion of the GMDB reinsurance under which claims are positively correlated to equity markets (claims decrease as equity markets fall).
b) Reinsurance covering the GLB risk only
| Equity Shock | |||||||||||||||||||||||||||||||||||
| (in millions of U.S. dollars) | +20 | % | Flat | -20 | % | -40 | % | -60 | % | -80 | % | ||||||||||||||||||||||||
| GLB net amount at risk | $ | 757 | $ | 1,054 | $ | 1,586 | $ | 2,384 | $ | 2,941 | $ | 3,333 |
The treaty claim limits cause the net amount at risk to increase at a declining rate as equity markets fall.
c) Reinsurance covering both the GMDB and GLB risks on the same underlying policyholders
| Equity Shock | |||||||||||||||||||||||||||||||||||
| (in millions of U.S. dollars) | +20 | % | Flat | -20 | % | -40 | % | -60 | % | -80 | % | ||||||||||||||||||||||||
| GMDB net amount at risk | $ | 37 | $ | 45 | $ | 58 | $ | 74 | $ | 88 | $ | 100 | |||||||||||||||||||||||
| GLB net amount at risk | 289 | 378 | 505 | 679 | 860 | 989 | |||||||||||||||||||||||||||||
| Claims at 100% immediate mortality | 36 | 35 | 35 | 35 | 35 | 35 |
The treaty limits control the increase in the GMDB net amount at risk as equity markets fall. The GMDB net amount at risk continues to increase as equity markets fall because most of these reinsurance treaties do not have annual claim limits calculated as a percentage of the underlying account value. The treaty limits cause the GLB net amount at risk to increase at a declining rate as equity markets fall.
Item 8. Financial Statements and Supplementary Data
The financial statements and supplementary data are included in this Form 10-K commencing on page F-1.
Item 9. Changes in and Disagreements with Accountants on Accounting and Financial Disclosure
None.
Item 9A. Controls and Procedures
Chubb’s management, with the participation of Chubb’s Chief Executive Officer and Chief Financial Officer, evaluated the effectiveness of Chubb’s disclosure controls and procedures as defined in Rule 13a-15(e) and Rule 15d-15(e) under the Securities Exchange Act of 1934 as of December 31, 2021. Based upon that evaluation, Chubb’s Chief Executive Officer and Chief Financial Officer concluded that Chubb’s disclosure controls and procedures are effective in allowing information required to be disclosed in reports filed under the Securities Exchange Act of 1934 to be recorded, processed, summarized, and reported within time periods specified in the rules and forms of the SEC, and that such information is accumulated and communicated to Chubb’s management, including its Chief Executive Officer and Chief Financial Officer, as appropriate to allow timely decisions regarding required disclosure.
There have been no changes in Chubb's internal controls over financial reporting during the three months ended December 31, 2021 that have materially affected, or are reasonably likely to materially affect, Chubb's internal controls over financial reporting. Chubb's management report on internal control over financial reporting is included on page F-3 and PricewaterhouseCoopers LLP's audit report is included on pages F-4, F-5, and F-6.
Item 9B. Other Information
Item not applicable.
Item 9C. Disclosure Regarding Foreign Jurisdictions that Prevent Inspections
Item 10. Directors, Executive Officers and Corporate Governance
Information pertaining to this item is incorporated by reference to the sections entitled “Agenda Item 5 - Election of the Board of Directors”, "Corporate Governance - Delinquent Section 16(a) Reports", “Corporate Governance - The Board of Directors - Director Nomination Process”, and “Corporate Governance - The Committees of the Board - Audit Committee” of the definitive proxy statement for the 2022 Annual General Meeting of Shareholders which will be filed with the SEC not later than 120 days after the close of the fiscal year pursuant to Regulation 14A. Also incorporated herein by reference is the text under the caption “Information about our Executive Officers” appearing at the end of Part I Item 1 of the Annual Report on Form 10-K.
Code of Ethics
Chubb has adopted a Code of Conduct, which sets forth standards by which all Chubb employees, officers, and directors must abide as they work for Chubb. Chubb has posted this Code of Conduct on its Internet site (about.chubb.com/governance.html). Chubb intends to disclose on its Internet site any amendments to, or waivers from, its Code of Conduct that are required to be publicly disclosed pursuant to the rules of the SEC or the New York Stock Exchange.
Item 11. Executive Compensation
This item is incorporated by reference to the sections entitled “Executive Compensation”, “Compensation Committee Report” and “Director Compensation” of the definitive proxy statement for the 2022 Annual General Meeting of Shareholders which will be filed with the SEC not later than 120 days after the close of the fiscal year pursuant to Regulation 14A.
Item 12. Security Ownership of Certain Beneficial Owners and Management and Related Stockholder Matters
| Plan category | Number of securities to be issued upon exercise of outstanding options, warrants, and rights | Weighted-average exercise price of outstanding options, warrants, and rights (3) | Number of securities remaining available for future issuance under equity compensation plans | |||||||||||||||||
| Equity compensation plans approved by security holders (1) | 10,762,100 | $ | 133.95 | 19,127,542 | ||||||||||||||||
| Equity compensation plans not approved by security holders (2) | 22,945 |
(1) These totals include securities available for future issuance under the following plans:
(i) Chubb Limited 2016 Long-Term Incentive Plan, as amended and restated (Amended 2016 LTIP). A total of 32,900,000 shares are authorized to be issued pursuant to awards made as options, stock appreciation rights, stock units, performance shares, performance units, restricted stock, and restricted stock units. The maximum number of shares that may be delivered to participants and their beneficiaries under the Amended 2016 LTIP shall be equal to the sum of: (x) 32,900,000 shares of stock; and (y) any shares of stock that have not been delivered pursuant to the ACE LTIP (as defined in clause (ii) of this footnote (1) below) and remain available for grant pursuant to the ACE LTIP, including shares of stock represented by awards granted under the ACE LTIP that are forfeited, expire or are canceled after the effective date of the Amended 2016 LTIP without delivery of shares of stock or which result in the forfeiture of the shares of stock back to the Company to the extent that such shares would have been added back to the reserve under the terms of the ACE LTIP. As of December 31, 2021, a total of 7,197,001 option awards and 804,119 restricted stock unit awards are outstanding, and 18,040,720 shares remain available for future issuance under this plan.
(ii) ACE Limited 2004 Long-Term Incentive Plan (ACE LTIP). As of December 31, 2021, a total of 3,518,809 option awards are outstanding. No additional grants will be made pursuant to the ACE LTIP.
(iii) The Chubb Corporation Long-Term Incentive Plan (2014) (Chubb Corp. LTIP). As of December 31, 2021, a total of 46,290 option awards and 30,196 deferred stock unit awards are outstanding. No additional grants will be made pursuant to the Chubb Corp. LTIP.
(iv) ESPP. A total of 6,500,000 shares have been authorized for purchase at a discount. As of December 31, 2021, 1,086,822 shares remain available for future issuance under this plan.
(2) These plans are the Chubb Corp. CCAP Excess Benefit Plan (CCAP Excess Benefit Plan) and the Chubb Corp. Deferred Compensation Plan for Directors, under which no Common Shares are available for future issuance other than with respect to outstanding rewards. The CCAP Excess Benefit Plan is a nonqualified, defined contribution plan and covers those participants in the Capital Accumulation Plan of The Chubb Corporation (CCAP) (Chubb Corp.’s legacy 401(k) plan) and Chubb Corp.’s
legacy employee stock ownership plan (ESOP) whose total benefits under those plans are limited by certain provisions of the Internal Revenue Code. A participant in the CCAP Excess Benefit Plan is entitled to a benefit equaling the difference between the participant’s benefits under the CCAP and the ESOP, without considering the applicable limitations of the Code, and the participant’s actual benefits under such plans. A participant’s excess ESOP benefit is expressed as Common Shares. Payments under the CCAP Excess Benefit Plan are generally made: (i) for excess benefits related to the CCAP, in cash annually as soon as practical after the amount of excess benefit can be determined; and (ii) for excess benefits related to the ESOP, in Common Shares as soon as practicable after the participant’s termination of employment. Allocations under the ESOP ceased in 2004. Accordingly, other than dividends, no new contributions are made to the ESOP or the CCAP Excess Benefit Plan with respect to excess ESOP benefits.
(3) Weighted average exercise price excludes shares issuable under performance unit awards and restricted stock unit awards.
Additional information is incorporated by reference to the section entitled "Information About Our Share Ownership" of the definitive proxy statement for the 2022 Annual General Meeting of Shareholders which will be filed with the SEC not later than 120 days after the close of the fiscal year pursuant to Regulation 14A.
Item 13. Certain Relationships and Related Transactions and Director Independence
This item is incorporated by reference to the sections entitled “Corporate Governance - What Is Our Related Party Transactions Approval Policy And What Procedures Do We Use To Implement It?”, “Corporate Governance - What Related Party Transactions Do We Have?”, and “Corporate Governance - The Board of Directors - Director Independence” of the definitive proxy statement for the 2022 Annual General Meeting of Shareholders which will be filed with the SEC not later than 120 days after the close of the fiscal year pursuant to Regulation 14A.
Item 14. Principal Accounting Fees and Services
This item is incorporated by reference to the section entitled “Agenda Item 4 – Election of Auditors – 4.2 – Ratification of appointment of PricewaterhouseCoopers LLP (United States) as independent registered public accounting firm for purposes of U.S. securities law reporting” of the definitive proxy statement for the 2022 Annual General Meeting of Shareholders which will be filed with the SEC not later than 120 days after the close of the fiscal year pursuant to Regulation 14A.
PART IV
Item 15. Exhibits, Financial Statement Schedules
**(a)**Financial Statements, Schedules, and Exhibits
| Other schedules have been omitted as they are not applicable to Chubb, or the required information has been included in the Consolidated Financial Statements and related notes. | ||||||||||||||
| 3. | Exhibits |
| Incorporated by Reference | ||||||||||||||||||||||||||||||||
| Exhibit Number | Exhibit Description | Form | Original Number | Date Filed | Filed Herewith | |||||||||||||||||||||||||||
| 3.1 | Articles of Association of the Company, as amended and restated | 8-K | 3.1 | January 20, 2022 | ||||||||||||||||||||||||||||
| 3.2 | Organizational Regulations of the Company as amended | 8-K | 3.1 | November 21, 2016 | ||||||||||||||||||||||||||||
| 4.1 | Articles of Association of the Company, as amended and restated | 8-K | 4.1 | January 20, 2022 | ||||||||||||||||||||||||||||
| 4.2 | Organizational Regulations of the Company as amended | 8-K | 3.1 | November 21, 2016 | ||||||||||||||||||||||||||||
| 4.3 | Specimen share certificate representing Common Shares | 8-K | 4.3 | July 18, 2008 | ||||||||||||||||||||||||||||
| 4.4 | Indenture, dated March 15, 2002, between ACE Limited and Bank One Trust Company, N.A. | 8-K | 4.1 | March 22, 2002 | ||||||||||||||||||||||||||||
Showing the first 8K of 75K characters. Open the full section
Item 16. Form 10-K Summary
None.
SIGNATURES
Pursuant to the requirements of Section 13 or 15(d) of the Securities Exchange Act of 1934, the registrant has duly caused this report to be signed on its behalf by the undersigned, thereunto duly authorized.
CHUBB LIMITED
| By: | /s/ Peter C. Enns | ||||
| Peter C. Enns Executive Vice President and Chief Financial Officer |
February 24, 2022
Pursuant to the requirements of the Securities Exchange Act of 1934, this report has been signed below by the following persons on behalf of the registrant and in the capacities and on the dates indicated.
| Signature | Title | Date | |||||||||
| /s/ Evan G. Greenberg | Chairman, Chief Executive Officer, and Director | February 24, 2022 | |||||||||
| Evan G. Greenberg | |||||||||||
| /s/ Peter C. Enns | Executive Vice President and Chief Financial Officer | February 24, 2022 | |||||||||
| Peter C. Enns | (Principal Financial Officer) | ||||||||||
| /s/ Annmarie T. Hagan | Chief Accounting Officer | February 24, 2022 | |||||||||
| Annmarie T. Hagan | (Principal Accounting Officer) | ||||||||||
| /s/ Michael G. Atieh | Director | February 24, 2022 | |||||||||
| Michael G. Atieh | |||||||||||
| /s/ Sheila P. Burke | Director | February 24, 2022 | |||||||||
| Sheila P. Burke | |||||||||||
| /s/ Mary A. Cirillo | Director | February 24, 2022 | |||||||||
| Mary A. Cirillo | |||||||||||
| /s/ Michael P. Connors | Director | February 24, 2022 | |||||||||
| Michael P. Connors | |||||||||||
| /s/ Robert J. Hugin | Director | February 24, 2022 | |||||||||
| Robert J. Hugin |
| /s/ Robert W. Scully | Director | February 24, 2022 | |||||||||
| Robert W. Scully | |||||||||||
| /s/ Eugene B. Shanks, Jr. | Director | February 24, 2022 | |||||||||
| Eugene B. Shanks, Jr. | |||||||||||
| /s/ Theodore E. Shasta | Director | February 24, 2022 | |||||||||
| Theodore E. Shasta | |||||||||||
| /s/ David H. Sidwell | Director | February 24, 2022 | |||||||||
| David H. Sidwell | |||||||||||
| /s/ Olivier Steimer | Director | February 24, 2022 | |||||||||
| Olivier Steimer | |||||||||||
| /s/ Luis Téllez | Director | February 24, 2022 | |||||||||
| Luis Téllez | |||||||||||
| /s/ Frances F. Townsend | Director | February 24, 2022 | |||||||||
| Frances F. Townsend | |||||||||||
CHUBB LIMITED AND SUBSIDIARIES
CONSOLIDATED FINANCIAL STATEMENTS
December 31, 2021
F-1
Chubb Limited
INDEX TO CONSOLIDATED FINANCIAL STATEMENTS
Showing the first 8K of 547K characters. Open the full section