 filings.tools
CBRE Group 10-K 2022-12-31
Filed 2023-02-27. 23 sections, 559K characters. Original on sec.gov · Markdown · JSON
Cover and table of contents
UNITED STATES
SECURITIES AND EXCHANGE COMMISSION
Washington, D.C. 20549
FORM 10-K
| ☒ ANNUAL REPORT PURSUANT TO SECTION 13 OR 15(d) OF THE SECURITIES EXCHANGE ACT OF 1934 |
For the fiscal year ended December 31, 2022
OR
| ☐ TRANSITION REPORT PURSUANT TO SECTION 13 OR 15(d) OF THE SECURITIES EXCHANGE ACT OF 1934 |
For the transition period from _______________ to _______________
Commission file number 001-32205

CBRE GROUP, INC.
(Exact name of registrant as specified in its charter)
| Delaware | 94-3391143 | |||||||
| (State or other jurisdiction of incorporation or organization) | (I.R.S. Employer Identification No.) | |||||||
| 2100 McKinney Avenue, Suite 1250, Dallas, Texas | 75201 | |||||||
| (Address of principal executive offices) | (Zip Code) |
(214) 979-6100
(Registrant’s telephone number, including area code)
Securities registered pursuant to Section 12(b) of the Act:
| Title of each class | Trading Symbol(s) | Name of each exchange on which registered | ||||||
| Class A Common Stock, $0.01 par value per share | “CBRE” | New York Stock Exchange |
Securities registered pursuant to Section 12(g) of the Act:
None
Indicate by check mark if the registrant is a well-known seasoned issuer, as defined in Rule 405 of the Securities Act. Yes ☒ No ¨
Indicate by check mark if the registrant is not required to file reports pursuant to Section 13 or Section 15(d) of the Act. Yes ¨ No ☒
Indicate by check mark whether the registrant (1) has filed all reports required to be filed by Section 13 or 15(d) of the Securities Exchange Act of 1934 during the preceding 12 months (or for such shorter period that the registrant was required to file such reports), and (2) has been subject to such filing requirements for the past 90 days. Yes ☒ No ¨
Indicate by check mark whether the registrant has submitted electronically every Interactive Data File required to be submitted pursuant to Rule 405 of Regulation S-T (§232.405 of this chapter) during the preceding 12 months (or for such shorter period that the registrant was required to submit such files). Yes ☒ No ¨
Indicate by check mark whether the registrant is a large accelerated filer, an accelerated filer, a non-accelerated filer, a smaller reporting company, or an emerging growth company. See the definitions of “large accelerated filer,” “accelerated filer,” “smaller reporting company,” and “emerging growth company” in Rule 12b-2 of the Exchange Act.
Large accelerated filer x Accelerated filer ¨ Non-accelerated filer ¨ Smaller reporting company ☐ Emerging growth company ☐
If an emerging growth company, indicate by check mark if the registrant has elected not to use the extended transition period for complying with any new or revised financial accounting standards provided pursuant to Section 13(a) of the Exchange Act. ¨
Indicate by check mark whether the registrant has filed a report on and attestation to its management’s assessment of the effectiveness of its internal control over financial reporting under Section 404(b) of the Sarbanes-Oxley Act (15 U.S.C. 7262(b)) by the registered public accounting firms that prepared or issued its audit report. ☒
If securities are registered pursuant to Section 12(b) of the Act, indicate by check mark whether the financial statements of the registrant included in the filing reflect the correction of an error to previously issued financial statements. ¨
Indicate by check mark whether any of those error corrections are restatements that required a recovery analysis of incentive-based compensation received by any of the registrant’s executive officers during the relevant recovery period pursuant to §240.10D-1(b). ¨
Indicate by check mark whether the registrant is a shell company (as defined in Rule 12b-2 of the Exchange Act). Yes ☐ No ☒
As of June 30, 2022, the aggregate market value of Class A Common Stock held by non-affiliates of the registrant was $22.9 billion based upon the last sales price on June 30, 2022 on the New York Stock Exchange of $73.61 for the registrant’s Class A Common Stock.
As of February 16, 2023, the number of shares of Class A Common Stock outstanding was 309,891,986.
DOCUMENTS INCORPORATED BY REFERENCE
Portions of the proxy statement for the registrant’s 2023 Annual Meeting of Stockholders to be held May 17, 2023 are incorporated by reference in Part III of this Annual Report on Form 10-K.
CBRE GROUP, INC.
ANNUAL REPORT ON FORM 10-K
TABLE OF CONTENTS
PART I
Item 1. Business.
Company Overview
CBRE Group, Inc. is a Delaware corporation. References to “CBRE,” “the company,” “we,” “us” and “our” refer to CBRE Group, Inc. and include all of its consolidated subsidiaries, unless otherwise indicated or the context requires otherwise.
We are the world’s largest commercial real estate services and investment firm, based on 2022 revenue, with leading global market positions in our leasing, property sales, occupier outsourcing and valuation businesses. As of December 31, 2022, the company had approximately 115,000 employees (excluding Turner & Townsend Holdings Limited employees) serving clients in more than 100 countries.
We provide services to real estate investors and occupiers. For investors, our services include capital markets (property sales and mortgage origination), mortgage sales and servicing, property leasing, investment management, property management, valuation and development services, among others. For occupiers, our services include facilities management, project management, transaction (property sales and leasing) and consulting services, among others. We provide services under the following brand names: “CBRE” (real estate advisory and outsourcing services); “CBRE Investment Management” (investment management); “Trammell Crow Company” (primarily U.S. development); “Telford Homes” (U.K. development); and “Turner & Townsend Holdings Limited” (Turner & Townsend).
We generate revenue from stable, recurring sources (large multi-year portfolio and per project contracts) and from cyclical, non-recurring sources, including commissions on transactions. Our revenue mix has become heavily weighted towards stable revenue sources, particularly occupier outsourcing, and our dependence on highly cyclical property sales and lease transaction revenue has declined. We believe we are well-positioned to capture a substantial and growing share of market opportunities at a time when investors and occupiers increasingly prefer to purchase integrated, account-based services on a national and global basis.
In 2022, we generated revenue from a highly diversified base of clients, including more than 95 of the Fortune 100 companies. We have been an S&P 500 company since 2006 and in 2022 we were ranked #126 on the Fortune 500. We have been voted the most recognized commercial real estate brand in the Lipsey Company survey for 22 years in a row (including 2022). We have also been rated a World’s Most Ethical Company by the Ethisphere Institute for nine consecutive years (including 2022, the most recent year the award has been announced) and have been included in the Dow Jones World Sustainability Index for four years in a row and the Bloomberg Gender-Equality Index for four years in a row (including 2023).
CBRE History
We will mark our 117th year of continuous operations in 2023, tracing our origins to a company founded in San Francisco in the aftermath of the 1906 earthquake. Since then, we have grown into the largest global commercial real estate services and investment firm (in terms of 2022 revenue) through organic growth and strategic acquisitions, including our acquisition of a majority interest in Turner & Townsend in November 2021.
Our Business Segments and Primary Services
CBRE Group, Inc. is a holding company that conducts all of its operations through its indirect subsidiaries. CBRE Group, Inc. does not have any independent operations or employees. CBRE Services, Inc., our direct wholly owned subsidiary, is also a holding company and is the primary obligor or issuer with respect to most of our long-term indebtedness.
We report our operations through the following reportable segments: (1) Advisory Services, (2) Global Workplace Solutions, and (3) Real Estate Investments. In addition, we also have a Corporate and other segment.
Advisory Services
Advisory Services provides a comprehensive range of services globally, including property leasing, capital markets (property sales and mortgage origination), mortgage sales and servicing, property management and valuation. Most of our Advisory Services operations are conducted through our indirect wholly owned subsidiary CBRE, Inc. and its subsidiaries around the world. Our mortgage services, the vast majority of which are in the United States (U.S.), are conducted exclusively through our indirect wholly-owned subsidiary operating under the name CBRE Capital Markets, Inc. (CBRE Capital Markets) and its affiliates.
The primary services within Advisory Services are further described below.
Leasing Services
We provide strategic advice and execution for owners/investors, and occupiers/tenants of real estate, primarily in connection with the leasing of office, industrial and retail space. In 2022, we negotiated leases valued at more than $165.0 billion globally.
We generate significant business from account-based occupier clients, where we are retained to negotiate leases for all or a portion of their portfolio. This results in recurring revenue over time. We believe we are the market leader for leasing services to both occupiers and owners in most leading U.S. metropolitan statistical areas (as defined by the U.S. Census Bureau), including Atlanta, Austin, Boston, Denver, Kansas City, Los Angeles, Minneapolis, New York, Phoenix, San Francisco, Seattle and St. Louis.
Capital Markets and Mortgage Services
We provide property sales and mortgage services, which are closely integrated to meet marketplace demand for comprehensive capital markets solutions. During 2022, we closed approximately $290.2 billion of property sales transactions globally.
We are the leading property sales advisor globally. In the U.S., we accounted for approximately 15.6% of investment sales transactions greater than $2.5 million across all property types in 2022, according to Real Capital Analytics. Our mortgage brokerage professionals arrange, originate and service commercial mortgage loans through relationships established with investment banking firms, national and regional banks, credit companies, insurance companies, U.S. Government-Sponsored Enterprises (GSEs), and pension funds.
In the U.S., our loan origination and sales volume in 2022 was $62.7 billion, including approximately $13.6 billion for U.S. GSEs. Most of the GSE loans were financed through revolving warehouse credit lines through a CBRE subsidiary that is dedicated exclusively for this purpose and were substantially risk mitigated by either obtaining a contractual purchase commitment from the GSE or confirming a forward-trade commitment for the issuance and purchase of a mortgage-backed security to be secured by the loan. We also oversee a loan servicing portfolio, which totaled approximately $381.2 billion globally at year-end 2022.
In many countries that we operate in (including the U.S.), our real estate services professionals (both leasing and capital markets) are compensated primarily through commissions, which are payable upon completion of an assignment. This mitigates the effect of compensation, our largest expense, on our operating margins during difficult market conditions. We strive to retain top professionals through an attractive compensation program tied to productivity as well as investments in support resources, including professional development and training, market research and data/information, technology, branding and marketing.
Property Management Services
We provide property management services on a contractual basis, primarily for owners of and investors in office, industrial and retail properties. These services include marketing, building engineering, lease administration, accounting and financial services. As of December 31, 2022, we managed 2.9 billion square feet of properties globally for property owners/investors. We are compensated for our services through a monthly management fee earned based on either a specified percentage of the monthly rental income, rental receipts generated from the property under management or a fixed fee. We are also often reimbursed for our administrative and payroll costs directly attributable to the properties under management. Our management agreements with our property management services clients may be terminated by either party with notice generally ranging between 30 to 90 days; however, we have developed long-term relationships with many of these clients and the typical
contract continues for multiple years. We believe our contractual relationships with these clients put us in an advantageous position to provide other services to them, including leasing, refinancing, disposition and appraisal.
Valuation Services
We provide valuation services that include market-value appraisals, litigation support, discounted cash flow analyses, feasibility studies as well as consulting services such as property condition reports, hotel advisory and environmental consulting. Our valuation business has developed proprietary systems for data management, analysis and valuation report preparation, which we believe provide us with an advantage over our competitors. We believe that our valuation business is one of the largest in the commercial real estate industry. During 2022, we completed over 667,249 valuation, appraisal and advisory assignments globally, including residential valuations in Asia Pacific.
Global Workplace Solutions
Global Workplace Solutions provides a broad suite of integrated, contractually based outsourcing services to occupiers of real estate, including facilities management and project management. We also offer account-based Advisory services, particularly leasing, property sales and portfolio administration, for Global Workplace Solutions clients.
We believe the outsourcing of corporate real estate services is a long-term trend, with multi-national corporations, and other large occupiers of space utilizing global, full-service real estate firms to achieve better workplaces for their people, while endeavoring to lower their cost of occupancy. We typically enter into multi-year, often multi-service, outsourcing contracts with services delivered via dedicated account teams and/or an on-demand basis. The key outsourcing services offered through this business segment are described below.
Facilities Management Services
Facilities management services involves the day-to-day management of client-occupied space for traditional office space, such as headquarter buildings, regional offices and administrative offices, as well as facilities serving specialized industries, such as data centers, life science and medical facilities, distribution warehouses, government facilities and retail stores. Contracts for facilities management services are often structured so that we are reimbursed for client-dedicated personnel costs and subcontracted vendor costs as well as associated overhead expenses plus a monthly fee, and in some cases, annual incentives tied to agreed-upon performance targets, with any penalties typically capped. These are referred to as cost-plus contracts. In addition, we have contracts for facilities management services based on fixed-fee unit prices or guaranteed maximum prices. Fixed-fee contracts are typically structured where an agreed-upon scope of work is delivered for a fixed price while guaranteed maximum price contracts are structured with an agreed upon scope of work that will be provided to the client for a not-to-exceed price. We furnish facilities management services to clients with single or multiple-location assets as well as regional, national and global portfolios. As of December 31, 2022, we managed approximately 4.4 billion square feet of facilities on behalf of occupiers.
Our facilities management services are managed across three sub-lines of business – enterprise, local and data center services – by client type. Cost-plus contracts are most common for enterprise customers while fixed-price contracts are predominately for local and data center clients.
Project Management Services
Project management services can be provided on a one-off or programmatic basis to owners, investors and occupiers of real estate in markets around the world. Revenues from project management services generally include fixed management fees, variable fees, lump sum and incentive fees if certain agreed-upon performance targets are met. Revenues from project management may also include reimbursement of payroll and related costs for personnel providing the services and subcontracted vendor costs. In 2022, CBRE was directly responsible for implementing more than 52,000 projects with a combined contract value of approximately $148.0 billion. Our majority-owned subsidiary, Turner & Townsend, which was acquired in November 2021, plays a key role in providing cost, project, program management and project controls for a broad range of clients across the infrastructure, real estate and natural resources sectors. Turner & Townsend was involved in more than 5,000 projects in 2022 with an aggregate capital value of approximately $1.1 trillion.
Real Estate Investments
Real Estate Investments includes: (i) investment management services provided globally and (ii) development services in the U.S., United Kingdom (U.K.) and Continental Europe.
Investment Management Services
Investment management services are conducted through our indirect wholly owned subsidiary, CBRE Investment Management, LLC (CBRE Investment Management) and its global affiliates. CBRE Investment Management provides investment management services to pension funds, insurance companies, sovereign wealth funds, foundations, endowments and other institutional investors seeking to generate returns and diversification through investment in real assets such as real estate, infrastructure, master limited partnerships and other assets. We sponsor investment programs that span the risk/return spectrum in North America, Europe, Asia and Australia. In some strategies, CBRE Investment Management and its investment teams co-invest with its limited partners. Increasingly, real estate assets we are developing through our development services business are being placed into CBRE investment management strategies creating greater operational synergies among the Real Estate Investments businesses.
CBRE Investment Management manages real assets investments across five principal investment categories: (1) Private Direct Real Estate, through which CBRE Investment Management invests directly into properties; (2) Private Indirect Real Estate, through which CBRE Investment Management invests with specialist managers and operators in funds, programmatic ventures, joint ventures, and other indirect investment formats; (3) Listed Real Assets, through which CBRE Investment Management invests in public market real estate and infrastructure securities; (4) Private Infrastructure, through which CBRE Investment Management invests both directly and indirectly in infrastructure companies, projects, and ventures; and (5) Real Estate Credit, through which CBRE Investment Management manages loan portfolios backed by underlying real estate. Across these investment categories, CBRE Investment Management manages capital both through commingled fund strategies and custom separate account implementations.
Assets under management (AUM) totaled $149.3 billion at December 31, 2022 as compared to $141.9 billion at December 31, 2021, an increase of $7.4 billion ($13.1 billion in local currency).
Development Services
Development services are conducted through our indirect wholly owned subsidiary Trammell Crow Company, LLC, which provides commercial real estate development services in the U.S., U.K., and Continental Europe, and Telford Homes Plc (Telford), a developer of residential multi-family properties in the U.K.
Within Development Services, Trammell Crow Company pursues opportunistic, risk-mitigated development and investment strategies for users of and investors in commercial real estate, as well as for our own account. Our development business is active in industrial, office, residential multi-family/mixed-use projects, life sciences and healthcare facilities of all types (medical office buildings, hospitals and ambulatory surgery centers) and retail properties. We are compensated by our clients on a fee basis with no, or limited, ownership interest in a property; in partnership with our clients through co-investment – either on an individual project basis or through programs with certain strategic capital partners or for our own account with 100% ownership. Development services activity in which Trammell Crow Company has an ownership interest is conducted through subsidiaries that are consolidated or unconsolidated for financial reporting purposes, depending primarily on the extent and nature of our ownership interest.
Our Telford Homes business within Development Services is focused on residential real estate development in the United Kingdom, including for-sale and build-to-rent properties.
At December 31, 2022, we had $16.9 billion of development projects in process, and our development pipeline (prospective projects that we estimate have a greater than 50% chance of closing or where land has been acquired and the projected construction start date is more than one year out) totaled $12.9 billion at December 31, 2022.
Corporate and Other
Our Corporate function primarily consists of corporate headquarters costs for executive officers and certain other central functions. We track our strategic non-core non-controlling equity investments in “other” which is considered an operating segment and reported together with Corporate as it does not meet the aggregation criteria for presentation as a separate reportable segment. These activities are not allocated to the other business segments. Corporate and other also includes eliminations related to inter-segment revenue.
Competition
We face competition across our lines of business on a global, multi-national, national, regional and local level. Although we are the largest commercial real estate services firm in the world in terms of 2022 revenue, our relative competitive position varies significantly across geographic markets, property types and services. We face competition from other global, national, regional and local commercial real estate service providers; companies that traditionally competed in limited portions of our facilities management business and have expanded into other outsourcing offerings; in-house corporate real estate departments and property owners/developers that self-perform real estate services; investment banking firms, investment managers and developers that compete with us to raise and place investment capital; accounting/consulting firms that advise on real estate strategies; and providers of flexible office-space solutions that offer space directly to the occupier.
Despite ongoing consolidation, the commercial real estate services industry remains highly fragmented and competitive. Although many of our competitors are substantially smaller than we are, some of them are larger on a regional or local-market basis or have a stronger position in a specific market segment or service offering. Among our primary competitors are other large national and global firms, such as Jones Lang LaSalle Incorporated (JLL), Cushman & Wakefield plc, Colliers International Group Inc., Savills plc, and Newmark Group Inc., market-segment specialists, such as Eastdil Secured, Marcus & Millichap, Inc. and Walker & Dunlop, Inc.; firms with business lines that compete with some business lines within our occupier outsourcing business, such as ISS and Sodexo S.A., firms engaged in project management such as Arcadis and AECOM, and firms that provide flexible office-space solutions, such as WeWork and IWG/Regus/Spaces. These flexible space providers also compete directly with Industrious National Management Company LLC (Industrious), in which we have a non-controlling interest.
Seasonality
In a typical year, a significant portion of our revenue is seasonal, which an investor should keep in mind when comparing our financial condition and results of operations on a quarter-by-quarter basis. Historically, our revenue, operating income, net income and cash flow from operating activities have tended to be lowest in the first quarter and highest in the fourth quarter of each year. Revenue, earnings and cash flow have generally been concentrated in the fourth calendar quarter due to the focus on completing sales, financing and leasing transactions prior to year-end. The sharp rise in interest rates to combat inflation and resultant economic uncertainty may cause seasonality to deviate from historical patterns.
Human Capital
People & Culture
People are at the center of our strategy to deliver measurably superior outcomes for clients, and therefore we place a high priority on attracting, retaining and developing the best talent. Our human capital programs are designed to help prepare our professionals to succeed in their current and future roles, develop our leaders of tomorrow, reward our people with competitive pay and benefits, foster an engaging and inclusive workplace, and improve productivity through investments in technology, tools and resources. At December 31, 2022, we had approximately 115,000 employees (excluding Turner & Townsend employees) worldwide, approximately 46% of whose costs are fully reimbursed by clients and are mainly in our Global Workplace Solutions segment and our property management line of business within our Advisory Services segment. At December 31, 2022, approximately 14% of our employees worldwide were subject to collective bargaining agreements. Our global workforce at December 31, 2022 is comprised of approximately 34.3% female and 65.7% male employees.
RISE Values
We champion four key values—Respect, Integrity, Service, Excellence—which serve as the foundation upon which our company is built and as a touchstone for how our employees conduct themselves.
Diversity, Equity & Inclusion (DE&I)
We believe that our company is at its best when people of different background and life experiences come together to produce great results for our clients, communities and each other. We are committed to increasing the diversity of our workforce, strengthening an inclusive culture where everyone is valued and supported in achieving their full potential, and investing in the communities where we live and work. These efforts are led by our Chief Responsibility Officer, a senior executive level position reporting directly to our Chief Executive Officer. We have many programs and initiatives focused on driving these outcomes. These include collaborating with partners to reach diverse talent underrepresented in our industry, enhancing data analysis, improving technological capabilities to better inform decisions, and building a diverse talent pool and interview process. We are committed to driving economic impact in the marketplace through our supplier diversity initiatives and spent more than $1.5 billion with diverse suppliers in 2022, with a goal to lift that annual spend to $3 billion by the end of 2025. Also, as part of our Community Impact Initiative, we made significant financial contributions to nonprofit organizations that are helping to improve education and career development opportunities for women, racial/ethnic minorities, people with disabilities, LGBTQ individuals, and people with military service. These efforts will help to build the pipeline of talent well into the future and enable CBRE’s workforce to reflect the diversity of our communities. Our employee business resource groups have more than 19,000 members globally and are an essential element of our DE&I activities. They facilitate career and professional development sessions, create networking opportunities, and organize conversations and events on DE&I issues. We publicly report demographics, including diversity data, for our U.S. workforce annually in our Corporate Responsibility Report.
Total Rewards
We provide competitive total rewards programs in all the markets in which we operate, including fixed and variable pay, and comprehensive, company-specific benefits. Additionally, managers may implement flexible work arrangements, such as compressed work weeks and flextime, after considering several factors such as the nature of the employee’s work. We remain committed to providing eligible employees with meaningful and affordable benefits. We provide a variety of programs to support holistic physical and behavioral health, short and long-term financial stability, family planning and emotional resiliency for employees at any stage in their career.
Learning and Talent Development
We prioritize and invest in a range of learning and talent development programs that enable employees to thrive at CBRE and develop their careers. To this end, we leverage a range of different learning approaches including: webinars, live virtual and in-person training, self-paced e-digital learning, coaching, mentoring and on-the-job learning. To increase diversity, equity and inclusion awareness, we offer training programs in 32 languages.
Communication and Engagement
Our success depends on employees understanding how their work contributes to the company’s overall strategy. We use a variety of channels to facilitate two-way communication, including open forums with executives, annual employee engagement surveys, regularly scheduled performance review processes and participation in employee business resource groups globally for professional development, networking and advancing diversity, equity and inclusion goals.
Workplace Safety and Wellbeing
We drive a culture where safety and wellbeing are integrated into every business decision. We insist on high global standards and leadership accountability, striving to continually improve safety and wellbeing outcomes. Our wellbeing programs focus on five dimensions: occupational, social, environmental, physical, and intellectual. In 2022, we hosted our annual Global Safety and Wellbeing Week, themed “Safe and Well Across Every Dimension.” Our “Be Well” campaign supports employee wellbeing through benefits enhancements, information and resources, an internal podcast series and other engagement programs that received external recognition.
Communities and Giving
We are committed to supporting and adding value to the communities where our employees live and work around the world, as well as in communities where the need is greatest. In 2022, we launched fundraising programs to support refugees from Ukraine, including affected employees of our Ukraine affiliate, and victims of hurricanes, fires and floods. We align our philanthropy with the company’s overarching environmental, social and governance (ESG) priorities and focus on three main areas: driving climate action solutions, building the workforce of tomorrow by expanding opportunities for underrepresented individuals in our industry and improving our global headquarters city of Dallas, Texas.
Intellectual Property
We regard our intellectual property as an important part of our business. We hold various trademarks and trade names worldwide, which include the “CBRE,” “Turner & Townsend” and “Telford” marks. Although we believe our intellectual property plays a role in maintaining our competitive position in a number of the markets that we serve, we do not believe we would be materially, adversely affected by the expiration or termination of our trademarks or trade names or the loss of any of our other intellectual property rights other than the “CBRE” and “Trammell Crow Company” marks. We maintain trademark registrations for the “CBRE,” “Turner & Townsend” and “Telford” service marks in jurisdictions where we conduct significant business.
We hold a license to use the “Trammell Crow Company” trade name pursuant to a license agreement with CF98, L.P., an affiliate of Crow Realty Investors, L.P., d/b/a Crow Holdings, which may be revoked if we fail to satisfy usage and quality control covenants under the license agreement.
In addition to trademarks and trade names, we have acquired and developed proprietary technologies for the provision of complex services and analysis. We have a number of issued and pending patent applications relating to these proprietary technologies. We will continue to file additional patent applications on new inventions, as appropriate, demonstrating our commitment to technology and innovation. We also offer proprietary research to clients through our CBRE Research and CBRE Econometric Advisors commercial real estate market information and forecasting groups and we offer proprietary investment analysis and structures through our CBRE Investment Management business.
Material Governmental Matters
Environment
Federal, state and local laws and regulations in the countries in which we do business impose environmental liabilities, controls, disclosure rules and zoning restrictions that affect the ownership, management, development, use or sale of commercial real estate. Certain of these laws and regulations may impose liability on current or previous real property owners or operators for the cost of investigating, cleaning up or removing contamination caused by hazardous or toxic substances at a property, including contamination resulting from above-ground or underground storage tanks or the presence of asbestos or lead at a property. If contamination occurs or is present during our role as a property or facility manager or developer, we could be held liable for such costs as a current “operator” of a property, regardless of the legality of the acts or omissions that caused the contamination and without regard to whether we knew of, or were responsible for, the presence of such hazardous or toxic substances. The operator of a site also may be liable under common law to third parties for damages and injuries resulting from exposure to hazardous substances or environmental contamination at a site, including liabilities arising from exposure to asbestos-containing materials. Under certain laws and common law principles, any failure by us to disclose environmental contamination at a property could subject us to liability to a buyer or lessee of the property. Further, federal, state and local governments in the countries in which we do business have enacted various laws, regulations and treaties governing climate change, particularly for “greenhouse gas emissions” which seek to tax, penalize or limit their release. Such regulations could lead to increased operational or compliance costs over time.
While we are aware of the presence or the potential presence of regulated substances in the soil or groundwater at or near several properties owned, operated or managed by us that may have resulted from historical or ongoing activities on those properties, we are not aware of any material noncompliance with the environmental laws or regulations currently applicable to us, and we are not the subject of any material claim for liability with respect to contamination at any location. However, these laws and regulations may discourage sales and leasing activities and mortgage lending with respect to some properties, which may adversely affect both the commercial real estate services industry in general and us. Environmental contamination or other environmental liabilities may also negatively affect the value of commercial real estate assets held by entities that are managed by our investment management and development services businesses, which could adversely affect the results of operations of these business lines.
Environmental Sustainability
We have developed measurable environmental and sustainability goals for 2035, grounded in science and an assessment of where our operations have the most significant potential to impact on the environment, as well as the areas where we can most effectively mitigate that impact. These include goals to reduce Scope 1 and 2 greenhouse gas emissions 68% from the 2019 base year. Additional information about our approach to corporate social responsibility and to environmental, social and governance (ESG) issues is available on our Corporate Responsibility website (https://www.cbre.com/about-us/corporate-responsibility#overview), including the CBRE Corporate Responsibility Report. The contents of our website and Corporate Responsibility Report are referenced for general information only and are not incorporated in this Annual Report on Form 10-K.
Available Information
Our Annual Report on Form 10-K (Annual Report), Quarterly Reports on Form 10-Q, Current Reports on Form 8-K, Proxy Statements and amendments to those reports filed or furnished pursuant to Sections 13(a) or 15(d) of the Securities Exchange Act of 1934, as amended (the Exchange Act), are available on the Investor Relations section of our website (https://ir.cbre.com) as soon as reasonably practicable after we electronically file such material with, or furnish it to, the U.S. Securities and Exchange Commission (the SEC). We also make available through our website other reports filed with or furnished to the SEC under the Exchange Act, including reports filed by our officers and directors under Section 16(a) of the Exchange Act. All of the information on our Investor Relations website is available to be viewed free of charge. The SEC maintains a website (https://www.sec.gov) that contains reports, proxy and information statements, and other information regarding issuers that file electronically with the SEC.
Our website (https://www.cbre.com) contains information concerning us. We routinely use our website as a channel of distribution for our information, including financial and other material information. Information contained on our website is not part of this Annual Report or our other filings with the SEC. We have included the web addresses of the company and the SEC as inactive textual references only. Except as specifically incorporated by reference into this document, information on these websites is not part of this document.
Cautionary Note on Forward-Looking Statements
This Annual Report contains forward-looking statements within the meaning of Section 27A of the Securities Act of 1933, as amended (the Securities Act) and Section 21E of the Exchange Act. The words “anticipate,” “believe,” “could,” “should,” “propose,” “continue,” “estimate,” “expect,” “intend,” “may,” “plan,” “predict,” “project,” “will” and similar terms and phrases are used in this Annual Report to identify forward-looking statements. Except for historical information contained herein, the matters addressed in this Annual Report are forward-looking statements. These statements relate to analyses and other information based on forecasts of future results and estimates of amounts not yet determinable. These statements also relate to our future prospects, developments and business strategies.
These forward-looking statements are made based on our management’s expectations and beliefs concerning future events affecting us and are subject to uncertainties and factors relating to our operations and business environment, all of which are difficult to predict and many of which are beyond our control. These uncertainties and factors could cause our actual results to differ materially from those matters expressed in or implied by these forward-looking statements.
The following factors are among those, but are not only those, that may cause actual results to differ materially from the forward-looking statements:
-
disruptions in general economic, political and regulatory conditions and significant public health events, particularly in geographies or industry sectors where our business may be concentrated;
-
volatility or adverse developments in the securities, capital or credit markets, interest rate increases and conditions affecting the value of real estate assets, inside and outside the U.S.;
-
poor performance of real estate investments or other conditions that negatively impact clients’ willingness to make real estate or long-term contractual commitments and the cost and availability of capital for investment in real estate;
-
foreign currency fluctuations and changes in currency restrictions, trade sanctions and import/export and transfer pricing rules;
-
our ability to compete globally, or in specific geographic markets or business segments that are material to us;
-
our ability to identify, acquire and integrate accretive businesses;
-
costs and potential future capital requirements relating to businesses we may acquire;
-
integration challenges arising out of companies we may acquire;
-
increases in unemployment and general slowdowns in commercial activity;
-
trends in pricing and risk assumption for commercial real estate services;
-
the effect of significant changes in capitalization rates across different property types;
-
a reduction by companies in their reliance on outsourcing for their commercial real estate needs, which would affect our revenues and operating performance;
-
client actions to restrain project spending and reduce outsourced staffing levels;
-
our ability to further diversify our revenue model to offset cyclical economic trends in the commercial real estate industry;
-
our ability to attract new user and investor clients;
-
our ability to retain major clients and renew related contracts;
-
our ability to leverage our global services platform to maximize and sustain long-term cash flow;
-
our ability to continue investing in our platform and client service offerings;
-
our ability to maintain expense discipline;
-
the emergence of disruptive business models and technologies;
-
negative publicity or harm to our brand and reputation;
-
the failure by third parties to comply with service level agreements or regulatory or legal requirements;
-
the ability of our investment management business to maintain and grow assets under management and achieve desired investment returns for our investors, and any potential related litigation, liabilities or reputational harm possible if we fail to do so;
-
our ability to manage fluctuations in net earnings and cash flow, which could result from poor performance in our investment programs, including our participation as a principal in real estate investments;
-
the ability of CBRE Capital Markets to periodically amend, or replace, on satisfactory terms, the agreements for its warehouse lines of credit;
-
declines in lending activity of U.S. GSEs, regulatory oversight of such activity and our mortgage servicing revenue from the commercial real estate mortgage market;
-
changes in U.S. and international law and regulatory environments (including relating to anti-corruption, anti-money laundering, trade sanctions, tariffs, currency controls and other trade control laws), particularly in Asia, Africa, Russia, Eastern Europe and the Middle East, due to the level of political instability in those regions;
-
litigation and its financial and reputational risks to us;
-
our exposure to liabilities in connection with real estate advisory and property management activities and our ability to procure sufficient insurance coverage on acceptable terms;
-
our ability to retain, attract and incentivize key personnel;
-
our ability to manage organizational challenges associated with our size;
-
liabilities under guarantees, or for construction defects, that we incur in our development services business;
-
variations in historically customary seasonal patterns that cause our business not to perform as expected;
-
our leverage under our debt instruments as well as the limited restrictions therein on our ability to incur additional debt, and the potential increased borrowing costs to us from a credit-ratings downgrade;
-
our and our employees’ ability to execute on, and adapt to, information technology strategies and trends;
-
cybersecurity threats or other threats to our information technology networks, including the potential misappropriation of assets or sensitive information, corruption of data or operational disruption;
-
our ability to comply with laws and regulations related to our global operations, including real estate licensure, tax, labor and employment laws and regulations, fire and safety building requirements and regulations, as well as data privacy and protection regulations, ESG matters, and the anti-corruption laws and trade sanctions of the U.S. and other countries;
-
changes in applicable tax or accounting requirements;
-
any inability for us to implement and maintain effective internal controls over financial reporting;
-
the effect of implementation of new accounting rules and standards or the impairment of our goodwill and intangible assets;
-
the performance of our equity investments in companies we do not control; and
-
the other factors described elsewhere in this Annual Report, included under the headings “Risk Factors,” “Management’s Discussion and Analysis of Financial Condition and Results of Operations—Critical Accounting Policies,” “Quantitative and Qualitative Disclosures About Market Risk” or as described in the other documents and reports we file with the SEC.
Forward-looking statements speak only as of the date the statements are made. You should not put undue reliance on any forward-looking statements. We assume no obligation to update forward-looking statements to reflect actual results, changes in assumptions or changes in other factors affecting forward-looking information, except to the extent required by applicable securities laws. If we do update one or more forward-looking statements, no inference should be drawn that we will make additional updates with respect to those or other forward-looking statements. Additional information concerning these and other risks and uncertainties is contained in our other periodic filings with the SEC.
Investors and others should note that we routinely announce financial and other material information using our Investor Relations website (https://ir.cbre.com), SEC filings, press releases, public conference calls and webcasts. We use these channels of distribution to communicate with our investors and members of the public about our company, our services and other items of interest. Information contained on our website is not part of this Annual Report or our other filings with the SEC.
Item 1A. Risk Factors.
Set forth below and elsewhere in this Annual Report and in other documents we file with the SEC are risks and uncertainties that could cause our actual results to differ materially from the results contemplated by the forward-looking statements contained in this Annual Report and other public statements we make. Based on the information currently known to us, we believe that the matters discussed below identify the material risk factors affecting our business. However, the risks and uncertainties we face are not limited to those described below. Additional risks and uncertainties not presently known to us or that we currently believe to be immaterial, but that could later become material, may also adversely affect our business.
Risks Related to our Business Environment
Our performance is significantly related to general economic, political and regulatory conditions and, accordingly, our business, operations and financial condition could be materially adversely affected by economic slowdowns, liquidity constraints, significant rises in interest rates, significant public health events, fiscal or political uncertainty and possible subsequent downturns in commercial real estate asset values, property sales and leasing activities in the geographies or industry sectors that we or our clients serve.
Periods of economic weakness or recession, fiscal or political uncertainty, market volatility, declining employment levels, declining demand for commercial real estate, falling real estate values, disruption to the global capital or credit markets, significant rises in interest rates or the public perception that any of these events may occur, may materially and negatively affect the performance of some or all of our business lines.
Our business is significantly affected by generally prevailing economic conditions in the markets where we operate. Adverse economic conditions, political or regulatory uncertainty and significant public health events can result in declines in real estate sale and leasing volumes and the value of commercial real estate. It may also lead to a decrease in funds invested in commercial real estate assets and development projects. Such developments in turn may reduce our revenue from property management fees and commissions derived from property sales, leasing, valuation and financing, as well as revenues associated with development or investment management activities. For example, during the onset of the Covid-19 pandemic, commercial real estate markets globally were severely impacted by a sharp decline in economic activity due to the spread of Covid-19, which put downward pressure on certain parts of our business, and has likely engendered structural changes to the utilization of many types of commercial real estate, which will have ongoing repercussions for our business. Our businesses could also suffer from political or economic disruptions (or the perception that such disruptions may occur) that affect interest rates or liquidity or create financial, market or regulatory uncertainty. For example, Russia’s invasion of Ukraine in 2022 heightened risks for our operations in Europe, caused us to exit most of our business in Russia, and exacerbated a number of existing macroeconomic challenges that adversely impacted our markets and our business.
We also make co-investments alongside our investor clients in our development and investment management businesses. During an economic downturn, capital for our investment activities could be constrained and it may take longer for us to dispose of real estate investments or sale prices we achieve may be lower than originally anticipated. As a result, the value of our commercial real estate investments may be reduced, and we could realize losses or diminished profitability. In addition, economic downturns may reduce the volume of loans our capital markets business originates and/or services. Fees within our property management business are generally based on a percentage of rent collections, making them sensitive to macroeconomic conditions that negatively impact rent collections and the performance of the properties we manage.
Economic, political and regulatory uncertainty as well as significant changes and volatility in the financial markets and business environment, and in the global landscape, make it difficult for us to predict our financial performance into the future. As a result, any guidance or outlook that we provide on our performance is based on then-current conditions, and there is a risk that such guidance may turn out to be inaccurate.
Adverse developments in the credit markets may materially harm our business, results of operations and financial condition.
Our investment management, development services, capital markets (including property sales and mortgage origination) and mortgage services businesses are sensitive to credit cost and availability as well as financial liquidity. Additionally, the revenues in all of our businesses are dependent to some extent on the overall volume of activity (and pricing) in the commercial real estate markets.
Disruptions in the credit markets may have a material adverse effect on our business of providing advisory services to owners, investors and occupiers of real estate in connection with the leasing, disposition and acquisition of property. If our clients are unable to obtain credit on favorable terms, there may be fewer property leasing, disposition and acquisition transactions. For example, in the second half of 2022, central banks around the world sharply raised interest rates in efforts to rein in inflation, reducing credit availability. Less available and more expensive debt capital had pronounced effects on our capital markets, mortgage origination and property sales businesses. In addition, under such conditions, our investment management and development services businesses may be unable to attract capital or achieve returns sufficient to earn incentive fees and we may also experience losses of co-invested equity capital if any such disruption causes a prolonged decline in the value of investments made.
Our operations are subject to social, political and economic risks in foreign countries as well as foreign currency volatility.
We conduct a significant portion of our business and employ a substantial number of people outside of the U.S. and, as a result, we are subject to risks associated with doing business globally. During the year ended December 31, 2022, approximately 43% of our revenue was transacted in foreign currencies. Fluctuations in foreign currency exchange rates may result in corresponding fluctuations in revenue and earnings as well as the assets under management for our investment management business, which could have a material adverse effect on our business, financial condition and operating results. Due to the constantly changing currency exposures to which we are subject and the volatility of currency exchange rates, we cannot predict the effect of exchange rate fluctuations upon future operating results.
In addition, international economic trends, foreign governmental policy actions and the following factors may have a material adverse effect on the performance of our business:
-
difficulties and costs of staffing and managing international operations among diverse geographies, languages and cultures;
-
currency restrictions, transfer-pricing regulations and adverse tax consequences, which may affect our ability to transfer capital and profits;
-
adverse changes in regulatory or tax requirements and regimes or uncertainty about the application of or the future of such regulatory or tax requirements and regimes;
-
responsibility for complying with numerous, potentially conflicting and frequently complex and changing laws in multiple jurisdictions (e.g., with respect to data privacy and protection, corrupt practices, embargoes, trade sanctions, employment and licensing);
-
the impa
Showing the first 8K of 70K characters. Open the full section
Item 1B. Unresolved Staff Comments.
None.
Item 2. Properties.
As of December 31, 2022, we occupied offices, excluding affiliates, in the following geographical regions:
| Sales Offices**(1)** | Corporate Offices | Total | |||||||||||||||
| Americas | 255 | 1 | 256 | ||||||||||||||
| Europe, Middle East and Africa (EMEA) | 250 | 1 | 251 | ||||||||||||||
| Asia Pacific | 149 | 1 | 150 | ||||||||||||||
| Total | 654 | 3 | 657 |
(1)Includes 122 offices of Turner & Townsend, including 33 in the Americas, 58, in EMEA, and 31 offices in APAC regions.
Some of our offices house employees from more than one of our business segments (i.e. an office might house employees from all three of our business segments). As such, we have provided the above office totals by geographic region rather than by business segment in order to avoid double counting or triple counting our offices.
We do not own any material real property and generally lease our office space and believe it is adequate for our current needs. The most significant terms of the leasing arrangements for our offices are the length of the lease and rent. Our leases have terms varying in duration. The rent payable under our office leases varies significantly from location to location as a result of differences in prevailing commercial real estate rates in different geographic areas. Our management believes that no single office lease is material to our business, results of operations or financial condition. In addition, we believe there is adequate alternative office space available at acceptable rental rates to meet our needs, although adverse movements in rental rates in some markets may negatively affect our profits in those markets when we enter into new leases.
Item 3. Legal Proceedings.
We are a party to a number of pending or threatened lawsuits arising out of, or incident to, our ordinary course of business. We believe that any losses in excess of the amounts accrued therefore as liabilities on our consolidated financial statements are unlikely to be significant, but litigation is inherently uncertain and there is the potential for a material adverse effect on our consolidated financial statements if one or more matters are resolved in a particular period in an amount materially in excess of what we anticipated.
Item 4. Mine Safety Disclosures.
Not applicable.
PART II
Item 5. Market for Registrant’s Common Equity, Related Stockholder Matters and Issuer Purchases of Equity Securities.
Stock Price Information
Our Class A common stock has traded on the NYSE under the symbol “CBRE” since March 19, 2018. Prior to that, from June 10, 2004 to March 18, 2018, our Class A common stock traded on the NYSE under the symbol “CBG.”
As of February 16, 2023, there were 47 stockholders of record of our Class A common stock. This figure does not include beneficial owners who hold shares in nominee name.
Dividend Policy
We have not declared or paid any cash dividends on any class of our common stock since our inception on February 20, 2001. Any future determination to pay cash dividends will be at the discretion of our board of directors and will depend on our financial condition, acquisition or other opportunities to invest capital, results of operations, capital requirements and other factors that the board of directors deems relevant.
Recent Sales of Unregistered Securities
None.
Issuer Purchases of Equity Securities
Open market share repurchase activity during the three months ended December 31, 2022 was as follows (dollars in thousands, except per share amounts):
| Period | Total Number of Shares Purchased | Average Price Paid per Share | Total Number of Shares Purchased as Part of Publicly Announced Plans or Programs | Approximate Dollar Value of Shares That May Yet Be Purchased Under the Plans or Programs (1) | |||||||||||||
| October 1, 2022 - October 31, 2022 | 1,710,392 | $ | 70.10 | 1,710,392 | |||||||||||||
| November 1, 2022 - November 30, 2022 | 2,103,417 | 73.53 | 2,103,417 | ||||||||||||||
| December 1, 2022 - December 31, 2022 | 2,293,711 | 76.90 | 2,293,711 | ||||||||||||||
| 6,107,520 | $ | 73.84 | 6,107,520 | $ | 2,115,795 |
(1)In November 2021, our board of directors authorized a program for the company to repurchase up to $2.0 billion of our Class A common stock over five years, effective November 19, 2021 (the “2021 program”). In August 2022, our board of directors authorized an additional $2.0 billion under this program, bringing the total authorized amount under the 2021 program to a total of $4.0 billion. During the fourth quarter of 2022, we repurchased $451.0 million of our common stock under the 2021 program. The remaining $2.1 billion in the table represents the amount available to repurchase shares under the 2021 program as of December 31, 2022.
Our stock repurchase program does not obligate us to acquire any specific number of shares. Under this program, shares may be repurchased in privately negotiated and/or open market transactions, including under plans complying with Rule 10b5-1 under the Exchange Act. Our stock repurchases have been funded with cash on hand and we intend to continue funding future repurchases with existing cash. We may utilize our stock repurchase programs to continue offsetting the impact of our stock-based compensation program and on a more opportunistic basis if we believe our stock presents a compelling investment compared to other discretionary uses. The timing of any future repurchases and the actual amounts repurchased will depend on a variety of factors, including the market price of our common stock, general market and economic conditions and other factors.
Stock Performance Graph
The graph below matches the 5 Year Cumulative Total Return of holders of CBRE Group, Inc.’s common stock with the cumulative total returns of the S&P 500 Index and a customized peer group of eight companies that includes: JLL, a global commercial real estate services company publicly traded in the U.S., as well as the following companies that have significant commercial real estate or real estate capital markets businesses within the U.S. or globally, that in each case are publicly traded in the U.S. or abroad: Colliers International Group Inc. (CIGI), Cushman & Wakefield plc (CWK), ISS A/S (ISS), Marcus & Millichap, Inc. (MMI), Newmark Group Inc. (NMRK), Savills plc (SVS.L), and Walker & Dunlop, Inc. (WD). These companies are or include divisions with business lines reasonably comparable to some or all of ours, and which represent our current primary competitors. In 2022, we elected to remove Sodexo S.A. (EXHO.PA) from our peer group given that facilities management is a relatively small portion of Sodexo’s overall service offerings.
The graph assumes that the value of the investment in our common stock, in each index, and in the peer group (including reinvestment of dividends) was $100 on December 31, 2017 and tracks it through December 31, 2022. Our stock price performance shown in the graph below is not necessarily indicative of future stock price performance.
COMPARISON OF 5 YEAR CUMULATIVE TOTAL RETURN (1)
AMONG CBRE GROUP, INC., THE S&P 500 INDEX (2),
A 2021 PEER GROUP AND A 2022 PEER GROUP
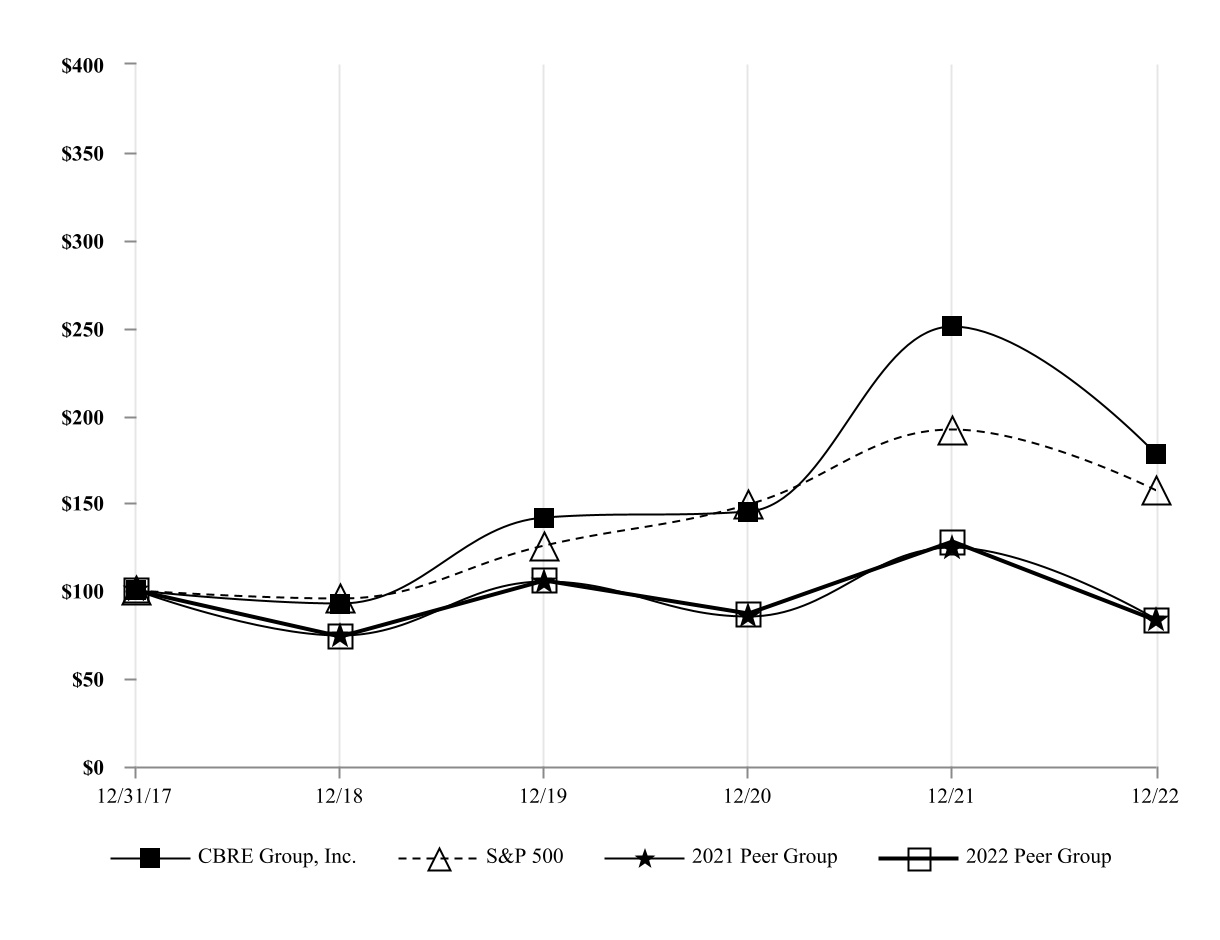
| 12/31/17 | 12/18 | 12/19 | 12/20 | 12/21 | 12/22 | |||||||||||||||
| CBRE Group, Inc. | $ | 100.00 | $ | 92.45 | $ | 141.51 | $ | 144.82 | $ | 250.54 | $ | 177.70 | ||||||||
| S&P 500 | 100.00 | 95.62 | 125.72 | 148.85 | 191.58 | 156.89 | ||||||||||||||
| 2021 Peer Group | 100.00 | 74.55 | 105.11 | 85.40 | 124.37 | 83.72 | ||||||||||||||
| 2022 Peer Group | 100.00 | 73.92 | 105.47 | 86.74 | 127.84 | 83.14 |
(1)$100 invested on December 31, 2017 in stock or index-including reinvestment of dividends. Fiscal year ending December 31.
(2)Copyright© 2023 Standard & Poor’s, a division of S&P Global. All rights reserved.
This graph shall not be deemed incorporated by reference by any general statement incorporating by reference this Annual Report into any filing under the Securities Act or the Exchange Act, except to the extent that we specifically incorporate this information by reference therein, and shall not otherwise be deemed filed under the Securities Act or the Exchange Act.
Item 6. [Reserved]
Item 7. Management’s Discussion and Analysis of Financial Condition and Results of Operations.
Management’s Discussion and Analysis of Financial Condition and Results of Operations (MD&A) is designed to provide the reader of our financial statements with a narrative from the perspective of management on our financial condition, results of operations, liquidity and certain other factors that may affect future results. This MD&A should be read in conjunction with our consolidated financial statements and related notes included elsewhere in this Annual Report. Discussion regarding our financial condition and results of operations for the year ended December 31, 2021 and comparisons between the years ended December 31, 2021 and 2020 is included in Part II, Item 7. “Management’s Discussion and Analysis of Financial Condition and Results of Operations” in the company’s 2021 Annual Report filed with the SEC on February 28, 2022.
Overview
We are the world’s largest commercial real estate services and investment firm, based on 2022 revenue, with leading global market positions in our leasing, property sales, occupier outsourcing and valuation businesses. As of December 31, 2022, the company has approximately 115,000 employees (excluding Turner & Townsend employees) serving clients in more than 100 countries.
We provide services to real estate investors and occupiers. For investors, our services include capital markets (property sales and mortgage origination), mortgage sales and servicing, property leasing, investment management, property management, valuation and development services, among others. For occupiers, our services include facilities management, project management and transaction (property sales and leasing) and consulting services, among others. We provide services under the following brand names: “CBRE” (real estate advisory and outsourcing services); “CBRE Investment Management” (investment management); “Trammell Crow Company” (primarily U.S. development); “Telford Homes” (U.K. development); and “Turner & Townsend Holdings Limited” (Turner & Townsend).
We generate revenue from stable, recurring sources (large multi-year portfolio and per project contracts) and from cyclical, non-recurring sources, including commissions on transactions. Our revenue mix has become heavily weighted towards stable revenue sources, particularly occupier outsourcing, and our dependence on cyclical property sales and lease transaction revenue has declined. We believe we are well-positioned to capture a substantial and growing share of market opportunities at a time when investors and occupiers increasingly prefer to purchase integrated, account-based services on a national and global basis.
In 2022, we generated revenue from a highly diversified base of clients, including more than 95 of the Fortune 100 companies. We have been an S&P 500 company since 2006 and in 2022 we were ranked #126 on the Fortune 500. We have been voted the most recognized commercial real estate brand in the Lipsey Company survey for 22 years in a row (including 2022). We have also been rated a World’s Most Ethical Company by the Ethisphere Institute for nine consecutive years (including 2022, the most recent year the award has been announced), and included in the Dow Jones World Sustainability Index for four years in a row and the Bloomberg Gender-Equality Index for four years in a row (including 2023).
Critical Accounting Policies and Estimates
Our consolidated financial statements have been prepared in accordance with GAAP, which require us to make estimates and assumptions that affect reported amounts. The estimates and assumptions are based on historical experience and on other factors that we believe to be reasonable. Actual results may differ from those estimates. We believe that the following critical accounting policies represent the areas where more significant judgments and estimates are used in the preparation of our consolidated financial statements.
Revenue Recognition
To recognize revenue in a transaction with a customer, we evaluate the five steps of the Accounting Standards Codification (ASC) Topic 606 revenue recognition framework: (1) identify the contract; (2) identify the performance obligations in the contract; (3) determine the transaction price; (4) allocate the transaction price to the performance obligations and (5) recognize revenue when (or as) the performance obligations are satisfied.
Our revenue recognition policies are consistent with this five step framework. Understanding the complex terms of agreements and determining the appropriate time, amount, and method to recognize revenue for each transaction requires significant judgement. These significant judgements include: (i) determining what point in time or what measure of progress depicts the transfer of control to the customer; (ii) applying the series guidance to certain performance obligations satisfied over
time; (iii) estimating how and when contingencies, or other forms of variable consideration, will impact the timing and amount of recognition of revenue and (iv) determining whether we control third party services before they are transferred to the customer in order to appropriately recognize the associated fees on either a gross or net basis. The timing and amount of revenue recognition in a period could vary if different judgments were made. Our revenues subject to the most judgment are brokerage commission revenue, incentive-based management fees, development fees and third party fees associated with our occupier outsourcing and property management services. For a detailed discussion of our revenue recognition policies, see the Revenue Recognition section within Note 2 of the Notes to Consolidated Financial Statements set forth in Item 8 of this Annual Report.
Business Combinations, Goodwill and Other Intangible Assets
Our acquisitions require the application of purchase accounting, which results in tangible and identifiable intangible assets and liabilities of the acquired entity being recorded at fair value. The difference between the purchase price and the fair value of net assets acquired is recorded as goodwill. Deferred consideration arrangements granted in connection with a business combination are evaluated to determine whether all or a portion is, in substance, additional purchase price or compensation for services. Additional purchase price is added to the fair value of consideration transferred in the business combination and compensation is included in operating expenses in the period it is incurred. In determining the fair values of assets and liabilities acquired in a business combination, we use a variety of valuation methods including present value, depreciated replacement cost, market values (where available) and selling prices less costs to dispose. We are responsible for determining the valuation of assets and liabilities and for the allocation of purchase price to assets acquired and liabilities assumed.
Assumptions must often be made in determining fair values, particularly where observable market values do not exist. Assumptions may include discount rates, growth rates, cost of capital, royalty rates, tax rates and remaining useful lives. These assumptions can have a significant impact on the value of identifiable assets and accordingly can impact the value of goodwill recorded. Different assumptions could result in different values being attributed to assets and liabilities. Since these values impact the amount of annual depreciation and amortization expense, different assumptions could also impact our statement of operations and could impact the results of future asset impairment reviews.
We are required to test goodwill and other intangible assets deemed to have indefinite useful lives for impairment at least annually, or more often if circumstances or events indicate a change in the impairment status, in accordance with ASC Topic 350, “*Intangible
Showing the first 8K of 108K characters. Open the full section
Item 7A. Quantitative and Qualitative Disclosures About Market Risk.
Our exposure to market risk primarily consists of foreign currency exchange rate fluctuations related to our international operations and changes in interest rates on debt obligations. We manage such risk primarily by managing the amount, sources, and duration of our debt funding and by using derivative financial instruments. We apply FASB ASC (Topic 815), “Derivatives and Hedging,” when accounting for derivative financial instruments. In all cases, we view derivative financial instruments as a risk management tool and, accordingly, do not use derivatives for trading or speculative purposes.
Exchange Rates
Our foreign operations expose us to fluctuations in foreign exchange rates. These fluctuations may impact the value of our cash receipts and payments in terms of our functional (reporting) currency, which is the U.S. dollar. See the discussion of international operations, which is included in Item 7. “Management’s Discussion and Analysis of Financial Condition and Results of Operations” under the caption “International Operations” and is incorporated by reference herein.
Interest Rates
We manage our interest expense by using a combination of fixed and variable rate debt. Historically, we have entered into interest rate swap agreements to attempt to hedge the variability of future interest payments due to changes in interest rates. As of December 31, 2022, we do not have any outstanding interest rate swap agreements.
The estimated fair value of our senior term loans was approximately $424.6 million at December 31, 2022. Based on dealers’ quotes, the estimated fair value of our 4.875% and 2.500% senior notes was $595.2 million and $396.8 million, respectively, at December 31, 2022.
We utilize sensitivity analyses to assess the potential effect on our variable rate debt. If interest rates were to increase 100 basis points on our outstanding variable rate debt at December 31, 2022, the net impact of the additional interest cost would be a decrease of $6.4 million on pre-tax income and a decrease of $6.4 million in cash provided by operating activities for the year ended December 31, 2022.
Item 8. Financial Statements and Supplementary Data.
INDEX TO CONSOLIDATED FINANCIAL STATEMENTS
AND FINANCIAL STATEMENT SCHEDULES
| Page | |||||
| Report of Independent Registered Public Accounting Firm on Consolidated Financial Statements (KPMG LLP, Los Angeles, CA, Auditor Firm ID: 185) | 56 | ||||
| Report of Independent Registered Public Accounting Firm on Internal Control Over Financial Reporting | 59 | ||||
| Consolidated Balance Sheets at December 31, 2022 and 2021 | 60 | ||||
| Consolidated Statements of Operations for the years ended December 31, 2022, 2021 and 2020 | 61 | ||||
| Consolidated Statements of Comprehensive Income for the years ended December 31, 2022, 2021 and 2020 | 62 | ||||
| Consolidated Statements of Cash Flows for the years ended December 31, 2022, 2021 and 2020 | 63 | ||||
| Consolidated Statements of Equity for the years ended December 31, 2022, 2021 and 2020 | 65 | ||||
| Notes to Consolidated Financial Statements | 67 | ||||
| FINANCIAL STATEMENT SCHEDULES: | |||||
| Schedule II -Valuation and Qualifying Accounts | 124 |
All other schedules are omitted because they are either not applicable, not required or the information required is included in the Consolidated Financial Statements, including the notes thereto.
Report of Independent Registered Public Accounting Firm
To the Stockholders and Board of Directors
CBRE Group, Inc.:
Opinion on the Consolidated Financial Statements
We have audited the accompanying consolidated balance sheets of CBRE Group, Inc. and subsidiaries (the Company) as of December 31, 2022 and 2021, the related consolidated statements of operations, comprehensive income, cash flows, and equity for each of the years in the three-year period ended December 31, 2022, and the related notes and financial statement schedule II (collectively, the consolidated financial statements). In our opinion, the consolidated financial statements present fairly, in all material respects, the financial position of the Company as of December 31, 2022 and 2021, and the results of its operations and its cash flows for each of the years in the three-year period ended December 31, 2022, in conformity with U.S. generally accepted accounting principles.
We also have audited, in accordance with the standards of the Public Company Accounting Oversight Board (United States) (PCAOB), the Company’s internal control over financial reporting as of December 31, 2022, based on criteria established in Internal Control – Integrated Framework (2013) issued by the Committee of Sponsoring Organizations of the Treadway Commission, and our report dated February 24, 2023 expressed an unqualified opinion on the effectiveness of the Company’s internal control over financial reporting.
Basis for Opinion
These consolidated financial statements are the responsibility of the Company’s management. Our responsibility is to express an opinion on these consolidated financial statements based on our audits. We are a public accounting firm registered with the PCAOB and are required to be independent with respect to the Company in accordance with the U.S. federal securities laws and the applicable rules and regulations of the Securities and Exchange Commission and the PCAOB.
We conducted our audits in accordance with the standards of the PCAOB. Those standards require that we plan and perform the audit to obtain reasonable assurance about whether the consolidated financial statements are free of material misstatement, whether due to error or fraud. Our audits included performing procedures to assess the risks of material misstatement of the consolidated financial statements, whether due to error or fraud, and performing procedures that respond to those risks. Such procedures included examining, on a test basis, evidence regarding the amounts and disclosures in the consolidated financial statements. Our audits also included evaluating the accounting principles used and significant estimates made by management, as well as evaluating the overall presentation of the consolidated financial statements. We believe that our audits provide a reasonable basis for our opinion.
Critical Audit Matters
The critical audit matters communicated below are matters arising from the current period audit of the consolidated financial statements that were communicated or required to be communicated to the audit committee and that: (1) relate to accounts or disclosures that are material to the consolidated financial statements and (2) involved our especially challenging, subjective, or complex judgments. The communication of critical audit matters does not alter in any way our opinion on the consolidated financial statements, taken as a whole, and we are not, by communicating the critical audit matters below, providing separate opinions on the critical audit matters or on the accounts or disclosures to which they relate.
Evaluation of contingent liability for Telford fire safety remediation
As discussed in Note 22 to the consolidated financial statements, on April 28, 2022, the United Kingdom (“UK”) passed the Building Safety Act of 2022 (“BSA”). The BSA introduced new laws related to building safety and the remediation of historic building safety defects, effectively requiring developers to remediate certain buildings with critical fire safety issues. Telford Homes (a wholly owned subsidiary of CBRE Group, Inc.) signed the UK government’s non-binding Fire Safety Pledge (the “Pledge”) on April 28, 2022. The Pledge states that, subject to entering into mutually acceptable legally binding agreements with the UK government, Telford Homes will (1) take responsibility for performing or funding self-remediation works relating to certain life-critical fire-safety issues on all Telford Homes-constructed buildings of 11 meters in height or greater in England constructed in the last 30 years and (2) withdraw Telford Homes-developed buildings from the government-sponsored BSF and ACM Funds or reimburse the government funds for the cost of remediation of in-scope buildings. The Company has recorded a $185.9 million contingent liability related to the Pledge as of December 31, 2022, of which $134.3 million is related to management’s estimate for the potential
Showing the first 8K of 282K characters. Open the full section
Item 9. Changes in and Disagreements with Accountants on Accounting and Financial Disclosure.
None.
Item 9A. Controls and Procedures.
Management’s Report on Internal Control Over Financial Reporting
Management is responsible for establishing and maintaining adequate internal control over financial reporting (as defined in Rules 13a-15(f) and 15d-15(f) of the Securities Exchange Act of 1934, as amended (the Exchange Act). The company’s management, with participation of the CEO and CFO, under the oversight of our Board of Directors, evaluated the effectiveness of the company’s internal control over financial reporting as of December 31, 2022, using the framework in Internal Control - Integrated Framework (2013), issued by the Committee of Sponsoring Organizations of the Treadway Commission (COSO). A company’s internal control over financial reporting includes those policies and procedures that:
(1)pertain to the maintenance of records that, in reasonable detail, accurately and fairly reflect the transactions and dispositions of the assets of the company;
(2)provide reasonable assurance that transactions are recorded as necessary to permit preparation of financial statements in accordance with generally accepted accounting principles, and that receipts and expenditures of the company are being made only in accordance with authorizations of management and directors of the company; and
(3)provide reasonable assurance regarding prevention or timely detection of unauthorized acquisition, use, or disposition of the company’s assets that could have a material effect on the financial statements.
Because of its inherent limitations, internal control over financial reporting may not prevent or detect misstatements. Also, projections of any evaluation of effectiveness towards future periods are subject to the risk that controls may become inadequate because of changes in conditions or that the degree of compliance with the policies or procedures may deteriorate.
Based on the evaluation under this framework, management concluded that the company’s internal control over financial reporting was effective as of December 31, 2022.
The effectiveness of the company’s internal control over financial reporting as of December 31, 2022 has been audited by KPMG LLP, an independent registered public accounting firm, as stated in their report, which is included herein on page 59.
Disclosure Controls and Procedures
Our Chief Executive Officer and Chief Financial Officer (“certifying officers”) have conducted an evaluation of the effectiveness of the design and operation of our disclosure controls and procedures (as defined in Rules 13a-15(e) and 15d- 15(e) under the Exchange Act as of December 31, 2022. Based on this evaluation, our certifying officers concluded that our disclosure controls and procedures are effective as of December 31, 2022.
Rule 13a-15 of the Exchange Act requires that we conduct an evaluation of the effectiveness of our disclosure controls and procedures as of the end of the period covered by this Annual Report, and we have a disclosure policy in furtherance of the same. This evaluation is designed to ensure that all corporate disclosure is complete and accurate in all material respects. The evaluation is further designed to ensure that all information required to be disclosed in our SEC reports is accumulated and communicated to management to allow timely decisions regarding required disclosures and recorded, processed, summarized and reported within the time periods and in the manner specified in the SEC’s rules and forms. Any controls and procedures, no matter how well designed and operated, can provide only reasonable assurance of achieving the desired control objectives. Our Chief Executive Officer and Chief Financial Officer supervise and participate in this evaluation, and they are assisted by members of our Disclosure Committee. Our Disclosure Committee consists of our General Counsel, our Chief Accounting Officer, our Senior Officers of significant business lines and other select employees.
Changes in Internal Control Over Financial Reporting
There have been no changes in our internal control over financial reporting during the fiscal quarter ended December 31, 2022 that have materially affected, or are reasonably likely to materially affect, our internal control over financial reporting except as disclosed below.
Remediation of Prior Material Weaknesses Relating to Global Workplace Solutions EMEA
As previously reported, management identified that the company had material weaknesses in its internal control over financial reporting as of December 31, 2019, related to its GWS EMEA business, which continued through December 31, 2021. During the year ended December 31, 2022, management executed its remediation plan related to these material weaknesses, including (i) implementation of focused training, including mandatory On-the-Job-Training for revenue and receivables and journal entries; (ii) redesign and refinement of the processes and controls related to journal entries; and (iii) testing the operating effectiveness of the controls impacted by our remediation efforts. As a result of the measures described above, the previously disclosed material weaknesses that existed as of December 31, 2021 have been remediated as of December 31, 2022.
Item 9B. Other Information.
None.
Item 9C. Disclosure Regarding Foreign Jurisdictions that Prevent Inspections
None.
PART III
Item 10. Directors, Executive Officers and Corporate Governance.
The information under the headings “Elect Directors,” “Corporate Governance,” “Executive Management” and “Stock Ownership” in the definitive proxy statement for our 2023 Annual Meeting of Stockholders is incorporated herein by reference.
We are filing the certifications by the Chief Executive Officer and Chief Financial Officer required under Section 302 of the Sarbanes-Oxley Act as exhibits to this Annual Report.
Item 11. Executive Compensation.
The information contained under the headings “Corporate Governance,” “Compensation Discussion and Analysis” and “Executive Compensation” in the definitive proxy statement for our 2023 Annual Meeting of Stockholders is incorporated herein by reference.
Item 12. Security Ownership of Certain Beneficial Owners and Management and Related Stockholder Matters.
The information contained under the heading “Stock Ownership” in the definitive proxy statement for our 2023 Annual Meeting of Stockholders is incorporated herein by reference.
Equity Compensation Plan Information
The following table summarizes information about our equity compensation plans as of December 31, 2022. All outstanding awards relate to our Class A common stock.
| Number of Securities to be Issued upon Exercise of Outstanding Options, Warrants and Rights ( a ) | Weighted-average Exercise Price of Outstanding Options, Warrants and Rights ( b ) | Number of Securities Remaining Available for Future Issuance under Equity Compensation Plans (Excluding Securities Reflected in Column ( a )) ( c ) | |||||||||||||||
| Equity compensation plans approved by security holders (1) | 10,186,742 | $ | — | 10,087,368 | |||||||||||||
| Equity compensation plans not approved by security holders | — | — | — | ||||||||||||||
| Total | 10,186,742 | $ | — | 10,087,368 |
(1)Consists of restricted stock units (RSUs) issued under our 2019 Equity Incentive Plan (the 2019 Plan), our 2017 Equity Incentive Plan (the 2017 Plan) and our 2012 Equity Incentive Plan (the 2012 Plan). Our 2012 Plan terminated in May 2017 in connection with the adoption of the 2017 Plan. Our 2017 Plan terminated in May 2019 in connection with the adoption of the 2019 Plan. We cannot issue any further awards under both the 2012 Plan and the 2017 Plan.
In addition:
- The figures in the foregoing table include:
◦6,709,560 RSUs that are performance vesting in nature, with the figures in the table reflecting the maximum number of RSUs that may be issued if all performance-based targets are satisfied and
◦3,477,182 RSUs that are time vesting in nature.
Item 13. Certain Relationships and Related Transactions, and Director Independence.
The information contained under the headings “Elect Directors,” “Corporate Governance” and “Related-Party Transactions” in the definitive proxy statement for our 2023 Annual Meeting of Stockholders is incorporated herein by reference.
Item 14. Principal Accounting Fees and Services.
The information contained under the heading “Audit and Other Fees” in the definitive proxy statement for our 2023 Annual Meeting of Stockholders is incorporated herein by reference.
PART IV
Item 15. Exhibits and Financial Statement Schedules.
1.Financial Statements
See Index to Consolidated Financial Statements and Financial Statement Schedules located on page 55 of this report.
2.Financial Statement Schedules
See Schedule II located on page 124 of this report.
3.Exhibits
See Exhibit Index located on page 125 of this report.
Item 16. Form 10-K Summary.
Not applicable.
CBRE GROUP, INC.
SCHEDULE II – VALUATION AND QUALIFYING ACCOUNTS
(Dollars in thousands)
| Allowance for Doubtful Accounts | |||||
| Balance, December 31, 2019 | $ | 72,725 | |||
| Additions: Charges to expense | 47,240 | ||||
| Deductions: Write-offs, payments and other | 24,432 | ||||
| Balance, December 31, 2020 | 95,533 | ||||
| Additions: Charges to expense | 17,818 | ||||
| Deductions: Write-offs, payments and other | 15,763 | ||||
| Balance, December 31, 2021 | 97,588 | ||||
| Additions: Charges to expense | 16,893 | ||||
| Deductions: Write-offs, payments and other | 22,127 | ||||
| Balance, December 31, 2022 | $ | 92,354 |
EXHIBIT INDEX
| Incorporated by Reference | ||||||||||||||||||||
| Exhibit No. | Exhibit Description | Form | SEC File No. | Exhibit | Filing Date | Filed Herewith | ||||||||||||||
| 31.2 | Certification of Chief Financial Officer pursuant to Rule 13a-14(a) under the Securities Exchange Act of 1934, as adopted pursuant to §302 of the Sarbanes-Oxley Act of 2002 | X | ||||||||||||||||||
| 32 | Certifications of Chief Executive Officer and Chief Financial Officer pursuant to 18 U.S.C. §1350, as adopted pursuant to §906 of the Sarbanes-Oxley Act of 2002 | X | ||||||||||||||||||
| 101.INS | Inline XBRL Instance Document (the instance document does not appear in the Interactive Data File because its XBRL tags are embedded within the Inline XBRL document) | X | ||||||||||||||||||
| 101.SCH | Inline XBRL Taxonomy Extension Schema Document | X | ||||||||||||||||||
| 101.CAL | Inline XBRL Taxonomy Extension Calculation Linkbase Document | X | ||||||||||||||||||
| 101.DEF | Inline XBRL Taxonomy Extension Definition Linkbase Document | X | ||||||||||||||||||
| 101.LAB | Inline XBRL Taxonomy Extension Label Linkbase Document | X | ||||||||||||||||||
| 101.PRE | Inline XBRL Taxonomy Extension Presentation Linkbase Document | X | ||||||||||||||||||
| 104 | Cover Page Interactive Data File (formatted as Inline XBRL and contained in Exhibit 101) | X |
+ Denotes a management contract or compensatory arrangement
SIGNATURES
Pursuant to the requirements of Section 13 or 15(d) of the Securities Exchange Act of 1934, as amended, the registrant has duly caused this report to be signed on its behalf by the undersigned, thereunto duly authorized.
| CBRE GROUP, INC. | |||||
| Registrant | |||||
| Date: February 24, 2023 | /s/ ROBERT E. SULENTIC | ||||
| Robert E. Sulentic President and Chief Executive Officer |
Pursuant to the requirements of the Securities Exchange Act of 1934, as amended, this report has been signed below by the following persons on behalf of the registrant and in the capacities and on the dates indicated.
| Signature | Title | Date | ||||||||||||
| /s/ BRANDON B. BOZE | Chair of the Board | February 24, 2023 | ||||||||||||
| Brandon B. Boze | ||||||||||||||
| /s/ LINDSEY S. CAPLAN | Chief Accounting Officer | February 24, 2023 | ||||||||||||
| Lindsey S. Caplan | (Principal Accounting Officer) | |||||||||||||
| /s/ BETH F. COBERT | Director | February 24, 2023 | ||||||||||||
| Beth F. Cobert | ||||||||||||||
| /s/ EMMA E. GIAMARTINO | Chief Financial Officer | February 24, 2023 | ||||||||||||
| Emma E. Giamartino | (Principal Financial Officer) | |||||||||||||
| /s/ REGINALD H. GILYARD | Director | February 24, 2023 | ||||||||||||
| Reginald H. Gilyard | ||||||||||||||
| /s/ SHIRA D. GOODMAN | Director | February 24, 2023 | ||||||||||||
| Shira D. Goodman | ||||||||||||||
| /s/ E.M. BLAKE HUTCHESON | Director | February 24, 2023 | ||||||||||||
| E.M. Blake Hutcheson | ||||||||||||||
| /s/ CHRISTOPHER T. JENNY | Director | February 24, 2023 | ||||||||||||
| Christopher T. Jenny | ||||||||||||||
| /s/ GERARDO I. LOPEZ | Director | February 24, 2023 | ||||||||||||
| Gerardo I. Lopez | ||||||||||||||
| /s/ SUSAN MEANEY | Director | February 24, 2023 | ||||||||||||
| Susan Meaney | ||||||||||||||
| /s/ OSCAR MUNOZ | Director | February 24, 2023 | ||||||||||||
| Oscar Munoz | ||||||||||||||
| /s/ ROBERT E. SULENTIC | Director and President and Chief Executive Officer | February 24, 2023 | ||||||||||||
| Robert E. Sulentic | (Principal Executive Officer) | |||||||||||||
| /s/ SANJIV YAJNIK | Director | February 24, 2023 | ||||||||||||
| Sanjiv Yajnik |