 filings.tools
Item 5. Market for Registrant’s Common Equity, Related Stockholder Matters and Issuer Purchases of Equity Securities.
6K characters. Original on sec.gov · Markdown
Item 5. Market for Registrant’s Common Equity, Related Stockholder Matters and Issuer Purchases of Equity Securities.
Stock Price Information
Our Class A common stock has traded on the NYSE under the symbol “CBRE” since March 19, 2018. Prior to that, from June 10, 2004 to March 18, 2018, our Class A common stock traded on the NYSE under the symbol “CBG.”
As of February 15, 2024, there were 44 stockholders of record of our Class A common stock. This figure does not include beneficial owners who hold shares in nominee name.
Dividend Policy
We have not declared or paid any cash dividends on any class of our common stock since our inception on February 20, 2001. Any future determination to pay cash dividends will be at the discretion of our board of directors and will depend on our financial condition, acquisition or other opportunities to invest capital, results of operations, capital requirements and other factors that the board of directors deems relevant.
Recent Sales of Unregistered Securities
None.
Issuer Purchases of Equity Securities
Open market share repurchase activity during the three months ended December 31, 2023 was as follows (dollars in millions, except per share amounts):
| Period | Total Number of Shares Purchased | Average Price Paid per Share | Total Number of Shares Purchased as Part of Publicly Announced Plans or Programs | Approximate Dollar Value of Shares That May Yet Be Purchased Under the Plans or Programs (1) | |||||||||||||
| October 1, 2023 - October 31, 2023 | 204,786 | $ | 68.36 | 204,786 | |||||||||||||
| November 1, 2023 - November 30, 2023 | 80,468 | 69.51 | 80,468 | ||||||||||||||
| December 1, 2023 - December 31, 2023 | — | — | — | ||||||||||||||
| 285,254 | $ | 68.69 | 285,254 | $ | 1,466 |
**(1)**In November 2021, our board of directors authorized a program for the company to repurchase up to $2.0 billion of our Class A common stock over five years, effective November 19, 2021 (the 2021 program). In August 2022, our board of directors authorized an additional $2.0 billion under this program, bringing the total authorized amount under the 2021 program to a total of $4.0 billion. During the fourth quarter of 2023, we repurchased an aggregate of $19.6 million of our common stock under the 2021 program. The remaining $1.5 billion in the table represents the amount available to repurchase shares under the 2021 program as of December 31, 2023.
Our stock repurchase program does not obligate us to acquire any specific number of shares. Under this program, shares may be repurchased in privately negotiated and/or open market transactions, including under plans complying with Rule 10b5-1 under the Exchange Act. Our stock repurchases have been funded with cash on hand and we intend to continue funding future repurchases with existing cash. We may utilize our stock repurchase programs to continue offsetting the impact of our stock-based compensation program and on a more opportunistic basis if we believe our stock presents a compelling investment compared to other discretionary uses. The timing of any future repurchases and the actual amounts repurchased will depend on a variety of factors, including the market price of our common stock, general market and economic conditions and other factors.
Stock Performance Graph
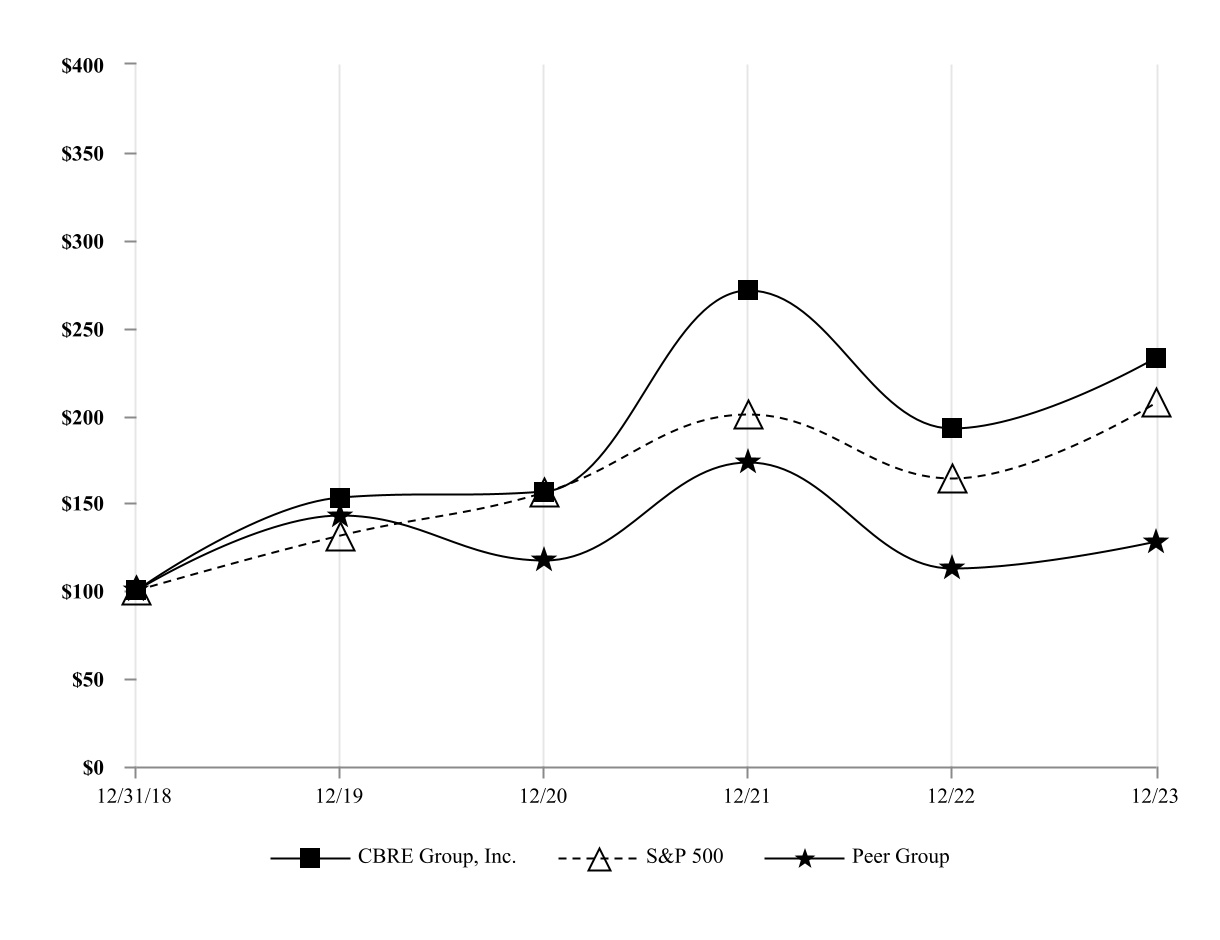
The graph below matches the 5 Year Cumulative Total Return of holders of CBRE Group, Inc.’s common stock with the cumulative total returns of the S&P 500 Index and a customized peer group of eight companies that includes: JLL, a global commercial real estate services company publicly traded in the U.S., as well as the following companies that have significant commercial real estate or real estate capital markets businesses within the U.S. or globally, that in each case are publicly traded in the U.S. or abroad: Colliers International Group Inc. (CIGI), Cushman & Wakefield plc (CWK), ISS A/S (ISS), Marcus & Millichap, Inc. (MMI), Newmark Group Inc. (NMRK), Savills plc (SVS.L), and Walker & Dunlop, Inc. (WD). These companies are or include divisions with business lines reasonably comparable to some or all of ours, and which represent our current primary competitors.
The graph assumes that the value of the investment in our common stock, in each index, and in the peer group (including reinvestment of dividends) was $100 on December 31, 2018 and tracks it through December 31, 2023. Our stock price performance shown in the graph below is not necessarily indicative of future stock price performance.
COMPARISON OF 5 YEAR CUMULATIVE TOTAL RETURN (1)
AMONG CBRE GROUP, INC., THE S&P 500 INDEX (2),
AND PEER GROUP
| 12/31/18 | 12/19 | 12/20 | 12/21 | 12/22 | 12/23 | |||||||||||||||
| CBRE Group, Inc. | $ | 100.00 | $ | 153.07 | $ | 156.64 | $ | 271.00 | $ | 192.21 | $ | 232.49 | ||||||||
| S&P 500 | 100.00 | 131.49 | 155.68 | 200.37 | 164.08 | 207.21 | ||||||||||||||
| Peer Group | 100.00 | 142.68 | 117.35 | 172.95 | 112.48 | 127.72 |
(1)$100 invested on December 31, 2018 in stock or index-including reinvestment of dividends. Fiscal year ending December 31.
(2)Copyright© 2024 Standard & Poor’s, a division of S&P Global. All rights reserved.
This graph shall not be deemed incorporated by reference by any general statement incorporating by reference this Annual Report into any filing under the Securities Act or the Exchange Act, except to the extent that we specifically incorporate this information by reference therein, and shall not otherwise be deemed filed under the Securities Act or the Exchange Act.
Previous: Item 4. Mine Safety Disclosures. · Next: Item 6. [Reserved]