 filings.tools
Crown Castle 10-Q 2023-03-31
Filed 2023-05-03. 7 sections, 138K characters. Original on sec.gov · Markdown · JSON
Cover and table of contents
UNITED STATES
SECURITIES AND EXCHANGE COMMISSION
Washington, D.C. 20549
FORM 10-Q
| ☒ | QUARTERLY REPORT PURSUANT TO SECTION 13 OR 15(d) OF THE SECURITIES EXCHANGE ACT OF 1934 |
For the quarterly period ended March 31, 2023
OR
| ☐ | TRANSITION REPORT PURSUANT TO SECTION 13 OR 15(d) OF THE SECURITIES EXCHANGE ACT OF 1934 |
For the transition period to
Commission File Number 001-16441

CROWN CASTLE INC.
(Exact name of registrant as specified in its charter)
| Delaware | 76-0470458 | ||||||||||
| (State or other jurisdiction of incorporation or organization) | (I.R.S. Employer Identification No.) | ||||||||||
8020 Katy Freeway, Houston, Texas 77024
(Address of principal executives office) (Zip Code)
(713) 570-3000
(Registrant's telephone number, including area code)
Securities registered pursuant to Section 12(b) of the Act:
| Title of each class | Trading Symbol(s) | Name of each exchange on which registered | |||||||||
| Common Stock, $0.01 par value | CCI | New York Stock Exchange |
Indicate by check mark whether the registrant (1) has filed all reports required to be filed by Section 13 or 15(d) of the Securities Exchange Act of 1934 during the preceding 12 months (or for such shorter period that the registrant was required to file such reports), and (2) has been subject to such filing requirements for the past 90 days. Yes ☒ No ☐
Indicate by check mark whether the registrant has submitted electronically every Interactive Data File required to be submitted pursuant to Rule 405 of Regulation S-T (§232.405 of this chapter) during the preceding 12 months (or for such shorter period that the registrant was required to submit such files). Yes ☒ No ☐
Indicate by check mark whether the registrant is a large accelerated filer, an accelerated filer, a non-accelerated filer, a smaller reporting company, or an emerging growth company. See the definitions of "large accelerated filer," "accelerated filer," "smaller reporting company" and "emerging growth company" in Rule 12b-2 of the Exchange Act.
| Large accelerated filer | ☒ | Accelerated filer | ☐ | |||||||||||||||||
| Non-accelerated filer | ☐ | Smaller reporting company | ☐ | |||||||||||||||||
| Emerging growth company | ☐ | |||||||||||||||||||
| If an emerging growth company, indicate by check mark if the registrant has elected not to use the extended transition period for complying with any new or revised financial accounting standards provided pursuant to Section 13(a) of the Exchange Act. ☐ |
Indicate by check mark whether the registrant is a shell company (as defined in Rule 12b-2 of the Exchange Act). Yes ☐ No ☒
Number of shares of common stock outstanding at May 1, 2023: 433,671,293
CROWN CASTLE INC. AND SUBSIDIARIES
INDEX
Cautionary Language Regarding Forward-Looking Statements
This Quarterly Report on Form 10-Q ("Form 10-Q") contains forward-looking statements that are based on our management's expectations as of the filing date of this report with the Securities and Exchange Commission ("SEC"). Statements that are not historical facts are hereby identified as forward-looking statements. In addition, words such as "estimate," "anticipate," "project," "plan," "intend," "believe," "expect," "likely," "predicted," "positioned," "continue," "target," "seek," "focus" and any variations of these words and similar expressions are intended to identify forward-looking statements.
Examples of forward-looking statements include our full year 2023 outlook and plans, projections and estimates regarding (1) the value of our business model and demand for our communications infrastructure, (2) the growth of the U.S. market for shared communications infrastructure, (3) growth in the communications infrastructure industry, (4) demand for data and factors driving such demand, (5) the duration of our construction projects, (6) tenants' investment in wireless networks, (7) use of high-bandwidth applications, (8) our ability to service our debt and comply with debt covenants, (9) the level of commitment under our debt instruments, (10) our ability to remain qualified as a real estate investment trust ("REIT"), (11) sources and uses of liquidity, (12) impact to our financial results from the Sprint Cancellations (as defined below), (13) drivers of cash flow growth, (14) our competitive advantage, (15) our dividends, including timing, amount, growth, targets, payment or tax characterization, (16) the timing of small cell deployments, (17) discretionary capital expenditures and expansion of our business and (18) impact of interest rate increases. All future dividends are subject to declaration by our board of directors.
Such forward-looking statements should, therefore, be considered in light of various risks, uncertainties and assumptions, including prevailing market conditions, risk factors described in "Item 1A. Risk Factors" of the Annual Report on Form 10-K for the fiscal year ended December 31, 2022 ("2022 Form 10-K") and other factors. Should one or more of these risks or uncertainties materialize, or should underlying assumptions prove incorrect, actual results may vary materially from those expected.
Our filings with the SEC are available through the SEC website at www.sec.gov or through our investor relations website at investor.crowncastle.com. We use our investor relations website to disclose information about us that may be deemed to be material. We encourage investors, the media and others interested in us to visit our investor relations website from time to time to review up-to-date information or to sign up for e-mail alerts to be notified when new or updated information is posted on the site.
Interpretation
As used herein, the term "including," and any variation thereof, means "including without limitation." The use of the word "or" herein is not exclusive. Unless this Form 10-Q indicates otherwise or the context otherwise requires, the terms "we," "our," "our company," "the company" or "us" as used in this Form 10-Q refer to Crown Castle Inc. ("CCI") and its predecessor (organized in 1995), as applicable, each a Delaware corporation, and their subsidiaries. Additionally, unless the context suggests otherwise, references to "U.S." are to the United States of America and Puerto Rico, collectively. Capitalized terms used but not defined in this Form 10-Q have the same meaning given to them in the 2022 Form 10-K.
PART I—FINANCIAL INFORMATION
Item 1. FINANCIAL STATEMENTS
CROWN CASTLE INC. AND SUBSIDIARIES
CONDENSED CONSOLIDATED BALANCE SHEET (Unaudited)
(Amounts in millions, except par values)
| March 31, 2023 | December 31, 2022 | ||||||||||
| ASSETS | |||||||||||
| Current assets: | |||||||||||
| Cash and cash equivalents | $ | 187 | $ | 156 | |||||||
| Restricted cash | 196 | 166 | |||||||||
| Receivables, net | 565 | 593 | |||||||||
| Prepaid expenses | 159 | 102 | |||||||||
| Current portion of deferred site rental receivables | 125 | 127 | |||||||||
| Other current assets | 93 | 73 | |||||||||
| Total current assets | 1,325 | 1,217 | |||||||||
| Deferred site rental receivables | 2,040 | 1,954 | |||||||||
| Property and equipment, net of accumulated depreciation of $13,377 and $13,071, respectively | 15,492 | 15,407 | |||||||||
| Operating lease right-of-use assets | 6,482 | 6,526 | |||||||||
| Goodwill | 10,085 | 10,085 | |||||||||
| Other intangible assets, net | 3,496 | 3,596 | |||||||||
| Other assets, net | 134 | 136 | |||||||||
| Total assets | $ | 39,054 | $ | 38,921 | |||||||
| LIABILITIES AND EQUITY | |||||||||||
| Current liabilities: | |||||||||||
| Accounts payable | $ | 233 | $ | 236 | |||||||
| Accrued interest | 132 | 183 | |||||||||
| Deferred revenues | 721 | 736 | |||||||||
| Other accrued liabilities | 300 | 407 | |||||||||
| Current maturities of debt and other obligations | 819 | 819 | |||||||||
| Current portion of operating lease liabilities | 330 | 350 | |||||||||
| Total current liabilities | 2,535 | 2,731 | |||||||||
| Debt and other long-term obligations | 21,513 | 20,910 | |||||||||
| Operating lease liabilities | 5,856 | 5,881 | |||||||||
| Other long-term liabilities | 1,927 | 1,950 | |||||||||
| Total liabilities | 31,831 | 31,472 | |||||||||
| Commitments and contingencies (note 8) | |||||||||||
| Stockholders' equity: | |||||||||||
| Common stock, $0.01 par value; 1,200 shares authorized; shares issued and outstanding: March 31, 2023—434 and December 31, 2022—433 | 4 | 4 | |||||||||
| Additional paid-in capital | 18,154 | 18,116 | |||||||||
| Accumulated other comprehensive income (loss) | (6) | (5) | |||||||||
| Dividends/distributions in excess of earnings | (10,929) | (10,666) | |||||||||
| Total equity | 7,223 | 7,449 | |||||||||
| Total liabilities and equity | $ | 39,054 | $ | 38,921 |
See notes to condensed consolidated financial statements.
CROWN CASTLE INC. AND SUBSIDIARIES
CONDENSED CONSOLIDATED STATEMENT OF OPERATIONS AND
COMPREHENSIVE INCOME (LOSS) (Unaudited)
(Amounts in millions, except per share amounts)
| Three Months Ended March 31, | |||||||||||||||||||||||
| 2023 | 2022 | ||||||||||||||||||||||
| Net revenues: | |||||||||||||||||||||||
| Site rental | $ | 1,624 | $ | 1,576 | |||||||||||||||||||
| Services and other | 149 | 166 | |||||||||||||||||||||
| Net revenues | 1,773 | 1,742 | |||||||||||||||||||||
| Operating expenses: | |||||||||||||||||||||||
| Costs of operations:(a) | |||||||||||||||||||||||
| Site rental | 415 | 396 | |||||||||||||||||||||
| Services and other | 104 | 113 | |||||||||||||||||||||
| Selling, general and administrative | 195 | 181 | |||||||||||||||||||||
| Asset write-down charges | — | 14 | |||||||||||||||||||||
| Depreciation, amortization and accretion | 431 | 420 | |||||||||||||||||||||
| Total operating expenses | 1,145 | 1,124 | |||||||||||||||||||||
| Operating income (loss) | 628 | 618 | |||||||||||||||||||||
| Interest expense and amortization of deferred financing costs, net | (202) | (164) | |||||||||||||||||||||
| Gains (losses) on retirement of long-term obligations | — | (26) | |||||||||||||||||||||
| Interest income | 2 | — | |||||||||||||||||||||
| Other income (expense) | (3) | (1) | |||||||||||||||||||||
| Income (loss) before income taxes | 425 | 427 | |||||||||||||||||||||
| Benefit (provision) for income taxes | (7) | (6) | |||||||||||||||||||||
| Net income (loss) | 418 | 421 | |||||||||||||||||||||
| Other comprehensive income (loss): | |||||||||||||||||||||||
| Foreign currency translation adjustments | (1) | 1 | |||||||||||||||||||||
| Total other comprehensive income (loss) | (1) | 1 | |||||||||||||||||||||
| Comprehensive income (loss) | $ | 417 | $ | 422 | |||||||||||||||||||
| Net income (loss), per common share: | |||||||||||||||||||||||
| Basic | $ | 0.97 | $ | 0.97 | |||||||||||||||||||
| Diluted | $ | 0.97 | $ | 0.97 | |||||||||||||||||||
| Weighted-average common shares outstanding: | |||||||||||||||||||||||
| Basic | 433 | 433 | |||||||||||||||||||||
| Diluted | 434 | 434 |
(a)Exclusive of depreciation, amortization and accretion shown separately.
See notes to condensed consolidated financial statements.
CROWN CASTLE INC. AND SUBSIDIARIES
CONDENSED CONSOLIDATED STATEMENT OF CASH FLOWS (Unaudited)
(In millions of dollars)
| Three Months Ended March 31, | |||||||||||
| 2023 | 2022 | ||||||||||
| Cash flows from operating activities: | |||||||||||
| Net income (loss) | $ | 418 | $ | 421 | |||||||
| Adjustments to reconcile net income (loss) to net cash provided by (used for) operating activities: | |||||||||||
| Depreciation, amortization and accretion | 431 | 420 | |||||||||
| (Gains) losses on retirement of long-term obligations | — | 26 | |||||||||
| Amorti |
Showing the first 8K of 63K characters. Open the full section
Item 2. MANAGEMENT'S DISCUSSION AND ANALYSIS OF FINANCIAL CONDITION AND RESULTS OF OPERATIONS
The following discussion should be read in conjunction with the response to Part I, Item 1 of this report and the consolidated financial statements of the Company including the related notes and "Item 7. Management's Discussion and Analysis of Financial Condition and Results of Operations" ("MD&A") included in the 2022 Form 10-K.
General Overview
Overview
We own, operate and lease shared communications infrastructure that is geographically dispersed throughout the U.S., including (1) more than 40,000 towers and other structures, such as rooftops (collectively, "towers"), (2) approximately 120,000 small cells on air or under contract and (3) approximately 85,000 route miles of fiber primarily supporting small cells and fiber solutions.
Our towers have a significant presence in each of the top 100 basic trading areas ("BTAs"), and the majority of our small cells and fiber assets are located in major metropolitan areas, including a presence within every major U.S. market. Site rental revenues represented 92% of our first quarter 2023 consolidated net revenues, of which 67% and 33% were from our Towers segment and Fiber segment, respectively. Within our Fiber segment, 71% and 29% of our first quarter 2023 Fiber site rental revenues related to fiber solutions and small cells, respectively. See note 10 to our condensed consolidated financial statements*.* The vast majority of our site rental revenues are of a recurring nature and are derived from long-term tenant contracts.
Strategy
As a leading provider of shared communications infrastructure in the U.S., our strategy is to create long-term stockholder value via a combination of (1) growing cash flows generated from our existing portfolio of communications infrastructure, (2) returning a meaningful portion of our cash generated by operating activities to our common stockholders in the form of dividends and (3) investing capital efficiently to grow cash flows and long-term dividends per share. Our strategy is based, in part, on our belief that the U.S. is the most attractive market for shared communications infrastructure investment with the greatest long-term growth potential. We measure our efforts to create "long-term stockholder value" by the combined payment of dividends to stockholders and growth in our per-share results. The key elements of our strategy are to:
-
Grow cash flows from our existing communications infrastructure. We are focused on maximizing the recurring site rental cash flows generated from providing our tenants with long-term access to our shared infrastructure assets, which we believe is the core driver of value for our stockholders. Tenant additions or modifications of existing tenant equipment (collectively, "tenant additions") enable our tenants to expand coverage and capacity in order to meet increasing demand for data while generating high incremental returns for our business. We believe our product offerings of towers and small cells through our shared communications infrastructure model provide a comprehensive, efficient and cost-effective solution for our wireless tenants' growing networks. Additionally, we believe our ability to share our fiber assets across multiple tenants to both deploy small cells and offer fiber solutions allows us to generate cash flows and increase stockholder return.
-
Return cash generated by operating activities to common stockholders in the form of dividends. We believe that distributing a meaningful portion of our cash generated by operating activities appropriately provides common stockholders with increased certainty for a portion of expected long-term stockholder value while still allowing us to retain sufficient flexibility to invest in our business and deliver growth. We believe this decision reflects the translation of the high-quality, long-term contractual cash flows of our business into stable capital returns to common stockholders.
-
Invest capital efficiently to grow cash flows and long-term dividends per share. In addition to adding tenants to existing communications infrastructure, we seek to invest our available capital, including the net cash generated by our operating activities and external financing sources, in a manner that will increase long-term stockholder value on a risk-adjusted basis. These investments include constructing and acquiring new communications infrastructure that we expect will generate future cash flow growth and attractive long-term returns by adding tenants to those assets over time. Our historical investments have included the following (in no particular order):
◦construction of towers, fiber and small cells;
◦acquisitions of towers, fiber and small cells;
◦acquisitions of land interests (which primarily relate to land assets under towers);
◦improvements and structural enhancements to our existing communications infrastructure;
◦purchases of shares of our common stock from time to time; and
◦purchases, repayments or redemptions of our debt.
Our strategy to create long-term stockholder value is based on our belief that there will be considerable future demand for our communications infrastructure based on the location of our assets and the rapid and continuing growth in the demand for data. We believe that such demand for our communications infrastructure will continue, will result in growth of our cash flows due to tenant additions on our existing communications infrastructure, and will create other growth opportunities for us, such as demand for newly constructed or acquired communications infrastructure, as described above. Further, we seek to augment the long-term value creation associated with growing our recurring site rental cash flows by offering certain ancillary site development and installation services within our Towers segment.
Highlights of Business Fundamentals and Results
- We operate as a REIT for U.S. federal income tax purposes
◦As a REIT, we are generally entitled to a deduction for dividends that we pay and, therefore, are not subject to U.S. federal corporate income tax on our net taxable income that is currently distributed to our stockholders.
◦To remain qualified and be taxed as a REIT, we will generally be required to annually distribute to our stockholders at least 90% of our REIT taxable income, after the utilization of our NOLs (determined without regard to the dividends paid deduction and excluding net capital gain).
◦See note 6 to our condensed consolidated financial statements for further discussion of our REIT status.
- Potential growth resulting from the increasing demand for data
◦We expect existing and potential new tenant demand for our communications infrastructure will result from (1) new technologies, (2) increased usage of mobile entertainment, mobile internet, and machine-to-machine applications, (3) adoption of other emerging and embedded wireless devices (including smartphones, laptops, tablets, wearables and other devices), (4) increasing smartphone penetration, (5) wireless carrier focus on expanding both network quality and capacity, including the use of both towers and small cells, (6) the adoption of other bandwidth-intensive applications (such as cloud services and video communications), (7) the availability of additional spectrum and (8) increased government initiatives to support connectivity throughout the U.S.
◦We expect U.S. wireless carriers will continue to focus on improving network quality and expanding capacity (including through 5G initiatives) by utilizing a combination of towers and small cells. We believe our product offerings of towers and small cells provide a comprehensive solution to our wireless tenants' growing communications infrastructure needs.
◦We expect organizations will continue to increase the usage of high-bandwidth applications that will require the utilization of more fiber infrastructure and fiber solutions, such as those we provide.
◦Within our Fiber segment, we are able to generate growth and returns for our stockholders by deploying our fiber for both small cells and fiber solutions tenants.
◦Tenant additions on our existing communications infrastructure are achieved at a low incremental operating cost, delivering high incremental returns.
-
Substantially all of our communications infrastructure can accommodate additional tenancy, either as currently constructed or with appropriate modifications.
-
Investing capital efficiently to grow long-term dividends per share (see also "Item 2. MD&A—General Overview—Strategy")
◦We had discretionary capital expenditures of $326 million for the three months ended March 31, 2023, predominately resulting from the construction of new communications infrastructure and improvements to existing communications infrastructure in order to support additional tenants.
◦We expect to continue to construct and acquire new communications infrastructure based on our tenants' needs and generate attractive long-term returns by adding additional tenants over time.
- Site rental revenues under long-term tenant contracts
◦Our wireless tenant contracts have initial terms of five to 15 years, with contractual escalators and multiple renewal periods of five to 10 years each, exercisable at the option of the tenant.
◦Our fiber solutions tenant contracts' initial terms generally vary between three to 20 years.
◦As of March 31, 2023, our weighted-average remaining term was approximately six years, exclusive of renewals exercisable at the tenants' option, currently representing approximately $39.4 billion of expected future cash inflows.
- Majority of our revenues from large wireless carriers
◦For the three months ended March 31, 2023, approximately three-fourths of our site rental revenues were derived from T-Mobile, AT&T and Verizon Wireless.
- Majority of land under our towers under long-term control
◦For the three months ended March 31, 2023, approximately 90% of our towers site rental gross margin and approximately 80% of our towers site rental gross margin was derived from towers located on land that we own or control for greater than 10 and 20 years, respectively. The aforementioned percentages include towers located on land that is owned, including through fee interests and perpetual easements, which represented approximately 40% of our towers site rental gross margin.
-
Majority of our fiber assets are located in major metropolitan areas and are on public rights-of-way
-
Minimal sustaining capital expenditure requirements
◦For the three months ended March 31, 2023, sustaining capital expenditures represented approximately 1% of net revenues.
- Debt portfolio with long-dated maturities extended over multiple years, with the vast majority of such debt having a fixed rate (see note 4 to our condensed consolidated financial statements and "Item 3. Quantitative and Qualitative Disclosures About Market Risk" for a further discussion of our debt)
◦As of March 31, 2023, after giving effect to our $600 million aggregate principal amount of 4.800% senior unsecured notes due 2028 and $750 million aggregate principal amount of 5.100% senior unsecured notes due 2033 (collectively, "April 2023 Senior Notes") and the use of proceeds therefrom, our outstanding debt had a weighted-average interest rate of 3.7% and weighted-average maturity of approximately nine years (assuming anticipated repayment dates on certain debt).
◦As of March 31, 2023, after giving effect to our April 2023 Senior Notes offering and the use of proceeds therefrom, 91% of our debt had fixed rate coupons.
◦Our debt service coverage and leverage ratios are within their respective financial maintenance covenants.
- During 2023, we completed the following financing activities (see note 4 to our condensed consolidated financial statements)
◦In January 2023, we issued $1.0 billion aggregate principal amount of 5.000% senior unsecured notes due 2028 ("January 2023 Senior Notes"). We used the net proceeds from the January 2023 Senior Notes offering to repay a portion of the outstanding indebtedness under the 2016 Revolver and pay related fees and expenses.
◦In April 2023, we issued the April 2023 Senior Notes. We used the net proceeds from the April 2023 Senior Notes offering to repay a portion of the outstanding indebtedness under the 2016 Revolver and pay related fees and expenses.
- Significant cash flows from operations
◦Net cash provided by operating activities was $606 million for the three months ended March 31, 2023.
◦In addition to the positive impact of contractual escalators, we expect to grow our core business of providing access to our communications infrastructure as a result of future anticipated additional demand for our communications infrastructure.
- Returning cash flows provided by operations to stockholders in the form of dividends
◦During the first quarter of 2023, we paid a common stock dividend of $1.565 per share, totaling approximately $686 million.
◦We currently expect our common stock dividends over the next 12 months to be a cumulative amount of at least $6.26 per share, or an aggregate amount of approximately $2.7 billion.
◦Over time, we expect to increase our dividend per share generally commensurate with our growth in cash flows. Any future common stock dividends are subject to declaration by our board of directors. See notes 9 and 12 to our condensed consolidated financial statements for further information regarding our common stock and dividends.
Outlook Highlights
The following are certain highlights of our full year 2023 outlook that impact our business fundamentals described above.
- We expect that, when compared to full year 2022, our full year 2023 site rental revenues growth will be positively impacted by tenant additions as large wireless carriers and fiber solutions tenants continue to focus on meeting the increasing demand for data.
◦We expect that our Fiber segment site rental revenues will benefit from payments to satisfy remaining rental obligations for certain canceled Sprint leases, net of estimated non-renewals, as a result of the T-Mobile US, Inc. and Sprint network consolidation ("Sprint Cancellations").
- We expect to continue to invest a significant amount of our available capital in the form of discretionary capital expenditures for 2023 based on the anticipated returns on such discretionary investments.
◦We expect that our discretionary capital expenditures will increase as we accelerate the pace of small cell deployments.
- We also expect sustaining capital expenditures of approximately 2% of net revenues for full year 2023, consistent with historical annual levels.
See also "Item 3. Quantitative and Qualitative Disclosures About Market Risk" for a discussion of our interest rate risks.
Results of Operations
The following discussion of our results of operations should be read in conjunction with our condensed consolidated financial statements and the 2022 Form 10-K.
The following discussion of our results of operations is based on our condensed consolidated financial statements prepared in accordance with GAAP, which requires us to make estimates and judgments that affect the reported amounts (see "Item 2. MD&A—Accounting and Reporting Matters—Critical Accounting Policies and Estimates" and note 2 to our consolidated financial statements in the 2022 Form 10-K). See "Item 2. MD&A—Accounting and Reporting Matters—Non-GAAP and Segment Financial Measures" for a discussion of our use of (1) segment site rental gross margin, (2) segment services and other gross margin, (3) segment operating profit (loss), including their respective definitions, and (4) Adjusted EBITDA, including its definition and a reconciliation to net income (loss).
Our operating segments consist of (1) Towers and (2) Fiber. See note 10 to our condensed consolidated financial statements for further discussion of our operating segments.
Highlights of our results of operations for the three months ended March 31, 2023 and 2022 are depicted below.
| (In millions of dollars) | Three Months Ended March 31, | ||||||||||||||||||||||
| 2023 | 2022 | $ Change | % Change | ||||||||||||||||||||
| Site rental revenues: | |||||||||||||||||||||||
| Towers site rental revenues | $1,081 | $1,075 | +$6 | +1% | |||||||||||||||||||
| Fiber site rental revenues | $543 | $501 | +$42 | +8% | |||||||||||||||||||
| Total site rental revenues | $1,624 | $1,576 | +$48 | +3% | |||||||||||||||||||
| Segment site rental gross margin: | |||||||||||||||||||||||
| Towers site rental gross margin(a) | $847 | $850 | $(3) | —% | |||||||||||||||||||
| Fiber site rental gross margin(a) | $371 | $339 | +$32 | +9% | |||||||||||||||||||
| Segment services and other gross margin: | |||||||||||||||||||||||
| Towers services and other gross margin(a) | $47 | $54 | $(7) | (13)% | |||||||||||||||||||
| Fiber services and other gross margin(a) | $1 | $1 | $— | —% | |||||||||||||||||||
| Segment operating profit (loss): | |||||||||||||||||||||||
| Towers operating profit (loss)(a) | $863 | $876 | $(13) | (1)% | |||||||||||||||||||
| Fiber operating profit (loss)(a) | $323 | $293 | +$30 | +10% | |||||||||||||||||||
| Net income (loss) | $418 | $421 | $(3) | (1)% | |||||||||||||||||||
| Adjusted EBITDA(b) | $1,104 | $1,095 | +$9 | +1% |
(a)See note 10 to our condensed consolidated financial statements and "Item 2. MD&A—Accounting and Reporting Matters—Non-GAAP and Segment Financial Measures" for further discussion of our definitions of segment site rental gross margin, segment services and other gross margin and segment operating profit (loss).
(b)See reconciliation of this non-GAAP financial measure to net income (loss) and definition included in "Item 2. MD&A—Accounting and Reporting Matters—Non-GAAP and Segment Financial Measures."
Site rental revenues grew $48 million, or 3%, for the three months ended March 31, 2023 compared to the three months ended March 31, 2022. This growth was predominately comprised of the factors depicted in the chart below:
(In millions of dollars)
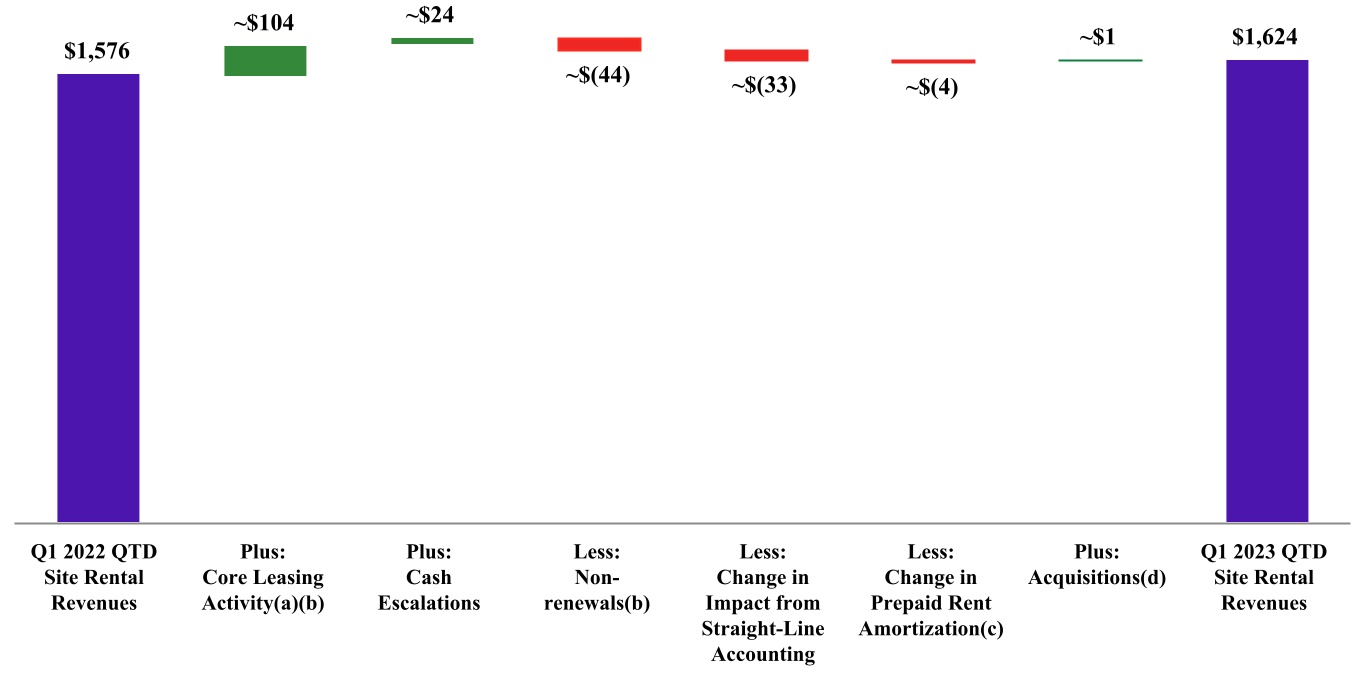
(a)Represents site rental revenues growth from tenant additions across our entire portfolio and renewals or extensions of tenant contracts, exclusive of the impacts from both straight-line accounting and amortization of prepaid rent in accordance with GAAP.
(b)Core leasing activity and non-renewals include $48 million and $2 million, respectively, of payments received from and non-renewals associated with Sprint Cancellations, respectively.
(c)Prepaid rent amortization includes amortization of upfront payments received from long-term tenants and other deferred credits.
(d)Represents the contribution from recent acquisitions until the one-year anniversary of such acquisitions.
Towers site rental revenues for the first quarter of 2023 were $1.1 billion and increased by $6 million, or 1%, from $1.1 billion during the same period in the prior year. Towers site rental revenues were impacted by the following items, inclusive of straight-line accounting: tenant additions across our entire portfolio, renewals or extensions of tenant contracts, escalations and non-renewals of tenant contracts. Tenant additions were influenced by our tenants' ongoing efforts to improve network quality and capacity.
Fiber site rental revenues for the first quarter of 2023 were $543 million and increased by $42 million, or 8%, from $501 million during the same period in the prior year. Fiber site rental revenues were predominately impacted by $48 million of payments related to the Sprint Cancellations.
Towers site rental gross margin was $847 million in the first quarter of 2023 compared to $850 million in the first quarter of 2022. The decrease was related to the previously-mentioned 1% increase in Towers site rental revenues being fully offset by the increase in site rental costs of operations. Fiber site rental gross margin was $371 million in the first quarter of 2023 compared to $339 million in the first quarter of 2022. The increase in Fiber site rental gross margin was predominately related to the previously-mentioned 8% increase in Fiber site rental revenues.
Towers services and other gross margin was $47 million for the first quarter of 2023 and decreased by $7 million from $54 million during the same period in the prior year, which is a reflection of the lower volume of activity from carriers' network enhancements and the volume and mix of services and other work. Our services and other offerings are of a variable nature as these revenues are not under long-term tenant contracts.
Selling, general and administrative expenses for the first quarter of 2023 were $195 million and increased by $14 million, or 8%, from $181 million during the same period in the prior year. This increase was primarily related to certain expenses, including travel and facilities, returning to their pre-pandemic levels following our return to the office in February 2022.
Towers operating profit (loss) for the first quarter of 2023 decreased by $13 million, or 1%, from the same period in the prior year. The decrease in Towers operating profit (loss) was primarily related to the previously-mentioned decreases in both Towers site rental gross margin and Towers services and other gross margin.
Fiber operating profit (loss) for the first quarter of 2023 increased by $30 million, or 10%, from the same period in the prior year. The increase in Fiber operating profit (loss) was primarily related to the previously-mentioned increase in Fiber site rental gross margin.
Depreciation, amortization and accretion was approximately $431 million for first quarter of 2023 and increased by $11 million, or 3% during the same period in the prior year. This increase predominately resulted from a corresponding increase in our gross property and equipment due to capital expenditures.
Interest expense and amortization of deferred financing costs, net were $202 million for the first quarter of 2023 and increased by $38 million, or 23%, from $164 million during the same period in the prior year. The increase predominately resulted from an increase in the variable interest rate on our 2016 Term Loan A, 2016 Revolver and outstanding Commercial Paper Notes, as well as an increase in our outstanding indebtedness due to the financing of our discretionary capital expenditures. See note 4 to our condensed consolidated financial statements for a further discussion of our debt and "Item 3. Quantitative and Qualitative Disclosures About Market Risk" for a further discussion of our interest rate exposure.
For the first quarter of 2023 and 2022, the effective tax rate differs from the federal statutory rate predominately due to our REIT status, including the dividends paid deduction. See note 6 to our condensed consolidated financial statements and also note 9 to our consolidated financial statements in the 2022 Form 10-K.
Net income (loss) was $418 million during the first quarter of 2023 compared to $421 million during the first quarter of 2022. The decrease was predominately related to an increase in expenses, including (1) selling, general and administrative expenses, and (2) depreciation, amortization and accretion and (3) interest expense and amortization of deferred financing costs, net, partially offset by the previously-mentioned increase in Fiber operating profit (loss).
Adjusted EBITDA increased $9 million, or 1%, from the first quarter of 2022 to the first quarter of 2023, reflecting the previously-mentioned increase in Fiber operating profit (loss).
Liquidity and Capital Resources
Overview
General. Our core business generates revenues under long-term tenant contracts (see "Item 2. MD&A—General Overview—Overview") from (1) the largest U.S. wireless carriers and (2) fiber solutions tenants. As a leading provider of shared communications infrastructure in the U.S., our strategy is to create long-term stockholder value via a combination of (1) growing cash flows generated from our portfolio of communications infrastructure, (2) returning a meaningful portion of our cash generated by operating activities to our stockholders in the form of dividends, and (3) investing capital efficiently to grow cash flows and long-term dividends per share. Our strategy is based, in part, on our belief that the U.S. is the most attractive market for shared communications infrastructure investment with the greatest long-term growth potential. We measure our efforts to create "long-term stockholder value" by the combined payment of dividends to stockholders and growth in our per share results.
We have engaged, and expect to continue to engage, in discretionary investments that we believe will maximize long-term stockholder value. Our historical discretionary investments include (in no particular order): constructing communications infrastructure, acquiring communications infrastructure, acquiring land interests (which primarily relate to land assets under towers), improving and structurally enhancing our existing communications infrastructure, purchasing shares of our common stock, and purchasing, repaying, or redeeming our debt. We have recently spent, and expect to continue to spend, a significant percentage of our discretionary investments on the construction of small cells and fiber. We seek to fund our discretionary investments with both cash generated by operating activities and cash available from financing capacity, such as the use of our availability under our 2016 Revolver, issuances under our CP Program, debt financings and issuances of equity or equity-related securities, including under our 2021 ATM Program.
We seek to maintain a capital structure that we believe drives long-term stockholder value and optimizes our weighted-average cost of capital. We target a leverage ratio of approximately five times Adjusted EBITDA, subject to various factors, such as the availability and cost of capital and the potential long-term return on our discretionary investments. We may choose to increase or decrease our leverage from this target for various periods of time. Our contractual debt maturities over the next 12 months consist of (1) Commercial Paper Notes, of which we had $577 million outstanding as of May 1, 2023, (2) $750 million aggregate principal amount of 3.150% senior unsecured notes ("3.150% Senior Notes") and (3) principal payments on certain outstanding debt. Amounts available under our CP Program may be repaid and re-issued from time to time and we intend to maintain available commitments under our 2016 Revolver in an amount at least equal to the amount of Commercial Paper Notes outstanding.
We operate as a REIT for U.S. federal income tax purposes. We expect to continue to pay minimal cash income taxes as a result of our REIT status and our NOLs. See note 6 to our condensed consolidated financial statements and also the 2022 Form 10-K.
Liquidity Position. The following is a summary of our capitalization and liquidity position as of March 31, 2023, after giving effect to our April 2023 Senior Notes offering and the use of the net proceeds therefrom. See "Item 3. Quantitative and Qualitative Disclosures About Market Risk" and note 4 to our condensed consolidated financial statements for additional information regarding our debt as well as note 9 to our condensed consolidated financial statements for additional information regarding our 2021 ATM Program.
| (In millions of dollars) | |||||
| Cash, cash equivalents, and restricted cash(a) | $ | 388 | |||
| Undrawn 2016 Revolver availability(b) | 6,862 | ||||
| Debt and other long-term obligations (current and non-current) | 22,332 | ||||
| Total equity | 7,223 |
(a)Inclusive of $5 million included within "Other assets, net" on our condensed consolidated balance sheet.
(b)Availability at any point in time is subject to certain restrictions based on the maintenance of financial covenants contained in our 2016 Credit Facility. See the 2022 Form 10-K. At any point in time, we intend to maintain available commitments under our 2016 Revolver in an amount at least equal to the amount of outstanding Commercial Paper Notes. See note 4 to our condensed consolidated financial statements.
Over the next 12 months:
*•*Our liquidity sources may include (1) cash on hand, (2) cash generated by our operating activities, (3) availability under our 2016 Revolver, (4) issuances under our CP Program, and (5) issuances of equity pursuant to our 2021 ATM Program. Our liquidity uses over the next 12 months are expected to include (1) debt obligations of $1.5 billion (consisting of Commercial Paper Notes, the 3.150% Senior Notes and principal payments on certain outstanding debt), (2) cumulative common stock dividend payments expected to be at least $6.26 per share, or an aggregate amount of approximately $2.7 billion (see "Item 2. MD&A—Highlights of Business Fundamentals and Results") and (3) capital expenditures. We may also purchase shares of our common stock. Additionally, amounts available under our CP Program may be repaid and re-issued from time to time and we intend to maintain available commitments under our 2016 Revolver in an amount at least equal to the amount of Commercial Paper Notes outstanding. During the next 12 months, while our liquidity uses are expected to exceed our cash generated by operating activities, we expect that our liquidity sources described above should be sufficient to cover our expected uses. Historically, from time to time, we have accessed the capital markets to issue debt and equity.
- See "Item 3. Quantitative and Qualitative Disclosures About Market Risk" for a discussion of interest rate risk and note 4 to our condensed consolidated financial statements for a tabular presentation of our debt maturities and a discussion of anticipated repayment dates.
Summary Cash Flow Information
| Three Months Ended March 31, | |||||||||||||||||
| (In millions of dollars) | 2023 | 2022 | Change | ||||||||||||||
| Net increase (decrease) in cash, cash equivalents, and restricted cash: | |||||||||||||||||
| Operating activities | $ | 606 | $ | 558 | $ | 48 | |||||||||||
| Investing activities | (407) | (289) | (118) | ||||||||||||||
| Financing activities | (139) | (253) | 114 | ||||||||||||||
| Net increase (decrease) in cash, cash equivalents, and restricted cash | $ | 60 | $ | 16 | $ | 44 |
Operating Activities
Net cash provided by operating activities of $606 million for the first three months of 2023 increased by $48 million, or 9%, compared to the first three months of 2022, due primarily to a net increase from changes in working capital and growth in our core business. Changes in working capital contribute to variability in net cash provided by operating activities, largely due to the timing of advanced payments by us and advanced receipts from tenants. We expect to grow our net cash provided by operating activities in the future (exclusive of changes in working capital) if we realize expected growth in our core business.
Investing Activities
Net cash used for investing activities of $407 million for the first three months of 2023 increased by $118 million, or 41%, from the first three months of 2022 primarily as a result of payments for acquisitions in our Towers segment and increased discretionary capital expenditures in our Fiber segment.
Our capital expenditures are categorized as discretionary or sustaining as described below.
-
Discretionary capital expenditures are made with respect to activities which we believe exhibit sufficient potential to enhance long-term stockholder value. They primarily consist of expansion or development of communications infrastructure (including capital expenditures related to (1) enhancing communications infrastructure in order to add new tenants for the first time or support subsequent tenant equipment augmentations or (2) modifying the structure of a communications infrastructure asset to accommodate additional tenants) and construction of new communications infrastructure. Discretionary capital expenditures also include purchases of land interests (which primarily relate to land assets under towers as we seek to manage our interests in the land beneath our towers), certain technology-related investments necessary to support and scale future customer demand for our communications infrastructure, and other capital projects. The expansion or development of existing communications infrastructure to accommodate new leasing typically varies based on, among other factors: (1) the type of communications infrastructure, (2) the scope, volume, and mix of work performed on the communications infrastructure, (3) existing capacity prior to installation, or (4) changes in structural engineering regulations and standards. Currently, construction of new communications infrastructure is predominately comprised of the construction of small cells and fiber (including certain construction projects that may take 18 to 36 months to complete). Our decisions regarding discretionary capital expenditures are influenced by the availability and cost of capital and expected returns on alternative uses of cash, such as payments of dividends and investments.
-
Sustaining capital expenditures consist of those capital expenditures not otherwise categorized as discretionary capital expenditures, such as (1) maintenance capital expenditures on our communications infrastructure assets that enable our tenants' ongoing quiet enjoyment of the communications infrastructure and (2) ordinary corporate capital expenditures.
A summary of our capital expenditures for the three months ended March 31, 2023 and 2022 is as follows:
| For the Three Months Ended | |||||||||||||||||||||||||||||
| March 31, 2023 | March 31, 2022 | ||||||||||||||||||||||||||||
| (In millions of dollars) | Towers | Fiber | Other | Total | Towers | Fiber | Other | Total | |||||||||||||||||||||
| Discretionary: | |||||||||||||||||||||||||||||
| Communications infrastructure improvements and other capital projects(a) | $ | 33 | $ | 272 | $ | 6 | $ | 311 | $ | 35 | $ | 209 | $ | 6 | $ | 250 | |||||||||||||
| Purchases of land interests | 15 | — | — | 15 | 10 | — | — | 10 | |||||||||||||||||||||
| Sustaining | 2 | 7 | 6 | 15 | 2 | 13 | 6 | 21 | |||||||||||||||||||||
| Total | $ | 50 | $ | 279 | $ | 12 | $ | 341 | $ | 47 | $ | 222 | $ | 12 | $ | 281 |
(a)Towers segment includes $10 million and $16 million of capital expenditures incurred during the three months ended March 31, 2023 and 2022, respectively, in connection with tenant installations and upgrades on our towers.
Discretionary capital expenditures were primarily impacted by the timing of both Towers and Fiber tenant activity during the first three months of 2023 compared to the same period in 2022. See also "Item 2. MD&A—General Overview—Outlook Highlights" for our expectations surrounding 2023 capital expenditures.
Financing Activities
We seek to allocate cash generated by our operations in a manner that will enhance long-term stockholder value, which may include various financing activities such as (in no particular order): (1) paying dividends on our common stock (currently expected to total at least $6.26 per share over the next 12 months, or an aggregate amount of approximately $2.7 billion), (2) purchasing our common stock or (3) purchasing, repaying, or redeeming our debt. See notes 4, 9 and 12 to our condensed consolidated financial statements.
Net cash used for financing activities of $139 million for the first three months of 2023 decreased by $114 million from the first three months of 2022 as a result of the net impact from our issuances, purchases and repayments of debt (including with respect to our 2016 Credit Facility and CP Program), common stock dividend payments and purchases of our common stock. See "Item 2. MD&A—General Overview—Highlights of Business Fundamentals and Results" and notes 4 and 9 to our condensed consolidated financial statements for further information.
The net proceeds of the January 2023 Senior Notes were used to repay a portion of the outstanding indebtedness under the 2016 Revolver and pay related fees and expenses.
Credit Facility. The proceeds from our 2016 Revolver may be used for general corporate purposes, which may include the financing of capital expenditures, acquisitions, the repayment or repurchase of any outstanding indebtedness and purchases of our common stock. As of May 1, 2023, there was no outstanding balance and $7.0 billion in undrawn availability under our 2016 Revolver. At any point in time, we intend to maintain available commitments under our 2016 Revolver in an amount at least equal to the amount of outstanding Commercial Paper Notes. See note 4 to our condensed consolidated financial statements for additional information regarding our Credit Facility.
Commercial Paper Program. The proceeds from our Commercial Paper Notes may be used for general corporate purposes, which may include the financing of capital expenditures, acquisitions, the repayment or repurchase of any outstanding indebtedness and purchases of our common stock. As of May 1, 2023, there was $577 million outstanding under our CP Program. See note 4 to our condensed consolidated financial statements for further information regarding our CP Program.
Incurrence, Purchases, and Repayments of Debt. See "Item 2. MD&A—General Overview—Highlights of Business Fundamentals and Results" and note 4 to our condensed consolidated financial statements for further discussion of our recent issuances, purchases, redemptions and repayments of debt.
Common Stock Activity. See notes 9 and 12 to our condensed consolidated financial statements for further information regarding our common stock and dividends.
ATM Program. In March 2021, we established the 2021 ATM Program through which we may issue and sell shares of our common stock having an aggregate gross sales price of up to $750 million. Sales under the 2021 ATM Program may be made by means of ordinary brokers' transactions on the NYSE or otherwise at market prices prevailing at the time of sale, at prices related to prevailing market prices or, subject to our specific instructions, at negotiated prices. We intend to use the net proceeds from any sales under the 2021 ATM Program for general corporate purposes, which may include (1) the funding of future acquisitions or investments or (2) the repayment or repurchase of any outstanding indebtedness. We have not sold any shares of common stock under the 2021 ATM Program.
Debt Covenants. Our 2016 Credit Agreement contains financial maintenance covenants. We are currently in compliance with these financial maintenance covenants and, based upon our current expectations, we believe we will continue to comply with our financial maintenance covenants. In addition, certain of our debt agreements contain restrictive covenants that place restrictions on us and may limit our ability to, among other things, incur additional debt and liens, purchase our securities, make capital expenditures, dispose of assets, undertake transactions with affiliates, make other investments, pay dividends or distribute excess cash flow. See the 2022 Form 10-K for a further discussion of our debt covenants, certain restrictive covenants and factors that are likely to determine our subsidiaries' ability to comply with current and future debt covenants.
Accounting and Reporting Matters
Critical Accounting Policies and Estimates
Our critical accounting policies and estimates are those that we believe (1) are most important to the portrayal of our financial condition and results of operations or (2) require our most difficult, subjective or complex judgments, often as a result of the need to make estimates about the effect of matters that are inherently uncertain. In many cases, the accounting treatment of a particular transaction is specifically prescribed by GAAP. In other cases, management is required to exercise judgment in the application of accounting principles with respect to particular transactions. Accordingly, actual results could differ materially from our estimates. Our critical accounting policies and estimates as of December 31, 2022 are described in "Item 7. MD&A—Accounting and Reporting Matters" and in note 2 of our consolidated financial statements in the 2022 Form 10-K.
Accounting Pronouncements
Recently Adopted Accounting Pronouncements. See note 2 to our condensed consolidated financial statements.
Recent Accounting Pronouncements Not Yet Adopted. See note 2 to our condensed consolidated financial statements.
Non-GAAP and Segment Financial Measures
We use earnings before interest, taxes, depreciation, amortization and accretion, as adjusted ("Adjusted EBITDA"), which is a non-GAAP financial measure, as an indicator of consolidated financial performance. Our measure of Adjusted EBITDA may not be comparable to similarly titled measures of other companies, including companies in the communications infrastructure sector or other REITs, and is not a measure of performance calculated in accordance with GAAP. Adjusted EBITDA should not be considered in isolation or as a substitute for operating income (loss), net income (loss), net cash provided by (used for) operating, investing and financing activities or other income statement or cash flow statement data prepared in accordance with GAAP and should be considered only as a supplement to net income (loss) computed in accordance with GAAP as a measure of our performance. There are material limitations to using a measure such as Adjusted EBITDA, including the difficulty associated with comparing results among more than one company, including our competitors, and the inability to analyze certain significant items, including depreciation and interest expense, that directly affect our net income (loss). Management compensates for these limitations by considering the economic effect of the excluded expense items independently as well as in connection with their analysis of net income (loss).
We define Adjusted EBITDA as net income (loss) plus restructuring charges (credits), asset write-down charges, acquisition and integration costs, depreciation, amortization and accretion, amortization of prepaid lease purchase price adjustments, interest expense and amortization of deferred financing costs, net, (gains) losses on retirement of long-term obligations, net (gain) loss on interest rate swaps, (gains) losses on foreign currency swaps, impairment of available-for-sale securities, interest income, other (income) expense, (benefit) provision for income taxes, cumulative effect of a change in accounting principle, stock-based compensation expense, net and net (gain) loss from disposal of discontinued operations, net of tax. The reconciliation of Adjusted EBITDA to our net income (loss) is set forth below:
| (In millions of dollars) | Three Months Ended March 31, | ||||||||||||||||||||||
| 2023 | 2022 | ||||||||||||||||||||||
| Net income (loss) | $ | 418 | $ | 421 | |||||||||||||||||||
| Adjustments to increase (decrease) net income (loss): | |||||||||||||||||||||||
| Asset write-down charges | — | 14 | |||||||||||||||||||||
| Depreciation, amortization and accretion | 431 | 420 | |||||||||||||||||||||
| Amortization of prepaid lease purchase price adjustments | 4 | 4 | |||||||||||||||||||||
| Interest expense and amortization of deferred financing costs, net | 202 | 164 | |||||||||||||||||||||
| (Gains) losses on retirement of long-term obligations | — | 26 | |||||||||||||||||||||
| Interest income | (2) | — | |||||||||||||||||||||
| Other (income) expense | 3 | 1 | |||||||||||||||||||||
| (Benefit) provision for income taxes | 7 | 6 | |||||||||||||||||||||
| Stock-based compensation expense, net | 41 | 39 | |||||||||||||||||||||
| Adjusted EBITDA(a) | $ | 1,104 | $ | 1,095 |
(a)The above reconciliation excludes the items included in our Adjusted EBITDA definition which are not applicable to the periods shown.
We believe Adjusted EBITDA is useful to investors or other interested parties in evaluating our financial performance because:
-
it is the primary measure used by our management (1) to evaluate the economic productivity of our operations and (2) for purposes of making decisions about allocating resources to, and assessing the performance of, our operations;
-
although specific definitions may vary, it is widely used by investors or other interested parties in evaluation of the communications infrastructure sector and other REITs to measure financial performance without regard to items such as depreciation, amortization and accretion, which can vary depending upon accounting methods and the book value of assets;
-
we believe it helps investors and other interested parties meaningfully evaluate and compare the results of our operations (1) from period to period and (2) to our competitors by removing the impact of our capital structure (primarily interest charges from our outstanding debt) and asset base (primarily depreciation, amortization and accretion) from our financial results; and
-
it is similar to the measure of current financial performance generally used in our debt covenant calculations.
Our management uses Adjusted EBITDA:
-
as a performance goal in employee annual incentive compensation;
-
as a measurement of financial performance because it assists us in comparing our financial performance on a consistent basis as it removes the impact of our capital structure (primarily interest charges from our outstanding debt) and asset base (primarily depreciation, amortization and accretion) from our operating results;
-
in presentations to our board of directors to enable it to have the same measurement of financial performance used by management;
-
for planning purposes, including preparation of our annual operating budget;
-
as a valuation measure in strategic analyses in connection with the purchase and sale of assets;
-
in determining self-imposed limits on our debt levels, including the evaluation of our leverage ratio; and
-
with respect to compliance with our debt covenants, which require us to maintain certain financial ratios that incorporate concepts such as, or similar to, Adjusted EBITDA.
In addition to the non-GAAP measures used herein and as discussed in note 10 to our condensed consolidated financial statements, we also provide (1) segment site rental gross margin, (2) segment services and other gross margin, and (3) segment operating profit (loss), which are key measures used by management to evaluate the performance of our operating segments. These segment measures are provided pursuant to GAAP requirements related to segment reporting.
We define segment site rental gross margin as segment site rental revenues less segment site rental costs of operations, excluding stock-based compensation expense, net and amortization of prepaid lease purchase price adjustments recorded in consolidated site rental costs of operations. We define segment services and other gross margin as segment services and other revenues less segment services and other costs of operations, excluding stock-based compensation expense, net recorded in consolidated services and other costs of operations. We define segment operating profit (loss) as segment site rental gross margin plus segment services and other gross margin, and segment other operating (income) expense, less segment selling, general and administrative expenses. All of these measurements of profit or loss are exclusive of depreciation, amortization and accretion, which are shown separately. Additionally, certain costs are shared across segments and are reflected in our segment measures through allocations that management believes to be reasonable.
Item 3. QUANTITATIVE AND QUALITATIVE DISCLOSURES ABOUT MARKET RISK
The following section updates "Item 7A. Quantitative and Qualitative Disclosures About Market Risk" in the 2022 Form 10-K and should be read in conjunction with that report as well as our condensed consolidated financial statements.
Interest Rate Risk
Our interest rate risk as of March 31, 2023 relates primarily to the impact of interest rate movements on the following, after giving effect to our April 2023 Senior Notes offering and the use of the net proceeds therefrom:
-
the potential refinancing of our $22.3 billion of existing debt outstanding as of March 31, 2023;
-
our 2.0 billion of floating rate debt as of March 31, 2023, which represented approximately 9% of our total debt as of March 31, 2023; and
-
potential future borrowings of incremental debt, including borrowings under our 2016 Credit Facility and issuances under our CP Program.
Over the past 14 months, the Federal Reserve has raised the federal funds rate nine times for a cumulative increase of 4.75%. Further increases in the federal funds rate could increase our costs of borrowing. See also "Item 1A. Risk Factors" in the 2022 Form 10-K for a discussion of risks stemming from interest rate increases.
We currently have no interest rate swaps.
Sensitivity Analysis. We manage our exposure to market interest rates on our existing debt by controlling the mix of fixed and floating rate debt. As of March 31, 2023, after giving effect to our April 2023 Senior Notes offering and the use of the net proceeds therefrom, we had 2.0 billion of floating rate debt. As a result, a hypothetical unfavorable fluctuation in market interest rates on our existing debt of 1/4 of a percent point over a 12-month period would increase our interest expense by approximately $5 million.
Future Principal Payments and Interest Rates. The following table provides information about our market risk related to changes in interest rates. The future principal payments and weighted-average interest rates are presented as of March 31, 2023, after giving effect to our April 2023 Senior Notes offering and the use of the net proceeds therefrom. These debt maturities reflect final maturity dates and do not consider the impact of the principal payments that commence following the anticipated repayment dates of certain debt (see footnotes (b) and (d)). The information presented below regarding the variable rate debt is supplementary to our sensitivity analysis regarding the impact of changes in the interest rates. See notes 4 and 5 to our condensed consolidated financial statements and the 2022 Form 10-K for additional information regarding our debt.
| Future Principal Payments and Interest Rates by the Debt Instruments' Contractual Year of Maturity | |||||||||||||||||||||||||||||||||||||||||||||||
| (In millions of dollars) | 2023 | 2024 | 2025 | 2026 | 2027 | Thereafter | Total | Fair Value**(a)** | |||||||||||||||||||||||||||||||||||||||
| Debt: | |||||||||||||||||||||||||||||||||||||||||||||||
| Fixed rate(b) | $ | 780 | $ | 787 | $ | 534 | $ | 2,682 | $ | 2,278 | $ | 13,441 | $ | 20,502 | $ | 18,415 | |||||||||||||||||||||||||||||||
| Average interest rate(b)(c)(d) | 3.2 | % | 3.3 | % | 1.6 | % | 3.0 | % | 3.5 | % | 4.2 | % | 3.8 | % | |||||||||||||||||||||||||||||||||
| Variable rate(e) | $ | 740 | (f) | $ | 45 | $ | 60 | $ | 91 | $ | 1,066 | $ | — | $ | 2,002 | $ | 2,002 | ||||||||||||||||||||||||||||||
| Average interest rate(e) | 5.6 | % | 4.7 | % | 4.0 | % | 3.9 | % | 3.9 | % | — | % | 4.6 | % |
(a)The fair value of our debt is based on indicative quotes, non-binding quotes from brokers that require judgment to interpret market information, including implied credit spreads for similar borrowings on recent trades or bid/ask offers. These fair values are not necessarily indicative of the amount, which could be realized in a current market exchange.
(b)The impact of principal payments that will commence following the anticipated repayment dates is not considered (see footnote (d) below). The Tower Revenue Notes, Series 2015-2 and Series 2018-2 have principal amounts of $700 million and $750 million, with anticipated repayment dates in 2025 and 2028, respectively.
(c)The average interest rate represents the weighted-average stated coupon rate (see footnote (d) below).
(d)If the Tower Revenue Notes are not repaid in full by the applicable anticipated repayment dates, the applicable interest rate increases by approximately 5% per annum and monthly principal payments commence using the Excess Cash Flow (as defined in the indenture governing the applicable Tower Revenue Notes) of the issuers of the Tower Revenue Notes. The Tower Revenue Notes are presented based on their contractual maturity dates ranging from 2045 to 2048 and include the impact of an assumed 5% increase in interest rate that would occur following the anticipated repayment dates but exclude the impact of monthly principal payments that would commence using Excess Cash Flow of the issuers of the Tower Revenue Notes. The full year 2022 Excess Cash Flow of the issuers of the Tower Revenue Notes was approximately $1.0 billion. We currently expect to refinance these notes on or prior to the respective anticipated repayment dates.
(e)See note 7 to our consolidated financial statements in the 2022 Form 10-K for information regarding potential upward or downward adjustments to the interest rate spread and unused commitment fee percentage on our 2016 Credit Facility if we achieve specified annual sustainability targets or fail to meet annual sustainability metrics. Each period presented assumes the downward adjustments in the interest rate spread and unused commitment fee percentage on our 2016 Credit Facility.
(f)Predominately consists of outstanding indebtedness under our CP Program. Such amounts may be issued, repaid or re-issued from time to time.
Item 4. CONTROLS AND PROCEDURES
Disclosure Controls and Procedures
The Company conducted an evaluation, under the supervision and with the participation of the Company's management, including the Company's Chief Executive Officer ("CEO") and Chief Financial Officer ("CFO"), of the effectiveness of the Company's disclosure controls and procedures as of the end of the period covered by this report. Based upon their evaluation, the CEO and CFO concluded that as of March 31, 2023, the Company's disclosure controls and procedures were effective in alerting them in a timely manner to material information relating to the Company required to be included in the Company's periodic reports under the Securities Exchange Act of 1934, as amended.
Changes in Internal Control Over Financial Reporting
There have been no changes in the Company's internal control over financial reporting during the fiscal quarter covered by this Form 10-Q that have materially affected, or are reasonably likely to materially affect, the Company's internal control over financial reporting.
PART II—OTHER INFORMATION
ITEM 1. LEGAL PROCEEDINGS
See the disclosure in note 8 to our condensed consolidated financial statements.
Item 1A. RISK FACTORS
There are no material changes to the risk factors discussed in "Item 1A. Risk Factors" in the 2022 Form 10-K.
Item 6. EXHIBITS
Exhibit Index
- Filed herewith.
† Furnished herewith.
SIGNATURES
Pursuant to the requirements of the Securities Exchange Act of 1934, the Registrant has duly caused this report to be signed on its behalf by the undersigned thereunto duly authorized.
| CROWN CASTLE INC. | ||||||||||||||
| Date: | May 3, 2023 | By: | /s/ DANIEL K. SCHLANGER | |||||||||||
| Daniel K. Schlanger | ||||||||||||||
| Executive Vice President and Chief Financial Officer | ||||||||||||||
| (Principal Financial Officer) | ||||||||||||||
| Date: | May 3, 2023 | By: | /s/ ROBERT S. COLLINS | |||||||||||
| Robert S. Collins | ||||||||||||||
| Vice President and Controller | ||||||||||||||
| (Principal Accounting Officer) |