 filings.tools
Cadence Design Systems 10-K 2019-12-28
Filed 2020-02-24. 22 sections, 379K characters. Original on sec.gov · Markdown · JSON
Cover and table of contents
UNITED STATES SECURITIES AND EXCHANGE COMMISSION
Washington, D.C. 20549
FORM 10-K
(Mark One)
| ☒ | ANNUAL REPORT PURSUANT TO SECTION 13 OR 15(d) OF THE SECURITIES EXCHANGE ACT OF 1934 |
For the fiscal year ended December 28, 2019
OR
| ☐ | TRANSITION REPORT PURSUANT TO SECTION 13 OR 15(d) OF THE SECURITIES EXCHANGE ACT OF 1934 |
For the transition period from _________ to_________.
Commission file number 000-15867

CADENCE DESIGN SYSTEMS INC
(Exact name of registrant as specified in its charter)
| Delaware | 00-0000000 | |||
| (State or Other Jurisdiction of Incorporation or Organization) | (I.R.S. Employer Identification No.) | |||
| 2655 Seely Avenue, Building 5, | San Jose, | California | 95134 | |
| (Address of Principal Executive Offices) | (Zip Code) |
**(408)****-**943-1234
(Registrant’s Telephone Number, including Area Code)
Securities registered pursuant to Section 12(b) of the Act:
| Title of Each Class | Trading Symbol(s) | Names of Each Exchange on which Registered |
| Common Stock, $0.01 par value per share | CDNS | Nasdaq Global Select Market |
Securities registered pursuant to Section 12(g) of the Act:
None
Indicate by check mark if the registrant is a well-known seasoned issuer, as defined in Rule 405 of the Securities Act. Yes ☒ No ☐
Indicate by check mark if the registrant is not required to file reports pursuant to Section 13 or Section 15(d) of the Act. Yes ☐ No ☒
Indicate by check mark whether the registrant (1) has filed all reports required to be filed by Section 13 or 15(d) of the Securities Exchange Act of 1934 during the preceding 12 months (or for such shorter period that the registrant was required to file such reports), and (2) has been subject to such filing requirements for the past 90 days. Yes ☒ No ☐
Indicate by check mark whether the registrant has submitted electronically every Interactive Data File required to be submitted pursuant to Rule 405 of Regulation S-T (§ 232.405 of this chapter) during the preceding 12 months (or for such shorter period that the registrant was required to submit such files). Yes ☒ No ☐
Indicate by check mark whether the registrant is a large accelerated filer, an accelerated filer, a non-accelerated filer, a smaller reporting company, or an emerging growth company. See the definitions of “large accelerated filer,” “accelerated filer,” “smaller reporting company,” and “emerging growth company” in Rule 12b-2 of the Exchange Act.
| Large Accelerated Filer | ☒ | Accelerated Filer | ☐ | |||
| Non-accelerated Filer | ☐ | Smaller Reporting Company | ☐ | |||
| Emerging Growth Company | ☐ |
If an emerging growth company, indicate by check mark if the registrant has elected not to use the extended transition period for complying with any new or revised financial accounting standards provided pursuant to Section 13(a) of the Exchange Act. ☐
Indicate by check mark whether the registrant is a shell company (as defined in Rule 12b-2 of the Act). Yes ☐ No ☒
The aggregate market value of the voting and non-voting common equity held by non-affiliates computed by reference to the price at which the common equity was last sold as of the last business day of the registrant’s most recently completed second fiscal quarter ended June 29, 2019 was approximately $19,837,633,930.
On February 1, 2020, approximately 280,168,000 shares of the Registrant’s Common Stock, $0.01 par value, were outstanding.
DOCUMENTS INCORPORATED BY REFERENCE
Portions of the definitive proxy statement for Cadence Design Systems, Inc.’s 2020 Annual Meeting of Stockholders are incorporated by reference into Part III hereof.
CADENCE DESIGN SYSTEMS, INC.
ANNUAL REPORT ON FORM 10-K
FOR THE FISCAL YEAR ENDED DECEMBER 28, 2019
Table of Contents
PART I.
Item 1. Business
This Annual Report on Form 10-K and the documents incorporated by reference in this Annual Report on Form 10-K contain statements that are not historical in nature, are predictive, or that depend upon or refer to future events or conditions or contain other forward-looking statements. Statements including, but not limited to, statements regarding the extent and timing of future revenues and expenses and customer demand, statements regarding the deployment of our products and services, statements regarding our reliance on third parties, and statements using words such as “anticipates,” “believes,” “could,” “estimates,” “expects,” “forecasts,” “intends,” “may,” “plans,” “projects,” “should,” “targets,” “will” and “would,” and words of similar import and the negatives thereof, constitute forward-looking statements. These statements are predictions based upon our current expectations about future events. Actual results could vary materially as a result of certain factors, including but not limited to those expressed in these statements. Important risks and uncertainties that could cause actual results to differ materially from those contained in the forward-looking statements include, but are not limited to, those identified in “Proprietary Technology,” “Competition,” “Risk Factors,” “Critical Accounting Estimates,” “Results of Operations,” “Quantitative and Qualitative Disclosures About Market Risk” and “Liquidity and Capital Resources” contained in this Annual Report on Form 10-K and the risks discussed in our other Securities and Exchange Commission (“SEC”) filings.
We urge you to consider these factors carefully in evaluating the forward-looking statements contained in this Annual Report on Form 10-K. All subsequent written or oral forward-looking statements attributable to our company or persons acting on our behalf are expressly qualified in their entirety by these cautionary statements. The forward-looking statements included in this Annual Report on Form 10-K are made only as of the date of this Annual Report on Form 10-K. We do not intend, and undertake no obligation, to update these forward-looking statements.
Overview
We enable our customers to design electronic products. Our products and services are designed to give our customers a competitive edge in their development of electronic systems, integrated circuits (“ICs”), electronic devices and increasingly sophisticated manufactured products. Our products and services do this by optimizing performance, minimizing power consumption, shortening the time to bring our customers’ products to market and reducing their design, development and manufacturing costs. Our customers create and sell electronic products at differing levels of completeness. Our electronic systems customers deliver entire devices, such as smartphones, laptop computers, gaming systems, automobiles and autonomous driving systems, servers, cloud datacenter infrastructure, artificial intelligence (“AI”) systems, aerospace and defense, medical equipment and networking products. These systems companies internally develop, or externally purchase, the sub-components for their products, including printed circuit boards (“PCBs”), which interconnect all the hardware components, ICs, which are often referred to as computer chips, and software at various levels which runs on the hardware. Our semiconductor customers deliver ICs, which include subcategories such as memory chips, systems-on-chip (“SoCs”), analog chips, processors and other types of chips.
We offer software, hardware, services and reusable IC design blocks, which are commonly referred to as intellectual property (“IP”). Systems customers use our offerings to develop and integrate software that is key to the functionality of their products, as well as to design their ICs and PCBs. Our semiconductor customers use our offerings to design, configure, analyze and verify ICs. Additionally, some customers license our IP, which accelerates their product development processes by providing pre-designed and verified circuit blocks for their ICs.
Our strategy, which we call Intelligent System Design™, provides the technologies necessary for our customers to develop and optimize a complete and functional electronic product. We address the challenges posed by the needs and trends of electronic systems companies as well as semiconductor companies delivering greater portions of these systems. The development of electronic products, or their sub-components, is complex and requires many engineers using our solutions with specialized knowledge and skill. The rate of technical innovation in electronics is swift, long driven by a concept known as Moore’s Law, which more than 50 years ago predicted that the complexity of ICs would double about every 24 months. In order to make our customers successful, our products must handle this exponential growth rate in complexity, without requiring a corresponding increase in our customers’ costs. Historically, the industry that provided the tools used by IC engineers was referred to as Electronic Design Automation (“EDA”). Today, our offerings include and extend beyond EDA tools to enable Intelligent System Design across three layers as illustrated below—starting with IC and SoC design excellence, followed by system innovation, and then pervasive intelligence.

The core IC and SoC design excellence requires core EDA technologies for custom IC, digital IC and signoff, and functional verification, and leverages pre-build semiconductor IP. These tools, IP and associated services are specifically designed to meet the requirements of engineers who design across analog, digital and mixed-signal domains, and perform the associated verification efforts, including validation of low-level software running on the silicon model, thereby enabling design teams to manage complexity without increasing the team size or extending the project schedule, while reducing technical risks.
The second layer of our strategy centers around system innovation. It includes tools and services used for system design of the packages that encapsulate the ICs and the PCBs, system simulation which includes electromagnetic, electro-thermal and other multi-physics analysis necessary as part of optimizing the full system’s performance, Radio Frequency (“RF”) and microwave systems, and embedded software.
The third layer of our strategy is enabling pervasive intelligence in new electronics. It starts with providing solutions and services to develop AI-enhanced systems and includes machine learning and deep learning capabilities being added to the Cadence technology portfolio to make IP and tools more automated and to produce optimized results faster, supported by cloud access to address the growing computation needs of our customers.
Business Drivers
Our products and services allow our customers to design complex and innovative electronic products which are accelerated by growing digital transformation. Demand for our technology and expertise is driven by our customers’ investment in new designs and products. The most promising new opportunities for us involve enabling the design of electronic systems for AI, edge computing, hyperscale computing including datacenter infrastructure, communications, including 5G networks, augmented reality, virtual reality, internet-of-things (“IoT”), aerospace and defense, automotive, industrial and healthcare subsystems. Large and existing electronics categories, such as datacenter servers, smartphones and networking products continue to provide business opportunities for us as customers initiate new design projects.
Underlying the requirements within any particular vertical market sector is the availability of rapidly improving IC manufacturing technology. In order for our customers to take advantage of such advancements, some of our products must first be developed to exploit new manufacturing capabilities. This dependency means that we must invest significantly in product research and development (“R&D”) to keep pace with the latest manufacturing technology. The demand for new IC manufacturing technology directly impacts the demand for our newest products.
Another driver for our business is the differentiation, capabilities and benefits provided to our customers by our products. With the rapid pace of innovation comes the opportunity for our products to address key challenges associated with electronic product creation, such as power consumption, performance and cost. Our products and services have unique attributes that our customers value. In general, these attributes can be grouped into broader categories such as quality of results (“QoR”) (in terms of power consumption, performance and chip area), engineering productivity, tool performance, and faster time-to-market. Our business opportunities are significantly enhanced when our offerings address these key factors. We are applying machine learning techniques within our products to enhance QoR, productivity, performance and methodology.
Products and Product Strategy
Our Intelligent System Design strategy is to provide our customers with the ability to address the broad range of issues that arise as they develop electronic products. Our solutions are comprised of products that are categorized according to the role they play in the electronic product design process. We combine our products and technologies into categories related to major design activities, including Custom IC and Simulation, Digital IC Design and Signoff, Functional Verification, IP, and System Interconnect and Analysis.
Custom IC Design and Simulation
Our Custom IC design and simulation offerings are used by our customers to create schematic and physical representations of circuits down to the transistor level for analog, mixed-signal, custom digital, memory and RF designs. These representations are verified using simulation tools optimized for each type of design, including the design capture environment, simulation and IC layout within the Virtuoso® custom design platform. Other tools in the custom IC portfolio are used to prepare the designs for manufacturing.
Virtuoso Advanced Node adds functionality to the base Virtuoso package to enable the use of three-dimensional transistors (“FinFETs”), multi-patterning and other technologies required for advanced designs. The Virtuoso RF solution addresses the challenges of RF design across chip, package and board. Spectre® Simulator provides large-scale verification simulation. The Virtuoso System Design Platform enables engineers to design and verify concurrently across the chip, package and board.
Digital IC Design and Signoff
Digital IC design and signoff offerings are used to create logical representations of a digital circuit or an IC that can be verified for correctness prior to implementation (please refer to the discussion under “Functional Verification” below). Once the logic is verified, the design representation is implemented, or converted to a format ready for silicon manufacturing, using additional software tools within this category. The manufacturing representation is also analyzed and verified. Our digital IC and signoff technology suite provides a full flow to achieve power, performance, and area (“PPA”) design targets, and includes three major categories: logic design, physical implementation and signoff.
Our logic design offering is comprised of logic synthesis, test and equivalence checking capabilities and is typically used by customers to create and verify designs in conjunction with our functional verification capabilities. The offering includes the Genus™ Synthesis Solution, a logic synthesis offering that provides fast throughput while also offering high quality results, the Stratus™ High-Level Synthesis solution for system-level synthesis, and the Joules™ RTL Power Solution, which delivers fast power analysis while preserving near-signoff accuracy. We also offer the Modus Design-For-Test (“DFT”) software solution, which reduces SoC test time.
Our physical implementation offering comprises tools used near the end of the design process, including place and route, optimization and multi-patterning preparation. The Innovus™ Implementation System is a physical implementation offering that delivers fast design turnaround time while also delivering improved PPA characteristics. This offering enables customers to address the technology challenges of the latest semiconductor advanced-process nodes, create a physical representation of logic models and prepare a design for signoff.
Our signoff offering is comprised of tools used to signoff the design as ready for manufacture by a semiconductor foundry, which provides certification for this step. This offering includes the Tempus™ Timing Signoff Solution, Voltus™ Power Integrity Solution, Quantus™ Extraction Solution, and Pegasus™ Physical Verification System. Our design-for-manufacturing (“DFM”) products are also included in our signoff offering and are used by customers to address manufacturing and yield issues as early in the product development process as possible.
Functional Verification
Functional verification products are used by our customers to efficiently and effectively verify that the circuitry or the software they have designed will perform as intended. Verification takes place during and after custom and analog design, and before manufacturing the circuitry, significantly reducing the risk of discovering a costly error in the completed product.
Our Verification Suite™ includes four primary verification engines, starting with the JasperGold® Formal Verification Platform and Xcelium™ Parallel Logic Simulation Platform, which are used in the early stages of design, often at the IP and subsystem level. Once the design is more mature, with early formal and simulation verification tasks performed, verification engineers deploy our Palladium® Emulation Platform and Protium™ Prototyping Platform for more complete chip verification, often running low-level embedded software on top of a model of the chip, to ensure proper functionality before silicon manufacturing.
These engines are used for early bug detection, verification of block-level functionality, verification acceleration and emulation of system-level functionality, system-level power exploration, analysis and optimization, and system-level prototyping for hardware/software co-verification. Palladium provides high throughput, capacity, datacenter reliability and workgroup productivity to enable global design teams to develop advanced hardware-software systems. Protium leverages a common front end with the Palladium environment in order to move designs rapidly from emulation to the prototyping stage, allowing for software development to start weeks to months earlier.
These engines are also supported by other verification tools that provide an environment that allows for effective verification throughput, including verification planning and metric tracking, testbench automation, debugging and software-driven tests, enabling our customers to coordinate verification activities across multiple verification engines, and teams and locations for effective verification closure.
IP
Our IP offerings consist of pre-verified, customizable functional blocks, which customers integrate into their ICs to accelerate the development process and to reduce the risk of errors in the design process. We offer many types of IP, including Tensilica® configurable digital signal processors (“DSPs”), vertically targeted subsystems for AI, audio/voice, baseband and vision/imaging applications, controllers and physical interfaces for standard protocols and analog IP. We have significantly expanded our design IP portfolio in recent years through acquisitions and internal development, providing solutions for high speed SerDes, PCI, USB and many other standards.
We also offer a broad range of Verification IP (“VIP”) with memory models, which model the expected behavior of many industry standard protocols when used with verification solutions and are complementary to our design IP offerings. VIP and accelerated VIP (“AVIP”), which is used in emulation, are used across the suite of functional verification engines to verify the correct interaction with dozens of design IP interface protocols such as DDR, USB and PCI Express®. Our VIP offerings are also used in system-level verification to model correct behavior of full systems interacting with their environments.
System Interconnect and Analysis
Our system interconnect and analysis offerings are used by our customers to develop PCBs and IC packages, and analyze electromagnetic, electro-thermal and other multi-physics effects.
The capabilities in the Allegro® System Interconnect Design Platform include PCB authoring and implementation, IC package and System-in-Package (“SiP”) design and signal and power integrity (“SI/PI”) analysis and PCB library design management and collaboration. The need for compact, high-performance mobile, consumer and automotive design with advanced serial interconnect is driving the technology evolution for our PCB offerings. For mainstream PCB customers, where individual or small team productivity is a focus, we provide the OrCAD® family of offerings that is primarily marketed worldwide through a network of resellers.
Our technology portfolio expanded in 2019 into the growing system analysis market segment. The speed and close proximity of signals on silicon, through packages to boards, and through connectors and cables, exposes these communications to various kinds of interference, generates heat and emits electromagnetic radiation. Careful analysis is required to assure these systems will work as designed under a wide range of operating conditions and within compliance of standards and laws. The complexity of these devices and signal transmissions requires analysis and simulation throughout the product lifecycle to meet these objectives. Our Clarity™ 3D Solver for electromagnetic and power electronics analysis and simulation, as well as our Celsius™ Thermal Solver, provide the foundation for multi-physics analysis technology, with complete electrical-thermal co-simulation for electronic systems from ICs to physical enclosures.
Recent Acquisitions
Building upon Virtuoso RF technology and expertise and to better address increasing RF/microwave design activity, driven by growing use of 5G communications, our portfolio expanded with the acquisition of AWR Corporation and Integrand Software, Inc. in the first quarter of fiscal 2020.
Product Arrangements
We primarily license our software using time-based licenses. Our time-based license arrangements offer customers the right to access and use all of the products delivered at the outset of an arrangement and updates throughout the entire term of the arrangement, which is generally two to three years, with no rights to return. Our updates provide for continued access to our evolving technology as our customers’ designs migrate to more advanced nodes. In addition, certain time-based license arrangements include the right for the customer to remix among the products delivered at the outset of the arrangement and use of unspecified additional products that become commercially available during the term of the arrangement.
A small portion of our software is licensed under perpetual licenses, which does not include the right to use new technology. Payment terms for time-based licenses generally provide for payments to be made over the license period and payment terms for perpetual licenses generally are net 30 days.
The Cadence Cloud portfolio, consisting of Cadence-managed and customer-managed environments for electronic product developers using the scalability of the cloud, continues to expand and now includes a broader cloud-ready set of products. Contractual arrangements with customers for both environments are time based, similar to the on-premise software license arrangements described above.
Our emulation and prototyping hardware products are either sold or leased to our customers. Our emulation hardware can also be accessed remotely via a Cadence-managed cloud arrangement.
We generally license our design IP under nonexclusive license agreements that provide usage rights for specific designs. Some customers enter into a non-cancellable IP Access Agreement (“IPAA”), whereby the customer commits to a fixed dollar amount over a specified period of time that can be used to purchase from a list of IP products or services. In addition, for certain IP license agreements, we collect royalties as our customers ship their product that includes our IP to their customers.
For a further description of our license agreements, our emulation and prototyping hardware sale or lease agreements, revenue recognition policies and results of operations, please refer to the discussion under “Critical Accounting Estimates” under Part II, Item 7, “Management’s Discussion and Analysis of Financial Condition and Results of Operations.”
Technical Support and Maintenance
Customer service and support is critical to the adoption and successful use of our products. We provide our customers with technical support and maintenance to facilitate their use of our software, hardware and IP solutions.
Our education services offerings can be customized and include training programs that are delivered online or in a classroom setting. The content of these offerings ranges from the latest design techniques to methodologies for using the most recent features of our products. The primary focus of education services is to accelerate our customers’ path to productivity in the use of our products.
Services
We offer a number of services, including services related to methodology, education and hosted design solutions. These services may be sold separately or sold and performed in conjunction with the license, sale or lease of our products. As necessary, specialized design services engineers are assigned to internal R&D projects associated with our design IP business.
As part of our services offerings, we design advanced ICs, develop custom IP and help customers address design challenges. This enables us to target and accelerate the development of new software technology and products to satisfy current and future design requirements.
We offer engineering services to collaborate with our customers in the design of complex ICs and the implementation of key design capabilities, including low power design, IC packaging and board design, functional verification, digital implementation, analog/mixed-signal design and system-level design. The customers for these services primarily consist of semiconductor and systems companies developing products for the consumer, communications, automotive, aerospace and defense, and computing markets. These ICs range from digital SoCs and analog and RF designs to complex mixed-signal ICs.
In delivering methodology services, we leverage our experience and knowledge of design techniques, our products, leading practices and different design environments to improve the productivity of our customers’ engineering teams. Depending on the customers’ projects and needs, we work with customers using outsourced, consultative and collaborative offerings.
Third-Party Programs and Initiatives
In addition to our products, many customers use design tools that are provided by other companies, as well as design IP available from alternative suppliers. We support the use of third-party design products and design IP through our Connections® program and through our participation in industry groups such as the Silicon Integration Initiative and Accellera System Initiative. We actively contribute to the development and deployment of industry standards.
We also have a strategic partnership with Green Hills Software to provide embedded systems solutions focused on safety and security for critical applications such as aerospace and defense, automotive, industrial and medical devices.
Product and Maintenance and Services Revenue
Revenue, and revenue as a percentage of total revenue, from our product and maintenance and services offerings for the last three fiscal years were as follows:
| 2019 | 2018 | 2017 | ||||||||||||||||||
| (In millions, except percentages) | ||||||||||||||||||||
| Product and maintenance | $ | 2,204 | 94 | % | $ | 1,998 | 93 | % | $ | 1,814 | 93 | % | ||||||||
| Services | 132 | 6 | % | 140 | 7 | % | 129 | 7 | % | |||||||||||
| Total revenue | $ | 2,336 | $ | 2,138 | $ | 1,943 |
Between 85% and 90% of our revenue is characterized as recurring revenue. Revenue characterized as recurring includes revenue recognized over time from our software arrangements, services, royalties from certain IP arrangements, maintenance on IP licenses and hardware, operating leases of hardware and revenue recognized at varying points in time over the term of our IP Access Agreements.
The remainder of our revenue is characterized as upfront revenue. Up-front revenue is primarily generated by our sales of emulation and prototyping hardware and individual IP licenses. The percentage of our recurring and up-front revenue may be impacted by delivery of hardware and IP products to our customers in any single fiscal period.
For an additional description of our product and maintenance and services revenue, see the discussion under “Results of Operations” under Part II, Item 7, “Management’s Discussion and Analysis of Financial Condition and Results of Operations.” For our fiscal 2019 results of operations and our financial position as of December 28, 2019, see Part IV, Item 15, “Exhibits and Financial Statement Schedules.”
Backlog and Remaining Performance Obligations
Revenue allocated to remaining performance obligations represents the transaction price allocated to the performance obligations that are unsatisfied, or partially unsatisfied, which includes unearned revenue and amounts that will be invoiced and recognized as revenue in future periods. We have elected to exclude the potential future royalty receipts from the remaining performance obligations. Contracted but unsatisfied performance obligations were approximately $3.6 billion as of December 28, 2019, which includes $205.7 million of non-cancellable IPAA commitments from customers where actual product selection and quantities of specific products or services are to be determined by customers at a later date. We expect to recognize approximately 55% of the revenue included in the contracted but unsatisfied performance obligations, excluding non-cancellable IPAA commitments, over the next 12 months and the remainder thereafter.
Marketing and Sales
We generally market our products and provide services to existing and prospective customers through a direct sales force consisting of sales people and applications engineers. Applications engineers provide technical pre-sales and post-sales support for our products. Due to the complexity of many of our products and the system design process, the sales cycle is generally long, requiring three to six months or more. During the sales cycle, our direct sales force generally provides technical presentations, product demonstrations and support for on-site customer evaluation of our solutions. We also promote our products and services through advertising, marketing automation, trade shows, public relations and the internet. We selectively utilize value-added resellers to broaden our reach and reduce cost of sales. Our OrCAD products and certain Allegro products are primarily marketed through these channels. With respect to international sales, we generally market and support our products and services through our subsidiaries. We also use a third-party distributor to license our products and services to certain customers in Japan.
Research and Development
Our future performance depends on our ability to innovate, commercialize newly developed solutions and enhance and maintain our current products. The primary areas of our research and development align with our product categories discussed above. We must continuously re-engineer our products to solve new or increased physics challenges that arise with each successive process node and address the increase in complexity that is introduced by the resulting much larger designs. We must also keep pace with our customers’ technical developments, satisfy industry standards and meet our customers’ increasingly demanding performance, productivity, quality and predictability requirements. Therefore, we expect to continue to invest in research and development.
Hardware Manufacturing and Software Distribution
Our emulation and prototyping hardware, including all individual PCBs, custom ICs and FPGA-based prototyping components, is manufactured, assembled and tested by subcontractors before delivery to our customers. Software and documentation are primarily distributed to customers by secure electronic delivery, by way of the cloud or on DVD.
Proprietary Technology
Our success depends, in part, upon our proprietary technology. We generally rely on patents, copyrights, trademarks and trade secret laws, licenses and restrictive agreements to establish and protect our proprietary rights in technology and products. Many of our products include software or other IP licensed from third parties. We may have to seek new licenses or renew existing licenses for third-party software and other IP in the future. As part of performing engineering services for customers, our engineering services business uses certain software and other IP licensed from third parties, including that of our competitors.
Competition
We compete most frequently with Synopsys, Inc., Mentor Graphics Corporation, a division of Siemens AG, and ANSYS, Inc., and also with numerous other tools providers, manufacturers of electronic devices that have developed, acquired or have the capability to develop their own EDA products, technical software companies, electronics design and consulting companies, and other IP companies. These include Altium Limited, CEVA, Inc., Keysight Technologies, Inc. and Zuken Ltd.
Certain competitive factors in the engineering services business differ from those of the products businesses. While we compete with other EDA companies in the engineering services business, our principal competitors include independent engineering service businesses. Many of these companies are also customers, and therefore use our product offerings in the delivery of their services or products.
Corporate Information
We were organized as a Delaware corporation in June 1988. Our headquarters is located at 2655 Seely Avenue, San Jose, California 95134. Our telephone number is (408) 943-1234. We use our website at www.cadence.com to communicate important information about our company, including news releases and financial information. Our website permits investors to subscribe to email notification alerts when we post new material information on our website. We also make available on our investor relations webpage, free of charge, copies of our SEC filings and submissions, which can be found at the SEC’s website, www.sec.gov, as soon as reasonably practicable after electronically filing or furnishing such documents with the SEC. Stockholders may also request copies of these documents by writing to our Corporate Secretary at the address above. Information on our website is not incorporated by reference in this Annual Report on Form 10-K unless expressly noted.
Fiscal Year End
Our fiscal years are 52- or 53-week periods ending on the Saturday closest to December 31. Fiscal 2019, 2018 and 2017 were each 52-week fiscal years. Our next 53-week fiscal year will be fiscal 2020.
Employees
As of December 28, 2019, we had approximately 8,100 full-time employees.
INFORMATION ABOUT OUR EXECUTIVE OFFICERS
The following table provides information regarding our executive officers as of February 24, 2020:
| Name | Age | Positions and Offices | ||
| Lip-Bu Tan | 60 | Chief Executive Officer and Director | ||
| John M. Wall | 49 | Senior Vice President and Chief Financial Officer | ||
| Anirudh Devgan | 50 | President | ||
| Thomas P. Beckley | 62 | Senior Vice President, Research and Development | ||
| James J. Cowie | 55 | Senior Vice President, General Counsel and Secretary | ||
| Surendra Babu Mandava | 61 | Senior Vice President, Research and Development | ||
| Chin-Chi Teng | 54 | Senior Vice President, Research and Development | ||
| Neil Zaman | 51 | Senior Vice President, Worldwide Field Operations |
Our executive officers are appointed by the Board of Directors and serve at the discretion of the Board of Directors.
LIP-BU TAN has served as Chief Executive Officer of Cadence since January 2009. From January 2009 to November 2017, Mr. Tan also served as President of Cadence. Mr. Tan has been a member of the Cadence Board of Directors since February 2004. In 1987, Mr. Tan founded Walden International, an international venture capital firm, and has served as its Chairman since its founding. Mr. Tan serves as a director of Advanced Micro-Fabrication Equipment Inc. China (AMEC), Hewlett Packard Enterprise Company and Schneider Electric SE. Mr. Tan has a B.S. from Nanyang University in Singapore, an M.S. in nuclear engineering from the Massachusetts Institute of Technology and an M.B.A. from the University of San Francisco.
JOHN M. WALL has served as Senior Vice President and Chief Financial Officer of Cadence since October 2017. From October 2000 to September 2017, Mr. Wall held several positions at Cadence, most recently as Corporate Vice President and Corporate Controller from April 2016 to October 2017, Vice President, Finance and Operations, Worldwide Revenue Accounting and Sales Finance from 2015 to 2016 and Vice President, Finance and Operations, EMEA and Worldwide Revenue Accounting from 2005 to 2015. Mr. Wall has an NCBS from the Institute of Technology, Tralee and is a Fellow of the Association of Chartered Certified Accountants.
ANIRUDH DEVGAN has served as President of Cadence since November 2017. From May 2012 to November 2017, Dr. Devgan held several positions at Cadence, most recently as Executive Vice President, Research and Development from March 2017 to November 2017 and Senior Vice President, Research and Development from November 2013 to March 2017. Prior to joining Cadence, from May 2005 to March 2012, Dr. Devgan served as Corporate Vice President and General Manager of the Custom Design Business Unit at Magma Design Automation, Inc., an EDA company. Dr. Devgan has a B.Tech. in electrical engineering from the Indian Institute of Technology, Delhi, and an M.S. and Ph.D. in electrical and computer engineering from Carnegie Mellon University.
THOMAS P. BECKLEY has served as Senior Vice President, Research and Development of Cadence since September 2012. From April 2004 to September 2012, Mr. Beckley served as Corporate Vice President, Research and Development of Cadence. Prior to joining Cadence, Mr. Beckley served as President and Chief Executive Officer of Neolinear, Inc., a developer of auto-interactive and automated analog/RF tools and solutions for mixed-signal design that was acquired by Cadence in April 2004. Mr. Beckley has a B.S. in mathematics and physics from Kalamazoo College and an M.B.A. from Vanderbilt University.
JAMES J. COWIE has served as Senior Vice President and General Counsel of Cadence since April 2008 and Secretary of Cadence since May 2008. From August 2000 to March 2008, Mr. Cowie held several positions at Cadence, most recently as Corporate Vice President – Business Development, Associate General Counsel and Assistant Secretary. Mr. Cowie has an A.B. in economics from Duke University and a J.D. from Stanford Law School.
SURENDRA BABU MANDAVA has served as Senior Vice President, Research and Development of Cadence since January 2017. Prior to joining Cadence, Mr. Mandava served as Chief Executive Officer of Ineda Systems Inc., a low-power SoC solutions company, from November 2014 to July 2016, Vice President of Broadcom Corporation, a provider of semiconductor solutions, from November 2010 to December 2012, and President and then as Chief Executive Officer of Beceem Communications Inc., a semiconductor company, from December 2003 until it was acquired by Broadcom in November 2010. Mr. Mandava has a B.Tech. in electronics and communication engineering from the Regional Engineering College, Trichy, and a M.Tech. in electrical engineering and computer science from the Indian Institute of Technology, Kanpur.
CHIN-CHI TENG has served as Senior Vice President, Research and Development of Cadence since September 2018. From January 2002 to September 2018, Dr. Teng held several positions at Cadence, most recently as Corporate Vice President, Research and Development from June 2015 to September 2018, and Vice President, Research and Development from March 2009 to June 2015. Dr. Teng has a B.S. in electrical engineering from the National Taiwan University and a Ph.D. in electrical and computer engineering from the University of Illinois, Urbana-Champaign.
NEIL ZAMAN has served as Senior Vice President, Worldwide Field Operations of Cadence since September 2015. From October 1999 to September 2015, Mr. Zaman held several positions at Cadence, most recently as Corporate Vice President, North America Field Operations. Prior to joining Cadence, Mr. Zaman held positions at Phoenix Technologies Ltd. and IBM Corporation. Mr. Zaman has a B.S. in finance from California State University, Hayward.
Item 1A. Risk Factors
Our operations and financial results are subject to various risks and uncertainties, including those described in the sections below, that could adversely affect our business, financial condition, results of operations, cash flows, and the trading price of our common stock.
Risks Related to Our Business
Any periods of uncertainty in the global economy and international trade relations, and any potential downturn in the semiconductor and electronics industries, may negatively impact our business and reduce our bookings levels and revenue.
Purchases of our products and services are dependent upon the commencement of new design projects by IC manufacturers and electronics systems companies. The IC and electronics systems industries are cyclical and are characterized by constant and rapid technological change, rapid product obsolescence and price erosion, evolving standards, short product life cycles and wide fluctuations in product supply and demand.
The IC and electronics systems industries have also experienced significant downturns in connection with, or in anticipation of, maturing product cycles of both these industries’ and their customers’ products. Spending on our products and services has grown in recent years, but the current outlook for the semiconductor industry is uncertain and may result in a decrease in spending on our products and services.
Uncertainty about future political and economic conditions, adverse changes to international trade relationships between countries in which we do business or future decline in corporate or consumer spending could negatively impact our customers’ businesses, reducing the number of new chip designs and their overall research and development spending, including their spending on our products and services, and as a result decrease demand for our products and services. Decreased bookings for our products and services, customer bankruptcies, consolidation among our customers, or problems or delays with our hardware suppliers or with the supply or delivery of our hardware products could also adversely affect our ability to grow our business or adversely affect our future revenues and financial results. Our future business and financial results, including demand for our products and services, are subject to considerable uncertainty that could impact our stock price. If economic conditions or international trade relationships between countries in which we do business deteriorate in the future, or, in particular, if semiconductor or electronics systems industry revenues do not grow, the ability to export or import products or services by the semiconductor or electronics systems industry is adversely restricted, or our supplies of hardware components and products are subject to problems or delays, our future revenues and financial results could be adversely affected.
During fiscal 2019, the Bureau of Industry and Security (“BIS”) of the U.S. Department of Commerce placed certain entities who are our customers on the “Entity List,” limiting our ability to deliver products and services to these entities. When certain customers are on the Entity List, and in the absence of a license from the BIS, it will have a negative effect on our ability to sell products and provide services to these customers. Entity List restrictions will also encourage customers to seek substitute products from our competitors that are not subject to these restrictions or to develop their own solutions, thereby decreasing our long-term competitiveness. In addition, although customers are not prohibited from paying (and we are not restricted from collecting) for products we previously delivered to them, the credit risks associated with outstanding receivables from customers on the Entity List could increase as a result of these limitations.
We cannot predict whether or when any changes will be made that eliminate or decrease these limitations on our ability to sell products and provide services to these customers. We are unable to predict the duration of the export restrictions imposed with respect to any particular customer or the long-term effects on our business or our customers’ business. Additionally, other companies may be added to the Entity List and/or be subject to trade restrictions. In addition, there may be indirect impacts to our business which we cannot reasonably quantify, including that our business may also be impacted by other trade restrictions that may be imposed by the U.S., China, or other countries. Restrictions on our ability to sell and ship our products to customers on the Entity List have had, and may continue to have, an adverse effect on our business, results of operations or financial condition.
Customer consolidation could affect our operating results.
There has been a trend toward customer consolidation in the semiconductor industry through business combinations, including mergers, asset acquisitions and strategic partnerships. As this trend continues, it could make us more dependent on fewer customers who may be able to exert increased pressure on our prices and other contract terms and could increase the portion of our total sales concentration for any single customer. Customer consolidation activity could also reduce the demand for our products and services if such customers streamline research and development or operations, reduce purchases or delay purchasing decisions. These outcomes could negatively impact our operating results and financial condition.
Our failure to respond quickly to technological developments or customers’ increasing technological requirements could make our products uncompetitive and obsolete.
The industries in which we compete experience rapid technology developments, rapid changes in industry standards and customer requirements, and frequent introductions and improvements of new products. Currently, the industries we serve are experiencing the following trends:
| • | changes in the design and manufacturing of ICs, including migration to advanced-process nodes and three-dimensional transistors, such as FinFETs, present major challenges to the semiconductor industry, particularly in IC design, design automation, design of manufacturing equipment, and the manufacturing process itself. With migration to advanced-process nodes, the industry must adapt to more complex physics and manufacturing challenges such as the need to draw features on silicon that are many times smaller than the wavelength of light used to draw the features via lithography. Models of each component’s electrical properties and behavior also become more complex as do requisite analysis, design, verification and manufacturing capabilities. Novel design tools and methodologies must be invented and enhanced quickly to remain competitive in the design of electronics in the smallest nanometer ranges; |
| • | the ability to design SoCs increases the complexity of managing a design that, at the lowest level, is represented by billions of shapes on fabrication masks. In addition, SoCs typically incorporate microprocessors and DSPs that are programmed with software, requiring simultaneous design of the IC and the related software embedded on the IC; |
| • | with the availability of seemingly endless gate capacity, there is an increase in design reuse, or the combining of off-the-shelf design IP with custom logic to create ICs or SoCs. The unavailability of a broad range of high-quality design IP (including our own) that can be reliably incorporated into a customer’s design with our software products and services could lead to reduced demand for our products and services; |
| • | increased technological capability of the FPGA, which is a programmable logic chip, creates an alternative to IC implementation for some electronics companies. This could reduce demand for our IC implementation products and servic |
Showing the first 8K of 86K characters. Open the full section
Item 1B. Unresolved Staff Comments
None.
Item 2. Properties
We own land and buildings at our headquarters located in San Jose, California. We also own buildings in India. As of December 28, 2019, the total square footage of our owned buildings was approximately 1,010,000.
We lease additional facilities in the United States and various other countries. We may sublease certain of these facilities where space is not fully utilized.
We believe that these facilities are adequate for our current needs and that suitable additional or substitute space will be available as needed to accommodate any expansion of our operations.
Item 3. Legal Proceedings
From time to time, we are involved in various disputes and litigation that arise in the ordinary course of business. These include disputes and lawsuits related to intellectual property, indemnification obligations, mergers and acquisitions, licensing, contracts, distribution arrangements and employee relations matters. At least quarterly, we review the status of each significant matter and assess its potential financial exposure. If the potential loss from any claim or legal proceeding is considered probable and the amount or the range of loss can be estimated, we accrue a liability for the estimated loss. Legal proceedings are subject to uncertainties, and the outcomes are difficult to predict. Because of such uncertainties, accruals are based on our judgments using the best information available at the time. As additional information becomes available, we reassess the potential liability related to pending claims and litigation matters and may revise estimates.
Item 4. Mine Safety Disclosures
Not applicable.
PART II.
Item 5. Market for Registrant’s Common Equity, Related Stockholder Matters and Issuer Purchases of Equity Securities
Our common stock is traded on the Nasdaq Global Select Market under the symbol CDNS. As of February 1, 2020, we had 443 registered stockholders and approximately 100,000 beneficial owners of our common stock.
Stockholder Return Performance Graph
The following graph compares the cumulative 5-year total stockholder return on our common stock relative to the cumulative total return of the Nasdaq Composite Index, the S&P 500 Index and the S&P 500 Information Technology Index. The graph assumes that the value of the investment in our common stock and in each index on January 3, 2015 (including reinvestment of dividends) was $100 and tracks it each year thereafter on the last day of our fiscal year through December 28, 2019 and, for each index, on the last day of the calendar year.
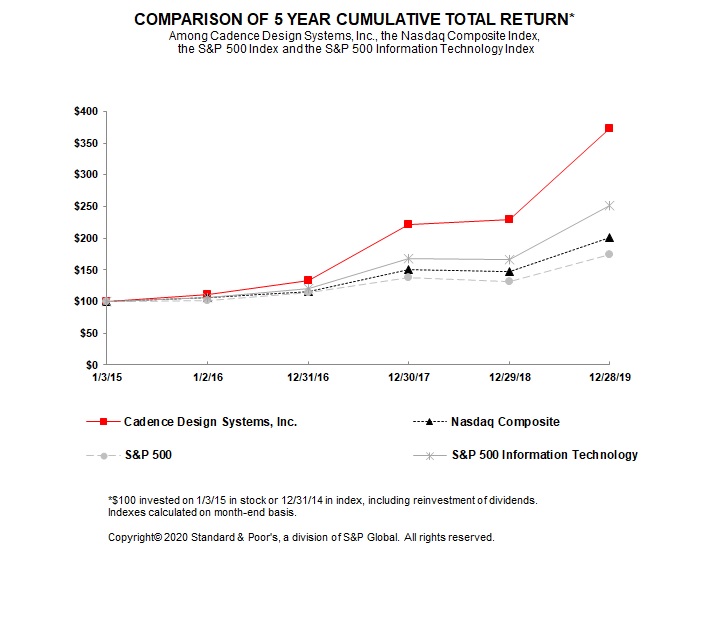
| 1/3/2015 | 1/2/2016 | 12/31/2016 | 12/30/2017 | 12/29/2018 | 12/28/2019 | |||||||||||||||||||
| Cadence Design Systems, Inc. | $ | 100.00 | $ | 110.52 | $ | 133.94 | $ | 222.09 | $ | 230.16 | $ | 373.29 | ||||||||||||
| Nasdaq Composite | 100.00 | 106.96 | 116.45 | 150.96 | 146.67 | 200.49 | ||||||||||||||||||
| S&P 500 | 100.00 | 101.38 | 113.51 | 138.29 | 132.23 | 173.86 | ||||||||||||||||||
| S&P 500 Information Technology | 100.00 | 105.92 | 120.59 | 167.42 | 166.94 | 250.89 |
The stock price performance included in this graph is not necessarily indicative of future stock price performance.
Issuer Purchases of Equity Securities
At the end of fiscal 2018, approximately $175 million remained available under our previously announced authorization to repurchase shares of our common stock. In February 2019, our Board of Directors authorized the repurchase of an additional $500 million. The actual timing and amount of repurchases are subject to business and market conditions, corporate and regulatory requirements, stock price, acquisition opportunities and other factors. As of December 28, 2019, $369 million remained available to repurchase shares of our common stock.
The following table presents repurchases made under our current authorization and shares surrendered by employees to satisfy income tax withholding obligations during the three months ended December 28, 2019:
| Period | Total Number of Shares Purchased (1) | Average Price Paid Per Share (2) | Total Number of Shares Purchased as Part of Publicly Announced Plan or Program | Maximum Dollar Value of Shares Authorized for Repurchase Under Publicly Announced Plan or Program (1) (In millions) | |||||||||
| September 29, 2019 – November 2, 2019 | 475,085 | $ | 65.68 | 431,348 | $ | 416 | |||||||
| November 3, 2019 – November 30, 2019 | 372,090 | $ | 67.26 | 347,411 | $ | 392 | |||||||
| December 1, 2019 – December 28, 2019 | 468,919 | $ | 67.78 | 343,329 | $ | 369 | |||||||
| Total | 1,316,094 | $ | 66.87 | 1,122,088 |
| (1) | Shares purchased that were not part of our publicly announced repurchase programs represent employee surrender of shares of restricted stock to satisfy employee income tax withholding obligations due upon vesting, and do not reduce the dollar value that may yet be purchased under our publicly announced repurchase programs. |
| (2) | The weighted average price paid per share of common stock does not include the cost of commissions. |
Item 6. Selected Financial Data-Unaudited
The following selected consolidated financial data should be read in conjunction with our consolidated financial statements and the notes thereto and the information contained in Item 7, “Management’s Discussion and Analysis of Financial Condition and Results of Operations.” Historical results are not necessarily indicative of future results. The notes below the table are provided for comparability purposes due to adoptions of accounting pronouncements or to describe significant transactions that may not occur frequently.
| 2019 | 2018 | 2017 | 2016 | 2015 | |||||||||||||||
| (In millions, except per share amounts) | |||||||||||||||||||
| Revenue (1) | $ | 2,336.3 | $ | 2,138.0 | $ | 1,943.0 | $ | 1,816.1 | $ | 1,702.1 | |||||||||
| Income from operations (1) | 491.8 | 396.2 | 324.0 | 244.9 | 285.4 | ||||||||||||||
| Net income (1) (2) (3) | 989.0 | 345.8 | 204.1 | 203.1 | 252.4 | ||||||||||||||
| Net income per share-diluted (1) (2) (3) | 3.53 | 1.23 | 0.73 | 0.70 | 0.81 | ||||||||||||||
| Total assets (3) | 3,357.2 | 2,468.7 | 2,418.7 | 2,096.9 | 2,345.5 | ||||||||||||||
| Debt (4) | 346.0 | 445.3 | 729.4 | 693.5 | 343.3 | ||||||||||||||
| Stockholders’ equity (5) (6) | 2,102.9 | 1,288.4 | 989.2 | 741.8 | 1,376.1 |
(1) On the first day of fiscal 2018, we adopted ASU 2014-09, “Revenue from Contracts with Customers (Topic 606),” which provided a new basis of accounting for our revenue arrangements. Because of the adoption, results of operations for fiscal 2019 and 2018 are not comparable to the results of operations for the other fiscal years presented in the table above.
(2) During fiscal 2017, we recorded a provisional income tax expense of $96.8 million related to the income tax effects of the Tax Act, which included $67.2 million related to the one-time transition tax on the mandatory deemed repatriation of foreign earnings. In accordance with SAB 118, we updated the one-time transition tax estimate to $65.8 million during fiscal 2018. We finalized our other fiscal 2017 provisional estimates without change during fiscal 2018.
(3) During fiscal 2019, we completed intercompany transfers of certain intangible property rights to our Irish subsidiary which resulted in the establishment of a net deferred tax asset and the recognition of an income tax benefit of $575.6 million.
(4) During fiscal 2018, we prepaid the outstanding principal balance and accrued interest on our $300.0 million 2019 Term Loan.
(5) During fiscal 2016, we repurchased shares of our common stock for a total cost of $960.3 million.
(6) We have never declared or paid any cash dividends on our common stock.
Item 7. Management’s Discussion and Analysis of Financial Condition and Results of Operations
The following discussion should be read in conjunction with the consolidated financial statements and notes thereto included elsewhere in this Annual Report on Form 10-K and with Part I, Item 1A, “Risk Factors.” Please refer to the cautionary language at the beginning of Part I of this Annual Report on Form 10-K regarding forward-looking statements.
Business Overview
We enable our customers to develop electronic products. Our products and services are designed to give our customers a competitive edge in their development of electronic devices and systems, SoCs, ICs and increasingly sophisticated manufactured products. Our products and services do this by optimizing performance, minimizing power consumption, shortening the time to bring our customers’ products to market and reducing their design, development and manufacturing costs. We offer software, hardware, services and reusable IC design blocks, which are commonly referred to as IP.
Our strategy, which we call Intelligent System Design™, is to provide the technologies necessary for our electronic system and semiconductor customers to develop electronic products across a variety of vertical markets including mobile, consumer, automotive, aerospace and defense, industrial and medical segments. Our products and services enable our customers to develop complex and innovative electronic products, so demand for our technology is driven by our customers’ investment in new designs and products. Historically, the industry that provided the tools used by IC engineers was referred to as EDA. Today, our offerings include and extend beyond EDA.
We combine our products and technologies into categories related to major design activities:
| • | Functional Verification, including Emulation and Prototyping Hardware; |
| • | Digital IC Design and Signoff; |
| • | Custom IC Design and Simulation; |
| • | System Interconnect and Analysis; and |
| • | IP. |
For additional information about our products, see the discussion in Item 1, “Business,” under the heading “Products and Product Strategy.”
On January 15, 2020, we completed our acquisition of AWR. On February 6, 2020, we also acquired Integrand Software. The aggregate cash consideration for these acquisitions of approximately $195 million will be allocated to the assets acquired and liabilities assumed based on their respective estimated fair values on the acquisition dates. These acquisitions enhance our technology portfolio to address growing RF/microwave design activity, driven by expanding use of 5G communications. We expect these acquisitions will result in more expenses, including amortization of acquired intangible assets, than revenue during fiscal 2020.
We have identified certain items that management uses as performance indicators to manage our business, including revenue, certain elements of operating expenses and cash flow from operations, and we describe these items further below under the headings “Results of Operations” and “Liquidity and Capital Resources.”
Results of Operations
The discussion of our fiscal 2019 consolidated results of operations include year-over-year comparisons versus fiscal 2018 for revenue, cost of revenue, operating expenses, other non-operating expenses, income taxes and cash flows. For a discussion of the fiscal 2018 changes compared to fiscal 2017, see the discussion in Item 7, “Management's Discussion and Analysis of Financial Condition and Results of Operations” in our Annual Report on Form 10-K for the fiscal year ended December 29, 2018, filed on February 27, 2019.
Results of operations for fiscal 2019, as compared to fiscal 2018, reflect the following:
| • | increased product and maintenance revenue resulting from overall growth in each geographic area, particularly in China and Other Asia; |
| • | increased IP revenue; |
| • | increased selling costs, including additional investment in technical sales support in response to our customers’ increasing technological requirements; and |
| • | continued investment in research and development activities focused on creating and enhancing our products; and |
| • | a non-cash tax benefit resulting from intercompany transfers of certain intangible property rights to our Irish subsidiary. |
Our fiscal years are 52- or 53-week periods ending on the Saturday closest to December 31. Fiscal 2019 and 2018 were each 52-week fiscal years. Fiscal 2020 will be a 53-week fiscal year.
Revenue
We primarily generate revenue from licensing our software and IP, selling or leasing our emulation and prototyping hardware technology, providing maintenance for our software, hardware and IP, providing engineering services and earning royalties generated from the use of our IP. The timing of our revenue is significantly affected by the mix of software, hardware and IP products generating revenue in any given period and whether the revenue is recognized over time or at a point in time, upon completion of delivery.
Between 85% and 90% of our revenue is characterized as recurring revenue. Revenue characterized as recurring includes revenue recognized over time from our software arrangements, services, royalties, maintenance on IP licenses and hardware, and operating leases of hardware and revenue recognized at varying points in time over the term of our IP Access Agreements.
The remainder of our revenue is characterized as up-front revenue. Up-front revenue is primarily generated by our sales of emulation and prototyping hardware and individual IP licenses. The percentage of our recurring and up-front revenue may be impacted by delivery of hardware and IP products to our customers in any single fiscal period.
Revenue by Year
The following table shows our revenue for fiscal 2019 and 2018 and the change in revenue between years:
| Change | ||||||||||||||
| 2019 | 2018 | 2019 vs. 2018 | ||||||||||||
| (In millions, except percentages) | ||||||||||||||
| Product and maintenance | $ | 2,204.6 | $ | 1,997.9 | $ | 206.7 | 10 | % | ||||||
| Services | 131.7 | 140.1 | (8.4 | ) | (6 | )% | ||||||||
| Total revenue | $ | 2,336.3 | $ | 2,138.0 | $ | 198.3 | 9 | % |
Product and maintenance revenue increased during fiscal 2019, as compared to fiscal 2018, primarily because of increased investments by our customers in new, complex designs for their products that include the design of electronic systems for AI, 5G networks, aerospace and defense, automotive, cloud data center and other market segments. This demand has resulted in revenue growth in each geographic area and each of our five product categories. Services revenue may fluctuate from period to period based on the timing of fulfillment of our services and IP performance obligations.
No one customer accounted for 10% or more of total revenue during fiscal 2019 or 2018.
Revenue by Product Category
The following table shows the percentage of product and related maintenance revenue contributed by each of our five product categories and services during fiscal 2019 and 2018:
| 2019 | 2018 | ||||
| Functional Verification, including hardware for emulation and prototyping | 23 | % | 24 | % | |
| Digital IC Design and Signoff | 30 | % | 29 | % | |
| Custom IC Design and Simulation | 25 | % | 26 | % | |
| System Interconnect and Analysis | 9 | % | 9 | % | |
| IP | 13 | % | 12 | % | |
| Total | 100 | % | 100 | % |
Revenue by product group fluctuates from period to period based on demand for our products and services and our available resources to deliver and support them. Certain of our licensing arrangements allow customers the ability to remix among software products. Additionally, we have arrangements with customers that include a combination of our products, with the actual product selection and number of licensed users to be determined at a later date. For these arrangements, we estimate the allocation of the revenue to product groups based upon the expected usage of our products. The actual usage of our products by these customers may differ and, if that proves to be the case, the revenue allocation in the table above would differ.
Revenue by Geography
| Change | ||||||||||||||
| 2019 | 2018 | 2019 vs. 2018 | ||||||||||||
| (In millions, except percentages) | ||||||||||||||
| United States | $ | 982.4 | $ | 924.6 | $ | 57.8 | 6 | % | ||||||
| Other Americas | 43.5 | 32.5 | 11.0 | 34 | % | |||||||||
| China | 241.5 | 210.2 | 31.3 | 15 | % | |||||||||
| Other Asia | 459.0 | 395.2 | 63.8 | 16 | % | |||||||||
| Europe, Middle East and Africa | 433.3 | 406.9 | 26.4 | 6 | % | |||||||||
| Japan | 176.6 | 168.6 | 8.0 | 5 | % | |||||||||
| Total revenue | $ | 2,336.3 | $ | 2,138.0 | $ | 198.3 | 9 | % |
For the primary factors contributing to the increase in revenue for each geographic area during fiscal 2019, as compared to fiscal 2018, see the general description under “Revenue by Year" above. Revenue in China increased during fiscal 2019, as compared to fiscal 2018, primarily due to an increase in revenue for IP, digital IC design and signoff, and system interconnect software products. Revenue growth in China slowed during the second half of fiscal 2019 because we were unable to deliver maintenance or support for certain customers in China due to the U.S. Department of Commerce’s designation of certain customers to the “Entity List.” We expect these restrictions will continue to impact revenue from certain customers in China in fiscal 2020.
Revenue by Geography as a Percent of Total Revenue
| 2019 | 2018 | ||||
| United States | 42 | % | 43 | % | |
| Other Americas | 2 | % | 2 | % | |
| China | 10 | % | 10 | % | |
| Other Asia | 20 | % | 18 | % | |
| Europe, Middle East and Africa | 18 | % | 19 | % | |
| Japan | 8 | % | 8 | % | |
| Total | 100 | % | 100 | % |
Most of our revenue is transacted in the United States dollar. However, certain revenue transactions are denominated in foreign currencies. For an additional description of how changes in foreign exchange rates affect our consolidated financial statements, see the discussion under Item 7A, “Quantitative and Qualitative Disclosures About Market Risk – Foreign Currency Risk.”
Cost of Revenue
| Change | ||||||||||||||
| 2019 | 2018 | 2019 vs. 2018 | ||||||||||||
| (In millions, except percentages) | ||||||||||||||
| Product and maintenance | $ | 189.1 | $ | 173.0 | $ | 16.1 | 9 | % | ||||||
| Services | 77.2 | 85.7 | (8.5 | ) | (10 | )% | ||||||||
| Total cost of revenue | $ | 266.3 | $ | 258.7 | $ | 7.6 | 3 | % |
The following table shows cost of revenue as a percentage of related revenue for fiscal 2019 and 2018:
| 2019 | 2018 | ||||
| Product and maintenance | 9 | % | 9 | % | |
| Services | 59 | % | 61 | % |
Cost of Product and Maintenance
Cost of product and maintenance includes costs associated with the sale and lease of our emulation and prototyping hardware and licensing of our software and IP products, certain employee salary and benefits and other employee-related costs, cost of our customer support services, amortization of technology-related and maintenance-related acquired intangibles, costs of technical documentation and royalties payable to third-party vendors. Costs associated with our emulation and prototyping hardware products include components, assembly, testing, applicable reserves and overhead. These costs make our cost of emulation and prototyping hardware products higher, as a percentage of revenue, than our cost of software and IP products.
A summary of cost of product and maintenance for fiscal 2019 and 2018 is as follows:
| Change | ||||||||||||||
| 2019 | 2018 | 2019 vs. 2018 | ||||||||||||
| (In millions, except percentages) | ||||||||||||||
| Product and maintenance-related costs | $ | 148.1 | $ | 133.8 | $ | 14.3 | 11 | % | ||||||
| Amortization of acquired intangibles | 41.0 | 39.2 | 1.8 | 5 | % | |||||||||
| Total cost of product and maintenance | $ | 189.1 | $ | 173.0 | $ | 16.1 | 9 | % |
Cost of product and maintenance depends primarily on our hardware product sales in any given period. Cost of product and maintenance is also affected by employee salary and benefits and other employee-related costs, reserves for inventory, as well as the timing and extent to which we acquire intangible assets, acquire or license third-parties’ IP or technology, and sell our products that include such acquired or licensed IP or technology.
The changes in product and maintenance-related costs were due to the following:
| Change | |||
| 2019 vs. 2018 | |||
| (In millions) | |||
| Emulation and prototyping hardware costs | $ | 12.6 | |
| Salary, benefits and other employee-related costs | 3.6 | ||
| Other items | (1.9 | ) | |
| Total change in product and maintenance-related costs | $ | 14.3 |
Costs of emulation and prototyping increased during fiscal 2019, as compared to fiscal 2018, primarily due to increased reserves for inventory and the mix of products generating revenue.
Cost of Services
Cost of services primarily includes employee salary, benefits and other employee-related costs to perform work on revenue-generating projects and costs to maintain the infrastructure necessary to manage a services organization. Cost of services may fluctuate from period to period based on our utilization of design services engineers on revenue-generating projects rather than internal development projects.
Operating Expenses
Our operating expenses include marketing and sales, research and development, and general and administrative expenses. Factors that tend to cause our operating expenses to fluctuate include changes in the number of employees due to hiring and acquisitions, foreign exchange rate movements, stock-based compensation, restructuring activities and the impact of our variable compensation programs that are driven by operating results.
Many of our operating expenses are transacted in various foreign currencies. We recognize lower expenses in periods when the United States dollar strengthens in value against other currencies and we recognize higher expenses when the United States dollar weakens against other currencies. For an additional description of how changes in foreign exchange rates affect our consolidated financial statements, see the discussion in Item 7A, “Quantitative and Qualitative Disclosures About Market Risk – Foreign Currency Risk.”
Our operating expenses for fiscal 2019 and 2018 were as follows:
| Change | ||||||||||||||
| 2019 | 2018 | 2019 vs. 2018 | ||||||||||||
| (In millions, except percentages) | ||||||||||||||
| Marketing and sales | $ | 481.7 | $ | 439.7 | $ | 42.0 | 10 | % | ||||||
| Research and development | 935.9 | 884.8 | 51.1 | 6 | % | |||||||||
| General and administrative | 139.8 | 133.4 | 6.4 | 5 | % | |||||||||
| Total operating expenses | $ | 1,557.4 | $ | 1,457.9 | $ | 99.5 | 7 | % |
Our operating expenses, as a percentage of total revenue, for fiscal 2019 and 2018 were as follows:
| 2019 | 2018 | ||||
| Marketing and sales | 21 | % | 21 | % | |
| Research and development | 40 | % | 41 | % | |
| General and administrative | 6 | % | 6 | % | |
| Total operating expenses | 67 | % | 68 | % |
Marketing and Sales
The changes in marketing and sales expense were due to the following:
| Change | |||
| 2019 vs. 2018 | |||
| (In millions) | |||
| Salary, benefits and other employee-related costs | $ | 30.6 | |
| Stock-based compensation | 4.4 | ||
| Travel and sales meetings | 2.8 | ||
| Facilities and other infrastructure costs | 2.4 | ||
| Other items | 1.8 | ||
| Total change in marketing and sales expense | $ | 42.0 |
Salary, benefits and other employee-related costs included in marketing and sales increased during fiscal 2019, as compared to fiscal 2018, primarily due to additional headcount as a result of hiring and an increase in employee incentive compensation.
Research and Development
The changes in research and development expense were due to the following:
| Change | |||
| 2019 vs. 2018 | |||
| (In millions) | |||
| Salary, benefits and other employee-related costs | $ | 33.6 | |
| Stock-based compensation | 10.3 | ||
| Depreciation | 4.3 | ||
| Product development costs | 3.3 | ||
| Other items | (0.4 | ) | |
| Total change in research and development expense | $ | 51.1 |
Costs included in research and development increased during fiscal 2019, as compared to fiscal 2018, primarily due to additional headcount as a result of hiring.
General and Administrative
The changes in general and administrative expense were due to the following:
| Change | |||
| 2019 vs. 2018 | |||
| (In millions) | |||
| Professional services | $ | 4.5 | |
| University endowment | 3.0 | ||
| Acquisition-related costs | 2.2 | ||
| Bad debt expense | (4.5 | ) | |
| Other items | 1.2 | ||
| Total change in general and administrative expense | $ | 6.4 |
Professional services included in general and administrative costs increased during fiscal 2019, as compared to fiscal 2018, primarily due to consulting fees related to an internal realignment of our international operating structure. For further discussion regarding the realignment of our international operating structure, see Note 6 in the notes to the consolidated financial statements.
Amortization of Acquired Intangibles
| Change | ||||||||||||||
| 2019 | 2018 | 2019 vs. 2018 | ||||||||||||
| (In millions, except percentages) | ||||||||||||||
| Amortization of acquired intangibles | $ | 12.1 | $ | 14.1 | $ | (2.0 | ) | (14 | )% |
The decrease in amortization of acquired intangibles was due to certain intangible assets becoming fully amortized during fiscal 2019 and 2018.
Restructuring and Other Charges
We have initiated restructuring plans in recent years to better align our resources with our business strategy. Because the restructuring charges and related benefits are derived from management’s estimates made during the formulation of the restructuring plans, based on then-currently available information, our restructuring plans may not achieve the benefits anticipated on the timetable or at the level contemplated. Additional actions, including further restructuring of our operations, may be required in the future.
The following table presents restructuring and other charges, net for our restructuring plans:
| 2019 | 2018 | ||||||
| (In millions) | |||||||
| Severance and benefits | $ | 8.6 | $ | 10.3 | |||
| Excess facilities | — | 0.8 | |||||
| Total | $ | 8.6 | $ | 11.1 |
For an additional description of our restructuring plans, see Note 13 in the notes to consolidated financial statements.
Interest Expense
Interest expense for fiscal 2019 and 2018 was comprised of the following:
| 2019 | 2018 | ||||||
| (In millions) | |||||||
| Contractual cash interest expense: | |||||||
| 2019 Term Loan | $ | — | $ | 5.3 | |||
| 2024 Notes | 15.3 | 15.3 | |||||
| Revolving credit facility | 2.4 | 1.1 | |||||
| Amortization of debt discount: | |||||||
| 2019 Term Loan | — | 0.2 | |||||
| 2024 Notes | 0.7 | 0.7 | |||||
| Other | 0.4 | 0.5 | |||||
| Total interest expense | $ | 18.8 | $ | 23.1 |
During fiscal 2018, we prepaid the outstanding principal balance and accrued interest on our $300.0 million 2019 Term Loan. For an additional description of our debt arrangements, see Note 3 in the notes to consolidated financial statements.
Income Taxes
The following table presents the provision (benefit) for income taxes and the effective tax rate for fiscal 2019 and 2018:
| 2019 | 2018 | ||||||
| (In millions, except percentages) | |||||||
| Provision (benefit) for income taxes | $ | (510.0 | ) | $ | 30.6 | ||
| Effective tax rate | (106.5 | )% | 8.1 | % |
During the fourth quarter of fiscal 2019, we completed intercompany transfers of certain intangible property rights to our Irish subsidiary, which resulted in the establishment of a net deferred tax asset and the recognition of an income tax benefit of $575.6 million. We expect to be able to realize the deferred tax asset in future periods and did not provide for a valuation allowance.
This income tax benefit was partially offset by the federal, state and foreign income taxes on our fiscal 2019 income. We also recognized $36.8 million of tax benefit related to stock-based compensation that vested or was exercised during the year.
Our provision for income taxes for fiscal 2018 primarily resulted from the federal, state and foreign income taxes on our fiscal 2018 income, partially offset by $21.3 million of tax benefit related to stock-based compensation that vested or was exercised during the year. During fiscal 2018, we finalized our fiscal 2017 deemed repatriation transition tax calculation and reduced our estimate from $67.2 million to $65.8 million. We finalized our other fiscal 2017 provisional estimates without change. For further discussion regarding our accounting for the Tax Act, see Note 6 in the notes to the consolidated financial statements.
Our future effective tax rates may be materially impacted by tax amounts associated with our foreign earnings at rates different from the United States federal statutory rate, research credits, the tax impact of stock-based compensation, accounting for uncertain tax positions, business combinations, closure of statutes of limitations or settlement of tax audits, changes in valuation allowance and changes in tax law. A significant amount of our foreign earnings is generated by our subsidiaries organized in Ireland and Hungary. Our future effective tax rates may be adversely affected if our earnings were to be lower in countries where we have lower statutory tax rates. We currently expect that our fiscal 2020 effective tax rate will be approximately 20%. We expect that our quarterly effective tax rates will vary from our fiscal 2020 effective tax rate as a result of recognizing the income tax effects of stock-based awards in the quarterly periods that the awards vest or are settled and other items that we cannot anticipate. For additional discussion about how our effective tax rate could be affected by various risks, see Part I, Item 1A, “Risk Factors.” For further discussion regarding our income taxes, see Note 6 in the notes to consolidated financial statements.
Liquidity and Capital Resources
| As of | Change | ||||||||||||||||||
| December 28, 2019 | December 29, 2018 | December 30, 2017 | 2019 vs. 2018 | 2018 vs. 2017 | |||||||||||||||
| (In millions) | |||||||||||||||||||
| Cash and cash equivalents | $ | 705.2 | $ | 533.3 | $ | 688.1 | $ | 171.9 | $ | (154.8 | ) | ||||||||
| Net working capital | 497.0 | 242.1 | 337.6 | 254.9 | (95.5 | ) |
Cash and Cash Equivalents
As of December 28, 2019, our principal sources of liquidity consisted of $705.2 million of cash and cash equivalents as compared to $533.3 million as of December 29, 2018.
Our primary sources of cash and cash equivalents during fiscal 2019 were cash generated from operations, proceeds from borrowings under our revolving credit facility, proceeds from the exercise of stock options and proceeds from stock purchases under our employee stock purchase plan.
Our primary uses of cash and cash equivalents during fiscal 2019 were payments related to salaries and benefits, operating expenses, repurchases of our common stock, payments on our revolving credit facility, purchases of property, plant and equipment and purchases of non-marketable investments.
Approximately 43% of our cash and cash equivalents were held by our foreign subsidiaries as of December 28, 2019. Our cash and cash equivalents held by our foreign subsidiaries may vary from period to period due to the timing of collections and repatriation of foreign earnings. We expect that current cash and cash equivalent balances, cash flows that are generated from operations and cash borrowings available under our revolving credit facility will be sufficient to meet our domestic and international working capital needs, and other capital and liquidity requirements, including acquisitions and share repurchases for at least the next 12 months.
Net Working Capital
Net working capital is comprised of current assets less current liabilities, as shown on our consolidated balance sheets. The increase in our net working capital as of December 28, 2019, as compared to December 29, 2018, is primarily due to improved results from operations, the timing of cash receipts from customers and disbursements made to vendors.
Cash Flows from Operating Activities
Cash flows from operating activities during fiscal 2019 and 2018 were as follows:
| Change | |||||||||||
| 2019 | 2018 | 2019 vs. 2018 | |||||||||
| (In millions) | |||||||||||
| Cash provided by operating activities | $ | 729.6 | $ | 604.8 | $ | 124.8 |
Cash flows from operating activities include net income, adjusted for certain non-cash items, as well as changes in the balances of certain assets and liabilities. Our cash flows from operating activities are significantly influenced by business levels and the payment terms set forth in our customer agreements. The increase in cash flows from operating activities during fiscal 2019, as compared to fiscal 2018, was primarily due to the improved results from operations and timing of cash receipts from customers and disbursements made to vendors.
Cash Flows from Investing Activities
Cash flows used for investing activities during fiscal 2019 and 2018 were as follows:
| Change | |||||||||||
| 2019 | 2018 | 2019 vs. 2018 | |||||||||
| (In millions) | |||||||||||
| Cash used for investing activities | $ | (105.7 | ) | $ | (173.8 | ) | $ | 68.1 |
The decrease in cash used for investing activities during fiscal 2019, as compared to fiscal 2018, was primarily due to a decrease in payments to acquire equity instruments of other entities. We expect to continue our investing activities, including purchasing property, plant and equipment, purchasing intangible assets, business combinations, purchasing software licenses, and making strategic investments. During the first quarter of fiscal 2020, we completed two business combinations for cash consideration of approximately $195 million, which will be classified as cash used for investing activities.
Cash Flows from Financing Activities
Cash flows used for financing activities during fiscal 2019 and 2018 were as follows:
| Change | |||||||||||
| 2019 | 2018 | 2019 vs. 2018 | |||||||||
| (In millions) | |||||||||||
| Cash used for financing activities | $ | (443.9 | ) | $ | (567.9 | ) | $ | 124.0 |
The decrease in cash used for financing activities during fiscal 2019, as compared to fiscal 2018, was primarily due to a decrease in net cash paid for debt arrangements, partially offset by an increase in payments for repurchases of our common stock.
Other Factors Affecting Liquidity and Capital Resources
Stock Repurchase Program
In February 2019, our Board of Directors authorized the repurchase of $500 million of our common stock. The actual timing and amount of future repurchases are subject to business and market conditions, corporate and regulatory requirements, stock price, acquisition opportunities and other factors. As of December 28, 2019, approximately $369.0 million remained available under this authorization. See Part II, Item 5, “Market for Registrant’s Common Equity, Related Stockholder Matters and Issuer Purchases of Equity Securities” for additional information.
Revolving Credit Facility
Our senior unsecured revolving credit facility provides for borrowings up to $350.0 million, with the right to request increased capacity up to an additional $250.0 million upon the receipt of lender commitments, for total maximum borrowings of $600.0 million. The credit facility expires on January 28, 2022 and currently has no subsidiary guarantors. Any outstanding loans drawn under the credit facility are due at maturity on January 28, 2022. Outstanding borrowings may be paid at any time prior to maturity. As of December 28, 2019, there were no borrowings outstanding under our revolving credit facility, and we were in compliance with all financial covenants associated with the revolving credit facility.
2024 Notes
In October 2014, we issued $350.0 million aggregate principal amount of 4.375% Senior Notes due October 15, 2024. We received net proceeds of $342.4 million from the issuance of the 2024 Notes, net of a discount of $1.4 million and issuance costs of $6.2 million. Interest is payable in cash semi-annually. The 2024 Notes are unsecured and rank equal in right of payment to all of our existing and future senior indebtedness. As of December 28, 2019, we were in compliance with all covenants associated with the 2024 Notes.
For additional information relating to our debt arrangements, see Note 3 in the notes to consolidated financial statements.
Contractual Obligations
A summary of our contractual obligations as of December 28, 2019 is as follows:
| Payments Due by Period | |||||||||||||||||||
| Total | Less Than 1 Year | 1-3 Years | 3-5 Years | More Than 5 Years | |||||||||||||||
| (In millions) | |||||||||||||||||||
| Operating lease obligations | $ | 124.8 | $ | 29.3 | $ | 50.1 | $ | 26.0 | $ | 19.4 | |||||||||
| Purchase obligations (1) | 42.7 | 20.3 | 16.5 | 5.6 | 0.3 | ||||||||||||||
| Long-term debt | 350.0 | — | — | 350.0 | — | ||||||||||||||
| Contractual interest payments | 77.6 | 15.8 | 31.2 | 30.6 | — | ||||||||||||||
| Current income tax payable | 9.5 | 9.5 | — | — | — | ||||||||||||||
| Other long-term contractual obligations (2) | 38.6 | — | 19.6 | 4.7 | 14.3 | ||||||||||||||
| Total | $ | 643.2 | $ | 74.9 | $ | 117.4 | $ | 416.9 | $ | 34.0 |
| (1) | With respect to purchase obligations that are cancelable by us, this table includes the amount that would have been payable if we had canceled the obligation as of December 28, 2019 or the earliest cancellation date. |
| (2) | Included in other long-term contractual obligations are long-term income tax liabilities of $18.7 million related to unrecognized tax benefits. Of the $18.7 million, we estimate $16.6 million will be paid or settled within 1 to 3 years, $2.0 million within 3 to 5 years and $0.1 million in more than 5 years. The remaining portion of other long-term contractual obligations is primarily liabilities associated with defined benefit retirement plans and acquisitions. |
Off-Balance Sheet Arrangements
As of December 28, 2019, we did not have any significant off-balance sheet arrangements, as defined in Item 303(a)(4)(ii) of SEC Regulation S-K.
Critical Accounting Estimates
In preparing our consolidated financial statements, we make assumptions, judgments and estimates that can have a significant impact on our revenue, operating income and net income, as well as on the value of certain assets and liabilities on our consolidated balance sheets. We base our assumptions, judgments and estimates on historical experience and various other factors that we believe to be reasonable under the circumstances. Actual results could differ materially from these estimates under different assumptions or conditions. At least quarterly, we evaluate our assumptions, judgments and estimates, and make changes as deemed necessary.
We believe that the assumptions, judgments and estimates involved in the accounting for income taxes, revenue recognition and business combinations have the greatest potential impact on our consolidated financial statements; therefore, we consider these to be our critical accounting estimates. For information on our significant accounting policies, see Note 2 in the notes to consolidated financial statements.
Accounting for Income Taxes
We are subject to income taxes in the United States and numerous foreign jurisdictions. Significant judgment is required in evaluating and estimating our provision for these taxes. There are many transactions that occur during the ordinary course of business for which the ultimate tax determination is uncertain. The Tax Act has provisions that require additional guidance on specific interpretations of the tax law changes. Our provision for income taxes could be adversely affected by our earnings being lower than anticipated in countries where we have lower statutory rates and higher than anticipated in countries where we have higher statutory rates, losses incurred in jurisdictions for which we are not able to realize the related tax benefit, changes in foreign currency exchange rates, entry into new businesses and geographies and changes to our existing businesses, acquisitions and investments, changes in our deferred tax assets and liabilities including changes in our assessment of valuation allowances, changes in the relevant tax laws or interpretations of these tax laws, and developments in current and future tax examinations.
We only recognize the tax benefit of an income tax position if we judge that it is more likely than not that the tax position will be sustained, solely on its technical merits, in a tax audit including resolution of any related appeals or litigation processes. To make this judgment, we must interpret complex and sometimes ambiguous tax laws, regulations and administrative practices. If we judge that an income tax position meets this recognition threshold, then we must measure the amount of the tax benefit to be recognized by estimating the largest amount of tax benefit that has a greater than 50% cumulative probability of being realized upon settlement with a taxing authority that has full knowledge of all of the relevant facts. It is inherently difficult and subjective to estimate such amounts, as this requires us to determine the probability of various possible settlement outcomes. We must reevaluate our income tax positions on a quarterly basis to consider factors such as changes in facts or circumstances, changes in tax law, effectively settled issues under audit, the lapse of applicable statute of limitations, and new audit activity. Such a change in recognition or measurement would result in recognition of a tax benefit or an additional charge to the tax provision. For a more detailed description of our unrecognized tax benefits, see Note 6 in the notes to consolidated financial statements.
During fiscal 2019, we completed intercompany transfers of certain intangible property rights to our Irish subsidiary, which resulted in the establishment of a deferred tax asset and the recognition of an income tax benefit of $575.6 million. To determine the value of the deferred tax asset, we were required to make significant estimates in determining the fair value of the transferred IP rights. These estimates included, but are not limited to, the income and cash flows that the IP rights are expected to generate in the future, the appropriate discount rate to apply to the income and cash flow projections, and the useful lives of the IP rights. These estimates are inherently uncertain and unpredictable, and if different estimates were used, it would impact the fair value of the IP rights and the related value of the deferred tax asset and the income tax benefit recognized in fiscal 2019 and in future periods when the deferred tax asset is realized. In addition, we reviewed the need to establish a valuation allowance on the deferred tax asset of $575.6 million by evaluating whether there is a greater than 50% likelihood that some portion or all of the deferred tax asset will not be realized. To make this judgment, we must make significant estimates and predictions of the amount and category of future taxable income from various sources and weigh all available positive and negative evidence about these possible sources of taxable income. We give greater weight to evidence that can be objectively verified. Based on our evaluation and weighting of the positive and negative evidence, we concluded that it is greater than 50% likely that the deferred tax asset of $575.6 million will be realized in future periods and that a valuation allowance was not currently required. If, in the future, we evaluate that this deferred tax asset is not likely to be realized, an increase in the related valuation allowance could result in a material income tax expense in the period such determination is made.
Revenue Recognition
Our contracts with customers often include promises to transfer multiple software and/or IP licenses, hardware and services, including professional services, technical support services, and rights to unspecified updates to a customer. Determining whether licenses and services are distinct performance obligations that should be accounted for separately, or not distinct and thus accounted for together, requires significant judgment. In some arrangements, such as most of our IP license arrangements, we have concluded that the licenses and associated services are distinct from each other. In other arrangements, like our time-based software arrangements, the licenses and certain services are not distinct from each other. Our time-based software arrangements include multiple software licenses and updates to the licensed software products, as well as technical support, and we have concluded that these promised goods and services are a single, combined performance obligation.
Judgment is required to determine the stand-alone selling prices (“SSPs”) for each distinct performance obligation. We rarely license or sell products on a standalone basis, so we are required to estimate the SSP for each performance obligation. In instances where the SSP is not directly observable because we do not sell the license, product or service separately, we determine the SSP using information that may include market conditions and other observable inputs. We typically have more than one SSP for individual performance obligations due to the stratification of those items by classes of customers and circumstances. In these instances, we may use information such as the size of the customer and geographic region of the customer in determining the SSP.
Revenue is recognized over time for our combined performance obligations that include software licenses, updates, and technical support as well as for maintenance and professional services that are separate performance obligations. For our professional services, revenue is recognized over time, generally using costs incurred or hours expended to measure progress. Judgment is required in estimating project status and the costs necessary to complete projects. A number of internal and external factors can affect these estimates, including labor rates, utilization and efficiency variances and specification and testing requirement changes. For our other performance obligations recognized over time, revenue is generally recognized using a time-based measure of progress reflecting generally consistent efforts to satisfy those performance obligations throughout the arrangement term.
If a group of agreements are so closely related that they are, in effect, part of a single arrangement, such agreements are deemed to be one arrangement for revenue recognition purposes. We exercise significant judgment to evaluate the relevant facts and circumstances in determining whether the separate agreements should be accounted for separately or as, in substance, a single arrangement. Our judgments about whether a group of contracts comprise a single arrangement can affect the allocation of consideration to the distinct performance obligations, which could have an effect on results of operations for the periods involved.
We are required to estimate the total consideration expected to be received from contracts with customers. In some circumstances, the consideration expected to be received is variable based on the specific terms of the contract or based on our expectations of the term of the contract. Generally, we have not experienced significant returns or refunds to customers. These estimates require significant judgment and the change in these estimates could have an effect on our results of operations during the periods involved.
Business Combinations
When we acquire businesses, we allocate the purchase price to the acquired tangible assets and assumed liabilities, including deferred revenue, liabilities associated with the fair value of contingent consideration and acquired identifiable intangible assets. Any residual purchase price is recorded as goodwill. The allocation of the purchase price requires us to make significant estimates in determining the fair values of these acquired assets and assumed liabilities, especially with respect to intangible assets and goodwill. These estimates are based on information obtained from management of the acquired companies, our assessment of this information, and historical experience. These estimates can include, but are not limited to, the cash flows that an acquired business is expected to generate in the future, the cash flows that specific assets acquired with that business are expected to generate in the future, the appropriate weighted-average cost of capital, and the cost savings expected to be derived from acquiring an asset. These estimates are inherently uncertain and unpredictable, and if different estimates were used, the purchase price for the acquisition could be allocated to the acquired assets and assumed liabilities differently from the allocation that we have made to the acquired assets and assumed liabilities. In addition, unanticipated events and circumstances may occur that may affect the accuracy or validity of such estimates, and if such events occur, we may be required to adjust the value allocated to acquired assets or assumed liabilities.
We also make significant judgments and estimates when we assign useful lives to the definite-lived intangible assets identified as part of our acquisitions. These estimates are inherently uncertain and if we used different estimates, the useful life over which we amortize intangible assets would be different. In addition, unanticipated events and circumstances may occur that may impact the useful life assigned to our intangible assets, which would impact our amortization of intangible assets expense and our results of operations.
New Accounting Standards
Credit Losses
In June 2016, the FASB issued ASU 2016-13, “Measurement of Credit Losses on Financial Instruments,” which supersedes current guidance requiring recognition of credit losses when it is probable that a loss has been incurred. The new standard requires the establishment of an allowance for estimated credit losses on financial assets, including trade and other receivables, at each reporting date. The new standard will result in earlier recognition of allowances for losses on trade and other receivables and other contractual rights to receive cash. The new standard is effective for us in the first quarter of fiscal 2020. The adoption of this standard will not have a significant impact on our consolidated financial statements or the related disclosures.
Goodwill Impairment
In January 2017, the FASB issued ASU 2017-04, “Simplifying the Test for Goodwill Impairment,” that eliminates “Step 2” from the goodwill impairment test. The new standard is effective for us in the first quarter of fiscal 2020. The new guidance must be applied on a prospective basis. The adoption of this standard will not have a significant impact on our consolidated financial statements or the related disclosures.
Fair Value Measurements
In August 2018, the FASB issued ASU 2018-13, “Disclosure Framework — Changes to the Disclosure Requirements for Fair Value Measurement,” which modifies the disclosure requirements on fair value measurements. The new standard is effective for us in the first quarter of fiscal 2020. The adoption of this standard will not have a significant impact on our consolidated financial statements or the related disclosures.
Implementation Costs Incurred in a Cloud Computing Arrangement
In August 2018, the FASB issued ASU 2018-15, “Customer’s Accounting for Implementation Costs Incurred in a Cloud Computing Arrangement That Is a Service Contract,” which clarifies the accounting for implementation costs in cloud computing arrangements. The new standard aligns the treatment of implementation costs incurred by customers in cloud computing arrangements that are service contracts with the treatment of similar costs incurred to develop or obtain internal-use software. Under the new standard, implementation costs are deferred and presented in the same line item as a prepayment of related arrangement fees. The deferred costs are recognized over the term of the arrangement in the same line item as the related fees of the arrangement. The new standard is effective for us in the first quarter of fiscal 2020 and will be applied prospectively to costs incurred after the date of adoption. The adoption of this standard will not have a significant impact on our consolidated financial statements or the related disclosures.
Accounting for Income Taxes
In December 2019, the FASB issued ASU 2019-12, “Simplifying the Accounting for Income Taxes,” which simplifies the accounting for income taxes, eliminates certain exceptions within ASC 740, Income Taxes, and clarifies certain aspects of the current guidance to promote consistency among reporting entities. The new standard is effective for fiscal years beginning after December 15, 2021. Most amendments within the standard are required to be applied on a prospective basis, while certain amendments must be applied on a retrospective or modified retrospective basis. We are currently evaluating the impacts of the provisions of this standard on our financial condition, results of operations and cash flows.
Item 7A. Quantitative and Qualitative Disclosures About Market Risk
Foreign Currency Risk
A material portion of our revenue, expenses and business activities are transacted in the U.S. dollar. In certain foreign countries where we price our products and services in U.S. dollars, a decrease in value of the local currency relative to the U.S. dollar results in an increase in the prices for our products and services compared to those products of our competitors that are priced in local currency. This could result in our prices being uncompetitive in certain markets.
In certain countries where we may invoice customers in the local currency, our revenues benefit from a weaker dollar and are adversely affected by a stronger dollar. The opposite impact occurs in countries where we record expenses in local currencies. In those cases, our costs and expenses benefit from a stronger dollar and are adversely affected by a weaker dollar. The fluctuations in our operating expenses outside the United States resulting from volatility in foreign exchange rates are not generally moderated by corresponding fluctuations in revenues from existing contracts.
We enter into foreign currency forward exchange contracts to protect against currency exchange risks associated with existing assets and liabilities. A foreign currency forward exchange contract acts as a hedge by increasing in value when underlying assets decrease in value or underlying liabilities increase in value due to changes in foreign exchange rates. Conversely, a foreign currency forward exchange contract decreases in value when underlying assets increase in value or underlying liabilities decrease in value due to changes in foreign exchange rates. These forward contracts are not designated as accounting hedges, so the unrealized gains and losses are recognized in other income, net, in advance of the actual foreign currency cash flows with the fair value of these forward contracts being recorded as accrued liabilities or other current assets.
We do not use forward contracts for trading purposes. Our forward contracts generally have maturities of 90 days or less. We enter into foreign currency forward exchange contracts based on estimated future asset and liability exposures, and the effectiveness of our hedging program depends on our ability to estimate these future asset and liability exposures. Recognized gains and losses with respect to our current hedging activities will ultimately depend on how accurately we are able to match the amount of foreign currency forward exchange contracts with actual underlying asset and liability exposures.
The following table provides information about our foreign currency forward exchange contracts as of December 28, 2019. The information is provided in United States dollar equivalent amounts. The table presents the notional amounts, at contract exchange rates, and the weighted average contractual foreign currency exchange rates expressed as units of the foreign currency per United States dollar, which in some cases may not be the market convention for quoting a particular currency. All of these forward contracts matured during February 2020.
| Notional Principal | Weighted Average Contract Rate | |||||
| (In millions) | ||||||
| Forward Contracts: | ||||||
| European Union euro | $ | 124.6 | 0.90 | |||
| British pound | 84.9 | 0.77 | ||||
| Israeli shekel | 69.4 | 3.48 | ||||
| Japanese yen | 35.8 | 108.94 | ||||
| Swedish krona | 32.5 | 9.55 | ||||
| Chinese renminbi | 30.7 | 7.02 | ||||
| Indian rupee | 24.4 | 72.16 | ||||
| Taiwan dollar | 10.0 | 30.14 | ||||
| Singapore dollar | 7.4 | 1.36 | ||||
| Other | 5.6 | N/A | ||||
| Total | $ | 425.3 | ||||
| Estimated fair value | $ | 3.6 |
We actively monitor our foreign currency risks, but our foreign currency hedging activities may not substantially offset the impact of fluctuations in currency exchange rates on our results of operations, cash flows and financial position.
Interest Rate Risk
Our exposure to market risk for changes in interest rates relates primarily to our portfolio of cash and cash equivalents and balances outstanding on our revolving credit facility, if any. We are exposed to interest rate fluctuations in many of the world’s leading industrialized countries, but our interest income and expense is most sensitive to fluctuations in the general level of United States interest rates. In this regard, changes in United States interest rates affect the interest earned on our cash and cash equivalents and the costs associated with foreign currency hedges.
All highly liquid securities with a maturity of three months or less at the date of purchase are considered to be cash equivalents. The carrying value of our interest-bearing instruments approximated fair value as of December 28, 2019.
Interest rates under our revolving credit facility are variable, so interest expense could be adversely affected by changes in interest rates, particularly for periods when we maintain a balance outstanding under the revolving credit facility. Interest rates for our revolving credit facility can fluctuate based on changes in market interest rates and in an interest rate margin that varies based on our consolidated leverage ratio. As of December 28, 2019, there were no borrowings outstanding under our revolving credit facility. For an additional description of the revolving credit facility, see Note 3 in the notes to consolidated financial statements.
Equity Price Risk
Equity Investments
We have a portfolio of equity investments that includes marketable equity securities and non-marketable investments. Our equity investments are made primarily in connection with our strategic investment program. Under our strategic investment program, from time to time, we make cash investments in companies with technologies that are potentially strategically important to us. See Note 8 in the notes to consolidated financial statements for an additional description of these investments.
Item 8. Financial Statements and Supplementary Data
The financial statements required by Item 8 are submitted as a separate section of this Annual Report on Form 10-K. See Part IV, Item 15, “Exhibits and Financial Statement Schedules.”
Summary Quarterly Data-Unaudited
| 2019 | 2018 | |||||||||||||||||||||||||||||||
| 4th | 3rd | 2nd | 1st | 4th | 3rd | 2nd | 1st | |||||||||||||||||||||||||
| (In thousands, except per share amounts) | ||||||||||||||||||||||||||||||||
| Revenue | $ | 599,555 | $ | 579,603 | $ | 580,419 | $ | 576,742 | $ | 569,850 | $ | 532,468 | $ | 518,391 | $ | 517,313 | ||||||||||||||||
| Cost of revenue | 73,328 | 60,975 | 61,469 | 70,585 | 76,124 | 60,454 | 58,960 | 63,209 | ||||||||||||||||||||||||
| Net income (1) | 659,675 | 101,514 | 107,235 | 120,555 | 98,425 | 99,318 | 75,149 | 72,885 | ||||||||||||||||||||||||
| Net income per share –basic (1) | 2.41 | 0.37 | 0.39 | 0.44 | 0.36 | 0.36 | 0.27 | 0.27 | ||||||||||||||||||||||||
| Net income per share –diluted (1) | 2.36 | 0.36 | 0.38 | 0.43 | 0.35 | 0.35 | 0.27 | 0.26 |
(1) During the fourth quarter of fiscal 2019, we completed intercompany transfers of certain intangible property rights to our Irish subsidiary, which resulted in the establishment of a net deferred tax asset and the recognition of an income tax benefit of $575.6 million. For further discussion regarding the realignment of our international operating structure, see Note 6 in the notes to the consolidated financial statements.
Item 9. Changes in and Disagreements With Accountants on Accounting and Financial Disclosure
None.
Item 9A. Controls and Procedures
Evaluation of Disclosure Controls and Procedures
As required by Rule 13a-15 of the Securities Exchange Act of 1934, as amended (the “Exchange Act”) under the supervision and with the participation of our management, including our Chief Executive Officer (“CEO”) and our Chief Financial Officer (“CFO”), we evaluated the effectiveness of the design and operation of our disclosure controls and procedures (as defined in Rules 13a-15(e) and 15d-15(e) under the Exchange Act) as of December 28, 2019.
The evaluation of our disclosure controls and procedures included a review of our processes and the effect on the information generated for use in this Annual Report on Form 10-K. In the course of this evaluation, we sought to identify any material weaknesses in our disclosure controls and procedures, to determine whether we had identified any acts of fraud involving personnel who have a significant role in our disclosure controls and procedures, and to confirm that any necessary corrective action, including process improvements, was taken. This type of evaluation is done every fiscal quarter so that our conclusions concerning the effectiveness of these controls can be reported in our periodic reports filed with the SEC. The overall goals of these evaluation activities are to monitor our disclosure controls and procedures and to make modifications as necessary. We intend to maintain these disclosure controls and procedures, modifying them as circumstances warrant.
Based on their evaluation as of December 28, 2019, our CEO and CFO have concluded that our disclosure controls and procedures were effective to provide reasonable assurance that the information required to be disclosed by us in our reports filed or submitted under the Exchange Act is recorded, processed, summarized and reported within the time periods specified in the SEC’s rules and forms and is accumulated and communicated to our management, including the CEO and CFO, as appropriate to allow timely decisions regarding required disclosure.
Changes in Internal Control Over Financial Reporting
There were no changes in our internal control over financial reporting during the fiscal quarter ended December 28, 2019 that materially affected, or are reasonably likely to materially affect, our internal control over financial reporting.
Inherent Limitations on Effectiveness of Controls
Our management, including our CEO and CFO, does not expect that our disclosure controls and procedures or our internal control over financial reporting will prevent or detect all errors and all fraud. Internal control over financial reporting, no matter how well conceived and operated, can provide only reasonable, not absolute, assurance that the objectives of internal control are met. Further, the design of internal control must reflect the fact that there are resource constraints, and the benefits of the control must be considered relative to their costs. While our disclosure controls and procedures and internal control over financial reporting are designed to provide reasonable assurance of their effectiveness, because of the inherent limitations in all control systems, no evaluation of controls can provide absolute assurance that all control issues and instances of fraud, if any, within Cadence, have been detected.
Management’s Report on Internal Control Over Financial Reporting
Our management is responsible for establishing and maintaining adequate internal control over financial reporting (as defined in Rule 13a-15(f) under the Exchange Act). Our management assessed the effectiveness of our internal control over financial reporting as of December 28, 2019. In making this assessment, our management used the criteria established in Internal Control-Integrated Framework (2013) issued by the Committee of Sponsoring Organizations of the Treadway Commission (“COSO”). Our management has concluded that, as of December 28, 2019, our internal control over financial reporting is effective based on these criteria. Our independent registered public accounting firm, KPMG LLP, has issued an attestation report on our internal control over financial reporting, which is included in Part IV, Item 15, “Exhibits and Financial Statement Schedules.”
Item 9B. Other Information
None.
PART III.
Item 10. Directors, Executive Officers and Corporate Governance
The information required by Item 10 as to directors is incorporated herein by reference from the sections entitled “Proposal 1 - Election of Directors” and “Security Ownership of Certain Beneficial Owners and Management - Delinquent Section 16(a) Reports” in Cadence’s definitive proxy statement for its 2020 Annual Meeting of Stockholders. The executive officers of Cadence are listed at the end of Item 1 of Part I of this Annual Report on Form 10-K.
The information required by Item 10 as to Cadence’s code of ethics is incorporated herein by reference from the section entitled “Corporate Governance - Code of Business Conduct” in Cadence’s definitive proxy statement for its 2020 Annual Meeting of Stockholders.
The information required by Item 10 as to the director nomination process and Cadence’s Audit Committee is incorporated by reference from the section entitled “Board of Directors - Committees of the Board” in Cadence’s definitive proxy statement for its 2020 Annual Meeting of Stockholders.
Item 11. Executive Compensation
The information required by Item 11 is incorporated herein by reference from the sections entitled “Board of Directors - Components of Director Compensation,” “Board of Directors - Director Compensation for Fiscal 2019,” “Compensation Discussion and Analysis,” “Compensation Committee Report,” “Compensation Committee Interlocks and Insider Participation,” “Compensation of Executive Officers,” “Potential Payments Upon Termination or Change In Control,” and “Pay Ratio Disclosure” in Cadence’s definitive proxy statement for its 2020 Annual Meeting of Stockholders.
Item 12. Security Ownership of Certain Beneficial Owners and Management and Related Stockholder Matters
The information required by Item 12 is incorporated herein by reference from the sections entitled “Security Ownership of Certain Beneficial Owners and Management” and “Equity Compensation Plan Information” in Cadence’s definitive proxy statement for its 2020 Annual Meeting of Stockholders.
Item 13. Certain Relationships and Related Transactions and Director Independence
The information required by Item 13 is incorporated herein by reference from the sections entitled “Certain Transactions” and “Board of Directors - Director Independence” in Cadence’s definitive proxy statement for its 2020 Annual Meeting of Stockholders.
Item 14. Principal Accountant Fees and Services
The information required by Item 14 is incorporated herein by reference from the section entitled “Fees Billed to Cadence by KPMG LLP During Fiscal 2019 and 2018” in Cadence’s definitive proxy statement for its 2020 Annual Meeting of Stockholders.
PART IV.
Item 15. Exhibits and Financial Statement Schedules
| Page | ||
| (a) 1. Financial Statements | ||
| Report of Independent Registered Public Accounting Firm | 43 | |
| Consolidated Balance Sheets as of December 28, 2019 and December 29, 2018 | 46 | |
| Consolidated Income Statements for the three fiscal years ended December 28, 2019 | 47 | |
| Consolidated Statements of Comprehensive Income for the three fiscal years ended December 28, 2019 | 48 | |
| Consolidated Statements of Stockholders’ Equity for the three fiscal years ended December 28, 2019 | 49 | |
| Consolidated Statements of Cash Flows for the three fiscal years ended December 28, 2019 | 50 | |
| Notes to Consolidated Financial Statements | 51 | |
| (a) 2. Financial Statement Schedules | ||
| All financial statement schedules are omitted because they are not applicable, not required or the required information is shown in the consolidated financial statements or notes thereto. | ||
| (a) 3. Exhibits | 80 | |
The exhibits listed in the accompanying Exhibit Index are filed or incorporated by reference as part of this Annual Report on Form 10-K.
The exhibits filed or incorporated by reference as part of this Annual Report on Form 10-K contain agreements to which Cadence is a party. These agreements are included to provide information regarding their terms and are not intended to provide any other factual or disclosure information about Cadence or the other parties to the agreements. Certain of the agreements contain representations and warranties by each of the parties to the applicable agreement, and any such representations and warranties have been made solely for the benefit of the other parties to the applicable agreement as of specified dates, may apply materiality standards that are different than those applied by investors, and may be subject to important qualifications and limitations that are not necessarily reflected in the agreement. Accordingly, these representations and warranties may not describe the actual state of affairs as of the date they were made or at any other time, and should not be relied upon as statements of factual information.
_____________
© 2020 Cadence Design Systems, Inc. All rights reserved worldwide. Cadence, the Cadence logo, and the other Cadence marks found at www.cadence.com/go/trademarks are trademarks or registered trademarks of Cadence Design Systems, Inc. All other trademarks are the property of their respective holders.
Report of Independent Registered Public Accounting Firm
To the Stockholders and Board of Directors
Cadence Design Systems, Inc.:
Opinions on the Consolidated Financial Statements and Internal Control Over Financial Reporting
We have audited the accompanying consolidated balance sheets of Cadence Design Systems, Inc. and subsidiaries (the Company) as of December 28, 2019 and December 29, 2018, the related consolidated income statements, statements of comprehensive income, stockholders’ equity, and cash flows for each of the years in the three-year period ended December 28, 2019, and the related notes (collectively, the consolidated financial statements). We also have audited the Company’s internal control over financial reporting as of December 28, 2019, based on criteria established in Internal Control – Integrated Framework (2013) issued by the Committee of Sponsoring Organizations of the Treadway Commission.
In our opinion, the consolidated financial statements referred to above present fairly, in all material respects, the financial position of the Company as of December 28, 2019 and December 29, 2018, and the results of its operations and its cash flows for each of the years in the three-year period ended December 28, 2019, in conformity with U.S. generally accepted accounting principles. Also in our opinion, the Company maintained, in all material respects, effective internal control over financial reporting as of December 28, 2019 based on criteria established in Internal Control – Integrated Framework (2013) issued by the Committee of Sponsoring Organizations of the Treadway Commission.
Change in Accounting Principle
As discussed in Note 2 to the consolidated financial statements, the Company changed its method of accounting for leases as of December 30, 2018, due to the adoption of Financial Accounting Standards Board (“FASB”) Accounting Standards Update (ASU) 2016-02, Leases, and changed its method of accounting for revenue recognition as of December 31, 2017, due to the adoption of FASB ASU 2014-09, Revenue from Contracts with Customers.
Basis for Opinions
The Company’s management is responsible for these consolidated financial statements, for maintaining effective internal control over financial reporting, and for its assessment of the effectiveness of internal control over financial reporting, included in the accompanying Management’s Report on Internal Control Over Financial Reporting included in Item 9A. Our responsibility is to express an opinion on the Company’s consolidated financial statements and an opinion on the Company’s internal control over financial reporting based on our audits. We are a public accounting firm registered with the Public Company Accounting Oversight Board (United States) (PCAOB) and are required to be independent with respect to the Company in accordance with the U.S. federal securities laws and the applicable rules and regulations of the Securities and Exchange Commission and the PCAOB.
We conducted our audits in accordance with the standards of the PCAOB. Those standards require that we plan and perform the audits to obtain reasonable assurance about whether the consolidated financial statements are free of material misstatement, whether due to error or fraud, and whether effective internal control over financial reporting was maintained in all material respects.
Our audits of the consolidated financial statements included performing procedures to assess the risks of material misstatement of the consolidated financial statements, whether due to error or fraud, and performing procedures that respond to those risks. Such procedures included examining, on a test basis, evidence regarding the amounts and disclosures in the consolidated financial statements. Our audits also included evaluating the accounting principles used and significant estimates made by management, as well as evaluating the overall presentation of the consolidated financial statements. Our audit of internal control over financial reporting included obtaining an understanding of internal control over financial reporting, assessing the risk that a material weakness exists, and testing and evaluating the design and operating effectiveness of internal control based on the assessed risk. Our audits also included performing such other procedures as we considered necessary in the circumstances. We believe that our audits provide a reasonable basis for our opinions.
Definition and Limitations of Internal Control Over Financial Reporting
A company’s internal control over financial reporting is a process designed to provide reasonable assurance regarding the reliability of financial reporting and the preparation of financial statements for external purposes in acco
Showing the first 8K of 168K characters. Open the full section
Item 16. Form 10-K Summary
Not applicable.
SIGNATURES
Pursuant to the requirements of Section 13 or 15(d) of the Securities Exchange Act of 1934, the registrant has duly caused this report to be signed on its behalf by the undersigned, thereunto duly authorized.
| CADENCE DESIGN SYSTEMS, INC. | |
| /s/ Lip-Bu Tan | |
| Lip-Bu Tan | |
| Chief Executive Officer and Director | |
| Dated: | February 24, 2020 |
Pursuant to the requirements of the Securities Exchange Act of 1934, this report has been signed below by the following persons on behalf of the registrant and in the capacities and on the dates indicated.
| /s/ Lip-Bu Tan | DATE: | February 24, 2020 |
| Lip-Bu Tan | ||
| Chief Executive Officer and Director | ||
| /s/ John M. Wall | DATE: | February 24, 2020 |
| John M. Wall | ||
| Senior Vice President and Chief Financial Officer |
POWER OF ATTORNEY
KNOW ALL PERSONS BY THESE PRESENTS, that each person whose signature appears below constitutes and appoints Lip-Bu Tan, John M. Wall and James J. Cowie, and each of them, as his or her true and lawful attorneys-in-fact and agents, with full power of substitution and resubstitution, for him or her and in his or her name, place and stead, in any and all capacities, to sign any and all amendments (including post-effective amendments) to this Report on Form 10-K, and to file the same, with all exhibits thereto, and other documents in connection therewith, with the Securities and Exchange Commission, granting unto said attorneys-in-fact and agents, and each of them, full power and authority to do and perform each and every act and thing requisite and necessary to be done in connection therewith, as fully to all intents and purposes as he or she might or could do in person, hereby ratifying and confirming all that said attorneys-in-fact and agents, or any of them, or their, his or her substitute or substitutes, may lawfully do or cause to be done by virtue hereof.
Pursuant to the requirements of the Securities Exchange Act of 1934, this report has been signed below by the following persons on behalf of the registrant and in the capacities and on the dates indicated:
| /s/ | Dr. John B. Shoven | February 24, 2020 | ||
| Dr. John B. Shoven, Chairman of the Board of Directors | ||||
| /s/ | Mark W. Adams | February 24, 2020 | ||
| Mark W. Adams, Director | ||||
| /s/ | Susan L. Bostrom | February 24, 2020 | ||
| Susan L. Bostrom, Director | ||||
| /s/ | Dr. James D. Plummer | February 24, 2020 | ||
| Dr. James D. Plummer, Director | ||||
| /s/ | Dr. Alberto Sangiovanni-Vincentelli | February 24, 2020 | ||
| Dr. Alberto Sangiovanni-Vincentelli, Director | ||||
| /s/ | Roger S. Siboni | February 24, 2020 | ||
| Roger S. Siboni, Director | ||||
| /s/ | Young K. Sohn | February 24, 2020 | ||
| Young K. Sohn, Director | ||||
| /s/ | Mary Agnes Wilderotter | February 24, 2020 | ||
| Mary Agnes Wilderotter, Director |