 filings.tools
CDW 10-K 2019-12-31
Filed 2020-02-28. 22 sections, 379K characters. Original on sec.gov · Markdown · JSON
Cover and table of contents
UNITED STATES
SECURITIES AND EXCHANGE COMMISSION
Washington, D.C. 20549
FORM 10-K
(Mark One)
☒ANNUAL REPORT PURSUANT TO SECTION 13 OR 15(d) OF THE SECURITIES EXCHANGE ACT OF 1934
For the fiscal year ended December 31, 2019
or
| ☐ | TRANSITION REPORT PURSUANT TO SECTION 13 OR 15(d) OF THE SECURITIES EXCHANGE ACT OF 1934 |
For the transition period from to
Commission File Number 001-35985
CDW CORP****ORATION
(Exact name of registrant as specified in its charter)
| Delaware | 26-0273989 | |||
| (State or other jurisdiction of incorporation or organization) | (I.R.S. Employer Identification No.) | |||
| 75 Tri-State International | ||||
| Lincolnshire | , | Illinois | 60069 | |
| (Address of principal executive offices) | (Zip Code) |
(847) 465-6000
(Registrant's telephone number, including area code)
None
(Former name, former address and former fiscal year, if changed since last report)
Securities registered pursuant to Section 12(b) of the Act:
| Title of each class | Trading symbol(s) | Name of each exchange on which registered |
| Common stock, par value $0.01 per share | CDW | Nasdaq Global Select Market |
Securities registered pursuant to Section 12(g) of the Act: None
Indicate by check mark if the registrant is a well-known seasoned issuer, as defined in Rule 405 of the Securities Act. ý Yes ¨ No
Indicate by check mark if the registrant is not required to file reports pursuant to Section 13 or Section 15(d) of the Act. ¨ Yes ý No
Indicate by check mark whether the registrant (1) has filed all reports required to be filed by Section 13 or 15(d) of the Securities Exchange Act of 1934 during the preceding 12 months (or for shorter period that the registrant was required to file such reports), and (2) has been subject to such filing requirements for the past 90 days. ý Yes ¨ No
Indicate by check mark whether the registrant has submitted electronically every Interactive Data File required to be submitted pursuant to Rule 405 of Regulation S-T (§232.405 of this chapter) during the preceding 12 months (or for such shorter period that the registrant was required to submit such files). ý Yes ¨ No
Indicate by check mark whether the registrant is a large accelerated filer, an accelerated filer, a non-accelerated filer, a smaller reporting company, or emerging growth company. See the definitions of "large accelerated filer," "accelerated filer," "smaller reporting company," and "emerging growth company" in Rule 12b-2 of the Exchange Act:
| Large accelerated filer | ý | Accelerated filer | ☐ | |||
| Non-accelerated filer | ☐ | Smaller reporting company | ☐ | |||
| Emerging growth company | ☐ | |||||
| If an emerging growth company, indicate by check mark if the registrant has elected not to use the extended transition period for complying with any new or revised financial accounting standards provided pursuant to Section 13(a) of the Exchange Act. | ☐ |
Indicate by check mark whether the registrant is a shell company (as defined in Rule 12b-2 of the Exchange Act). ☐ Yes ☒ No
The aggregate market value of the voting and non-voting common equity held by non-affiliates of the registrant as of June 28, 2019, the last business day of the registrant's most recently completed second fiscal quarter, was $15,932 million, based on the per share closing sale price of $111.00 on that date.
As of February 25, 2020, there were 142,771,539 shares of common stock, $0.01 par value, outstanding.
DOCUMENTS INCORPORATED BY REFERENCE
Certain parts of the registrant's definitive proxy statement for its 2020 annual meeting of stockholders to be held on May 21, 2020, which will be filed with the Securities and Exchange Commission on or before April 29, 2020, are incorporated by reference into Part III of this Annual Report on Form 10-K.
CDW CORPORATION AND SUBSIDIARIES
ANNUAL REPORT ON FORM 10-K
Year Ended December 31, 2019
TABLE OF CONTENTS
FORWARD-LOOKING STATEMENTS
This report contains "forward-looking statements" within the meaning of the federal securities laws. All statements other than statements of historical fact are forward-looking statements. These statements relate to analyses and other information, which are based on forecasts of future results or events and estimates of amounts not yet determinable. These statements also relate to our future prospects, developments and business strategies. We claim the protection of The Private Securities Litigation Reform Act of 1995 for all forward-looking statements in this report.
These forward-looking statements are identified by the use of terms and phrases such as "anticipate," "assume," "believe," "estimate," "expect," "goal," "intend," "plan," "potential," "predict," "project," "target" and similar terms and phrases or future or conditional verbs such as "could," "may," "should," "will," and "would." However, these words are not the exclusive means of identifying such statements. Although we believe that our plans, intentions and other expectations reflected in or suggested by such forward-looking statements are reasonable, we cannot assure you that we will achieve those plans, intentions or expectations. All forward-looking statements are subject to risks and uncertainties that may cause actual results or events to differ materially from those that we expected.
Important factors that could cause actual results or events to differ materially from our expectations, or cautionary statements, are disclosed under the sections entitled "Risk Factors" and "Management's Discussion and Analysis of Financial Condition and Results of Operations" included elsewhere in this report. All written and oral forward-looking statements attributable to us, or persons acting on our behalf, are expressly qualified in their entirety by those cautionary statements as well as other cautionary statements that are made from time to time in our other Securities and Exchange Commission ("SEC") filings and public communications. You should evaluate all forward-looking statements in the context of these risks and uncertainties.
We caution you that the important factors referenced above may not reflect all of the factors that could cause actual results or events to differ from our expectations. In addition, we cannot assure you that we will realize the results or developments we expect or anticipate or, even if substantially realized, that they will result in the consequences or affect us or our operations in the way we expect. The forward-looking statements included in this report are made only as of the date hereof or, with respect to any documents incorporated by reference, available at the time such document was prepared or filed with the SEC. We undertake no obligation to publicly update or revise any forward-looking statement as a result of new information, future events or otherwise, except as otherwise required by law.
PART I
Item 1. Business
Our Company
CDW Corporation (together with its subsidiaries, the "Company," "CDW" or "we"), a Fortune 500 company and member of the S&P 500 Index, is a market-leading provider of integrated information technology ("IT") solutions to small, medium and large business, government, education and healthcare customers in the United States ("US"), the United Kingdom ("UK") and Canada. Our broad array of offerings ranges from discrete hardware and software products to integrated IT solutions such as mobility, security, data center optimization, cloud computing, virtualization and collaboration.
We are technology "agnostic," with a solutions portfolio including more than 100,000 products and services from more than 1,000 leading and emerging brands. Our solutions are delivered in physical, virtual and cloud-based environments through approximately 6,800 customer-facing coworkers, including sellers, highly-skilled technology specialists and advanced service delivery engineers. We are a leading sales channel partner for many original equipment manufacturers ("OEMs"), software publishers and cloud providers (collectively, our "vendor partners"), whose products we sell or include in the solutions we offer. We provide our vendor partners with a cost-effective way to reach customers and deliver a consistent brand experience through our established end-market coverage, technical expertise and extensive customer access.
We simplify the complexities of technology across design, selection, procurement, integration and management for our customers. Our goal is to have our customers, regardless of their size, view us as a trusted adviser and extension of their IT resources. We do not manufacture products. Our multi-brand offering approach enables us to identify the products or combination of products from our vendor partners that best address each customer's specific IT requirements.
We have capabilities to provide integrated IT solutions in more than 150 countries for customers with primary locations in the US, UK and Canada, which are large and growing markets. According to the International Data Corporation ("IDC"), the total US, UK and Canadian IT market generated approximately $1 trillion in sales in 2019. We believe our addressable markets in the US, UK and Canada represent approximately $360 billion in annual sales. These are highly fragmented markets served by thousands of IT resellers and solutions providers. For the year ended December 31, 2019, we estimate that our total Net sales of $18 billion represented approximately 5% of our addressable markets. We believe that demand for IT will continue to outpace general economic growth in the markets we serve, fueled by new technologies, including cloud computing, virtualization and mobility as well as growing end-user demand for security, efficiency and productivity.
Value Proposition
We are positioned in the middle of the IT ecosystem where we procure products from OEMs, software publishers, cloud providers and wholesale distributors and provide added value to our customers by helping them navigate through complex options and implement the best solution for their business. In this role, we believe we provide unique value to both our vendor partners and our customers.
| Our value proposition to our customers | Our value proposition to our vendor partners | ||
| ● | Broad selection of products and multi-branded IT solutions | ● | Access to over 250,000 customers |
| ● | Value-added services with integration capabilities | ● | Large and established customer channels |
| ● | Highly-skilled specialists and engineers | ● | Strong distribution and implementation capabilities |
| ● | Solutions across IT lifecycle | ● | Customer relationships driving insight into technology roadmaps |
Customers
We provide integrated IT solutions to over 250,000 small, medium and large business, government, education and healthcare customers throughout the US, UK and Canada.
We serve our customers through sales teams focused on customer end-markets that are supported by technical specialists and highly-skilled service delivery engineers. Our market segmentation allows us to customize our offerings and to provide enhanced expertise in designing and implementing IT solutions that meet our customer's specific needs.
We have three reportable segments, Corporate, Small Business and Public. Our Corporate segment primarily serves US private sector business customers with more than 250 employees. Our Small Business segment primarily serves US private sector business customers with up to 250 employees. Our Public segment is comprised of government agencies and education and healthcare
institutions in the US. We also have two other operating segments: CDW UK and CDW Canada, each of which do not meet the reportable segment quantitative thresholds and, accordingly, are included in an all other category ("Other").
In our US business, which represents approximately 90% of our revenues, we currently have five dedicated customer channels: corporate, small business, government, education and healthcare, each of which generated over $1.5 billion in Net sales in 2019. Net sales to customers in the UK and Canada combined generated $2.2 billion in 2019. We believe this diversity of customer end-markets provides us with multiple avenues for growth and has been a key factor in our ability to weather economic and technology cycles and continue to gain market share.
Partners
We provide more than 100,000 products and services from more than 1,000 partners, including well-established companies such as Adobe, APC, Apple, Cisco, Dell EMC, Google, Hewlett Packard Enterprise, HP Inc., IBM, Intel, Lenovo, Microsoft, NetApp, Samsung, and VMware, as well as from emerging technology companies such as Cohesity, Crowdstrike, Proofpoint, Pure Storage, Rubrik, ServiceNow, and Silver Peak. This broad portfolio of partners and technologies enables us to offer customers significant options and meet customer demand for the products and solutions that best meet their needs. We believe our value proposition to vendor partners enables us to evolve our offering as new technologies emerge and new companies seek us as a channel partner.
In 2019, we generated over $1.0 billion of Net sales from each of six vendor partners and over $100 million of Net sales from each of eleven other vendor partners. We have received the highest level of certification from major vendor partners such as Cisco, Dell EMC, Hewlett Packard Enterprise, LG, Microsoft, Samsung, and VMware which reflects the extensive product and solution knowledge and capabilities that we bring to our customers' IT challenges. These certifications also provide us with access to favorable pricing, tools and resources, including vendor incentive programs, which we use to provide additional value to our customers. Our vendor partners also regularly recognize us with top awards and select us to develop and grow new customer solutions.
Product Procurement
We may purchase all or only some of the products our vendor partners offer for resale to our customers or for inclusion in the solutions we offer. Each vendor partner agreement provides for specific terms and conditions, which may include one or more of the following: product return privileges, price protection policies, purchase discounts and vendor incentive programs, such as, purchase or sales rebates and cooperative advertising reimbursements. We also purchase software from major software publishers and cloud providers for resale to our customers or for inclusion in the solutions we offer. Our agreements allow the end-user customer to acquire cloud-based solutions software or licensed products and services.
In addition to purchasing products directly from our vendor partners, we purchase products from wholesale distributors for resale to our customers or for inclusion in the solutions we offer. These wholesale distributors provide logistics management and supply-chain services for us, as well as for our vendor partners.
For our US operations, we purchased approximately 50% of the products we sold as discrete products or as components of a solution directly from our vendor partners and the remaining 50% from wholesale distributors for the year ended December 31, 2019. Purchases from our three largest wholesale distributors, Ingram Micro, SYNNEX and Tech Data, were each approximately 10% of total US purchases in 2019.
Inventory Management
We operate two distribution centers in North America: a 513,000 square foot facility in North Las Vegas, Nevada, and a 442,000 square foot facility in Vernon Hills, Illinois. We also operate a 120,000 square foot distribution center in Rugby, Warwickshire, UK. We ship over 40 million units annually on an aggregate basis from our distribution centers.
We also have drop-shipment arrangements with many of our OEMs and wholesale distributors, which permit us to offer products to our customers without having to take physical delivery at our distribution centers. These arrangements represented approximately 50% of total consolidated Net sales in 2019, of which approximately 25% relate to electronic delivery for software licenses.
We believe that the location of our distribution centers allows us to efficiently ship products to our customers and provide timely access to our principal distributors.
We believe competitive sources of supply are available in substantially all of the product categories that we offer.
Competition
The market for technology products and services is highly competitive and subject to economic conditions and rapid technological changes. Competition is based on many things, including the ability to tailor specific solutions to customer needs, the quality and breadth of product and service offerings, knowledge and expertise of sales force, customer service, price, product availability, speed of delivery and credit availability. We face competition from resellers, direct manufacturers, large service providers, cloud providers, telecommunication companies, and to a lesser extent e-tailers and retailers. Smaller, local or regional value-added resellers typically focus on a single solution suite or portfolio of solutions from one or two vendor partners.
We believe we are well positioned to compete within this marketplace due to our competitive advantages. We expect the competitive landscape to continue to evolve as new technologies are developed. While innovation can help our business as it creates new offerings for us to sell, it can also disrupt our business model and create new and stronger competitors. For additional information on the risks associated with competition, see "Item 1A. Risk Factors."
We believe we have sustainable competitive advantages that differentiate us in the marketplace. We have built a strong sales organization and deep services and solutions capabilities over time and expect to continue to invest to enhance these capabilities, which we believe when combined with our competitive advantages of scale and a performance driven culture, will help drive sustainable, profitable growth for us today and in the future. Our scale enables us to have a national and international footprint, as well as invest in resources to meet specific customer end-market needs. Our sellers are organized around unique customer end-markets that are both vertically and geographically focused. Our scale enables our ability to invest in technical coworkers who work directly with our sellers to help customers implement increasingly complex IT solutions. Our scale also enables us to operate our three distribution centers (two in the US and one in the UK), which combined are more than 1 million square feet in size. We have cross-border relationships that enable us to serve the needs of our US, UK and Canadian-based customers in more than 150 countries. Our strong, execution-oriented culture is underpinned by our compensation system.
Our Offerings
Our offerings range from discrete hardware and software products and services to complex integrated solutions including one or more of these elements. We believe our customers increasingly view technology purchases as integrated solutions rather than discrete product and service categories. We estimate that more than 40% of our Net sales in 2019 in the US came from sales of product categories and services typically associated with solutions. Our hardware products include notebooks/mobile devices (including tablets), network communications, desktop computers, video monitors, enterprise and data storage, and other hardware. Our software products include application suites, security, virtualization, operating systems and network management. Our services include warranties, managed services, consulting design and implementation.
IT is critical to both "run the business" and drive greater growth and productivity. To help our customers accomplish this, we have built a robust portfolio of solutions across data center, digital workspace, security, virtualization and services that we provide in physical, virtual, or cloud-based environments.
We provide public cloud solutions, which reside off customer premises on a public (shared) infrastructure, and private cloud solutions, which reside on customer premises. We also offer hybrid cloud solutions that deliver the benefits of both public and private solutions. Our migration, integration and managed services offerings help our customers simplify cloud adoption, as well as the ongoing management of cloud solutions, across the entire IT lifecycle. Dedicated Cloud Client Executives work with our customers to architect cloud solutions meeting their organizational, technology and financial objectives.
We offer a broad portfolio of integrated solutions that include the following on and off-premise capabilities:
| • | Data Center: We assess our customers application infrastructure need, design flexible, resilient and efficient solutions and manage the solution throughout its lifecycle. Our broad portfolio of hardware and software products, encompassing both on and off-premise solutions, enables us to provide well-integrated solutions, including converged and hyper-converged infrastructure, physical and virtualized servers, software defined automation and orchestration solutions, hybrid storage and energy-efficient power and cooling. |
| • | Digital Workspace: We build end-to-end solutions that deliver access to applications that improve our customers' productivity regardless of device or location. We connect our customers' physical devices, including laptops, desktops, IP Phones, mobile devices and print systems. We utilize collaboration solutions to unite applications via the integration of products that facilitate the use of multiple enterprise communication methods including email, persistent chat, social media, voice and video. We also host cloud-based collaboration solutions. Our solutions provide the tools that allow our customers' employees to share knowledge, ideas and information among each other and with clients and partners effectively, securely and quickly. |
| • | Security: We assess our customers' security needs and provide them with risk mitigation tools and services. Product design, architecture and implementation can take the form of hardware, software or Software as a Service. These tools and services are provided across a multitude of categories such as: endpoint security, email security, web security, intrusion prevention, authentication, firewall, virtual private network services and network access control. Security consulting engagements include security assessment, policy and procedure gap analysis, security roadmaps and health checks. |
| • | Virtualization: We design and implement server, storage and desktop virtualization solutions. Virtualization enables our customers to efficiently utilize hardware resources by running multiple, independent, virtual operating systems on a single computer and multiple virtual servers simultaneously on a single server. Virtualization also can separate a desktop environment and associated application software from the hardware device that is used to access it, and provides employees with remote desktop access. Our specialists assist customers with the steps of implementing virtualization solutions, including evaluating network environments, deploying shared storage options and licensing platform software. |
| • | Services: We advise, architect and manage integrated business technology for our customers. Our solutions include integrated cloud, collaboration, data center, mobility and security business technology, from the physical to the application layer. We provide advisory, architectural and managed services across basic, discrete and integrated business technology solutions. We leverage best-in-class partner technology platforms to seamlessly architect and manage disparate IT platforms into integrated business technology solutions. |
Although we believe customers increasingly view technology purchases as solutions rather than discrete product and service categories, our Net sales by major category, based upon our internal category classifications, was as follows:
| Year Ended December 31, | |||||||||||||||||||||
| 2019 | 2018(1) | 2017(1) | |||||||||||||||||||
| Dollars in Millions | Percentage of Total Net Sales | Dollars in Millions | Percentage of Total Net Sales | Dollars in Millions | Percentage of Total Net Sales | ||||||||||||||||
| Notebooks/Mobile Devices | $ | 4,631.7 | 25.7 | % | $ | 4,062.2 | 25.0 | % | $ | 3,491.8 | 23.5 | % | |||||||||
| Netcomm Products | 2,193.4 | 12.2 | 2,119.1 | 13.0 | 2,021.6 | 13.6 | |||||||||||||||
| Desktops | 1,598.2 | 8.9 | 1,322.2 | 8.1 | 1,196.0 | 8.1 | |||||||||||||||
| Video | 1,272.7 | 7.1 | 1,184.3 | 7.3 | 1,070.0 | 7.2 | |||||||||||||||
| Enterprise and Data Storage (Including Drives) | 1,146.0 | 6.4 | 1,102.5 | 6.8 | 1,070.2 | 7.2 | |||||||||||||||
| Other Hardware | 3,521.2 | 19.5 | 3,308.8 | 20.4 | 3,122.2 | 21.0 | |||||||||||||||
| Total Hardware | 14,363.2 | 79.8 | 13,099.1 | 80.6 | 11,971.8 | 80.6 | |||||||||||||||
| Software(2) | 2,637.2 | 14.6 | 2,331.9 | 14.4 | 2,145.4 | 14.5 | |||||||||||||||
| Services(2) | 907.6 | 5.0 | 695.8 | 4.3 | 602.8 | 4.1 | |||||||||||||||
| Other(3) | 124.4 | 0.6 | 113.7 | 0.7 | 112.9 | 0.8 | |||||||||||||||
| Total Net sales | $ | 18,032.4 | 100.0 | % | $ | 16,240.5 | 100.0 | % | $ | 14,832.9 | 100.0 | % |
| (1) | Amounts have been reclassified for changes in individual product classifications to conform to the presentation for the year ended December 31, 2019. |
| (2) | Certain software and services revenue is recorded on a net basis for accounting purposes, so the category percentage of Net sales is not representative of the category percentage of gross profits. |
| (3) | Includes items such as delivery charges to customers. |
Our Internal Capabilities
Our Coworkers
As of December 31, 2019, we employed approximately 9,900 coworkers with 7,600 coworkers in the US, 1,400 in the UK and 900 in Canada. Approximately two-thirds of our coworkers at year end 2019 were customer facing. Over 50% of our Net sales are generated by account managers who have greater than seven years of tenure with CDW. Account managers are supported by field sellers, highly skilled technology specialists and advanced service delivery engineers. We believe this structure to be core to our ability to continue to offer complex IT solutions and services. None of our coworkers are covered by collective bargaining agreements. We consider our coworker relations to be good.
Marketing
We market the CDW brand to US, UK and Canadian audiences using a variety of channels that include online, broadcast, print, social and other media. We market to current and prospective customers through integrated marketing programs including behaviorally targeted email, print, online media, events and sponsorships, as well as broadcast media. This promotion is also supported by integrated communication efforts targeting decision-makers, influencers and the general public using a combination of news releases, case studies, media interviews and speaking opportunities.
As a result of our relationships with our vendor partners, a significant portion of our advertising and marketing expenses is reimbursed through cooperative advertising programs. These programs are at the discretion of our vendor partners and are typically tied to sales or other commitments to be met by us within a specified period of time. We believe that our results and analytical techniques that measure the efficacy of our marketing programs differentiate us from our competitors.
Information Technology Systems
We maintain customized IT and unified communication systems that enhance our ability to provide prompt, efficient and expert service to our customers. In addition, these systems enable centralized management of key functions, including purchasing, inventory management, billing and collection of accounts receivable, sales and distribution. Our systems provide us with thorough, detailed and real-time information regarding key aspects of our business. This capability helps us to continuously enhance productivity, ship customer orders quickly and efficiently, respond appropriately to industry changes and provide high levels of customer service. We believe our websites, which provide electronic order processing and advanced tools, such as order tracking, reporting and asset management, make it easy for customers to transact business with us and ultimately strengthen our customer relationships.
Intellectual Property
The CDW trademark and certain variations thereon are registered or subject to pending trademark applications in the US, UK, Canada and certain other jurisdictions. We believe our trademarks have significant value and are important factors in our marketing programs. In addition, we own registrations for domain names, including cdw.com, cdwg.com, cdw.ca and variations thereon, for certain of our primary trademarks. We also own patent rights and have unregistered copyrights in our website content, software and other written materials.
History
Founded in 1984, CDW became a public company in 1993. In 2003, we purchased selected US assets and the Canadian operations of Micro Warehouse, which expanded our growth platform into Canada. In 2006, we acquired Berbee Information Networks Corporation, a regional provider of technology products, solutions and customized engineering services in advanced technologies primarily across Cisco, IBM and Microsoft portfolios. This acquisition increased our capabilities in customized engineering services and managed services.
We were a public company from 1993 until 2007 when we were acquired through a merger transaction by an entity controlled by investment funds affiliated with Madison Dearborn Partners, LLC ("Madison Dearborn") and Providence Equity Partners LLC ("Providence Equity"). In 2013, CDW Corporation completed a second initial public offering ("IPO") of its common stock. After the IPO, through secondary offerings and fund distributions, Madison Dearborn and Providence Equity liquidated their ownership positions.
In 2015, we acquired control of 100% of UK-based IT solutions provider, Kelway TopCo Limited. Rebranded CDW UK in 2016, the acquisition extended our footprint into the UK. It also enhanced our ability to provide IT solutions to US-based customers with multinational locations.
In 2019, we acquired Canada-based technology solutions provider, Scalar Decisions Inc. and a premier IT service management solutions provider, Aptris Inc.
Available Information
We maintain a website at www.cdw.com. You may access our Annual Reports on Form 10-K, Quarterly Reports on Form 10-Q, Current Reports on Form 8-K and amendments to those reports filed or furnished pursuant to Section 13(a) or 15(d) of the Securities Exchange Act of 1934 with the SEC free of charge at our website as soon as reasonably practicable after such material is electronically filed with, or furnished to, the SEC. Our website and the information contained on that site, or connected to that site, are not incorporated into and are not a part of this report.
Item 1A. Risk Factors
There are many factors that could adversely affect our business, results of operations and cash flows, some of which are beyond our control. The following is a description of some important factors that may cause our business prospects, results of operations and cash flows in future periods to differ materially from those currently expected or desired. Factors not currently known to us or that we currently deem to be immaterial may also materially and adversely affect our business, results of operations and cash flows.
Risks Related to Our Business
Global and regional economic and political conditions may have an adverse impact on our business.
Weak economic conditions generally, sustained uncertainty about global economic and political conditions, government spending cuts and the impact of new government policies, or a tightening of credit markets, could cause our customers and potential customers to postpone or reduce spending on technology products or services or put downward pressure on prices, which could have an adverse effect on our business, results of operations or cash flows. For example, there continues to be substantial uncertainty regarding the economic impact of the UK's exit from the European Union ("EU"), referred to as "Brexit". The UK formally withdrew from EU membership on January 31, 2020, and commenced a transition period during which the trading relationship between the UK and the EU will remain the same and the UK and EU will begin negotiations to determine their future relationship. Although the full effects of Brexit are uncertain and will be dependent on the outcome of such negotiations, potential adverse consequences of Brexit include global market uncertainty, volatility in currency exchange rates, greater restrictions on imports and exports between the UK and other countries, and increased regulatory complexities, each of which could have a negative impact on our business, financial condition or results of operations. These effects may be amplified if the UK and the EU fail to agree on a future trade relationship, which could result in significant market and economic disruption. We have established a presence in the Netherlands to help address future developments, as needed, for Brexit, which could add complexity to our European operations as well as result in higher costs associated with serving our customers following the transition period.
Our financial performance could be adversely affected by decreases in spending on technology products and services by our public sector customers.
Our sales to our public sector customers and our other customers that do business with our public sector customers are impacted by government spending policies, budget priorities and revenue levels. An adverse change in government spending policies (such as budget cuts or limitations or temporary shutdowns of government operations), shifts in budget priorities or reductions in revenue levels could cause our impacted public sector customers or our other customers that do business with impacted public sector customers to reduce or delay their purchases or to terminate or not renew their contracts with us, which could adversely affect our business, results of operations or cash flows. Additionally, such adverse change in government spending policies, shifts in budget priorities or reductions in revenue levels could impact cash collections from contracts with our impacted public sector customers or other customers that do business with impacted public sector customers, which could adversely affect our business, results of operations or cash flows.
Our business depends on our vendor partner relationships and the terms of the agreements governing those relationships.
Our solutions portfolio includes products from OEMs, software publishers and cloud providers. We are authorized by these vendor partners to sell all or some of their products via direct marketing activities. Our authorization with each vendor partner is subject to specific terms and conditions regarding such things as sales channel restrictions, product return privileges, price protection policies, purchase discounts and vendor partner programs and funding, including purchase rebates, sales volume rebates, purchasing incentives and cooperative advertising reimbursements. However, we do not have any long-term contracts with our vendor partners and many of these arrangements are terminable upon notice by either party. A reduction in vendor partner programs or funding or our failure to timely react to changes in vendor partner programs or funding could have an adverse effect on our business, results of operations or cash flows. In addition, a reduction in the amount or a change in the terms of credit granted to us by our vendor
partners could increase our need for, and the cost of, working capital and could have an adverse effect on our business, results of operations or cash flows, particularly given our level of indebtedness.
From time to time, vendor partners may terminate or limit our right to sell some or all of their products or change the terms and conditions or reduce or discontinue the incentives that they offer us. For example, there is no assurance that, as our vendor partners continue to sell directly to end users and through resellers, they will not limit or curtail the availability of their products to solutions providers like us. Any such termination or limitation or the implementation of such changes could have a negative impact on our business, results of operations or cash flows.
We purchase the products included in our portfolio both directly from our vendor partners and from wholesale distributors. Although we purchase from a diverse vendor base, in 2019, products we purchased from wholesale distributors Ingram Micro, SYNNEX and Tech Data each represented approximately 10% of total US purchases. In addition, sales of products manufactured by Apple, Cisco, Dell EMC, HP Inc., Lenovo and Microsoft, whether purchased directly from these vendor partners or from a wholesale distributor, represented approximately 60% of our 2019 consolidated Net sales. Sales of products manufactured by Cisco and Dell EMC represented approximately 25% of our 2019 consolidated Net sales. The loss of, or change in business relationship with, any of these or any other key vendor partners, or the diminished availability of their products, including due to backlogs for their products, could reduce the supply and increase the cost of products we sell and negatively impact our competitive position.
Further, the sale, spin-off or combination of any of our vendor partners and/or certain of their business units, including any such sale to or combination with a vendor with whom we do not currently have a commercial relationship or whose products we do not sell, or our ability to develop relationships with and sell hardware, software and services from new and emerging vendors and vendors that we have not historically represented in the marketplace, could have an adverse impact on our business, results of operations or cash flows.
Our sales are dependent on continued innovations in hardware, software and services offerings by our vendor partners and the competitiveness of their offerings, and our ability to partner with new and emerging technology providers.
The technology industry is characterized by rapid innovation and the frequent introduction of new and enhanced hardware, software and services offerings, such as cloud-based solutions, including Software as a Service ("SaaS"), Infrastructure as a Service ("IaaS") and Platform as a Service ("PaaS"); Device as a Service ("DaaS"); the Internet of Things ("IoT"); and artificial intelligence. We have been and will continue to be dependent on innovations in hardware, software and services offerings, as well as the acceptance of those innovations by customers. Also, customers may delay spending while they evaluate new technologies. A decrease in the rate of innovation, a lack of acceptance of innovations by our customers or delays in technology spending by our customers, could have an adverse effect on our business, results of operations or cash flows.
In addition, if we are unable to keep up with changes in technology and new hardware, software and services offerings, for example by providing the appropriate training to our account managers, sales technology specialists and engineers to enable them to effectively sell and deliver such new offerings to customers, our business, results of operations or cash flows could be adversely affected.
We also are dependent upon our vendor partners for the development and marketing of hardware, software and services to compete effectively with hardware, software and services of vendors whose products and services we do not currently offer or that we are not authorized to offer in one or more customer channels. To the extent that a vendor's offering that is in high demand is not available to us for resale in one or more customer channels, and there is not a competitive offering from another vendor that we are authorized to sell in such customer channels, or if we are unable to develop relationships with new technology providers or companies that we have not historically represented, our business, results of operations or cash flows could be adversely impacted.
Substantial competition could reduce our market share and significantly harm our financial performance.
Our current competition includes:
| • | resellers, such as Computacenter, Connection, ePlus, Insight Enterprises, NTT, Presidio, SCC, Softchoice, World Wide Technology and many smaller resellers; |
| • | manufacturers who sell directly to customers, such as Adobe, Apple, Dell EMC, HP Inc. and Hewlett Packard Enterprise; |
| • | large service providers and system integrators, such as Accenture, Dell EMC, Hewlett Packard Enterprise and IBM; |
| • | communications service providers, such as AT&T, CenturyLink and Verizon; |
| • | cloud providers, such as Amazon Web Services, Google and Microsoft; |
| • | e-tailers, such as Amazon and Newegg; and |
| • | retailers (including their e-commerce activities), such as Office Depot and Staples. |
We expect the competitive landscape to continue to evolve as new technologies and consumption models are developed, such as cloud-based and other "as a service" solutions, hyper-converged infrastructure and embedded software solutions. While innovation can help our business as it creates new offerings for us to sell, it can also disrupt our business model and create new and stronger competitors. For instance, while cloud-based solutions present an opportunity for us, cloud-based solutions and technology solutions as a service could increase the amount of sales directly to customers rather than through solutions providers like us, or could reduce the amount of hardware we sell. In addition, some of our hardware and software vendor partners sell, and could intensify their efforts to sell, their products directly to our customers. Moreover, traditional OEMs have increased their services capabilities through mergers and acquisitions with service providers, which could potentially increase competition in the market to provide comprehensive technology solutions to customers. If we are unable to effectively respond to the evolving competitive landscape, or respond in a manner that is less effective than that of our competitors, our business, results of operations or cash flows could be adversely impacted.
We focus on offering a high level of service to gain new customers and retain existing customers. To the extent we face increased competition to gain and retain customers, we may be required to reduce prices, increase advertising expenditures or take other actions which could adversely affect our business, results of operations or cash flows. Additionally, some of our competitors may reduce their prices in an attempt to stimulate sales, which may require us to reduce prices. This would require us to sell a greater number of products to achieve the same level of Net sales and Gross profit. If such a reduction in prices occurs and we are unable to attract new customers and sell increased quantities of products, our sales growth and profitability could be adversely affected.
The interruption of the flow of products from suppliers could disrupt our supply chain.
Our business depends on the timely supply of products in order to meet the demands of our customers. Manufacturing interruptions or delays, including as a result of the financial instability or bankruptcy of manufacturers, significant labor disputes such as strikes, natural disasters, pandemics or other public health crises, such as the coronavirus, or other adverse occurrences affecting any of our suppliers' facilities, could disrupt our supply chain. We could experience product constraints due to the failure of suppliers to accurately forecast customer demand, or to manufacture sufficient quantities of product to meet customer demand, amongst other reasons. Additionally, the relocation of key distributors utilized in our purchasing model could increase our need for, and the cost of, working capital and have an adverse effect on our business, results of operations or cash flows.
Our supply chain is also exposed to risks related to international operations. While we purchase our products primarily in the markets we serve (for example, products for US customers are sourced in the US), our vendor partners manufacture or purchase a significant portion of the products we sell outside of the US, primarily in Asia. Political, social or economic instability in Asia, or in other regions in which our vendor partners purchase or manufacture the products we sell, could cause disruptions in trade, including exports to the US. Other events related to international operations that could cause disruptions to our supply chain include:
| • | the imposition of additional trade law provisions or regulations, including the adoption or expansion of trade restrictions; |
| • | the imposition of additional duties, tariffs and other charges on imports and exports, including any resulting retaliatory tariffs or charges and any reductions in the production of products subject to such tariffs and charges; |
| • | foreign currency fluctuations; and |
| • | restrictions on the transfer of funds. |
We cannot predict whether the countries in which the products we sell, or any components of those products, are purchased or manufactured will be subject to new or additional trade restrictions or sanctions imposed by the US or foreign governments, including the likelihood, type or effect of any such restrictions. Trade restrictions, including new or increased tariffs or quotas, embargoes, sanctions, safeguards and customs restrictions against the products we sell, could increase the cost or reduce the supply of product available to us and adversely affect our business, results of operations or cash flows. In addition, our exports are subject to regulations, some of which may be inconsistent, and noncompliance with these requirements could have a negative effect on our business, results of operations or cash flows.
The success of our business depends on the continuing development, maintenance and operation of our information technology systems.
Our success is dependent on the accuracy, proper utilization and continuing maintenance and development of our information technology systems, including our business systems, such as our sales, customer management, financial and accounting, marketing,
purchasing, warehouse management, e-commerce and mobile systems, as well as our operational platforms, including voice and data networks and power systems. The quality and our utilization of the information generated by our information technology systems, and our success in implementing new systems and upgrades, affects, among other things, our ability to:
| • | conduct business with our customers, including delivering services and solutions to them; |
| • | manage our inventory, accounts receivable and accounts payable; |
| • | support planned growth in services and solutions and continued evolution of the business; |
| • | purchase, sell, ship and invoice our hardware and software products and provide and invoice our services efficiently and on a timely basis; and |
| • | maintain our cost-efficient operating model while scaling our business. |
The integrity of our information technology systems is vulnerable to disruption due to forces beyond our control. While we have taken steps to protect our information technology systems from a variety of threats, both internal and external, and from human error, there can be no guarantee that those steps will be effective. Furthermore, although we have redundant systems at a separate location to back up our primary systems, there can be no assurance that these redundant systems will operate properly if and when required. Any disruption to or infiltration of our information technology systems could significantly harm our business or results of operations.
Breaches of data security and the failure to protect our information technology systems from cybersecurity threats could adversely impact our business.
Our business involves the storage and transmission of proprietary information and sensitive or confidential data, including personal information of coworkers, customers and others. In connection with our services business, some of our coworkers have access to our customers' confidential data and other information. Additionally, third parties, such as data center colocation and hosted solution partners, provide services to us and as a component of our services delivery to customers. These third parties could also be a source of security risk in the event of a failure of their own security systems and infrastructure. We have privacy and data security policies in place that are designed to prevent security breaches; however, as newer technologies evolve, and the portfolio of the service providers we share confidential information with grows, we could be exposed to increased risks from breaches in security, including those from human error, negligence or mismanagement or from illegal or fraudulent acts, such as cyberattacks. The evolving nature of threats to data security, in light of new and sophisticated methods used by criminals and cyberterrorists, state-sponsored organizations and nation-states, including computer viruses, malware, phishing, misrepresentation, social engineering and forgery, make it increasingly challenging to anticipate and adequately mitigate these risks.
Breaches in security could expose us, our supply chain, our customers or other individuals to significant disruptions, a risk of public disclosure, loss or misuse of this information. Security breaches could result in legal claims or proceedings, liability or regulatory penalties under laws protecting the privacy of personal information, as well as the loss of existing or potential customers and damage to our brand and reputation. Moreover, media or other reports of perceived vulnerabilities in our network security or perceived lack of security within our environment, even if inaccurate, could adversely impact our reputation and materially impact our business. The cost and operational consequences of implementing further data protection measures could be significant. Such breaches, costs and consequences could adversely affect our business, results of operations or cash flows.
The failure to comply with our public sector contracts or applicable laws and regulations could result in, among other things, termination, fines or other liabilities, and changes in procurement regulations could adversely impact our business, results of operations or cash flows.
Revenues from our public sector customers are derived from sales to governmental entities, educational institutions and healthcare customers through various contracts and open market sales of products and services. Sales to public sector customers are highly regulated. Noncompliance with contract provisions, government procurement regulations or other applicable laws or regulations (including the False Claims Act, the Medicare and Medicaid Anti-Kickback Statute or similar laws of the jurisdictions for our business activities outside of the US) or security clearance and confidentiality requirements could result in civil, criminal and administrative liability, including substantial monetary fines or damages, termination of government contracts or other public sector customer contracts, and suspension, debarment or ineligibility from doing business with governmental entities or other customers in the public sector. In addition, contracts in the public sector are generally terminable at any time for convenience of the contracting agency or group purchasing organization ("GPO") or upon default. Furthermore, our inability to enter into or retain contracts with GPOs may threaten our ability to sell to customers in those GPOs and compete effectively. The effect of any of these possible actions or failures could adversely affect our business, results of operations or cash flows. In addition, the adoption
of new or modified procurement regulations and other requirements may increase our compliance costs and reduce our gross margins, which could have a negative effect on our business, results of operations or cash flows.
If we or our third-party service providers fail to provide high-quality services to our customers, our reputation, business, results of operations or cash flows could be adversely affected.
Our services include field services, managed services, warranties, configuration services, partner services and telecom services. Additionally, we deliver and manage mission critical software, systems and network solutions for our customers. We also offer certain services, such as implementation and installation services and repair services, to our customers through various third-party service providers engaged to perform these services on our behalf. If we or our third-party service providers fail to provide high-quality services to our customers or such services result in a disruption of our customers' businesses, this could, among other things, result in legal claims and proceedings and liability for us. Moreover, as we expand our services and solutions business and provide increasingly complex services and solutions, we may be exposed to additional operational, regulatory and other risks. We also could incur liability for failure to comply with the rules and regulations applicable to the new services and solutions we provide to our customers. If any of the foregoing were to occur, our reputation with our customers, our brand and our business, results of operations or cash flows could be adversely affected.
If we lose any of our key personnel, or are unable to attract and retain the talent required for our business, our business could be disrupted and our financial performance could suffer.
Our success is heavily dependent upon our ability to attract, develop, engage and retain key personnel to manage and grow our business, including our key executive, management, sales, services and technical coworkers.
Our future success will depend to a significant extent on the efforts of our Chief Executive Officer, as well as the continued service and support of our other executive officers and the effectiveness of our succession planning. Our future success also will depend on our ability to retain and motivate our customer-facing coworkers, who have been given critical CDW knowledge regarding, and the opportunity to develop strong relationships with, many of our customers. In addition, as we seek to expand our offerings of value-added services and solutions, our success will even more heavily depend on attracting and retaining highly skilled technology specialists and engineers, for whom the market is extremely competitive.
If we are unable to attract, develop, engage and retain key personnel, our relationships with our vendor partners and customers and our ability to expand our offerings of value-added services and solutions could be adversely affected. Moreover, if we are unable to continue to train our sales, services and technical personnel effectively to meet the rapidly changing technology needs of our customers, the overall quality and efficiency of such personnel could decrease. Such consequences could adversely affect our business, results of operations or cash flows.
A natural disaster or other adverse occurrence at one of our primary facilities or a third-party provider location could damage our business.
We have two warehouse and distribution facilities in the US and one in the UK. If the warehouse and distribution equipment at one of our distribution centers were to be seriously damaged by a natural disaster or other adverse occurrence, we could utilize another distribution center or third-party distributors to ship products to our customers. However, this may not be sufficient to avoid interruptions in our service and may not enable us to meet all of the needs of our customers and would cause us to incur incremental operating costs. In addition, we operate numerous facilities which may contain both business-critical data and confidential information of our customers and third parties, such as data center colocation and hosted solution partners, provide services as a component of our services delivery to customers. A natural disaster or other adverse occurrence at any of our major sales offices or third-party provider locations could negatively impact our business, results of operations or cash flows.
Increases in the cost of commercial delivery services or disruptions of those services could materially adversely impact our business.
We generally ship hardware products to our customers by FedEx, United Parcel Service and other commercial delivery services and invoice customers for delivery charges. If we are unable to pass on to our customers future increases in the cost of commercial delivery services (including those that may result from an increase in fuel or personnel costs), our profitability could be adversely affected. Additionally, strikes, inclement weather, natural disasters or other service interruptions by such shippers could materially adversely affect our ability to deliver or receive products on a timely basis.
We are exposed to accounts receivable and inventory risks.
We extend credit to our customers for a significant portion of our Net sales, typically on 30-day payment terms. We are subject to the risk that our customers may not pay for the products they have purchased, or may pay at a slower rate than we have historically experienced. This risk is heightened during periods of global or industry-specific economic downturn or uncertainty, during periods
of rising interest rates or, in the case of public sector customers, during periods of budget constraints. Significant failures of customers to timely pay all amounts due to us could adversely affect our business, results of operations or cash flows.
We are also exposed to inventory risks as a result of the rapid technological changes that affect the market and pricing for the products we sell. We seek to minimize our inventory exposure through a variety of inventory management procedures and policies, including our rapid-turn inventory model, as well as vendor price protection and product return programs. However, if we were unable to maintain our rapid-turn inventory model, if there were unforeseen product developments that created more rapid obsolescence or if our vendor partners were to change their terms and conditions, our inventory risks could increase. We also from time to time take advantage of cost savings associated with certain opportunistic bulk inventory purchases offered by our vendor partners or we may decide to carry high inventory levels of certain products that have limited or no return privileges due to customer demand or request or to manage supply chain interruptions. If we purchase inventory in anticipation of customer demand that does not materialize, or if customers reduce or delay orders, we would be exposed to an increased risk of inventory obsolescence.
We could be exposed to additional risks if we continue to make strategic investments or acquisitions or enter into alliances.
We may continue to pursue transactions, including strategic investments, acquisitions or alliances, in an effort to extend or complement our existing business. These types of transactions involve numerous business risks, including finding suitable transaction partners and negotiating terms that are acceptable to us, the diversion of management's attention from other business concerns, extending our product or service offerings into areas in which we have limited experience, entering into new geographic markets, the potential loss of key coworkers or business relationships and successfully integrating acquired businesses. There can be no assurance that the intended benefits of our investments, acquisitions and alliances will be realized, or that those benefits will offset these numerous risks or other unforeseen factors, any of which could adversely affect our business, results of operations or cash flows.
In addition, our financial results could be adversely affected by financial adjustments required by generally accepted accounting principles in the United States of America ("GAAP") in connection with these types of transactions where significant goodwill or intangible assets are recorded. To the extent the value of goodwill or identifiable intangible assets becomes impaired, we may be required to incur material charges relating to the impairment of those assets.
Our future operating results may fluctuate significantly, which may result in volatility in the market price of our stock and could impact our ability to operate our business effectively.
We may experience significant variations in our future quarterly results of operations. These fluctuations may cause the market price of our common stock to be volatile and may result from many factors, including the condition of the technology industry in general, shifts in demand and pricing for hardware, software and services and the introduction of new products or upgrades. Further, if our customers’ businesses are adversely affected by the impact of the coronavirus, they might delay or reduce purchases from us, which could adversely affect our results of operations.
Our operating results are also highly dependent on our level of Gross profit as a percentage of Net sales. Our Gross profit percentage fluctuates due to numerous factors, some of which may be outside of our control, including general macroeconomic conditions; pricing pressures; changes in product costs from our vendor partners; the availability of price protection, purchase discounts and incentive programs from our vendor partners; changes in product, order size and customer mix; the risk of some items in our inventory becoming obsolete; increases in delivery costs that we cannot pass on to customers; and general market and competitive conditions.
In addition, our cost structure is based, in part, on anticipated sales and gross margins. Therefore, we may not be able to adjust our cost structure quickly enough to compensate for any unexpected sales or gross margin shortfall, and any such inability could have an adverse effect on our business, results of operations or cash flows.
Fluctuations in foreign currency have an effect on our reported results of operations.
Our exposure to fluctuations in foreign currency rates results primarily from the translation exposure associated with the preparation of our Consolidated Financial Statements. While our Consolidated Financial Statements are reported in US dollars, the financial statements of our subsidiaries outside the US are prepared using the local currency as the functional currency and translated into US dollars. As a result, fluctuations in the exchange rate of the US dollar relative to the local currencies of our international subsidiaries, particularly the British pound and the Canadian dollar, could cause material fluctuations in our reported results of operations. We also have foreign currency exposure to the extent sales and purchases are not denominated in a subsidiary's functional currency, which could have an adverse effect on our business, results of operations or cash flows.
We are exposed to risks from legal proceedings and audits, which may result in substantial costs and expenses or interruption of our normal business operations.
We are party to various legal proceedings that arise in the ordinary course of our business, which include commercial, employment, tort and other litigation.
We are subject to intellectual property infringement claims against us in the ordinary course of our business, either because of the products and services we sell or the business systems and processes we use to sell such products and services, in the form of cease-and-desist letters, licensing inquiries, lawsuits and other communications and demands. In our industry, such intellectual property claims have become more frequent as the complexity of technological products and the intensity of competition in our industry have increased. Increasingly, many of these assertions are brought by non-practicing entities whose principal business model is to secure patent licensing revenue, but we may also be subject to demands from inventors, competitors or other patent holders who may seek licensing revenue, lost profits and/or an injunction preventing us from engaging in certain activities, including selling certain products or services.
We also are subject to proceedings, investigations and audits by federal, state, international, national, provincial and local authorities, including as a result of our significant sales to governmental entities. We also are subject to audits by various vendor partners and large customers, including government agencies, relating to purchases and sales under various contracts. In addition, we are subject to indemnification claims under various contracts.
Current and future litigation, infringement claims, governmental proceedings and investigations, audits or indemnification claims that we face may result in substantial costs and expenses and significantly divert the attention of our management regardless of the outcome. In addition, these matters could lead to increased costs or interruptions of our normal business operations. Litigation, infringement claims, governmental proceedings and investigations, audits or indemnification claims involve uncertainties and the eventual outcome of any such matter could adversely affect our business, results of operations or cash flows.
Failure to comply with complex and evolving laws and regulations applicable to our operations could adversely impact our business, results of operations or cash flows.
Our operations are subject to numerous complex federal, state, provincial, local and foreign laws and regulations in a number of areas, including labor and employment, advertising, e-commerce, tax, trade, import and export requirements, economic and trade sanctions, anti-corruption, data privacy requirements (including those under the European Union General Data Protection Regulation and the California Consumer Privacy Act), anti-competition, environmental and health and safety. The evaluation of, and compliance with these laws, regulations and similar requirements may be onerous and expensive, and these laws and regulations may have other adverse impacts on our business, results of operations or cash flows. Furthermore, these laws and regulations are evolving and may be inconsistent from jurisdiction to jurisdiction, further increasing the cost of compliance and doing business, and the risk of noncompliance.
We have implemented policies and procedures designed to help ensure compliance with applicable laws and regulations, but there can be no guarantee against coworkers, contractors or agents violating such laws and regulations or our policies and procedures.
As a public company, we also are subject to increasingly complex public disclosure, corporate governance and accounting requirements that increase compliance costs and require significant management focus.
Risks Related to Our Indebtedness
Our level of indebtedness could adversely affect our business.
As of December 31, 2019, we had $3.3 billion of total long-term debt outstanding and $430 million of obligations outstanding under our inventory financing agreements, and the ability to borrow an additional $1.0 billion under our senior secured asset-based revolving credit loan facility (the "Revolving Loan") after taking into account borrowing base limitations and an additional £50 million ($66 million at December 31, 2019) under our CDW UK revolving credit facility. Our level of indebtedness could have important consequences, including the following:
| • | making it more difficult for us to satisfy our obligations with respect to our indebtedness; |
| • | requiring us to dedicate a substantial portion of our cash flow from operations to debt service payments on our and our subsidiaries' debt, which reduces the funds available for working capital, capital expenditures, acquisitions and other general corporate purposes; |
| • | requiring us to comply with restrictive covenants in our senior credit facilities and indentures, which limit the manner in which we conduct our business; |
| • | making it more difficult for us to obtain vendor financing from our vendor partners, including original equipment manufacturers and software publishers; |
| • | limiting our flexibility in planning for, or reacting to, changes in the industry in which we operate; |
| • | placing us at a competitive disadvantage compared to any of our less-leveraged competitors; |
| • | increasing our vulnerability to both general and industry-specific adverse economic conditions; and |
| • | limiting our ability to obtain additional debt or equity financing to fund future working capital, capital expenditures, acquisitions or other general corporate requirements and increasing our cost of borrowing. |
Restrictive covenants under our senior credit facilities and, to a lesser degree, our indentures may adversely affect our operations and liquidity.
Our senior credit facilities and, to a lesser degree, our indentures contain, and any future indebtedness of ours may contain, various covenants that limit our ability to, among other things:
| • | incur or guarantee additional debt; |
| • | pay dividends or make distributions to holders of our capital stock or to make certain other restricted payments or investments; |
| • | repurchase or redeem capital stock; |
| • | make loans, capital expenditures or investments or acquisitions; |
| • | receive dividends or other payments from our subsidiaries; |
| • | enter into transactions with affiliates; |
| • | pledge our assets as collateral; |
| • | merge or consolidate with other companies or transfer all or substantially all of our assets; |
| • | transfer or sell assets, including capital stock of subsidiaries; and |
| • | prepay, repurchase or redeem debt. |
As a result of these covenants, we are limited in the manner in which we conduct our business and we may be unable to engage in favorable business activities or finance future operations or capital needs. A breach of any of these covenants or any of the other restrictive covenants would result in a default under our senior credit facilities. Upon the occurrence of an event of default under our senior credit facilities, the lenders:
| • | will not be required to lend any additional amounts to us; |
| • | could elect to declare all borrowings outstanding thereunder, together with accrued and unpaid interest and fees, to be due and payable; or |
| • | could require us to apply all of our available cash to repay these borrowings. |
The acceleration of amounts outstanding under our senior credit facilities would likely trigger an event of default under our existing indentures.
If we were unable to repay those amounts, the lenders under our senior credit facilities could proceed against the collateral granted to them to secure our borrowings thereunder. We have pledged a significant portion of our assets as collateral under our senior credit facilities. If the lenders under our senior credit facilities accelerate the repayment of borrowings, we cannot assure you that we will have sufficient assets to repay our senior credit facilities and our other indebtedness or the ability to borrow sufficient funds to refinance such indebtedness. Even if we were able to obtain new financing, it may not be on commercially reasonable terms, or terms that are acceptable to us.
In addition, under our Revolving Loan, we are permitted to borrow an aggregate amount of up to $1.5 billion. However, our ability to borrow under our Revolving Loan is limited by a borrowing base and a liquidity condition. The borrowing base at any time equals the sum of up to 85% of CDW LLC and its subsidiary guarantors' eligible accounts receivable (net of accounts receivable
reserves) (up to 30% of such eligible accounts receivable which can consist of federal government accounts receivable) plus the lesser of (i) 75% of CDW LLC and its subsidiary guarantors' eligible inventory (valued at cost and net of inventory reserves) and (ii) the product of 85% multiplied by the net orderly liquidation value percentage multiplied by eligible inventory (valued at cost and net of inventory reserves), less reserves (other than accounts reserves and inventory reserves). The borrowing base in effect as of December 31, 2019 was $2.0 billion and, therefore, did not restrict our ability to borrow under our Revolving Loan as of that date.
Our ability to borrow under our Revolving Loan is also limited by a minimum liquidity condition, which provides that, if excess cash availability is less than the lesser of (i) $125 million and (ii) the greater of (A) 10% of the borrowing base and (B) $100 million, the lenders are not required to lend any additional amounts under our Revolving Loan unless the consolidated fixed charge coverage ratio (as defined in the credit agreement for our Revolving Loan) is at least 1.00 to 1.00. It is an event of default under our Revolving Loan if our excess cash availability and consolidated fixed charge coverage ratio remain below such levels for a period of five or more consecutive business days. Moreover, our Revolving Loan provides discretion to the agent bank acting on behalf of the lenders to impose additional availability reserves, which could materially impair the amount of borrowings that would otherwise be available to us. We cannot make any assurances that the agent bank will not impose such reserves or, were it to do so, that the resulting impact of this action would not materially and adversely impair our liquidity.
We will be required to generate sufficient cash to service our indebtedness and, if not successful, we may be forced to take other actions to satisfy our obligations under our indebtedness.
Our ability to make scheduled payments on or to refinance our debt obligations depends on our financial and operating performance, which is subject to prevailing economic and competitive conditions and to certain financial, business and other factors beyond our control. Our outstanding long-term debt will impose significant cash interest payment obligations on us and, accordingly, we will have to generate significant cash flow from operating activities to fund our debt service obligations. We cannot assure you that we will maintain a level of cash flows from operating activities sufficient to permit us to pay the principal, premium, if any, and interest on our indebtedness. See "Management's Discussion and Analysis of Financial Condition and Results of Operations-Liquidity and Capital Resources" included elsewhere in this report.
If our cash flows and capital resources are insufficient to fund our debt service obligations, we may be forced to reduce or delay capital expenditures, sell assets or operations, seek additional debt or equity capital, restructure or refinance our indebtedness, or revise or delay our strategic plan. We cannot assure you that we would be able to take any of these actions on terms that are favorable to us or at all, that these actions would be successful and permit us to meet our scheduled debt service obligations or satisfy our capital requirements, or that these actions would be permitted under the terms of our existing or future debt agreements, including our senior credit facilities and indentures. In the absence of such operating results and resources, we could face substantial liquidity problems and might be required to dispose of material assets or operations to meet our debt service and other obligations. Our senior credit facilities restrict our ability to dispose of assets and use the proceeds from the disposition. We may not be able to consummate those dispositions or to obtain the proceeds which we could realize from them and these proceeds may not be adequate to meet any debt service obligations then due.
If we cannot make scheduled payments on our debt, we will be in default and, as a result:
| • | our debt holders could declare all outstanding principal and interest to be due and payable; |
| • | the lenders under our senior credit facilities could foreclose against the assets securing the borrowings from them and the lenders under our Revolving Loan and CDW UK revolving credit facility could terminate their commitments to lend us money; and |
| • | we could be forced into bankruptcy or liquidation. |
We and our subsidiaries may be able to incur substantially more debt, including secured debt. This could further increase the risks associated with our leverage.
We and our subsidiaries may be able to incur substantial additional indebtedness in the future. The terms of our senior credit facilities and indentures do not fully prohibit us or our subsidiaries from doing so. To the extent that we incur additional indebtedness, the risks associated with our level of indebtedness described above, including our possible inability to service our debt, will increase. As of December 31, 2019, we had $1.0 billion available for additional borrowing under our Revolving Loan after taking into account borrowing base limitations and an additional £50 million ($66 million at December 31, 2019) available under our CDW UK revolving credit facility.
Variable rate indebtedness subjects us to interest rate risk, which could cause our debt service obligations to increase significantly.
Certain of our borrowings, primarily borrowings under our senior credit facilities, are at variable rates of interest and expose us to interest rate risk. As of December 31, 2019, we had $1.6 billion of variable rate debt outstanding. If interest rates increase, our debt service obligations on the variable rate indebtedness would increase even though the amount borrowed remained the same, and our net income would decrease. Although we have entered into interest rate cap agreements on our term loan facility to reduce interest rate volatility, we cannot assure you we will be able to enter into interest rate cap agreements in the future on acceptable terms or that such caps or the caps we have in place now will be effective.
The London Inter-bank Offered Rate ("LIBOR") and certain other interest "benchmarks" may be subject to regulatory guidance and/or reform that could cause interest rates under our current or future debt agreements to perform differently than in the past or cause other unanticipated consequences.
Certain of our credit facilities, including our senior secured term loan facility and our Revolving Loan, have variable interest rates using LIBOR as a benchmark rate, and we have entered into interest rate cap agreements with respect to the senior secured term loan facility that are based on LIBOR. As of December 31, 2019, $1.5 billion of our total debt outstanding bears interest at variable interest rates using LIBOR as a benchmark rate. The LIBOR and certain other interest "benchmarks" may be subject to regulatory guidance and/or reform that could cause interest rates under our current or future debt agreements to perform differently than in the past or cause other unanticipated consequences. The United Kingdom's Financial Conduct Authority, which regulates LIBOR, has announced that it intends to stop encouraging or requiring banks to submit LIBOR rates after 2021. The US Federal Reserve, in conjunction with the Alternative Reference Rates Committee, a steering committee comprised of large US financial institutions, announced the replacement of US dollar LIBOR with a new index calculated by short-term repurchase agreements, backed by US Treasury securities, called the Secured Overnight Financing Rate ("SOFR"). The first publication of SOFR was released in April 2018. Whether or not SOFR attains market traction as a LIBOR replacement for US dollar-denominated instruments, and whether other benchmarks will attain traction in other markets, remains in question and the future of LIBOR at this time is uncertain. If LIBOR ceases to exist, interest rates on our current or future debt obligations and hedging instruments may be adversely affected and we may need to renegotiate the agreements governing such obligations or instruments. Although the agreement governing our senior secured term loan facility contains provisions for amending the applicable term loan interest rates if LIBOR is discontinued or cannot be determined, any such amendments will be contingent on our ability to negotiate new "benchmark" rates, spreads and calculation methods with the administrative agent and lenders under such facility. We may be unable to negotiate an acceptable alternative to LIBOR, or if we do agree to amend the facility, the new "benchmark" may perform differently than LIBOR or cause other unanticipated consequences, which could adversely affect our interest expense, related debt obligations and our interest rate cap agreements.
Risks Related to Ownership of Our Common Stock
Our common stock price may be volatile and may decline regardless of our operating performance, and holders of our common stock could lose a significant portion of their investment.
The market price for our common stock may be volatile. Our stockholders may not be able to resell their shares of common stock at or above the price at which they purchased such shares, due to fluctuations in the market price of our common stock, which may be caused by a number of factors, many of which we cannot control, including the risk factors described in this Annual Report on Form 10-K and the following:
| • | changes in financial estimates by any securities analysts who follow our common stock, our failure to meet these estimates or failure of securities analysts to maintain coverage of our common stock; |
| • | downgrades by any securities analysts who follow our common stock; |
| • | future sales of our common stock by our officers, directors and significant stockholders; |
| • | market conditions or trends in our industry or the economy as a whole; |
| • | investors' perceptions of our prospects; |
| • | announcements by us or our competitors of significant contracts, acquisitions, joint ventures or capital commitments; and |
| • | changes in key personnel. |
In addition, the stock markets have experienced extreme price and volume fluctuations that have affected and continue to affect the market prices of equity securities of many companies, including companies in our industry. In the past, securities class action litigation has followed periods of market volatility. If we were involved in securities litigation, we could incur substantial costs, and our resources and the attention of management could be diverted from our business.
In the future, we may also issue our securities in connection with investments or acquisitions. The number of shares of our common stock issued in connection with an investment or acquisition could constitute a material portion of our then-outstanding shares of our common stock and depress our stock price.
Anti-takeover provisions in our charter documents and Delaware law might discourage or delay acquisition attempts for us that may be considered favorable.
Our amended and restated certificate of incorporation and amended and restated bylaws contain provisions that may make the acquisition of the Company more difficult without the approval of our Board of Directors. These provisions:
| • | authorize the issuance of undesignated preferred stock, the terms of which may be established and the shares of which may be issued without stockholder approval, and which may include super voting, special approval, dividend, or other rights or preferences superior to the rights of the holders of common stock; |
| • | establish a classified Board of Directors until the 2021 annual meeting of stockholders, so that not all members of our Board of Directors are elected at one time; |
| • | generally prohibit stockholder action by written consent, requiring all stockholder actions be taken at a meeting of our stockholders; |
| • | provide that special meetings of the stockholders can only be called by or at the direction of our Board of Directors pursuant to a written resolution adopted by the affirmative vote of the majority of the total number of directors that the Company would have if there were no vacancies; |
| • | establish advance notice requirements for nominations for elections to our Board of Directors or for proposing matters that can be acted upon by stockholders at stockholder meetings; and |
| • | provide that our Board of Directors is expressly authorized to make, alter or repeal our amended and restated bylaws. |
Our amended and restated certificate of incorporation also contains a provision that provides us with protections similar to Section 203 of the Delaware General Corporation Law, and will prevent us from engaging in a business combination with a person who acquires at least 15% of our common stock for a period of three years from the date such person acquired such common stock, unless Board or stockholder approval is obtained prior to the acquisition. These anti-takeover provisions and other provisions under Delaware law could discourage, delay or prevent a transaction involving a change in control of the Company, even if doing so would benefit our stockholders. These provisions could also discourage proxy contests and make it more difficult for our stockholders to elect directors of their choosing and to cause us to take other corporate actions our stockholders desire.
We cannot assure you that we will continue to pay dividends on our common stock or repurchase any of our common stock under our share repurchase program, and our indebtedness and certain tax considerations could limit our ability to continue to pay dividends on, or make share repurchases of, our common stock. If we do not continue to pay dividends, you may not receive any return on investment unless you are able to sell your common stock for a price greater than your purchase price.
We expect to continue to pay a cash dividend on our common stock, currently at the rate of $0.380 per share per quarter, or $1.52 per share per annum. However, any determination to pay dividends in the future will be at the discretion of our Board of Directors. Any determination to pay dividends on, or repurchase, shares of our common stock in the future will depend upon our results of operations, financial condition, business prospects, capital requirements, contractual restrictions, any potential indebtedness we may incur, restrictions imposed by applicable law, tax considerations and other factors our Board of Directors deems relevant. In addition, our ability to pay dividends on, or repurchase, shares of our common stock will be limited by restrictions on our ability to pay dividends or make distributions to our stockholders and on the ability of our subsidiaries to pay dividends or make distributions to us, in each case, under the terms of our current and any future agreements governing our indebtedness. There can be no assurance that we will continue to pay a dividend at the current rate or at all or that we will continue to repurchase shares of our common stock. If we do not pay dividends in the future, realization of a gain on your investment will depend entirely on the appreciation of the price of our common stock, which may never occur.
We are a holding company and rely on dividends, distributions and other payments, advances and transfers of funds from our subsidiaries to meet our obligations.
We are a holding company that does not conduct any business operations of our own. As a result, we are largely dependent upon cash dividends and distributions and other transfers from our subsidiaries to meet our obligations. The agreements governing the indebtedness of our subsidiaries impose restrictions on our subsidiaries' ability to pay dividends or other distributions to us. The deterioration of the earnings from, or other available assets of, our subsidiaries for any reason could also limit or impair their ability to pay dividends or other distributions to us.
Item 1B. Unresolved Staff Comments
None.
Item 2. Properties
As of December 31, 2019, we owned or leased a total of 2.6 million square feet of space, primarily in the US, UK and Canada. We own two properties: a 513,000 square foot distribution center in North Las Vegas, Nevada, and a combined office and a 442,000 square foot distribution center in Vernon Hills, Illinois. In addition, we conduct sales, services and administrative activities in various locations primarily in the US, UK and Canada.
We believe our facilities are well maintained, suitable for our business and occupy sufficient space to meet our operating needs. As part of our normal business, we regularly evaluate sales center performance and site suitability. Leases covering our currently occupied leased properties expire at varying dates, generally within the next 17 years.
We anticipate no difficulty in retaining occupancy through lease renewals, month-to-month occupancy or replacing the leased properties with equivalent properties. We believe that suitable additional or substitute leased properties will be available as required.
Item 3. Legal Proceedings
We are party to various legal proceedings that arise in the ordinary course of our business, which include commercial, intellectual property, employment, tort and other litigation matters. We are also subject to audit by federal, state, international, national, provincial and local authorities, and by various partners, group purchasing organizations and customers, including government agencies, relating to purchases and sales under various contracts. In addition, we are subject to indemnification claims under various contracts. From time to time, certain of our customers file voluntary petitions for reorganization or liquidation under the US bankruptcy laws or similar laws of the jurisdictions for our business activities outside of the US. In such cases, certain pre-petition payments received by us could be considered preference items and subject to return to the bankruptcy administrator.
As of December 31, 2019, we do not believe that there is a reasonable possibility that any material loss exceeding the amounts already recognized for these proceedings and matters, if any, has been incurred. However, the ultimate resolutions of these proceedings and matters are inherently unpredictable. As such, our financial condition and results of operations could be adversely affected in any particular period by the unfavorable resolution of one or more of these proceedings or matters.
Item 4. Mine Safety Disclosures
Not applicable.
Information about our Executive Officers
The following table lists the name, age as of February 28, 2020 and positions of each executive officer of the Company.
| Name | Age | Position |
| Christine A. Leahy | 55 | President and Chief Executive Officer and member of our Board of Directors since January 2019; Chief Revenue Officer from July 2017 to December 2018; Senior Vice President - International, Chief Legal Officer, and Corporate Secretary from May 2016 to July 2017; Senior Vice President, General Counsel and Corporate Secretary from January 2007 to May 2016. |
| Jill M. Billhorn | 58 | Senior Vice President, Corporate Sales since January 2019; Vice President, Strategic Solution Sales of CDW Direct, LLC from January 2018 to December 2018; Vice President, East Region of CDW Direct, LLC from August 2015 to January 2018; Vice President - Small Business of CDW Direct, LLC from August 2010 to August 2015. |
| Sona Chawla | 52 | Chief Growth and Innovation Officer since January 2020; President, Kohl's Corporation (an omnichannel retailer) from May 2018 to October 2019 and Chief Operating Officer from November 2015 to May 2018; President, Digital and Chief Marketing Officer, Walgreen Company (a drugstore chain) from February 2014 to November 2015. |
| Mark C. Chong | 49 | Senior Vice President of Strategy and Marketing since November 2016; Partner, Bain & Company (a global management consulting firm) from January 2010 to September 2016. |
| Elizabeth H. Connelly | 55 | Chief Human Resources Officer and Senior Vice President, Coworker Services since December 2018; Managing Director and Head, Commercial Bank Healthcare, Higher Education and Not-for-Profit Banking at J.P. Morgan Chase & Company (a global financial services firm) from March 2012 to December 2018. |
| Christina M. Corley | 52 | Chief Commercial and Operating Officer since January 2020; Chief Operating Officer since January 2019; Senior Vice President, Commercial and International Markets from July 2017 to December 2018; Senior Vice President, Corporate Sales from September 2011 to July 2017. |
| Douglas E. Eckrote | 55 | Senior Vice President, Small Business Sales and eCommerce since August 2016; Senior Vice President, Strategic Solutions and Services from November 2009 to August 2016. |
| Collin B. Kebo | 53 | Senior Vice President and Chief Financial Officer since January 2018; Vice President, Financial Planning and Analysis from December 2008 to December 2017; Chief Financial Officer - International from May 2016 to December 2017. |
| Robert F. Kirby | 54 | Senior Vice President, Public Sales since July 2018; Vice President, Federal and State and Local Sales of CDW Government LLC from June 2011 to August 2018. |
| Frederick J. Kulevich | 54 | Senior Vice President, General Counsel and Corporate Secretary since October 2017; Vice President and Deputy General Counsel from May 2016 to October 2017; Vice President and Assistant General Counsel from May 2014 to May 2016; Senior Director, Ethics and Compliance from July 2006 to May 2014. |
| Christina V. Rother | 56 | Senior Vice President, Integrated Technology Solutions since July 2018; Senior Vice President, Public and Advanced Technology Sales from September 2011 to July 2018. |
| Jonathan J. Stevens | 50 | Senior Vice President, Operations and Chief Information Officer since November 2009. |
| Matthew A. Troka | 49 | Senior Vice President, Product and Partner Management since March 2011. |
PART II
Item 5. Market for Registrant's Common Equity, Related Stockholder Matters and Issuer Purchases of Equity Securities
Market Information
Our common stock has been listed on the Nasdaq Global Select Market since June 27, 2013 under the symbol "CDW."
Holders
As of February 25, 2020, there were 17 holders of record of our common stock. The number of beneficial stockholders is substantially greater than the number of holders of record because a portion of our common stock is held through brokerage firms.
Dividends
On February 6, 2020, we announced that our Board of Directors declared a quarterly cash dividend on our common stock of $0.380 per share. The dividend will be paid on March 10, 2020 to all stockholders of record as of the close of business on February 25, 2020.
We expect to continue to pay quarterly cash dividends on our common stock in the future, but such payments remain at the discretion of our Board of Directors and will depend upon our results of operations, financial condition, business prospects, capital requirements, contractual restrictions, any potential indebtedness we may incur, restrictions imposed by applicable law, tax considerations and other factors that our Board of Directors deems relevant. In addition, our ability to pay dividends on our common stock will be limited by restrictions on our ability to pay dividends or make distributions to our stockholders and on the ability of our subsidiaries to pay dividends or make distributions to us, in each case, under the terms of our current and any future agreements governing our indebtedness. For additional information on our cash resources and needs and restrictions on our ability to pay dividends, see "Management's Discussion and Analysis of Financial Condition and Results of Operations—Liquidity and Capital Resources" included elsewhere in this report. For additional information on restrictions on our ability to pay dividends, see Note 9 (Long-Term Debt) to the accompanying Consolidated Financial Statements.
Issuer Purchases of Equity Securities
On February 7, 2019, we announced that our Board of Directors authorized a $1 billion increase to our share repurchase program under which we may repurchase shares of our common stock in the open market through privately negotiated or other transactions, depending on share price, market conditions and other factors.
Information relating to the Company's purchases of its common stock during the quarter ended December 31, 2019 is as follows:
| Period | Total Number of Shares Purchased (in millions) | Average Price Paid per Share | Total Number of Shares Purchased as Part of a Publicly Announced Program (in millions) | Maximum Dollar Value of Shares that May Yet be Purchased Under the Program(1) (in millions) | ||||||||||
| October 1 through October 31, 2019 | 0.4 | $ | 122.89 | 0.4 | $ | 798.0 | ||||||||
| November 1 through November 30, 2019 | 0.5 | $ | 135.10 | 0.5 | $ | 731.7 | ||||||||
| December 1 through December 31, 2019 | 0.4 | $ | 137.53 | 0.4 | $ | 678.7 | ||||||||
| Total | 1.3 | 1.3 |
| (1) | The amounts presented in this column are the remaining total authorized value to be spent after each month's repurchases. |
Cumulative Total Shareholder Return
The information contained in this Cumulative Total Shareholder Return section shall not be deemed to be "soliciting material" or "filed" or incorporated by reference in future filings with the SEC, or subject to the liabilities of Section 18 of the Securities Exchange Act of 1934, except to the extent that we specifically incorporate it by reference into a document filed under the Securities Act of 1933 or the Securities Exchange Act of 1934.
The following graph compares the cumulative total shareholder return, calculated on a dividend reinvested basis, on $100.00 invested at the closing of the market on December 31, 2014 through and including the market close on December 31, 2019, with the cumulative total return for the same time period of the same amount invested in the S&P 500 Index and a peer group index. Our peer group index for 2019 consists of the following companies: Anixter International, Inc., Arrow Electronics, Inc., Avnet, Inc., CGI Group Inc., Cognizant Technology Solutions Corporation, DXC Technology Company, Genuine Parts Company, Henry
Schein, Inc., Insight Enterprises, Inc., LKQ Corporation, Patterson Companies, Inc., SYNNEX Corporation, Tech Data Corporation, W.W. Grainger, Inc. and Wesco International, Inc. This peer group was selected based on a review of publicly available information about these companies and our determination that they met one or more of the following criteria: (i) similar size in terms of revenue and/or enterprise value (one-third to three times our revenue or enterprise value); (ii) operates in a business-to-business distribution environment; (iii) members of the technology industry; (iv) similar customers (i.e., business, government, healthcare, and education); (v) companies that provide services and/or solutions; (vi) similar margins; (vii) comparable percentage of international sales; (viii) frequently identified as a peer by the other peer companies or Institutional Shareholder Services Inc.; or (ix) identified by the Company as a competitor.
The cumulative total shareholder returns over the indicated period are based on historical data and should not be considered indicative of future shareholder returns.
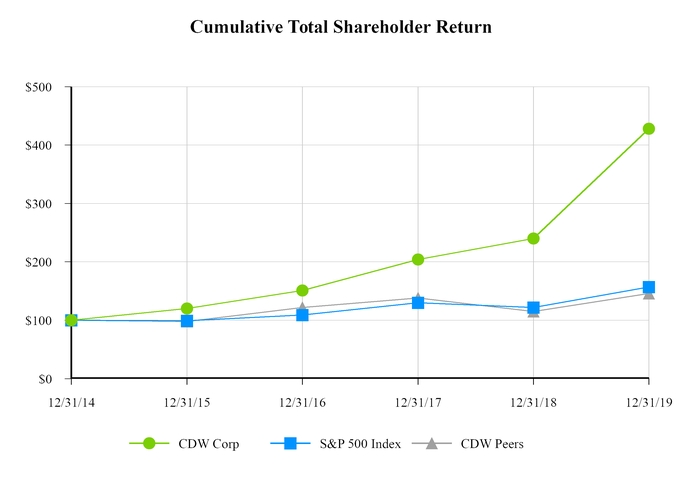
| December 31, 2014 | December 31, 2015 | December 31, 2016 | December 31, 2017 | December 31, 2018 | December 31, 2019 | |||||||||||||||||||
| CDW Corp | $ | 100 | $ | 120 | $ | 151 | $ | 204 | $ | 240 | $ | 428 | ||||||||||||
| S&P 500 Index | $ | 100 | $ | 99 | $ | 109 | $ | 130 | $ | 122 | $ | 157 | ||||||||||||
| CDW Peers | $ | 100 | $ | 98 | $ | 122 | $ | 138 | $ | 115 | $ | 146 |
Recent Sales of Unregistered Securities
None.
Item 6. Selected Financial Data
The selected financial data set forth below are not necessarily indicative of the results of future operations and should be read in conjunction with "Management's Discussion and Analysis of Financial Condition and Results of Operations" and our Consolidated Financial Statements and the related notes.
We have derived the selected financial data presented below as of December 31, 2019 and 2018 and for the years ended December 31, 2019, 2018 and 2017 from our Consolidated Financial Statements and related notes included elsewhere in this report. The selected financial data as of December 31, 2017, 2016 and 2015 and for the years ended December 31, 2016 and 2015 have been derived from our Consolidated Financial Statements as of and for those periods and are not included in this report.
| Year Ended December 31, | ||||||||||||||||||||||
| (dollars in millions, except per share amounts) | 2019 | 2018 | 2017 | 2016 | 2015(1) | |||||||||||||||||
| Statement of Operations Data: | ||||||||||||||||||||||
| Net sales | $ | 18,032.4 | $ | 16,240.5 | $ | 14,832.9 | $ | 13,672.7 | $ | 12,988.7 | ||||||||||||
| Cost of sales | 14,992.5 | 13,533.6 | 12,382.7 | 11,344.4 | 10,872.9 | |||||||||||||||||
| Gross profit | 3,039.9 | 2,706.9 | 2,450.2 | 2,328.3 | 2,115.8 | |||||||||||||||||
| Selling and administrative expenses | 1,713.1 | 1,537.1 | 1,410.0 | 1,345.4 | 1,226.0 | |||||||||||||||||
| Advertising expense | 193.2 | 182.5 | 173.7 | 162.9 | 147.8 | |||||||||||||||||
| Operating income | 1,133.6 | 987.3 | 866.5 | 820.0 | 742.0 | |||||||||||||||||
| Interest expense, net | (159.4 | ) | (148.6 | ) | (150.5 | ) | (146.5 | ) | (159.5 | ) | ||||||||||||
| Gain on remeasurement of equity investment | — | — | — | — | 98.1 | |||||||||||||||||
| Other (expense) income, net | (24.5 | ) | 1.8 | (55.3 | ) | (0.3 | ) | (33.6 | ) | |||||||||||||
| Income before income taxes | 949.7 | 840.5 | 660.7 | 673.2 | 647.0 | |||||||||||||||||
| Income tax expense | (212.9 | ) | (197.5 | ) | (137.6 | ) | (248.1 | ) | (243.9 | ) | ||||||||||||
| Net income | $ | 736.8 | $ | 643.0 | $ | 523.1 | $ | 425.1 | $ | 403.1 | ||||||||||||
| Net income per common share: | ||||||||||||||||||||||
| Basic | $ | 5.08 | $ | 4.26 | $ | 3.37 | $ | 2.60 | $ | 2.37 | ||||||||||||
| Diluted | $ | 4.99 | $ | 4.19 | $ | 3.31 | $ | 2.56 | $ | 2.35 | ||||||||||||
| Cash dividends declared per common share | $ | 1.2650 | $ | 0.9250 | $ | 0.6900 | — | $ | 0.4825 | — | $ | 0.3100 | ||||||||||
| Balance Sheet Data (at period end): | ||||||||||||||||||||||
| Cash and cash equivalents | $ | 154.0 | $ | 205.8 | $ | 144.2 | $ | 263.7 | $ | 37.6 | ||||||||||||
| Working capital | 842.7 | 993.7 | 874.2 | 959.9 | 903.5 | |||||||||||||||||
| Total assets | 7,999.4 | 7,167.7 | 6,966.7 | 6,958.4 | 6,755.3 | |||||||||||||||||
| Total debt and capitalized lease obligations(2) | 3,317.3 | 3,209.1 | 3,236.7 | 3,236.6 | 3,262.9 | |||||||||||||||||
| Total stockholders' equity | 960.3 | 975.2 | 985.6 | 1,047.9 | 1,095.9 | |||||||||||||||||
| Other Financial Data: | ||||||||||||||||||||||
| Capital expenditures | $ | 236.3 | $ | 86.1 | $ | 81.1 | $ | 63.5 | $ | 90.1 | ||||||||||||
| Gross profit as a percentage of Net sales | 16.9 | % | 16.7 | % | 16.5 | % | 17.0 | % | 16.3 | % | ||||||||||||
| Non-GAAP operating income(3) | $ | 1,368.4 | $ | 1,216.6 | $ | 1,106.8 | $ | 1,048.3 | $ | 960.9 | ||||||||||||
| Non-GAAP net income(4) | 902.1 | 794.3 | 605.9 | 569.7 | 503.5 | |||||||||||||||||
| Statement of Cash Flows Data: | ||||||||||||||||||||||
| Net cash provided by (used in): | ||||||||||||||||||||||
| Operating activities | $ | 1,027.2 | $ | 905.9 | $ | 777.7 | $ | 604.0 | $ | 277.5 | ||||||||||||
| Investing activities | (331.4 | ) | (86.1 | ) | (81.1 | ) | (65.9 | ) | (354.4 | ) | ||||||||||||
| Financing activities | (749.8 | ) | (754.8 | ) | (818.7 | ) | (304.6 | ) | (226.5 | ) |
| (1) | Includes the impact of consolidating five months of CDW UK's financial results. |
| (2) | Excludes borrowings of $430 million, $429 million, $498 million, $580 million and $440 million as of December 31, 2019, 2018, 2017, 2016 and 2015, respectively, under our inventory financing agreements. We do not include these borrowings in total debt because we have not in the past incurred, and in the future do not expect to incur, any interest expense or late fees under these agreements. |
| (3) | Non-GAAP operating income excludes, among other things, charges related to the amortization of acquisition-related intangible assets, equity-based compensation and the associated payroll taxes, and acquisition and integration expenses. |
Non-GAAP operating income is considered a non-GAAP financial measure. Generally, a non-GAAP financial measure is a numerical measure of a company's performance or financial position that either excludes or includes amounts that are not normally included or excluded in the most directly comparable measure calculated and presented in accordance with GAAP. Non-GAAP measures used by management may differ from similar measures used by other companies, even when similar terms are used to identify such measures. We believe Non-GAAP operating income provide analysts, investors and management with helpful information regarding the underlying operating performance of our business, as this measure removes the impact of items that management believes are not reflective of underlying operating performance. Management uses this measure to evaluate period-over-period performance as management believes it provides a more comparable measure of the underlying business.
The following unaudited table sets forth a reconciliation of Operating income to Non-GAAP operating income for the periods presented:
| Year Ended December 31, | ||||||||||||||||||||
| (dollars in millions) | 2019 | 2018 | 2017 | 2016 | 2015(1) | |||||||||||||||
| Operating income | $ | 1,133.6 | $ | 987.3 | $ | 866.5 | $ | 820.0 | $ | 742.0 | ||||||||||
| Amortization of intangibles | 178.5 | 182.7 | 185.1 | 187.2 | 173.9 | |||||||||||||||
| Equity-based compensation | 48.5 | 40.7 | 43.7 | 39.2 | 31.2 | |||||||||||||||
| Other adjustments(2) | 7.8 | 5.9 | 11.5 | 1.9 | 13.8 | |||||||||||||||
| Non-GAAP operating income | $ | 1,368.4 | $ | 1,216.6 | $ | 1,106.8 | $ | 1,048.3 | $ | 960.9 |
| (1) | Includes the impact of consolidating five months of CDW UK's financial results. |
| (2) | Primarily includes payroll taxes on equity-based compensation, consolidation of office space, settlement of litigation matters, and acquisition and integration expenses. |
| (4) | Non-GAAP net income excludes, among other things, charges related to acquisition-related intangible asset amortization, equity-based compensation, net loss on extinguishment of long-term debt, acquisition and integration expenses, and the associated tax effects of each. Non-GAAP net income is considered a non-GAAP financial measure. Generally, a non-GAAP financial measure is a numerical measure of a company's performance or financial position that either excludes or includes amounts that are not normally included or excluded in the most directly comparable measure calculated and presented in accordance with GAAP. Non-GAAP measures used by management may differ from similar measures used by other companies, even when similar terms are used to identify such measures. We believe that Non-GAAP net income provides analysts, investors and management with helpful information regarding the underlying operating performance of our business, as this measure removes the impact of items that management believes are not reflective of underlying operating performance. Management uses this measure to evaluate period-over-period performance as management believes it provides a more comparable measure of the underlying business. |
The following unaudited table sets forth a reconciliation of Net income to Non-GAAP net income for the periods presented:
| Year Ended December 31, | ||||||||||||||||||||
| (dollars in millions) | 2019 | 2018 | 2017 | 2016 | 2015(1) | |||||||||||||||
| Net income | $ | 736.8 | $ | 643.0 | $ | 523.1 | $ | 425.1 | $ | 403.1 | ||||||||||
| Amortization of intangibles(2) | 178.5 | 182.7 | 185.1 | 187.2 | 173.9 | |||||||||||||||
| Equity-based compensation | 48.5 | 40.7 | 43.7 | 39.2 | 31.2 | |||||||||||||||
| Net loss on extinguishments of long-term debt | 22.1 | — | 57.4 | 2.1 | 24.3 | |||||||||||||||
| Gain on remeasurement of equity investment(3) | — | — | — | — | (98.1 | ) | ||||||||||||||
| Other adjustments(4) | 7.8 | 5.9 | 11.5 | 1.9 | 33.9 | |||||||||||||||
| Aggregate adjustments for income taxes(5) | (91.6 | ) | (78.0 | ) | (214.9 | ) | (85.8 | ) | (64.8 | ) | ||||||||||
| Non-GAAP net income | $ | 902.1 | $ | 794.3 | $ | 605.9 | $ | 569.7 | $ | 503.5 |
| (1) | Includes the impact of consolidating five months of CDW UK's financial results. |
| (2) | Includes amortization expense for acquisition-related intangible assets, primarily customer relationships, customer contracts and trade names. |
| (3) | Represents the gain resulting from the remeasurement of the Company's previously held 35% equity investment to fair value upon the completion of the acquisition of CDW UK. |
| (4) | Primarily includes expenses related to the consolidation of office space, settlement of litigation matters, the favorable resolution of a local sales tax matter, acquisition and integration expenses and the Company's 35% share of expenses related to certain equity awards for the acquisition of CDW UK. |
| (5) | Aggregate adjustments for income taxes consists of the following: |
| Year Ended December 31, | |||||||||||||||||||
| (dollars in millions) | 2019 | 2018 | 2017 | 2016 | 2015 | ||||||||||||||
| Total Non-GAAP adjustments | $ | 256.9 | $ | 229.3 | $ | 297.7 | $ | 230.4 | $ | 165.2 | |||||||||
| Weighted-average statutory effective rate | 25.0 | % | 25.0 | % | 36.0 | % | 36.0 | % | 38.0 | % | |||||||||
| Income tax | (64.2 | ) | (57.3 | ) | (107.2 | ) | (82.9 | ) | (62.8 | ) | |||||||||
| Deferred tax adjustment due to law changes | 0.3 | 0.5 | 1.3 | (1.5 | ) | (4.0 | ) | ||||||||||||
| Excess tax benefits from equity-based compensation | (24.5 | ) | (19.1 | ) | (36.2 | ) | (1.8 | ) | — | ||||||||||
| Discrete tax benefit related to CDW Canada's acquisition of Scalar | (3.0 | ) | — | — | — | — | |||||||||||||
| Tax Cuts and Jobs Act | — | (1.9 | ) | (75.5 | ) | — | — | ||||||||||||
| Withholding tax expense on the unremitted earnings of our Canadian subsidiary | — | — | — | — | 3.3 | ||||||||||||||
| Non-deductible adjustments and other | (0.2 | ) | (0.2 | ) | 2.7 | 0.4 | (1.3 | ) | |||||||||||
| Total aggregate adjustments for income taxes | $ | (91.6 | ) | $ | (78.0 | ) | $ | (214.9 | ) | $ | (85.8 | ) | $ | (64.8 | ) |
Item 7. Management's Discussion and Analysis of Financial Condition and Results of Operations
Unless otherwise indicated or the context otherwise requires, as used in this "Management's Discussion and Analysis of Financial Condition and Results of Operations," the terms "we," "us," "the Company," "our," "CDW" and similar terms refer to CDW Corporation and its subsidiaries. "Management's Discussion and Analysis of Financial Condition and Results of Operations" should be read in conjunction with the Consolidated Financial Statements and the related notes included elsewhere in this report. This discussion contains forward-looking statements that are subject to numerous risks and uncertainties. Actual results may differ materially from those contained in any forward-looking statements. See "Forward-Looking Statements" above.
Overview
CDW Corporation, a Fortune 500 company and member of the S&P 500 Index, is a market-leading provider of integrated information technology ("IT") solutions to small, medium and large business, government, education and healthcare customers in the US, the UK and Canada. Our broad array of offerings ranges from discrete hardware and software products to integrated IT solutions such as mobility, security, data center optimization, cloud computing, virtualization and collaboration.
We are technology "agnostic," with a solutions portfolio including more than 100,000 products and services from more than 1,000 leading and emerging brands. Our solutions are delivered in physical, virtual and cloud-based environments through approximately 6,800 customer-facing coworkers, including sellers, highly-skilled technology specialists and advanced service delivery engineers. We are a leading sales channel partner for many original equipment manufacturers ("OEMs"), software publishers and cloud providers (collectively, our "vendor partners"), whose products we sell or include in the solutions we offer. We provide our vendor partners with a cost-effective way to reach customers and deliver a consistent brand experience through our established end-market coverage, technical expertise and extensive customer access.
We have three reportable segments, Corporate, Small Business and Public. Our Corporate segment primarily serves US private sector business customers with more than 250 employees. Our Small Business segment primarily serves US private sector business customers with up to 250 employees. Our Public segment is comprised of government agencies and education and healthcare institutions in the US. We also have two other operating segments: CDW UK and CDW Canada, each of which do not meet the reportable segment quantitative thresholds and, accordingly, are included in an all other category ("Other").
We may sell all or only select products that our vendor partners offer. Each vendor partner agreement provides for specific terms and conditions, which may include one or more of the following: product return privileges, price protection policies, purchase discounts and vendor incentive programs, such as purchase or sales rebates and cooperative advertising reimbursements. We also resell software for major software publishers. Our agreements with software publishers allow the end-user customer to acquire software or licensed products and services. In addition to helping our customers determine the best software solutions for their needs, we help them manage their software agreements, including warranties and renewals. A significant portion of our advertising and marketing expenses are reimbursed through cooperative advertising programs with our vendor partners. These programs are at the discretion of our vendor partners and are typically tied to sales or other commitments to be met by us within a specified period of time.
For a discussion of results for the year ended December 31, 2017, see "Item 7. Management's Discussion and Analysis of Financial Condition and Results of Operations" of our Annual Report on Form 10-K for the year ended December 31, 2018, filed with the Securities and Exchange Commission on February 27, 2019.
Trends and Key Factors Affecting our Financial Performance
We believe the following key factors may have a meaningful impact on our business performance, influencing our ability to generate sales and achieve our targeted financial and operating results:
| • | General economic conditions are a key factor affecting our results as they impact our customers' willingness to spend on information technology. This is particularly the case for our Corporate and Small Business customers, as their purchases tend to reflect confidence in their business prospects, which are driven by their discrete perceptions of business and general economic conditions. Additionally, changes in trade policy and product constraints from suppliers could have an adverse impact on our business. There is uncertainty regarding whether the rapidly evolving coronavirus could impact our supply chain causing product constraints, which could have an adverse impact on our business. There continues to be substantial uncertainty regarding the impact of the UK's exit from the European Union ("EU") (referred to as "Brexit"). Potential adverse consequences of Brexit such as global market uncertainty, volatility in currency exchange rates, greater restrictions on imports and exports between UK and EU countries and increased regulatory complexities could have a negative impact on our business, financial condition and results of operations. To date, CDW UK has not experienced significant changes in the buying behavior of its customers even with the uncertainty related to the ultimate terms of |
Brexit. We have established a presence in the Netherlands to support CDW UK's broader growth opportunities in the EU and to help address future developments, as needed, for Brexit.
| • | Changes in spending policies, budget priorities and funding levels are a key factor influencing the purchasing levels of government, healthcare and education customers. |
| • | Technology trends drive customer purchasing behaviors in the market. Current technology trends are focused on delivering greater flexibility and efficiency, as well as designing IT securely. These trends are driving customer adoption of solutions such as those delivered via cloud, software defined architectures and hybrid on-premise and off-premise combinations, as well as the evolution of the IT consumption model to more "as a service" offerings, including Device as a Service and managed services. |
Key Business Metrics
We monitor a number of financial and non-financial measures and ratios on a regular basis in order to track the progress of our business and make adjustments as necessary. Effective January 1, 2019, we made a change to the non-GAAP financial measures that we use to provide meaningful methods of evaluating our financial performance and have replaced EBITDA, Adjusted EBITDA and Adjusted EBITDA margin with Non-GAAP operating income and Non-GAAP operating income margin. We made this change due to the continuing evolution of the IT consumption model. We believe Non-GAAP operating income will be more reflective of the costs of providing services to our customers and our own costs as the consumption model continues to evolve. Non-GAAP operating income is also being used for the first time in 2019 as a key business metric for our annual incentive compensation programs.
In addition to Non-GAAP operating income and Non-GAAP operating income margin, we believe that the most important financial and non-financial measures and ratios include average daily sales, gross margin, operating margin, Net income, Non-GAAP income before income taxes, Non-GAAP net income, Net income per diluted share, Non-GAAP net income per diluted share, free cash flow, return on working capital, Cash and cash equivalents, net working capital, cash conversion cycle, debt levels including available credit, sales per coworker and coworker turnover. These measures and ratios are compared to standards or objectives set by management, so that actions can be taken, as necessary, in order to achieve the standards and objectives.
In this report, we discuss Non-GAAP operating income, Non-GAAP operating income margin, Non-GAAP income before income taxes and Non-GAAP net income, which are non-GAAP financial measures.
We believe these measures provide analysts, investors and management with helpful information regarding the underlying operating performance of our business, as they remove the impact of items that management believes are not reflective of underlying operating performance. Management uses these measures to evaluate period-over-period performance as management believes they provide a more comparable measure of the underlying business. For the definitions of Non-GAAP operating income, Non-GAAP operating income margin, Non-GAAP income before income taxes and Non-GAAP net income and reconciliations to the most directly comparable GAAP measure, see "Results of Operations - Non-GAAP Financial Measure Reconciliations."
The results of certain key business metrics are as follows:
| Year Ended December 31, | |||||||||||
| (dollars in millions) | 2019 | 2018 | 2017 | ||||||||
| Net sales | $ | 18,032.4 | $ | 16,240.5 | $ | 14,832.9 | |||||
| Gross profit | 3,039.9 | 2,706.9 | 2,450.2 | ||||||||
| Operating income | 1,133.6 | 987.3 | 866.5 | ||||||||
| Net income | 736.8 | 643.0 | 523.1 | ||||||||
| Non-GAAP operating income | 1,368.4 | 1,216.6 | 1,106.8 | ||||||||
| Non-GAAP net income | 902.1 | 794.3 | 605.9 | ||||||||
| Average daily sales(1) | 71.0 | 63.9 | 58.4 | ||||||||
| Net debt(2) | 3,163.3 | 3,002.8 | 3,091.3 | ||||||||
| Cash conversion cycle (in days)(3) | 18 | 19 | 19 |
| (1) | There were 254 selling days for each of the years ended December 31, 2019, 2018 and 2017. |
| (2) | Defined as Total debt minus Cash and cash equivalents. |
| (3) | Cash conversion cycle is defined as days of sales outstanding in Accounts receivable and certain receivables due from vendors plus days of supply in Merchandise inventory minus days of purchases outstanding in Accounts payable and Accounts payable-inventory financing, based on a rolling three-month average. |
Results of Operations
Results of operations, in dollars and as a percentage of Net sales are as follows:
| Year Ended December 31, | ||||||||||||||
| 2019 | 2018 | |||||||||||||
| Dollars in Millions | Percentage of Net Sales | Dollars in Millions | Percentage of Net Sales | |||||||||||
| Net sales | $ | 18,032.4 | 100.0 | % | $ | 16,240.5 | 100.0 | % | ||||||
| Cost of sales | 14,992.5 | 83.1 | 13,533.6 | 83.3 | ||||||||||
| Gross profit | 3,039.9 | 16.9 | 2,706.9 | 16.7 | ||||||||||
| Selling and administrative expenses | 1,713.1 | 9.5 | 1,537.1 | 9.5 | ||||||||||
| Advertising expense | 193.2 | 1.1 | 182.5 | 1.1 | ||||||||||
| Operating income | 1,133.6 | 6.3 | 987.3 | 6.1 | ||||||||||
| Interest expense, net | (159.4 | ) | (0.9 | ) | (148.6 | ) | (0.9 | ) | ||||||
| Other (expense) income, net | (24.5 | ) | (0.1 | ) | 1.8 | — | ||||||||
| Income before income taxes | 949.7 | 5.3 | 840.5 | 5.2 | ||||||||||
| Income tax expense | (212.9 | ) | (1.2 | ) | (197.5 | ) | (1.2 | ) | ||||||
| Net income | $ | 736.8 | 4.1 | % | $ | 643.0 | 4.0 | % |
Net sales
Net sales by segment, in dollars and as a percentage of total Net sales, and the year-over-year dollar and percentage change in Net sales are as follows:
| Year Ended December 31, | |||||||||||||||||||||
| 2019 | 2018 | ||||||||||||||||||||
| (dollars in millions) | Net Sales | Percentage of Total Net Sales | Net Sales | Percentage of Total Net Sales | Dollar Change | Percent Change(1) | |||||||||||||||
| Corporate | $ | 7,499.0 | 41.6 | % | $ | 6,842.5 | 42.1 | % | $ | 656.5 | 9.6 | % | |||||||||
| Small Business | 1,510.3 | 8.4 | 1,359.6 | 8.4 | 150.7 | 11.1 | |||||||||||||||
| Public: | |||||||||||||||||||||
| Government | 2,519.3 | 14.0 | 2,097.3 | 12.9 | 422.0 | 20.1 | |||||||||||||||
| Education | 2,411.6 | 13.4 | 2,327.4 | 14.3 | 84.2 | 3.6 | |||||||||||||||
| Healthcare | 1,933.9 | 10.7 | 1,730.0 | 10.7 | 203.9 | 11.8 | |||||||||||||||
| Total Public | 6,864.8 | 38.1 | 6,154.7 | 37.9 | 710.1 | 11.5 | |||||||||||||||
| Other | 2,158.3 | 12.0 | 1,883.7 | 11.6 | 274.6 | 14.6 | |||||||||||||||
| Total Net sales | $ | 18,032.4 | 100.0 | % | $ | 16,240.5 | 100.0 | % | $ | 1,791.9 | 11.0 | % |
| (1) | There were 254 selling days for each of the years ended December 31, 2019 and 2018. |
Total Net sales for the year ended December 31, 2019 increased $1,792 million, or 11.0%, to $18,032 million, compared to the prior year. Excluding the impact of foreign currency fluctuations, constant currency Net sales growth was 11.5%. For additional information, see "Non-GAAP Financial Measure Reconciliations" below regarding constant currency Net sales growth.
For the year ended December 31, 2019, Net sales growth reflected growth across all major product categories, particularly client devices (defined as notebooks/mobile devices and desktops), software and services. Additionally, eleven months of results from Scalar, which was acquired on February 1, 2019, contributed to our Net sales growth. For additional information, see Note 17 (Segment Information) to the accompanying Consolidated Financial Statements.
Corporate segment Net sales for the year ended December 31, 2019 increased $657 million, or 9.6%, compared to the year ended December 31, 2018. Growth was primarily driven by client devices and software.
Small Business segment Net sales for the year ended December 31, 2019 increased by $151 million, or 11.1%, compared to the year ended December 31, 2018. Growth was primarily driven by client devices and software.
Public segment Net sales for the year ended December 31, 2019 increased $710 million, or 11.5%, compared to the year ended December 31, 2018. The increase was primarily driven by growth in Government and Healthcare. Net sales to Government customers increased 20.1% primarily driven by client devices, software and netcomm. Net sales to Healthcare customers increased 11.8% primarily driven by client devices and software. Net sales to Education customers increased 3.6% primarily driven by client devices and video, partially offset by netcomm.
Net sales in Other, which is comprised of results from our UK and Canadian operations, for the year ended December 31, 2019 increased $275 million, or 14.6%, compared to the year ended December 31, 2018. Both operations grew in local currency and Canada growth included the incremental Net sales from Scalar. The impact of foreign currency exchange decreased Other Net sales growth by approximately 430 basis points, primarily due to the unfavorable translation of the British pound and Canadian dollar to the US dollar.
Gross profit
Gross profit increased $333 million, or 12.3%, to $3,040 million for the year ended December 31, 2019, compared to $2,707 million for the year ended December 31, 2018. As a percentage of Net sales, Gross profit margin increased 20 basis points to 16.9% for the year ended December 31, 2019. Gross profit margin was positively impacted by product margin and an increase in the mix of netted down revenues that are booked net of costs of goods sold, partially offset by Net sales growth outpacing partner funding growth.
Selling and administrative expenses
Selling and administrative expenses increased $176 million, or 11.5%, to $1,713 million for the year ended December 31, 2019, compared to $1,537 million for the year ended December 31, 2018. The increase was driven by higher sales payroll expenses consistent with higher gross profit.
As a percentage of total Net sales, Selling and administrative expenses remained flat at 9.5% for the years ended December 31, 2019 and 2018.
Operating income
During 2019, we evaluated our methodology for allocating certain depreciation and amortization expenses to each of our segments. The evaluation resulted in a revision to the allocation of depreciation and amortization expenses from Headquarters to our reportable segments, effective January 1, 2019. The prior period results have been recast to reflect these changes and present comparable information.
Operating income by segment, in dollars and as a percentage of Net sales, and the year-over-year percentage change was as follows:
| Year Ended December 31, | |||||||||||||||||
| 2019 | 2018 | ||||||||||||||||
| Dollars in Millions | Operating Margin | Dollars in Millions | Operating Margin | Percent Change in Operating Income | |||||||||||||
| Segments:(1) | |||||||||||||||||
| Corporate | $ | 585.1 | 7.8 | % | $ | 530.4 | 7.8 | % | 10.3 | % | |||||||
| Small Business | 107.5 | 7.1 | 94.4 | 6.9 | 13.9 | ||||||||||||
| Public | 475.0 | 6.9 | 405.0 | 6.6 | 17.3 | ||||||||||||
| Other(2) | 101.6 | 4.7 | 82.2 | 4.4 | 24.8 | ||||||||||||
| Headquarters(3) | (135.6 | ) | nm* | (124.7 | ) | nm* | 8.7 | ||||||||||
| Total Operating income | $ | 1,133.6 | 6.3 | % | $ | 987.3 | 6.1 | % | 14.8 | % |
- Not meaningful
| (1) | Segment operating income includes the segment's direct operating income, allocations for certain Headquarters costs, allocations for income and expenses from logistics services, certain inventory adjustments and volume rebates and cooperative advertising from vendors. |
| (2) | Includes the financial results for our other operating segments, CDW UK and CDW Canada, which do not meet the reportable segment quantitative thresholds. |
| (3) | Includes Headquarters' function costs that are not allocated to the segments. |
Operating income was $1,134 million for the year ended December 31, 2019, an increase of $147 million, or 14.8%, compared to $987 million for the year ended December 31, 2018. Operating income increased primarily due to higher gross profit dollars, partially offset by higher payroll expenses. Total operating margin percentage increased 20 basis points to 6.3% for the year ended December 31, 2019, from 6.1% for the year ended December 31, 2018 due to an increase in Gross profit margin and lower intangible asset amortization as a percentage of Net sales, partially offset by higher sales payroll expenses.
Corporate segment Operating income was $585 million for the year ended December 31, 2019, an increase of $55 million, or 10.3%, compared to $530 million for the year ended December 31, 2018. Corporate segment Operating income increased primarily due to higher gross profit dollars, partially offset by higher payroll expenses. Corporate segment operating margin percentage remained flat at 7.8% for the years ended December 31, 2019 and 2018.
Small Business segment Operating income was $108 million for the year ended December 31, 2019, an increase of $14 million, or 13.9%, compared to $94 million for the year ended December 31, 2018. Small Business segment Operating income increased primarily due to higher gross profit dollars, partially offset by higher sales payroll expenses. Small Business segment operating margin percentage increased 20 basis points to 7.1% for the year ended December 31, 2019, from 6.9% for the year ended December 31, 2018 due to lower sales payroll expenses and lower intangible asset amortization as a percentage of Net sales.
Public segment Operating income was $475 million for the year ended December 31, 2019, an increase of $70 million, or 17.3%, compared to $405 million for the year ended December 31, 2018. Public segment Operating income increased primarily due to higher gross profit dollars, partially offset by higher sales payroll expenses. Public segment operating margin percentage increased 30 basis points to 6.9% for the year ended December 31, 2019, from 6.6% for the year ended December 31, 2018 primarily due to product margin.
Other Operating income was $102 million for the year ended December 31, 2019, an increase of $20 million, or 24.8%, compared to $82 million for the year ended December 31, 2018. Other Operating income increased primarily due to higher gross profit dollars, partially offset by higher payroll expenses along with the unfavorable translation of the British pound and Canadian dollar to the US dollar. Other operating margin percentage increased 30 basis points to 4.7% for the year ended December 31, 2019, from 4.4% for the year ended December 31, 2018 due to product margin and lower intangible asset amortization as a percentage of Net sales, partially offset by higher payroll expenses.
Interest expense, net
Interest expense, net in 2019 was $159 million, an increase of $10 million, compared to $149 million in 2018. This increase was primarily due to paying an effective interest rate on the term loan in 2019 that exceeded the capped rate in 2018 and higher interest expense to finance the Scalar acquisition.
Income tax expense
Income tax expense was $213 million in 2019, compared to $198 million in 2018. The effective income tax rate, expressed by calculating income tax expense as a percentage of Income before income taxes, was 22.4% and 23.5% for 2019 and 2018, respectively.
For 2019, the effective tax rate differed from the US federal statutory rate primarily due to state income taxes, partially offset by tax credits, excess tax benefits on equity-based compensation and a tax benefit related to CDW Canada's acquisition of Scalar. For 2018, the effective tax rate differed from the US federal statutory rate primarily due to state income taxes, partially offset by excess tax benefits on equity-based compensation. The 2019 effective tax rate was lower than 2018 primarily due to tax credits, higher excess tax benefits on equity-based compensation and a discrete tax benefit related to CDW Canada's acquisition of Scalar.
Non-GAAP Financial Measure Reconciliations
We have included reconciliations of Non-GAAP operating income, Non-GAAP operating income margin, Non-GAAP income before income taxes, Non-GAAP net income, and Net sales growth on a constant currency basis for the years ended December 31, 2019 and 2018 below.
Non-GAAP operating income excludes, among other things, charges related to the amortization of acquisition-related intangible assets, equity-based compensation and the associated payroll taxes, and acquisition and integration expenses. Non-GAAP operating income margin is defined as Non-GAAP operating income as a percentage of Net sales. Non-GAAP income before income taxes and Non-GAAP net income exclude, among other things, charges related to acquisition-related intangible asset amortization, equity-based compensation, acquisition and integration expenses, and the associated tax effects of each. Net sales growth on a constant currency basis is defined as Net sales growth excluding the impact of foreign currency translation on net sales compared to the prior period.
Non-GAAP operating income, Non-GAAP operating income margin, Non-GAAP income before income taxes, Non-GAAP net income and Net sales growth on a constant currency basis are considered non-GAAP financial measures. Generally, a non-GAAP financial measure is a numerical measure of a company's performance or financial position that either excludes or includes amounts that are not normally included or excluded in the most directly comparable measure calculated and presented in accordance with GAAP. Non-GAAP measures used by management may differ from similar measures used by other companies, even when similar terms are used to identify such measures.
We believe these measures provide analysts, investors and management with helpful information regarding the underlying operating performance of our business, as they remove the impact of items that management believes are not reflective of underlying operating performance. Management uses these measures to evaluate period-over-period performance as management believes they provide a more comparable measure of the underlying business.
Non-GAAP operating income
Non-GAAP operating income was $1,368 million for the year ended December 31, 2019, an increase of $151 million, or 12.5%, compared to $1,217 million for the year ended December 31, 2018. As a percentage of Net sales, Non-GAAP operating income was 7.6% and 7.5% for the years ended December 31, 2019 and 2018, respectively.
| Year Ended December 31, | |||||||
| (dollars in millions) | 2019 | 2018 | |||||
| Operating income | $ | 1,133.6 | $ | 987.3 | |||
| Amortization of intangibles(1) | 178.5 | 182.7 | |||||
| Equity-based compensation | 48.5 | 40.7 | |||||
| Scalar acquisition and integration expenses | 3.0 | 1.5 | |||||
| Other adjustments(2) | 4.8 | 4.4 | |||||
| Non-GAAP operating income | $ | 1,368.4 | $ | 1,216.6 | |||
| Non-GAAP operating income margin | 7.6 | % | 7.5 | % |
| (1) | Includes amortization expense for acquisition-related intangible assets, primarily customer relationships, customer contracts and trade names. |
| (2) | Includes other expenses such as payroll taxes on equity-based compensation. |
Non-GAAP net income
Non-GAAP net income was $902 million for the year ended December 31, 2019, an increase of $108 million, or 13.6%, compared to $794 million for the year ended December 31, 2018.
| Year Ended December 31, 2019 | Year Ended December 31, 2018 | |||||||||||||||||||||||
| (dollars in millions) | Income before income taxes | Income tax expense(1) | Net income | Income before income taxes | Income tax expense(1) | Net income | ||||||||||||||||||
| GAAP (as reported) | $ | 949.7 | $ | (212.9 | ) | $ | 736.8 | $ | 840.5 | $ | (197.5 | ) | $ | 643.0 | ||||||||||
| Amortization of intangibles(2) | 178.5 | (44.6 | ) | 133.9 | 182.7 | (45.7 | ) | 137.0 | ||||||||||||||||
| Equity-based compensation | 48.5 | (36.6 | ) | 11.9 | 40.7 | (29.2 | ) | 11.5 | ||||||||||||||||
| Net loss on extinguishments of long-term debt | 22.1 | (5.5 | ) | 16.6 | — | — | — | |||||||||||||||||
| Scalar acquisition and integration expenses(3) | 3.0 | (3.7 | ) | (0.7 | ) | 1.5 | — | 1.5 | ||||||||||||||||
| Other adjustments(4) | 4.8 | (1.2 | ) | 3.6 | 4.4 | (3.1 | ) | 1.3 | ||||||||||||||||
| Non-GAAP | $ | 1,206.6 | $ | (304.5 | ) | $ | 902.1 | $ | 1,069.8 | $ | (275.5 | ) | $ | 794.3 |
| (1) | Income tax on non-GAAP adjustments includes excess tax benefits associated with equity-based compensation and the impact of global intangible low tax income ("GILTI") due to equity-based compensation and amortization of intangibles. |
| (2) | Includes amortization expense for acquisition-related intangible assets, primarily customer relationships, customer contracts and trade names. |
| (3) | Includes a $3 million discrete tax benefit related to CDW Canada's acquisition of Scalar. |
| (4) | Includes other expenses such as payroll taxes on equity-based compensation. |
Net sales growth on a constant currency basis
Net sales increased $1,791 million, or 11.0%, to $18,032 million for the year ended December 31, 2019, compared to $16,241 million for the year ended December 31, 2018. Net sales on a constant currency basis, which excludes the impact of foreign currency translation, increased $1,860 million, or 11.5%.
| Year Ended December 31, | |||||||||||
| (dollars in millions) | 2019 | 2018 | % Change(1) | ||||||||
| Net sales, as reported | $ | 18,032.4 | $ | 16,240.5 | 11.0 | % | |||||
| Foreign currency translation(2) | — | (67.8 | ) | ||||||||
| Net sales, on a constant currency basis | $ | 18,032.4 | $ | 16,172.7 | 11.5 | % |
| (1) | There were 254 selling days for each of the years ended December 31, 2019 and 2018. |
| (2) | Represents the effect of translating the prior period results of CDW UK and CDW Canada at the average exchange rates applicable in the current year. |
Seasonality
While we have not historically experienced significant seasonality throughout the year, sales in our Corporate segment, which primarily serves US private sector business customers with more than 250 employees, are typically higher in the fourth quarter than in other quarters due to customers spending their remaining technology budget dollars at the end of the year. Additionally, sales in our Public segment have historically been higher in the third quarter than in other quarters primarily due to the buying patterns of the federal government and education customers.
Liquidity and Capital Resources
Overview
We finance our operations and capital expenditures with internally generated cash from operations. As of December 31, 2019, we also have $1.0 billion of availability for borrowings under our senior secured asset-based revolving credit facility and an additional £50 million ($66 million at December 31, 2019) under the CDW UK revolving credit facility. Our liquidity and borrowing plans are established to align with our financial and strategic planning processes and ensure we have the necessary funding to meet our
operating commitments, which primarily include the purchase of inventory, payroll and general expenses. We also take into consideration our overall capital allocation strategy, which includes investment for future growth, dividend payments, acquisitions and share repurchases. We believe we have adequate sources of liquidity and funding available for at least the next year; however, there are a number of factors that may negatively impact our available sources of funds. The amount of cash generated from operations will be dependent upon factors such as the successful execution of our business plan and general economic conditions.
Long-Term Debt and Financing Arrangements
On September 26, 2019, we refinanced our 2023 Senior Notes through the issuance of 2028 Senior Notes. On October 11, 2019, we extended the maturity date of the Term Loan from August 2023 to October 2026. For additional information, see Note 9 (Long-Term Debt) to the accompanying Consolidated Financial Statements.
As of December 31, 2019, we had total indebtedness of $3.3 billion, of which $1.6 billion was secured indebtedness. At December 31, 2019, we were in compliance with the covenants under our various credit agreements and indentures.
For additional information regarding our debt and refinancing activities, see Note 9 (Long-Term Debt) to the accompanying Consolidated Financial Statements.
Inventory Financing Agreements
We have entered into agreements with certain financial intermediaries to facilitate the purchase of inventory from various suppliers under certain terms and conditions. These amounts are classified separately as Accounts payable-inventory financing on the Consolidated Balance Sheets. We do not incur any interest expense associated with these agreements as balances are paid when they are due. For additional information, see Note 6 (Inventory Financing Agreements) to the accompanying Consolidated Financial Statements.
Share Repurchase Program
During 2019, we repurchased 6.1 million shares of our common stock for $657 million under the previously announced share repurchase program. On February 7, 2019, we announced that our Board of Directors authorized a $1.0 billion increase to our share repurchase program. For additional information, see "Item 5. Market for Registrant's Common Equity, Related Stockholder Matters and Issuer Purchases of Equity Securities."
Dividends
A summary of 2019 dividend activity for our common stock is as follows:
| Dividend Amount | Declaration Date | Record Date | Payment Date | |||
| $0.295 | February 7, 2019 | February 25, 2019 | March 12, 2019 | |||
| $0.295 | May 1, 2019 | May 24, 2019 | June 11, 2019 | |||
| $0.295 | July 31, 2019 | August 26, 2019 | September 10, 2019 | |||
| $0.380 | October 31, 2019 | November 25, 2019 | December 10, 2019 | |||
| $1.265 |
On February 6, 2020, we announced that our Board of Directors declared a quarterly cash dividend on our common stock of $0.380 per share. The dividend will be paid on March 10, 2020 to all stockholders of record as of the close of business on February 25, 2020.
The payment of any future dividends will be at the discretion of our Board of Directors and will depend upon our results of operations, financial condition, business prospects, capital requirements, contractual restrictions, any potential indebtedness we may incur, restrictions imposed by applicable law, tax considerations and other factors that our Board of Directors deems relevant. In addition, our ability to pay dividends on our common stock will be limited by restrictions on our ability to pay dividends or make distributions to our stockholders and on the ability of our subsidiaries to pay dividends or make distributions to us, in each case, under the terms of our current and any future agreements governing our indebtedness.
Cash Flows
Cash flows from operating, investing and financing activities are as follows:
| Year Ended December 31, | |||||||
| (dollars in millions) | 2019 | 2018 | |||||
| Net cash provided by (used in): | |||||||
| Operating activities | $ | 1,027.2 | $ | 905.9 | |||
| Investing activities | (331.4 | ) | (86.1 | ) | |||
| Net change in accounts payable - inventory financing | (1.3 | ) | (67.4 | ) | |||
| Other financing activities | (748.5 | ) | (687.4 | ) | |||
| Financing activities | (749.8 | ) | (754.8 | ) | |||
| Effect of exchange rate changes on cash and cash equivalents | 2.2 | (3.4 | ) | ||||
| Net (decrease) increase in cash and cash equivalents | $ | (51.8 | ) | $ | 61.6 |
Operating Activities
Cash flows from operating activities are as follows:
| Year Ended December 31, | |||||||||||
| (dollars in millions) | 2019 | 2018 | Change | ||||||||
| Net income | $ | 736.8 | $ | 643.0 | $ | 93.8 | |||||
| Adjustments for the impact of non-cash items(1) | 256.7 | 261.1 | (4.4 | ) | |||||||
| Net income adjusted for the impact of non-cash items(2) | 993.5 | 904.1 | 89.4 | ||||||||
| Changes in assets and liabilities: | |||||||||||
| Accounts receivable(3) | (244.8 | ) | (365.1 | ) | 120.3 | ||||||
| Merchandise inventory(4) | (153.0 | ) | (46.8 | ) | (106.2 | ) | |||||
| Accounts payable-trade(5) | 194.1 | 271.2 | (77.1 | ) | |||||||
| Other(6) | 237.4 | 142.5 | 94.9 | ||||||||
| Net cash provided by operating activities | $ | 1,027.2 | $ | 905.9 | $ | 121.3 |
| (1) | Includes items such as deferred income taxes, depreciation and amortization, and equity-based compensation expense. |
| (2) | The change is due to stronger operating results driven by Net sales and Gross profit growth. |
| (3) | The change is due to improved collections performance. |
| (4) | The change is due to higher customer-driven and strategic stocking positions and timing of receipts and shipments. |
| (5) | The change is due to timing of payments. |
| (6) | The change is due to higher contract liabilities, partially offset by an increase in the receivables from vendors attributed to the growth in business. |
In order to manage our working capital and operating cash needs, we monitor our cash conversion cycle, defined as days of sales outstanding in accounts receivable plus days of supply in inventory minus days of purchases outstanding in accounts payable, based on a rolling three-month average. Components of our cash conversion cycle are as follows:
| December 31, | |||||
| (in days) | 2019 | 2018 | |||
| Days of sales outstanding (DSO)(1) | 57 | 56 | |||
| Days of supply in inventory (DIO)(2) | 14 | 13 | |||
| Days of purchases outstanding (DPO)(3) | (53 | ) | (50 | ) | |
| Cash conversion cycle | 18 | 19 |
| (1) | Represents the rolling three-month average of the balance of Accounts receivable, net at the end of the period, divided by average daily Net sales for the same three-month period. Also incorporates components of other miscellaneous receivables. |
| (2) | Represents the rolling three-month average of the balance of Merchandise inventory at the end of the period divided by average daily Cost of sales for the same three-month period. |
| (3) | Represents the rolling three-month average of the combined balance of Accounts payable-trade, excluding cash overdrafts, and Accounts payable-inventory financing at the end of the period divided by average daily Cost of sales for the same three-month period. |
The cash conversion cycle decreased to 18 days at December 31, 2019, compared to 19 days at December 31, 2018. DSO, DIO and DPO increased 1 day, 1 day and 3 days, respectively, compared to December 31, 2018. The increase in DSO was primarily driven by higher Net sales and third-party services such as Software as a Service and warranties. These sales have an unfavorable impact on DSO as the receivable is recognized on the Consolidated Balance Sheets on a gross basis while the corresponding sales amount in the Consolidated Statement of Operations is recorded on a net basis. This also results in a favorable impact on DPO as the payable is recognized on the Consolidated Balance Sheets without a corresponding Cost of sales in the Consolidated Statement of Operations because the cost paid to the vendor or third-party service provider is recorded as a reduction to Net sales. Additionally, DIO increased due to high customer-driven and strategic stocking positions and timing of receipts and shipments.
Investing Activities
Net cash used in investing activities increased $245 million in 2019 compared to 2018. The increase was primarily due to capital expenditures due to revenue generating assets and the completion of our acquisition of Scalar on February 1, 2019.
Financing Activities
Net cash used in financing activities decreased $5 million in the year ended December 31, 2019 compared to year ended December 31, 2018. The decrease was primarily driven by refinancing of our 2023 Senior Notes through the issuance of 2028 Senior Notes, further leveraging our inventory financing arrangements and borrowings under our revolving credit facilities, which were partially offset by our share repurchases and increasing dividends per share in the year ended December 31, 2019. For additional information regarding our debt activities, see Note 9 (Long-Term Debt) to the accompanying Consolidated Financial Statements.
Contractual Obligations
We have future obligations under various contracts relating to debt and interest payments and operating leases. Our estimated future payments, based on undiscounted amounts, under contractual obligations that existed as of December 31, 2019, are as follows:
| Payments Due by Period | |||||||||||||||||||
| (dollars in millions) | Total | 2020 | 2021-2022 | 2023-2024 | 2025 & Thereafter | ||||||||||||||
| Term Loan(1) | $ | 1,777.5 | $ | 66.6 | $ | 131.3 | $ | 129.3 | $ | 1,450.3 | |||||||||
| Revolving Loan(1) | 58.7 | 2.6 | 56.1 | — | — | ||||||||||||||
| CDW UK Term Loan(1) | 63.1 | 7.9 | 55.2 | — | — | ||||||||||||||
| Senior Notes due 2024(2) | 733.1 | 31.6 | 63.3 | 638.2 | — | ||||||||||||||
| Senior Notes due 2025(2) | 780.0 | 30.0 | 60.0 | 60.0 | 630.0 | ||||||||||||||
| Senior Notes due 2028(2) | 817.2 | 25.9 | 51.0 | 51.0 | 689.3 | ||||||||||||||
| Operating leases(3) | 277.3 | 32.2 | 50.9 | 37.6 | 156.6 | ||||||||||||||
| Total | $ | 4,506.9 | $ | 196.8 | $ | 467.8 | $ | 916.1 | $ | 2,926.2 |
| (1) | Includes future principal and cash interest payments on long-term borrowings through scheduled maturity dates. Interest payments for variable rate debt were calculated using interest rates as of December 31, 2019. Excluded from these amounts are the amortization of debt issuance and other costs related to indebtedness. |
| (2) | Includes future principal and cash interest payments on long-term borrowings through scheduled maturity dates. Interest on the Senior Notes is calculated using the stated interest rates. Excluded from these amounts are the amortization of debt issuance and other costs related to indebtedness. |
| (3) | For additional information, see Note 11 (Leases) to the accompanying Consolidated Financial Statements. |
Off-Balance Sheet Arrangements
We have no off-balance sheet arrangements that have or are reasonably likely to have a material current or future effect on our financial condition, changes in financial condition, revenues or expenses, results of operations, liquidity, capital expenditures or capital resources.
Inflation
Inflation has not had a material impact on our operating results. We generally have been able to pass along price increases to our customers, though certain economic factors and technological advances in recent years have tended to place downward pressure on pricing. We also have been able to generally offset the effects of inflation on operating costs by continuing to emphasize productivity improvements. There can be no assurances, however, that inflation would not have a material impact on our sales or operating costs in the future.
Commitments and Contingencies
The information set forth in Note 16 (Commitments and Contingencies) to the accompanying Consolidated Financial Statements included in Part II, Item 8 of this report is incorporated herein by reference.
Critical Accounting Policies and Estimates
The preparation of the Consolidated Financial Statements in accordance with GAAP requires management to make use of certain estimates and assumptions that affect the reported amounts of assets, liabilities, revenues and expenses, as well as related disclosure of contingent assets and liabilities in the Consolidated Financial Statements and accompanying notes. We base our estimates on historical experience and on various other assumptions that we believe are reasonable under the circumstances. Historically, we have not made significant changes to the methods for determining these estimates as our actual results have not differed materially from our estimates. We do not believe it is reasonably likely that the estimates and related assumptions will change materially in the foreseeable future; however, actual results could differ from those estimates under different assumptions, judgments or conditions. We have reviewed our critical accounting policies with the Audit Committee of our Board of Directors.
Critical accounting policies and estimates are those that are most important to the portrayal of our financial condition and results of operations, and which require us to make our most difficult and subjective judgments, often as a result of the need to make
estimates of matters that are inherently uncertain. Based on this definition, we have identified the critical accounting policies and estimates addressed below. For additional information related to significant accounting policies used in the preparation of our Consolidated Financial Statements, see Note 1 (Description of Business and Summary of Significant Accounting Policies) to the accompanying Consolidated Financial Statements.
Revenue Recognition
We sell some of our products and services as part of bundled contract arrangements containing multiple deliverables, which may include a combination of different products and services. Significant judgment may be required when determining whether products and services are considered distinct performance obligations that should be accounted for separately versus together.
For each deliverable that represents a distinct performance obligation, total arrangement consideration is allocated based upon the standalone selling prices of each performance obligation. Judgment is required to determine the standalone selling price for each distinct performance obligation. For certain performance obligations, we will use a combination of methods to estimate the standalone selling price based on recent transactions. When evidence from recent transactions is not available to confirm that the prices are representative of the standalone selling price, an expected cost plus margin approach is used.
Additional judgment is required in determining whether we are the principal, and report revenues on a gross basis, or agent, and report revenues on a net basis. For each identified performance obligation in a transaction, we evaluate the facts and circumstances present to determine whether or not we control the specified good or service prior to transfer to the customer. This evaluation includes, but is not limited to, assessing indicators such as whether: (i) we are primarily responsible for fulfilling the promise to provide the specified goods or service, (ii) we have inventory risk before the specified good or service has been transferred to a customer and (iii) we have discretion in establishing the price for the specified good or service. When the evaluation indicates we control the specified good or service prior to transfer to the customer, we are acting as a principal. When the evaluation indicates we do not control the specified good or service prior transfer to the customer, we are acting as an agent.
The nature of our contracts give rise to variable consideration in the form of sales returns and allowances. We estimate variable consideration at the most likely amount to which we are expected to be entitled. The estimates of variable consideration and determination of whether to include estimated amounts in the transaction price are based on an assessment of our anticipated performance and all information that is reasonably available.
We recognize revenue on performance obligations when the customer obtains control over the specified good or service. That is, when the customer has the ability to direct the use of and obtain substantially all of the benefits from the good or service. For the sale of hardware and software, this is generally upon delivery to the customer. As a result, we perform an analysis to estimate the amount of Net sales in-transit at the end of the period and adjust revenue and the related costs to reflect only what has been delivered to the customer. This analysis requires judgment whereby we perform an analysis of the estimated number of days of sales in-transit to customers at the end of each reporting period based on a weighted-average analysis of commercial delivery terms that include drop-shipment arrangements. Changes in delivery patterns may result in a different number of business days estimated to make this adjustment.
Vendor Programs
We receive incentives from certain vendors related to cooperative advertising, volume rebates, bid programs, price protection and other programs. These incentives generally relate to written agreements with specified performance requirements with the vendors and are recorded as adjustments to Cost of sales or Merchandise inventory, depending on the nature of the incentive. We record vendor partner receivables related to these programs when the amounts are probable and reasonably estimable. Some programs are based on the achievement of specific targets, and we base our estimates on information provided by our vendors and internal information to assess our progress toward achieving those targets.
We also record reserves for vendor partner receivables for estimated losses due to vendors' inability to pay or rejections by vendors of claims. In estimating the required allowance, we take into consideration collections performance and the aging of the incentive receivables, as well as specific vendor circumstances.
Goodwill
Goodwill is allocated to reporting units expected to benefit from the business combination. Goodwill is not amortized but is subject to periodic testing for impairment at the reporting unit level on an annual basis each December 1, or more frequently if events or changes in circumstances indicate that the asset may be impaired. These events or circumstances could include a significant change in the business climate, legal factors, operating performance indicators, competition or sale or disposition of a significant portion of a reporting unit.
We may elect to utilize a qualitative assessment to determine whether it is more likely than not that the fair value of a reporting unit is less than its carrying value. As part of our qualitative assessment, judgment is required in weighing the effect of various positive and negative factors that may affect the fair value. We consider various factors, including the excess of fair value over carrying value from the last quantitative test, macroeconomic conditions, industry and market considerations, the projected financial performance and actual financial performance compared to prior year projected financial performance, as well as other factors.
If we elect to bypass the qualitative assessment, or if indicators of impairment exist, a quantitative impairment test is performed. As part of the quantitative assessment, application of the goodwill impairment test requires judgment, including the identification of reporting units, assignment of assets and liabilities to reporting units, assignment of goodwill to reporting units, and determination of the fair value of each reporting unit. Fair value of a reporting unit is determined by using a weighted combination of an income approach and a market approach, as this combination is considered the most indicative of our fair value in an orderly transaction between market participants. This analysis requires significant judgments, including estimation of future cash flows, which is dependent on internal forecasts, estimation of the long-term rate of growth for our business, estimation of the useful life over which cash flows will occur, determination of our weighted average cost of capital, future market conditions and profitability of future business strategies. The estimates used to calculate the fair value of a reporting unit change from year to year based on operating results, market conditions and other factors. Changes in these estimates and assumptions could materially affect the determination of fair value and goodwill impairment for each reporting unit. However, our past estimates of fair value would not have indicated an impairment when revised to include subsequent years' actual results.
Intangible Assets
Intangible assets include customer relationships, trade names, internally developed software and other intangibles. Intangible assets are amortized on a straight-line basis over the estimated useful life of the asset and reviewed for impairment when events or changes in circumstances indicate that the carrying amount of such assets may not be recoverable. The valuation and classification of these assets and the assignment of useful lives involve significant judgment and the use of estimates. The valuation, classification and assignment of useful lives are derived using market inputs, historic experience and third-party guidance.
Income Taxes
The determination of our provision for income taxes and evaluating our tax positions requires significant judgment, the use of estimates and the interpretation and application of complex tax laws. Our provision for income taxes primarily reflects a combination of income earned and taxed in the various US federal and state, as well as foreign, jurisdictions. Our annual effective tax rate is based on our income, the jurisdiction(s) in which the income is earned and subjected to taxation, the tax laws in those various jurisdictions which can be affected by tax law changes, increases or decreases in permanent differences between book and tax items, and accruals or adjustments of accruals for unrecognized tax benefits or valuation allowances.
We establish reserves to remove some or all of the tax benefit of any of our tax positions at the time we determine that the position becomes uncertain based upon one of the following: (1) the tax position is not more likely than not to be sustained, (2) the tax position is more likely than not to be sustained, but for a lesser amount, or (3) the tax position is more likely than not to be sustained, but not in the financial period in which the tax position was originally taken. Reserves related to tax accruals and valuations allowances related to deferred tax assets can be impacted by changes in tax law in the relevant jurisdiction(s) and our future taxable income levels in the relevant jurisdiction(s) with respect to valuation allowances.
Recent Accounting Pronouncements
The information set forth in Note 2 (Recent Accounting Pronouncements) to the accompanying Consolidated Financial Statements included in Part II, Item 8 of this report is incorporated herein by reference.
Item 7A. Quantitative and Qualitative Disclosures of Market Risks
Interest Rate Risk
Our market risks relate primarily to changes in interest rates. The interest rates on borrowings under our senior secured asset-based revolving credit facility, our senior secured term loan facility and the CDW UK term loan are floating and, therefore, are subject to fluctuations. In order to manage the risk associated with changes in interest rates on borrowings under our senior secured term loan facility, we have entered into interest rate caps to add stability to interest expense and to manage our exposure to interest rate fluctuations.
As of December 31, 2019, we have interest rate cap agreements in effect with a combined notional amount of $1.4 billion. For additional information, see Note 8 (Financial Instruments) to the accompanying Consolidated Financial Statements.
See "Management's Discussion and Analysis of Financial Condition and Results of Operations - Liquidity and Capital Resources - Contractual Obligations" for information on cash flows, interest rates and maturity dates of our debt obligations.
Foreign Currency Risk
We transact business in foreign currencies other than the US dollar, primarily the British pound and the Canadian dollar, which exposes us to foreign currency exchange rate fluctuations. Revenue and expenses generated from our international operations are generally denominated in the local currencies of the corresponding countries. The functional currency of our international operating subsidiaries is the same as the corresponding local currency. Upon consolidation, as results of operations are translated, operating results may differ from expectations. The direct effect of foreign currency fluctuations on our results of operations has not been material as the majority of our results of operations are denominated in US dollars.
Item 8. Financial Statements and Supplementary Data
Index to Consolidated Financial Statements
Report of Independent Registered Public Accounting Firm
To the Stockholders and the Board of Directors of CDW Corporation and subsidiaries
Opinion on the Financial Statements
We have audited the accompanying consolidated balance sheets of CDW Corporation and subsidiaries (the Company) as of December 31, 2019 and 2018, the related consolidated statements of operations, comprehensive income, stockholders' equity, and cash flows for each of the three years in the period ended December 31, 2019, and the related notes and financial statement schedule listed in the Index at Item 15(a) (2) (collectively referred to as the “consolidated financial statements“). In our opinion, the consolidated financial statements present fairly, in all material respects, the financial position of the Company as of December 31, 2019 and 2018, and the results of its operations and its cash flows for each of the three years in the period ended December 31, 2019, in conformity with US generally accepted accounting principles.
We also have audited, in accordance with the standards of the Public Company Accounting Oversight Board (United States) (PCAOB), the Company's internal control over financial reporting as of December 31, 2019, based on criteria established in Internal Control-Integrated Framework issued by the Committee of Sponsoring Organizations of the Treadway Commission (2013 framework) and our report dated February 28, 2020 expressed an unqualified opinion thereon.
Basis for Opinion
These financial statements are the responsibility of the Company's management. Our responsibility is to express an opinion on the Company's financial statements based on our audits. We are a public accounting firm registered with the PCAOB and are required to be independent with respect to the Company in accordance with the U.S. federal securities laws and the applicable rules and regulations of the Securities and Exchange Commission and the PCAOB.
We conducted our audits in accordance with the standards of the PCAOB. Those standards require that we plan and perform the audit to obtain reasonable assurance about whether the financial statements are free of material misstatement, whether due to error or fraud. Our audits included performing procedures to assess the risks of material misstatement of the financial statements, whether due to error or fraud, and performing procedures that respond to those risks. Such procedures included examining, on a test basis, evidence regarding the amounts and disclosures in the financial statements. Our audits also included evaluating the accounting principles used and significant estimates made by management, as well as evaluating the overall presentation of the financial statements. We believe that our audits provide a reasonable basis for our opinion.
Critical Audit Matters
The critical audit matter communicated below is a matter arising from the current period audit of the financial statements that was communicated or required to be communicated to the audit committee and that: (1) relates to accounts or disclosures that are material to the financial statements and (2) involved our especially challenging, subjective or complex judgments. The communication of the critical audit matter does not alter in any way our opinion on the consolidated financial statements, taken as a whole, and we are not, by communicating the critical audit matter below providing a separate opinion on the critical audit matter or on the accounts or disclosures to which it relates.
| Revenue recognition | |
| Description of the Matter | As described in Note 1 to the consolidated financial statements, the Company recognizes revenue upon transfer of control of promised products or services to customers. The Company applies judgment in determining whether it is the principal and reports revenue on a gross basis, or agent and reports revenue on a net basis. The Company also sells some of its products and services as part of bundled contract arrangements containing multiple performance obligations. Significant judgment may be required when determining whether products and services are considered distinct performance obligations that should be accounted for separately versus together. For each distinct performance obligation, judgment is required to determine the relative standalone selling price to allocate the transaction price, such as using an expected cost plus margin approach. Auditing the Company's contracts with customers was challenging given the significant audit effort required to analyze the Company's various products, services and contract arrangements. For example, certain customer contracts contain multiple parties and there can be subjective judgment in assessing the Company's role as principal or agent in the contract arrangement. For certain other customer contracts, there can be judgment in the identification of the distinct performance obligations along with the determination of the associated relative standalone selling prices. |
| How We Addressed the Matter in Our Audit | We obtained an understanding of the revenue process, evaluated the design and tested the operating effectiveness of the Company's internal controls over the relevant terms of the customer contracts, including the determination of principal versus agent, the identification of distinct performance obligations and the determination of the relative standalone selling price for separate performance obligations. To test revenue recognition, our audit procedures included among others, examination of executed customer contracts for a sample of sales transactions, and evaluating the Company's determination of principal versus agent, identifying products and services in the contract and assessing separate distinct performance obligations. To test management's determination of relative standalone selling price for separate performance obligations, we performed audit procedures that included, among others, assessing the appropriateness of the methodology applied, testing the mathematical accuracy of the underlying data and calculations and inspecting the underlying data information on a sample basis. |
| /s/ Ernst & Young LLP |
| We have served as the Company's auditor since 2011. |
| Chicago, Illinois |
| February 28, 2020 |
| CDW CORPORATION AND SUBSIDIARIES CONSOLIDATED BALANCE SHEETS (dollars in millions, except per share amounts) | |||||||
|---|---|---|---|---|---|---|---|
| December 31, | |||||||
| 2019 | 2018 | ||||||
| Assets | |||||||
| Current assets: | |||||||
| Cash and cash equiva |
Showing the first 8K of 166K characters. Open the full section
Item 9. Changes in and Disagreements with Accountants on Accounting and Financial Disclosure
None.
Item 9A. Controls and Procedures
Evaluation of Disclosure Controls and Procedures
The Company's management, with the participation of the Company's Chief Executive Officer and Chief Financial Officer, has evaluated the effectiveness of the Company's disclosure controls and procedures (as such term is defined in Rule 13a-15(e) or Rule 15d-15(e) under the Securities Exchange Act of 1934, as amended (the "Exchange Act")) as of the end of the period covered by this report. Based on such evaluation, the Company's management, including the Company's Chief Executive Officer and Chief Financial Officer, has concluded that, as of the end of such period, the Company's disclosure controls and procedures were effective in recording, processing, summarizing, and reporting, on a timely basis, information required to be disclosed by the Company in the reports that it files or submits under the Exchange Act, and that information is accumulated and communicated to the Company's management, including the Company's Chief Executive Officer and Chief Financial Officer, as appropriate to allow timely discussions regarding required disclosure.
Management's Annual Report on Internal Control over Financial Reporting
Management is responsible for establishing and maintaining adequate internal control over financial reporting, as defined in Rule 13a-15(f) and 15d-15(f) under the Exchange Act. Because of its inherent limitations, internal control over financial reporting may not prevent or detect misstatements and can provide only reasonable assurance with respect to financial statement preparation and presentation. Also, projections of any evaluation of effectiveness to future periods are subject to the risk that controls may become inadequate because of changes in conditions, or that the degree of compliance with policies or procedures may deteriorate.
Management assessed the effectiveness of the Company's internal control over financial reporting as of December 31, 2019. Management based this assessment on the criteria set forth by the Committee of Sponsoring Organizations of the Treadway Commission (COSO) in "Internal Control — Integrated Framework (2013 framework)."
Based on its assessment, management concluded that, as of December 31, 2019, the Company's internal control over financial reporting is effective.
Ernst & Young LLP, independent registered public accounting firm, has audited the Consolidated Financial Statements of the Company and the Company's internal control over financial reporting and has included their reports herein.
Changes in Internal Control over Financial Reporting
There have been no changes in our internal control over financial reporting during the quarter ended December 31, 2019 that have materially affected or are reasonably likely to materially affect, our internal control over financial reporting.
Report of Independent Registered Public Accounting Firm
To the Stockholders and the Board of Directors of CDW Corporation and subsidiaries
Opinion on Internal Control over Financial Reporting
We have audited CDW Corporation and subsidiaries' internal control over financial reporting as of December 31, 2019, based on criteria established in Internal Control-Integrated Framework issued by the Committee of Sponsoring Organizations of the Treadway Commission (2013 framework) (the COSO criteria). In our opinion, CDW Corporation and subsidiaries (the Company) maintained, in all material respects, effective internal control over financial reporting as of December 31, 2019, based on the COSO criteria.
We also have audited, in accordance with the standards of the Public Company Accounting Oversight Board (United States) (PCAOB), the consolidated balance sheets of the Company as of December 31, 2019 and 2018, and the related consolidated statements of operations, comprehensive income, stockholders' equity and cash flows for each of the three years in the period ended December 31, 2019, and the related notes and the financial statement schedule listed in the Index at Item 15 (a) (2) and our report dated February 28, 2020 expressed an unqualified opinion thereon.
Basis for Opinion
The Company's management is responsible for maintaining effective internal control over financial reporting and for its assessment of the effectiveness of internal control over financial reporting included in the accompanying Management's Annual Report on Internal Control Over Financial Reporting. Our responsibility is to express an opinion on the Company's internal control over financial reporting based on our audit. We are a public accounting firm registered with the PCAOB and are required to be independent with respect to the Company in accordance with the U.S. federal securities laws and the applicable rules and regulations of the Securities and Exchange Commission and the PCAOB.
We conducted our audit in accordance with the standards of the PCAOB. Those standards require that we plan and perform the audit to obtain reasonable assurance about whether effective internal control over financial reporting was maintained in all material respects.
Our audit included obtaining an understanding of internal control over financial reporting, assessing the risk that a material weakness exists, testing and evaluating the design and operating effectiveness of internal control based on the assessed risk, and performing such other procedures as we considered necessary in the circumstances. We believe that our audit provides a reasonable basis for our opinion.
Definition and Limitations of Internal Control Over Financial Reporting
A company's internal control over financial reporting is a process designed to provide reasonable assurance regarding the reliability of financial reporting and the preparation of financial statements for external purposes in accordance with generally accepted accounting principles. A company's internal control over financial reporting includes those policies and procedures that (1) pertain to the maintenance of records that, in reasonable detail, accurately and fairly reflect the transactions and dispositions of the assets of the company; (2) provide reasonable assurance that transactions are recorded as necessary to permit preparation of financial statements in accordance with generally accepted accounting principles, and that receipts and expenditures of the company are being made only in accordance with authorizations of management and directors of the company; and (3) provide reasonable assurance regarding prevention or timely detection of unauthorized acquisition, use, or disposition of the company's assets that could have a material effect on the financial statements.
Because of its inherent limitations, internal control over financial reporting may not prevent or detect misstatements. Also, projections of any evaluation of effectiveness to future periods are subject to the risk that controls may become inadequate because of changes in conditions, or that the degree of compliance with the policies or procedures may deteriorate.
| /s/ Ernst & Young LLP |
| Chicago, Illinois |
| February 28, 2020 |
Item 9B. Other Information
None.
PART III
Item 10. Directors, Executive Officers and Corporate Governance
We have adopted The CDW Way Code, our code of business conduct and ethics, that is applicable to all of our coworkers and directors. A copy of The CDW Way Code is available on our website at www.cdw.com. Within The CDW Way Code is a Financial Integrity Code of Ethics that sets forth an even higher standard applicable to our executives, officers, members of our internal disclosure committee and all managers and above in our finance department. We intend to disclose any substantive amendments to, or waivers from, The CDW Way Code by posting such information on our website or by filing a Form 8-K, in each case to the extent such disclosure is required by the rules of the SEC or Nasdaq.
See Part I - "Information about our Executive Officers" for the biographical information of our executive officers, which is incorporated by reference in this Item 10. Other information required under this Item 10 is incorporated herein by reference to our definitive proxy statement for our 2020 annual meeting of stockholders on May 21, 2020 ("2020 Proxy Statement"), which we will file with the SEC on or before April 29, 2020.
Item 11. Executive Compensation
Information required under this Item 11 is incorporated herein by reference to the 2020 Proxy Statement.
Item 12. Security Ownership of Certain Beneficial Owners and Management and Related Stockholder Matters
Information required under this Item 12 is incorporated herein by reference to the 2020 Proxy Statement.
Item 13. Certain Relationships and Related Transactions, and Director Independence
Information required under this Item 13 is incorporated herein by reference to the 2020 Proxy Statement.
Item 14. Principal Accountant Fees and Services
Information required under this Item 14 is incorporated herein by reference to the 2020 Proxy Statement.
PART IV
Item 15. Exhibits and Financial Statement Schedules
| (a) | Financial Statements and Schedules |
The following documents are filed as part of this report:
| (1) | Consolidated Financial Statements: |
| (2) | Financial Statement Schedules: |
| Page | |
| Schedule II – Valuation and Qualifying Accounts | 87 |
All other schedules are omitted since the required information is not present or is not present in amounts sufficient to require submission of the schedule, or because the information required is included in the Consolidated Financial Statements or notes thereto.
| (b) | Exhibits |
| * | Filed herewith |
| ** | These items are furnished and not filed. |
| § | A management contract or compensatory arrangement required to be filed as an exhibit pursuant to Item 601 of Regulation S-K. |
Item 16. Form 10-K Summary
None.
SIGNATURES
Pursuant to the requirements of Section 13 or 15(d) of the Securities Exchange Act of 1934, the registrant has duly caused this report to be signed on its behalf by the undersigned, thereunto duly authorized.
| CDW CORPORATION | ||||
| Date: | February 28, 2020 | By: | /s/ Christine A. Leahy | |
| Christine A. Leahy | ||||
| President and Chief Executive Officer |
Pursuant to the requirements of the Securities Exchange Act of 1934, this report has been signed below by the following persons on behalf of the registrant and in the capacities and on the dates indicated.
| Signature | Title | Date | ||
| /s/ Christine A. Leahy | President and Chief Executive Officer (principal executive officer) and Director | February 28, 2020 | ||
| Christine A. Leahy | ||||
| /s/ Collin B. Kebo | Senior Vice President and Chief Financial Officer (principal financial officer) | February 28, 2020 | ||
| Collin B. Kebo | ||||
| /s/ Neil B. Fairfield | Vice President, Controller and Chief Accounting Officer (principal accounting officer) | February 28, 2020 | ||
| Neil B. Fairfield | ||||
| /s/ David W. Nelms | Non-Executive Chairman of the Board | February 28, 2020 | ||
| David W. Nelms | ||||
| /s/ Virginia C. Addicott | Director | February 28, 2020 | ||
| Virginia C. Addicott | ||||
| /s/ Steven W. Alesio | Director | February 28, 2020 | ||
| Steven W. Alesio | ||||
| /s/ Barry K. Allen | Director | February 28, 2020 | ||
| Barry K. Allen | ||||
| /s/ James A. Bell | Director | February 28, 2020 | ||
| James A. Bell | ||||
| /s/ Benjamin D. Chereskin | Director | February 28, 2020 | ||
| Benjamin D. Chereskin | ||||
| /s/ Lynda M. Clarizio | Director | February 28, 2020 | ||
| Lynda M. Clarizio | ||||
| /s/ Paul J. Finnegan | Director | February 28, 2020 | ||
| Paul J. Finnegan | ||||
| /s/ Joseph R. Swedish | Director | February 28, 2020 | ||
| Joseph R. Swedish | ||||
| /s/ Donna F. Zarcone | Director | February 28, 2020 | ||
| Donna F. Zarcone |